Chapter 9 - ghriga.com · • Document the distribution of processes to locations. ... Differences...
64
McGraw-Hill/Irwin Copyright © 2007 by The McGraw-Hill Companies, Inc. All rights reserved. Chapter 9 Process Modeling
Transcript of Chapter 9 - ghriga.com · • Document the distribution of processes to locations. ... Differences...
McGraw-Hill/Irwin Copyright © 2007 by The McGraw-Hill Companies, Inc. All rights reserved.
Chapter 9
Process Modeling
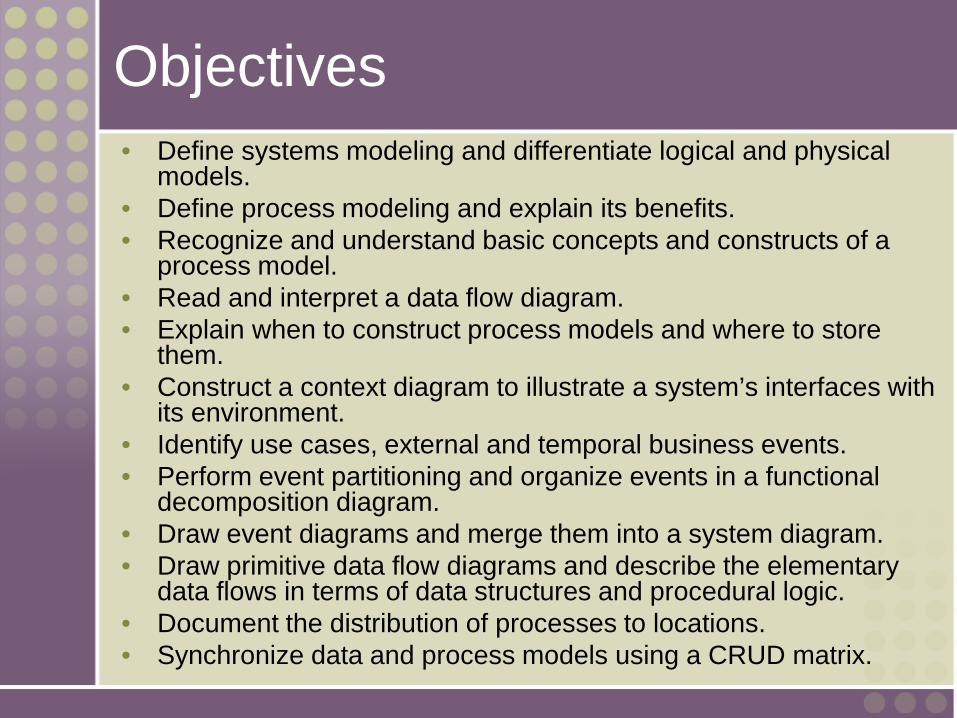
Objectives • Define systems modeling and differentiate logical and physical
models. • Define process modeling and explain its benefits. • Recognize and understand basic concepts and constructs of a
process model. • Read and interpret a data flow diagram. • Explain when to construct process models and where to store
them. • Construct a context diagram to illustrate a system’s interfaces with
its environment. • Identify use cases, external and temporal business events. • Perform event partitioning and organize events in a functional
decomposition diagram. • Draw event diagrams and merge them into a system diagram. • Draw primitive data flow diagrams and describe the elementary
data flows in terms of data structures and procedural logic. • Document the distribution of processes to locations. • Synchronize data and process models using a CRUD matrix.
9-3
9-4
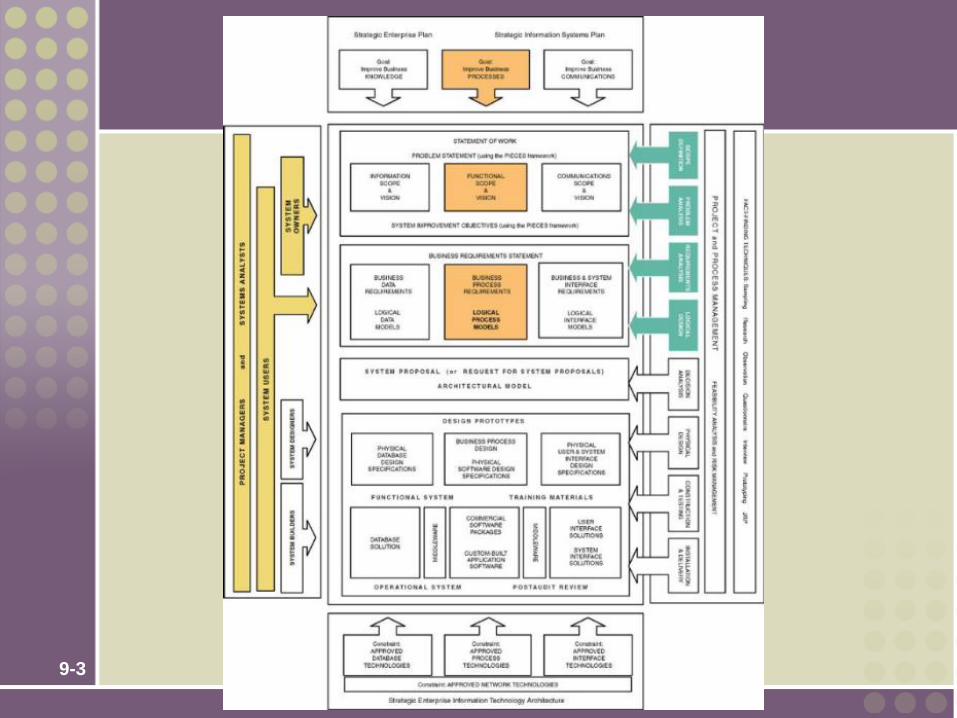
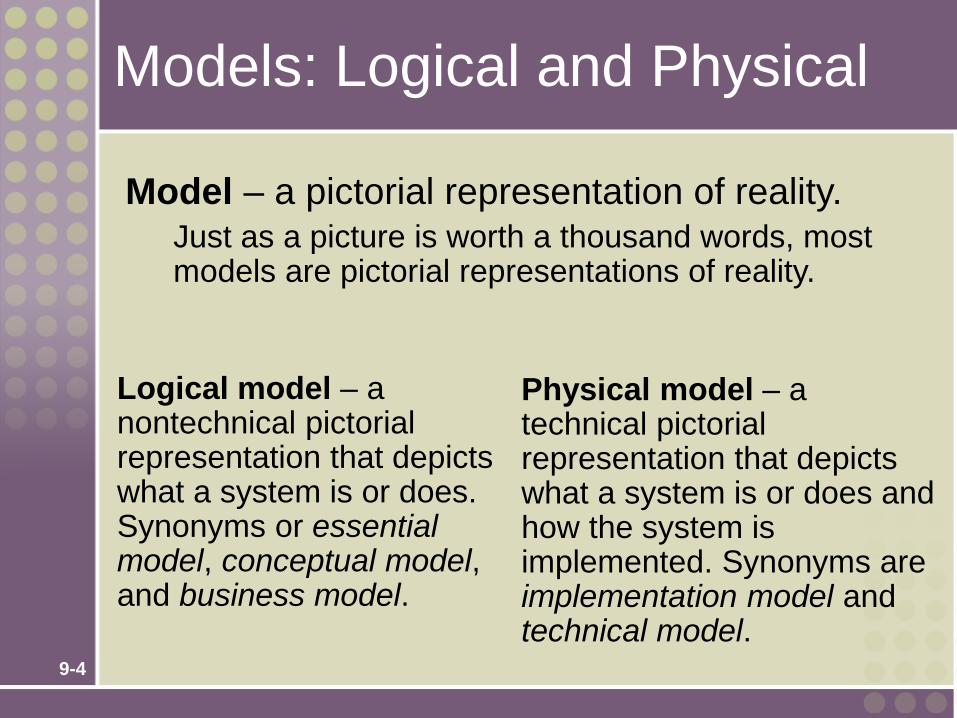
Models: Logical and Physical
Logical model – a nontechnical pictorial representation that depicts what a system is or does. Synonyms or essential model, conceptual model, and business model.
Physical model – a technical pictorial representation that depicts what a system is or does and how the system is implemented. Synonyms are implementation model and technical model.
Model – a pictorial representation of reality. Just as a picture is worth a thousand words, most models are pictorial representations of reality.

9-5
Why Logical System Models
• Logical models remove biases that are the result of the way the system is currently implemented, or the way that any one person thinks the system might be implemented.
• Logical models reduce the risk of missing business requirements because we are too preoccupied with technical results.
• Logical models allow us to communicate with end-users in nontechnical or less technical languages.

9-6
Process Modeling and DFDs
Process modeling – a technique used to organize and document a system’s processes.
• Flow of data through processes • Logic • Policies • Procedures
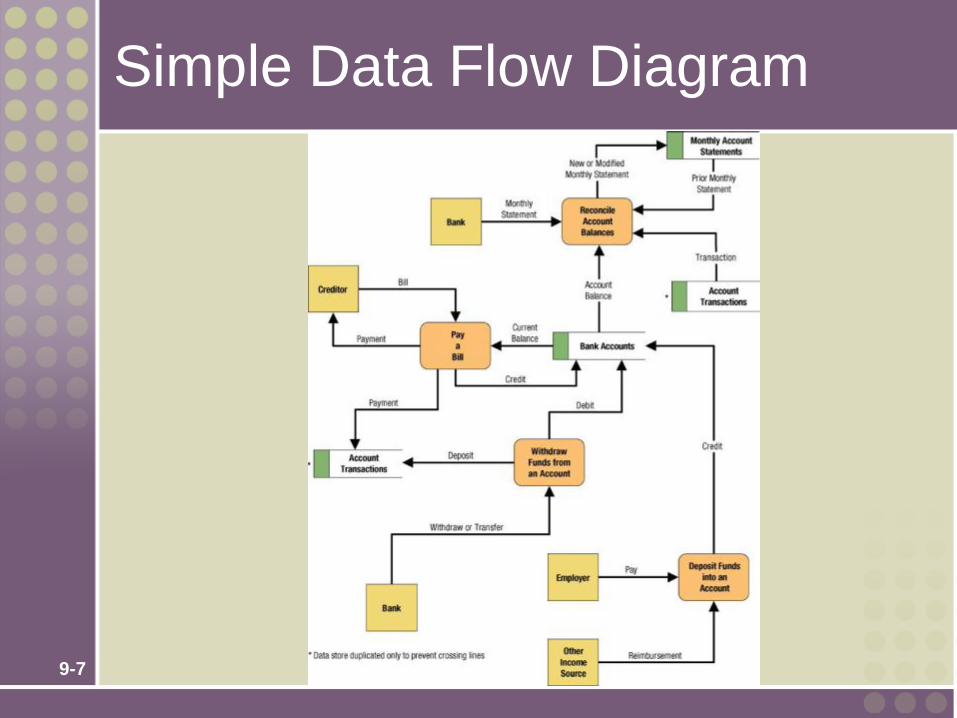
Data flow diagram (DFD) – a process model used to depict the flow of data through a system and the work or processing performed by the system. Synonyms are bubble chart, transformation graph, and process model.
• The DFD has also become a popular tool for business process redesign.
9-7
Simple Data Flow Diagram
9-8
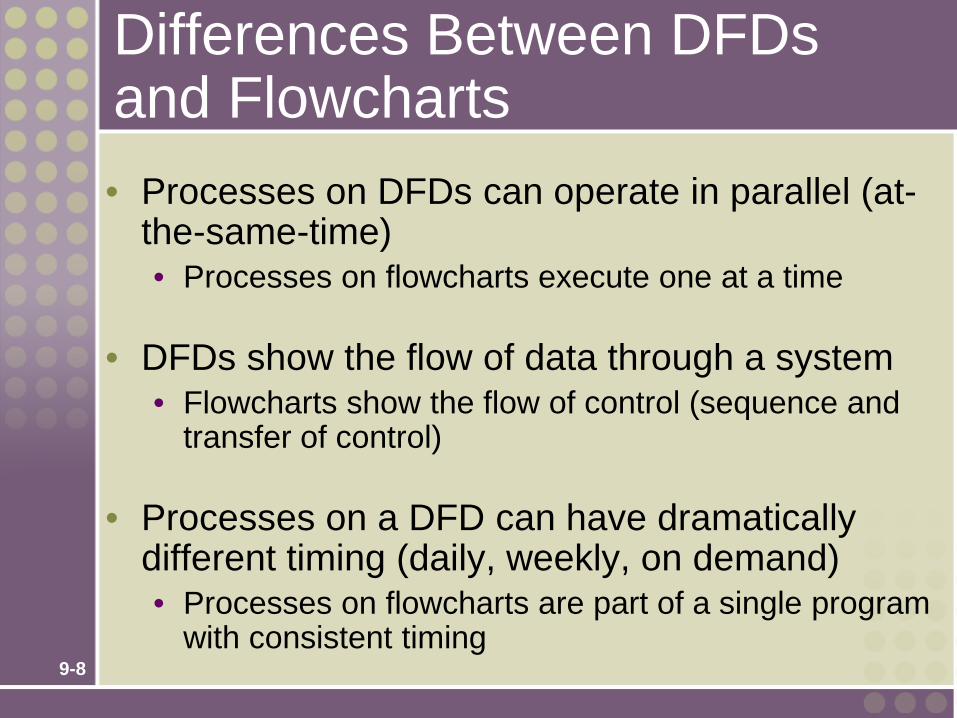
Differences Between DFDs and Flowcharts • Processes on DFDs can operate in parallel (at-
the-same-time) • Processes on flowcharts execute one at a time
• DFDs show the flow of data through a system
• Flowcharts show the flow of control (sequence and transfer of control)
• Processes on a DFD can have dramatically different timing (daily, weekly, on demand) • Processes on flowcharts are part of a single program
with consistent timing

9-9
External Agents External agent – an outside person, unit,
system, or organization that interacts with a system. Also called an external entity. • External agents define the “boundary” or
scope of a system being modeled. • As scope changes, external agents can
become processes, and vice versa. • Almost always one of the following:
• Office, department, division. • An external organization or agency. • Another business or another
information system. • One of system’s end-users or managers
• Named with descriptive, singular noun
Gane and Sarson shape
DeMarco/Yourdon shape

9-10
Data Stores Data store – stored data intended for later
use. Synonyms are file and database. • Frequently implemented as a file or database. • A data store is “data at rest” compared to a data
flow that is “data in motion.” • Almost always one of the following:
• Persons (or groups of persons) • Places • Objects • Events (about which data is captured) • Concepts (about which data is important)
• Data stores depicted on a DFD store all instances of data entities (depicted on an ERD)
• Named with plural noun
Gane and Sarson shape
DeMarco/Yourdon shape
9-11
Process Concepts
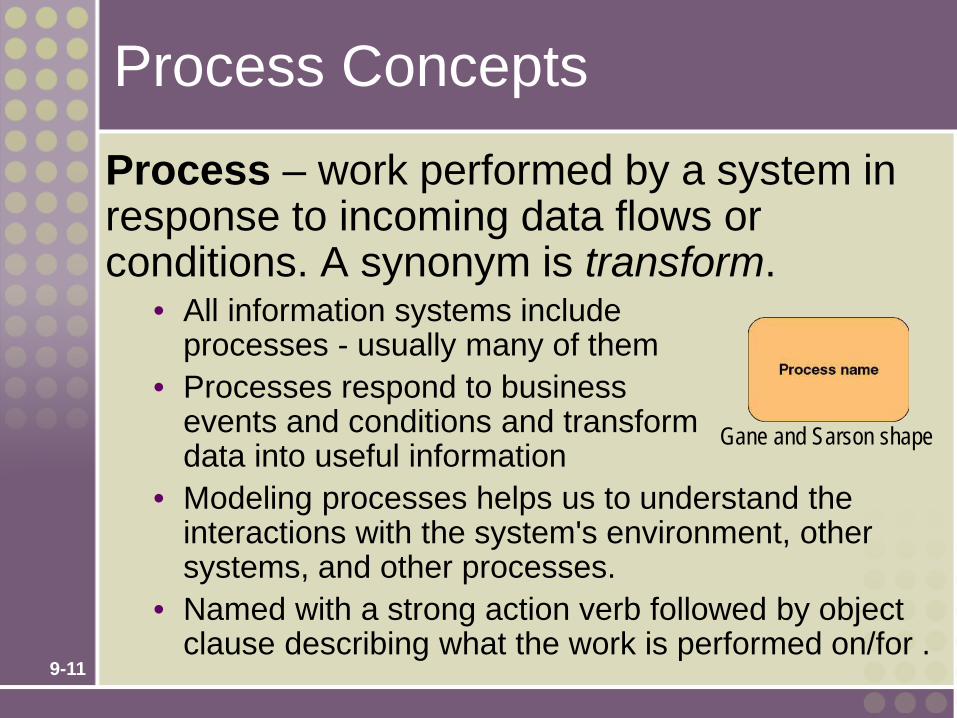
Process – work performed by a system in response to incoming data flows or conditions. A synonym is transform.
• All information systems include processes - usually many of them
• Processes respond to business events and conditions and transform data into useful information
• Modeling processes helps us to understand the interactions with the system's environment, other systems, and other processes.
• Named with a strong action verb followed by object clause describing what the work is performed on/for .
Gane and Sarson shape

9-12
The System is Itself a Process
9-13
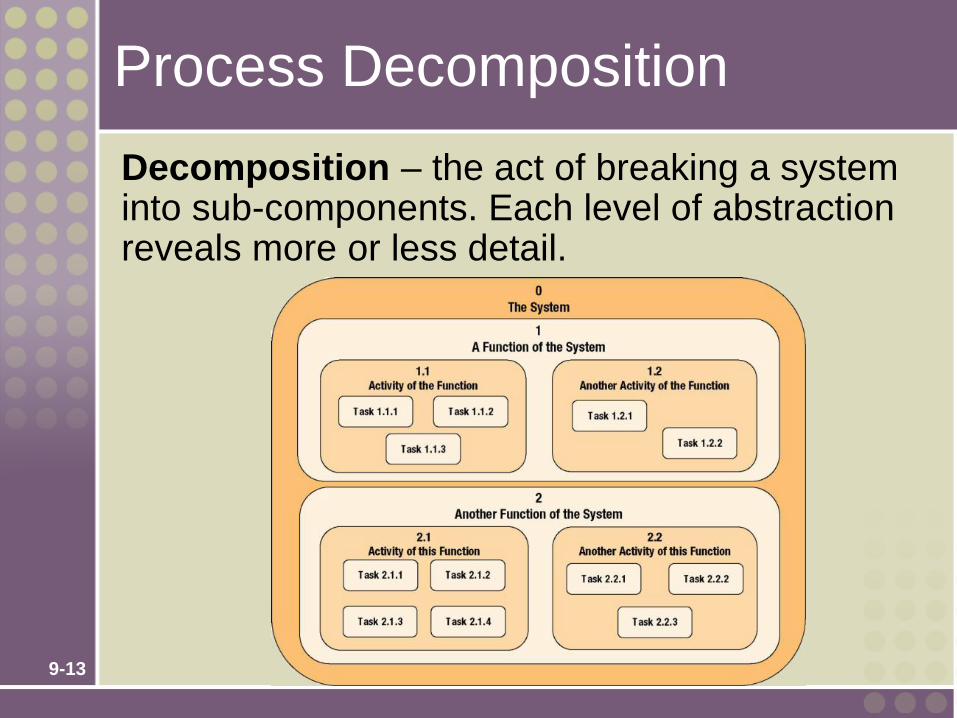
Process Decomposition Decomposition – the act of breaking a system into sub-components. Each level of abstraction reveals more or less detail.
9-14
Decomposition Diagrams
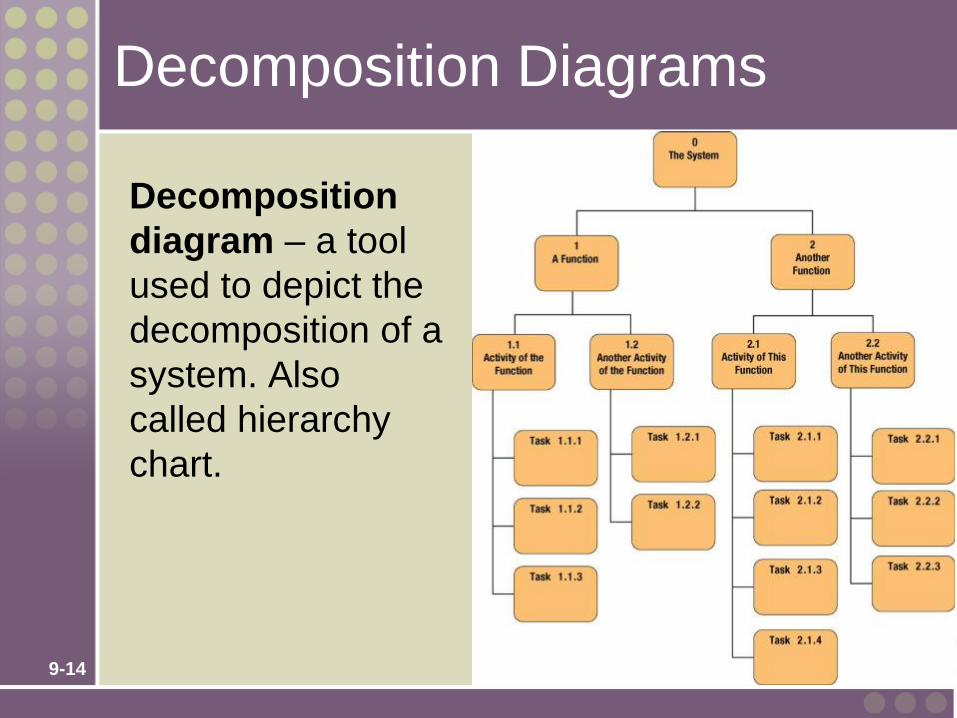
Decomposition diagram – a tool used to depict the decomposition of a system. Also called hierarchy chart.

9-15
Types of Logical Processes
Function – a set of related and ongoing activities of a business. • A function has no start or end.
Event – a logical unit of work that must be completed as a whole. Sometimes called a transaction. • Triggered by a discrete input and is completed when process
has responded with appropriate outputs. • Functions consist of processes that respond to events.
Elementary process – a discrete, detailed activity or
task required to complete the response to an event. Also called a primitive process. • The lowest level of detail depicted in a process model.

9-16
Common Process Errors on DFDs

9-17
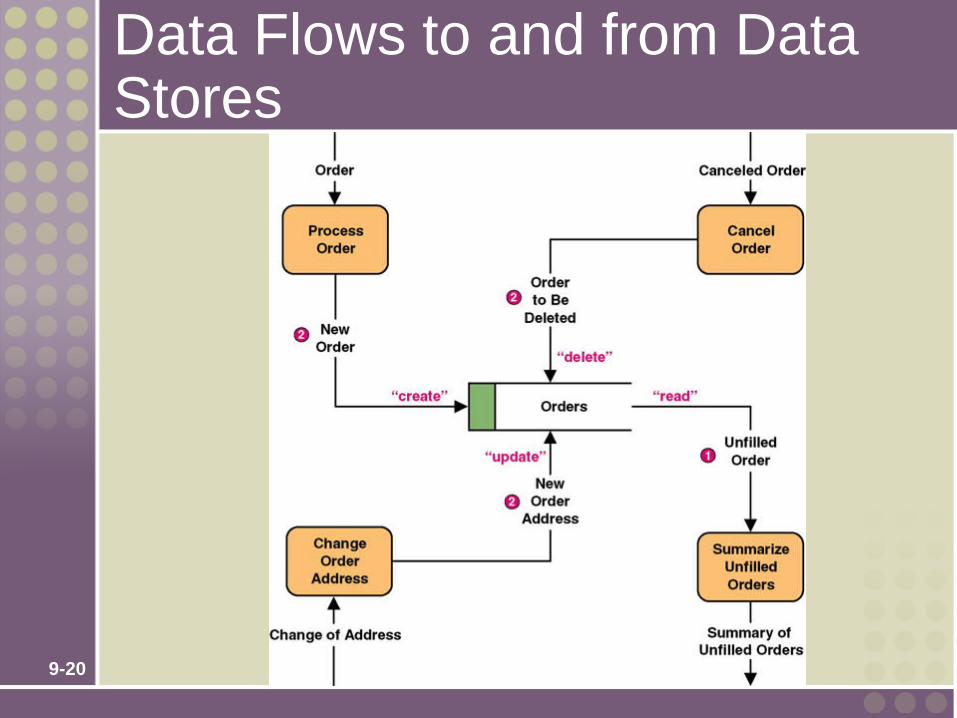
Data flow – data that is input to or output from a process. • A data flow is data in motion • A data flow may also be used to
represent the creation, reading, deletion, or updating of data in a file or database (called a data store).
Composite data flow – a data flow that consists of other data flows.
Control flow – a condition or nondata event that triggers a process. • Used sparingly on DFDs.
Data Flows & Control Flows
Data flow name
Control flow name
9-18
Data Flow Packet Concept
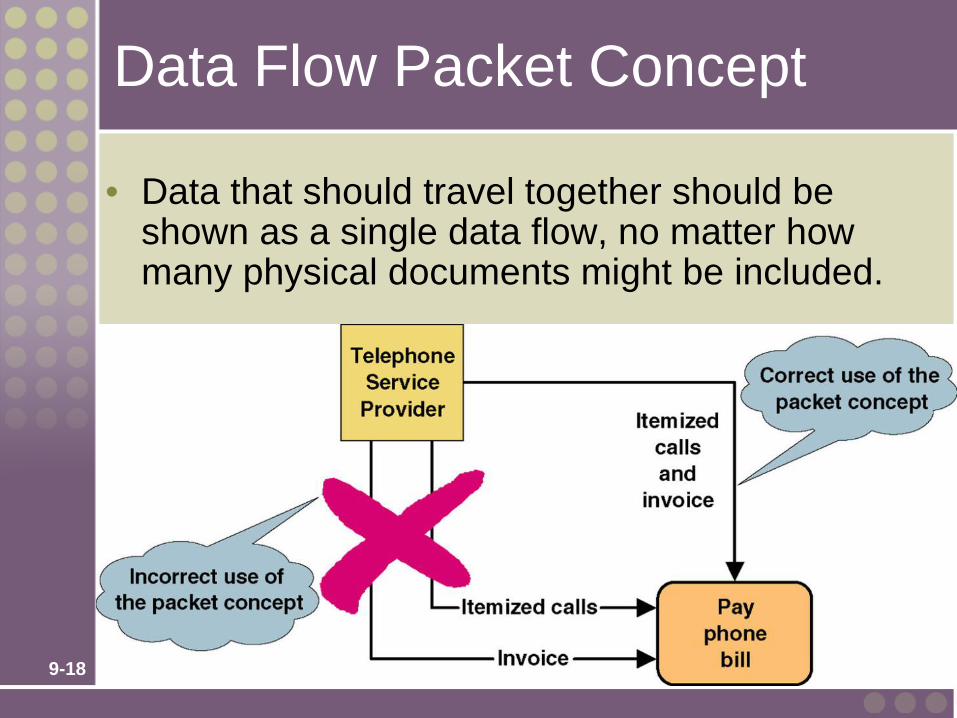
• Data that should travel together should be shown as a single data flow, no matter how many physical documents might be included.

9-19
Composite and Elementary Data Flows
Junction indicates that any given order is an
instance of only one of the order types.
Elementary flows
Composite flow
9-20
Data Flows to and from Data Stores
9-21
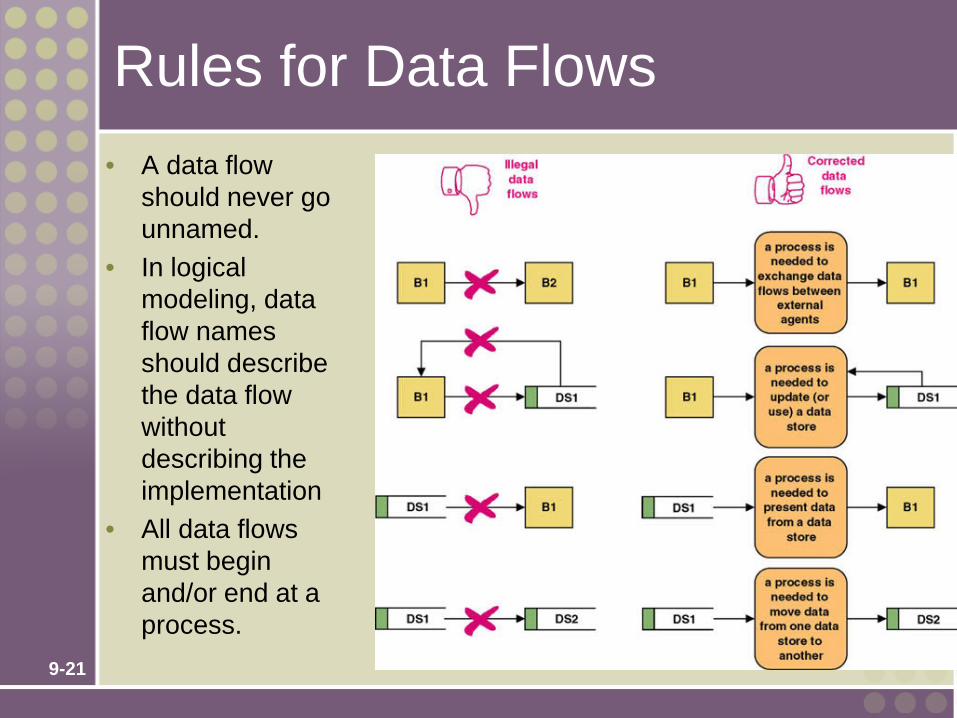
Rules for Data Flows • A data flow
should never go unnamed.
• In logical modeling, data flow names should describe the data flow without describing the implementation
• All data flows must begin and/or end at a process.

9-22
Data Conservation
Data conservation – the practice of ensuring that a data flow contains only data needed by the receiving process. • Sometimes called starving the processes. • New emphasis on business process
redesign to identify and eliminate inefficiencies.
• Simplifies the interface between those processes.
• Must precisely define the data composition of each data flow, expressed in the form of data structures.
9-23
Data Structures
• The data attributes that comprise a data flow are organized into data structures.
• Data flows can be described in terms of the following types of data structures: • A sequence or group of data attributes that occur one after
another. • The selection of one or more attributes from a set of attributes. • The repetition of one or more attributes.
Data attribute – the smallest piece of data that has meaning to the users and the business. Data structure – a specific arrangement of data attributes that defines an instance of a data flow.

9-24
Data Structure for a Data Flow DATA STRUCTURE
ORDER= ORDER NUMBER + ORDER DATE+ [ PERSONAL CUSTOMER NUMBER, CORPORATE ACCOUNT
NUMBER]+ SHIPPING ADDRESS=ADDRESS+ (BILLING ADDRESS=ADDRESS)+ 1 {PRODUCT NUMBER+ PRODUCT DESCRIPTION+ QUANTITY ORDERED+ PRODUCT PRICE+ PRODUCT PRICE SOURCE+ EXTENDED PRICE } N+ SUM OF EXTENDED PRICES+ PREPAID AMOUNT+ (CREDIT CARD
NUMBER+EXPIRATION DATE) (QUOTE NUMBER) ADDRESS= (POST OFFICE BOX NUMBER)+ STREET ADDRESS+ CITY+ [STATE, MUNICIPALITY]+ (COUNTRY)+ POSTAL CODE
ENGLISH ENTERPRETATION An instance of ORDER consists of: ORDER NUMBER and ORDER DATE and Either PERSONAL CUSTOMER NUMBER or CORPORATE ACCOUNT
NUMBER and SHIPPING ADDRESS (which is
equivalent to ADDRESS) and optionally: BILLING ADDRESS
(which is equivalent to ADDRESS)
and one or more instances of: PRODUCT NUMBER and PRODUCT DESCRIPTION and QUANTITY ORDERED and PRODUCT PRICE and PRODUCT PRICE SOURCE and EXTENDED PRICE and SUM OF EXTENDED PRICES and PREPAID AMOUNT and optionally: both CREDIT CARD NUMBER
and EXPIRATION DATE An instance of ADDRESS consists of: optionally: POST OFFICE BOX NUMBER
and STREET ADDRESS and CITY and Either STATE or MUNICIPALITY and optionally: COUNTRY and POSTAL CODE

9-25
Data Structure Constructs Data Structure Format by Example
(relevant portion is boldfaced English Interpretation
(relevant portion is boldfaced) Sequence of Attributes - The sequence data structure indicates one or more attributes that may (or must) be included in a data flow.
WAGE AND TAX STATEMENT= TAXPAYER IDENTIFICATION NUMBER+ TAXPAYER NAME+ TAXPAYER ADDRESS+ WAGES, TIPS, AND COMPENSATION+ FEDERAL TAX WITHHELD+…
An instance of WAGE AND TAX STATEMENTS consists of: TAXPAYER IDENTIFICATION NUMBER and TAXPAYER NAME and TAXPAYER ADDRESS and WAGES, TIPS AND COMPENSATION and FEDERAL TAX WITHHELD and…
Selection of Attributes - The selection data structure allows you to show situations where different sets of attributes describe different instances of the data flow.
ORDER= (PERSONAL CUSTOMER NUMBER, CORPORATE ACCOUNT NUMBER)+ ORDER DATE+…
An instance or ORDER consists of: Either PERSONAL CUSTOMER NUMBER or CORPORATE ACCOUNT NUMBER; and ORDER DATE and…

9-26
Data Structure Constructs (continued)
Data Structure Format by Example (relevant portion is boldfaced
English Interpretation (relevant portion is boldfaced)
Repetition of Attributes - The repetition data structure is used to set off a data attribute or group of data attributes that may (or must) repeat themselves a specific number of time for a single instance of the data flow. The minimum number of repetitions is usually zero or one. The maximum number of repetitions may be specified as “n” meaning “many” where the actual number of instances varies for each instance of the data flow.
POLICY NUMBER+ POLICYHOLDER NAME+ POLICY HOLDER ADDRESS+ 0 {DEPENDENT NAME+ DEPENDENT’S RELATIONSHIP} N+ 1 {EXPENSE DESCRIPTION+ SERVICE PROVIDER+ EXPENSE AMOUNT} N
An instance of CLAIM consists of: POLICY NUMBER and POLICYHOLDER NAME and POLICYHOLDER ADDRESS and zero or more instance of: DEPENDENT NAME and DEPENDENT’S RELATIONSHIP and one or more instances of: EXPENSE DESCRIPTION and SERVICE PROVIDER and EXPENSE ACCOUNT
9-27
Data Structure Constructs (concluded)
Data Structure Format by Example (relevant portion is boldfaced
English Interpretation (relevant portion is boldfaced)
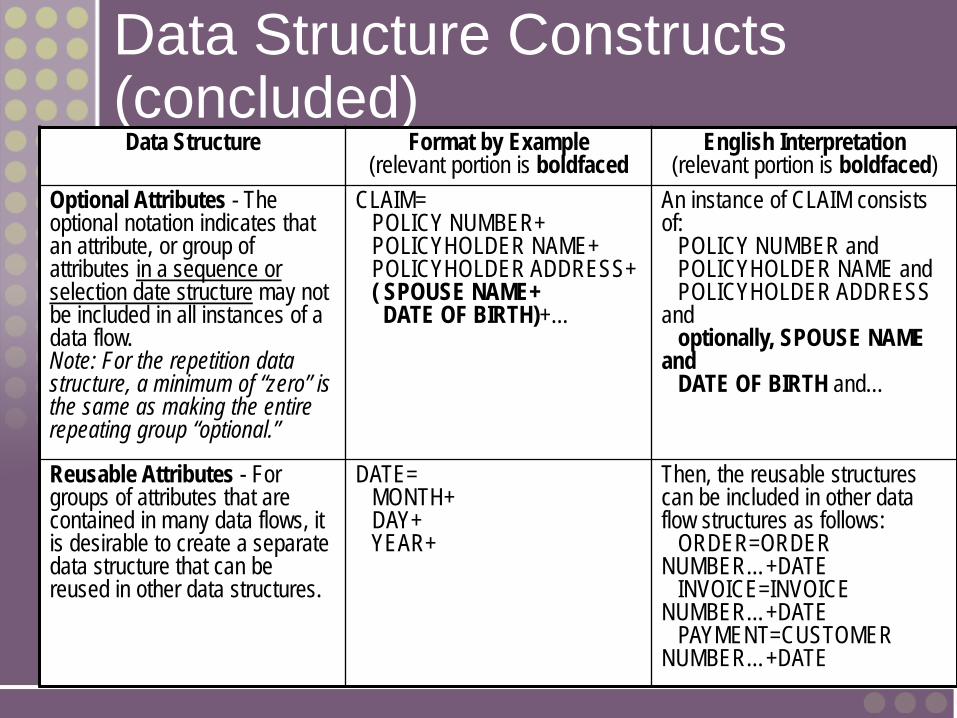
Optional Attributes - The optional notation indicates that an attribute, or group of attributes in a sequence or selection date structure may not be included in all instances of a data flow. Note: For the repetition data structure, a minimum of “zero” is the same as making the entire repeating group “optional.”
CLAIM= POLICY NUMBER+ POLICYHOLDER NAME+ POLICYHOLDER ADDRESS+ ( SPOUSE NAME+ DATE OF BIRTH)+…
An instance of CLAIM consists of: POLICY NUMBER and POLICYHOLDER NAME and POLICYHOLDER ADDRESS and optionally, SPOUSE NAME and DATE OF BIRTH and…
Reusable Attributes - For groups of attributes that are contained in many data flows, it is desirable to create a separate data structure that can be reused in other data structures.
DATE= MONTH+ DAY+ YEAR+
Then, the reusable structures can be included in other data flow structures as follows: ORDER=ORDER NUMBER…+DATE INVOICE=INVOICE NUMBER…+DATE PAYMENT=CUSTOMER NUMBER…+DATE
9-28
Data Types and Domains
Data attributes should be defined by data types and domains. Data type - a class of data that be stored in an attribute.
• Character, integers, real numbers, dates, pictures, etc.
Domain – the legitimate values for an attribute.
9-29
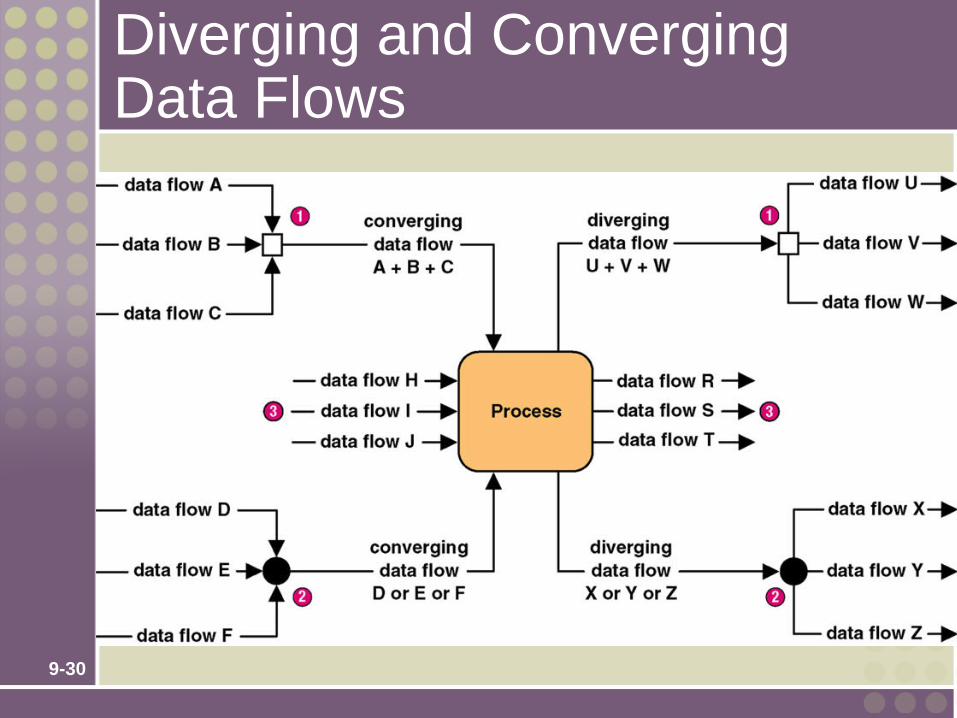
Diverging and Converging Data Flows Diverging data flow – a data flow that splits
into multiple data flows. • Indicates data that starts out naturally as one flow,
but is routed to different destinations. • Also useful to indicate multiple copies of the same
output going to different destinations.
Converging data flow – the merger of multiple data flows into a single packet. • Indicates data from multiple sources that can (must)
come together as a single packet for subsequent processing.
9-30
Diverging and Converging Data Flows
9-31
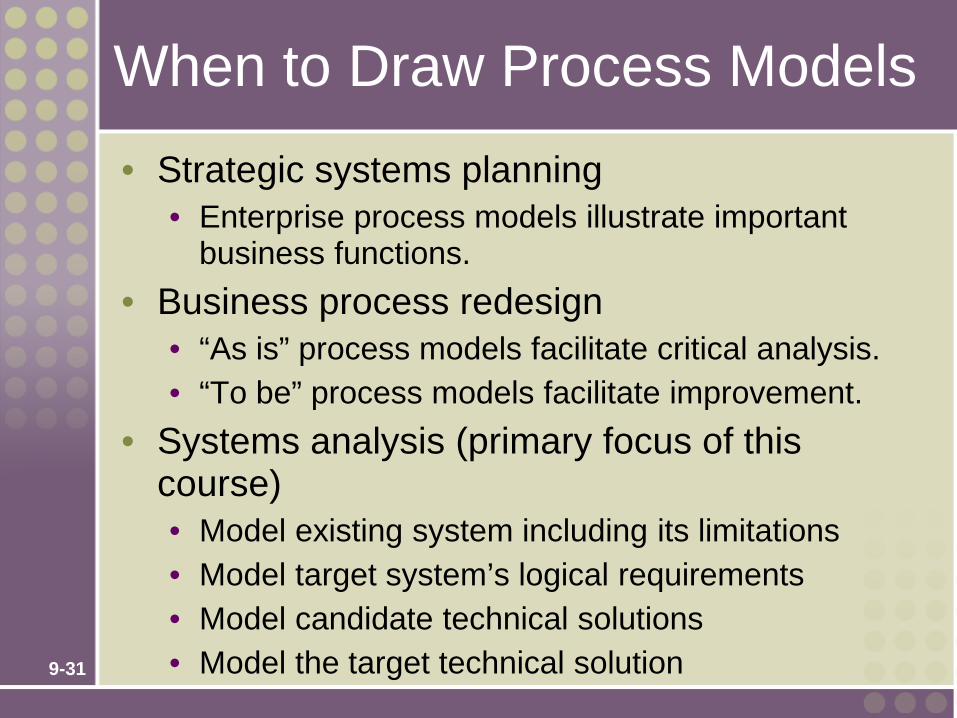
When to Draw Process Models • Strategic systems planning
• Enterprise process models illustrate important business functions.
• Business process redesign • “As is” process models facilitate critical analysis. • “To be” process models facilitate improvement.
• Systems analysis (primary focus of this course) • Model existing system including its limitations • Model target system’s logical requirements • Model candidate technical solutions • Model the target technical solution
9-32
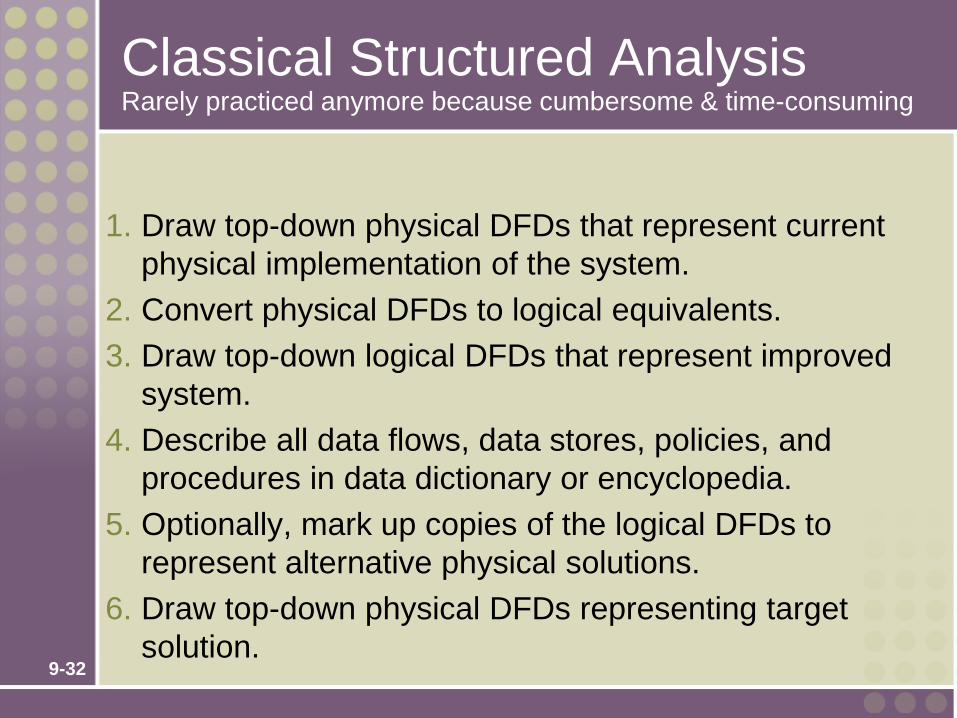
Classical Structured Analysis Rarely practiced anymore because cumbersome & time-consuming
1. Draw top-down physical DFDs that represent current physical implementation of the system.
2. Convert physical DFDs to logical equivalents. 3. Draw top-down logical DFDs that represent improved
system. 4. Describe all data flows, data stores, policies, and
procedures in data dictionary or encyclopedia. 5. Optionally, mark up copies of the logical DFDs to
represent alternative physical solutions. 6. Draw top-down physical DFDs representing target
solution.

9-33
Modern Structured Analysis (More Commonly Practiced)
1. Draw context DFD to establish initial project scope. 2. Draw functional decomposition diagram to partition the
system into subsystems. 3. Create event-response or use-case list for the system
to define events for which the system must have a response.
4. Draw an event DFD (or event handler) for each event. 5. Merge event DFDs into a system diagram (or, for larger
systems, subsystem diagrams). 6. Draw detailed, primitive DFDs for the more complex
event handlers. 7. Document data flows and processes in data dictionary.
9-34
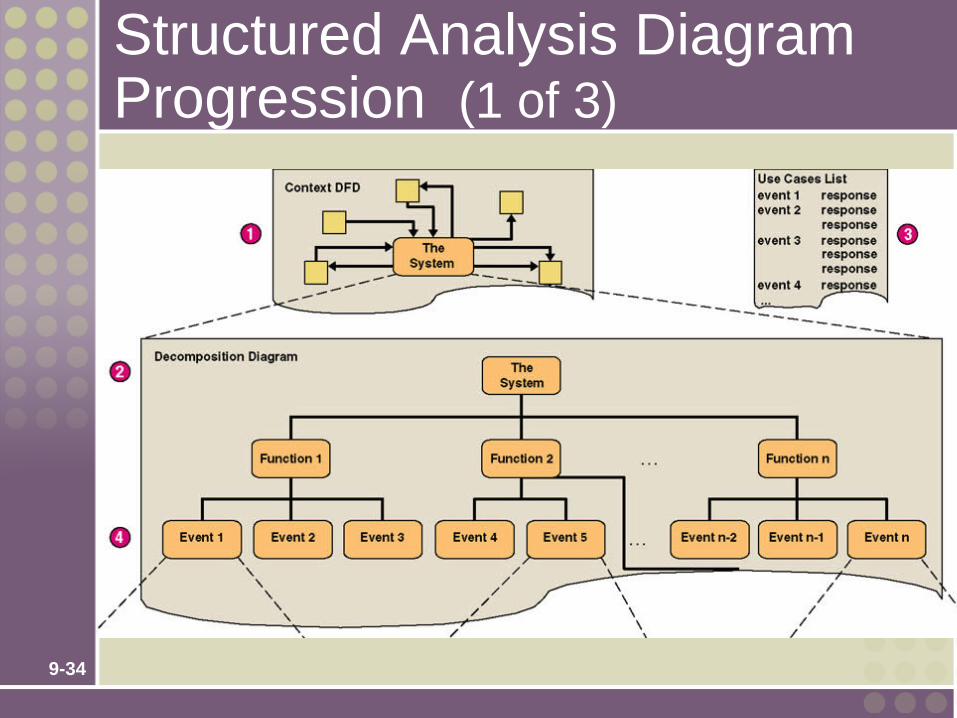
Structured Analysis Diagram Progression (1 of 3)

9-35
Structured Analysis Diagram Progression (2 of 3)
9-36
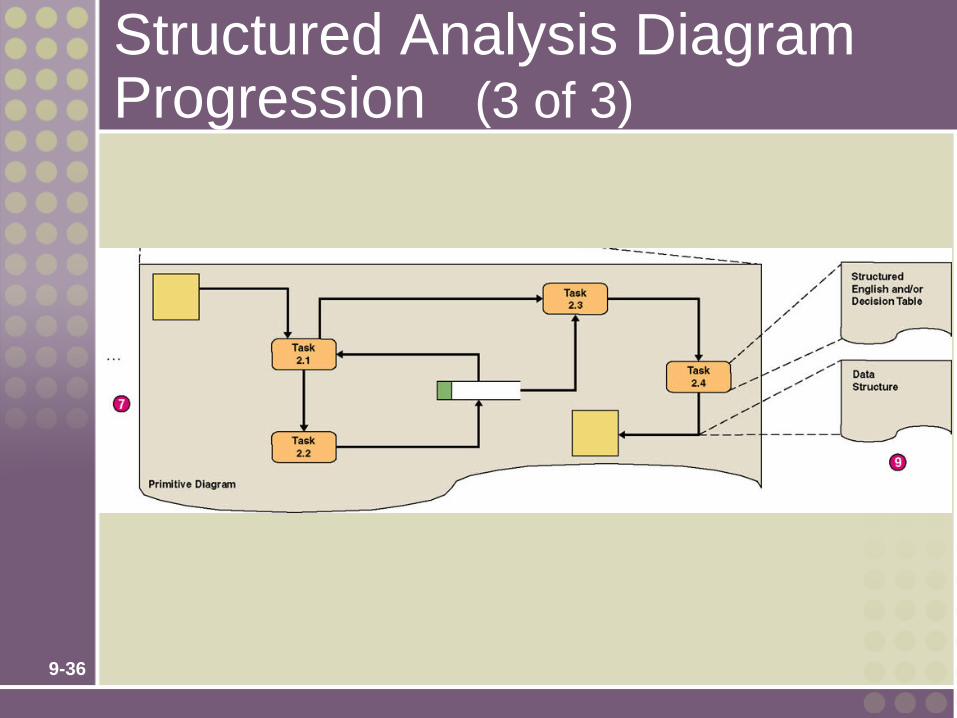
Structured Analysis Diagram Progression (3 of 3)
9-37
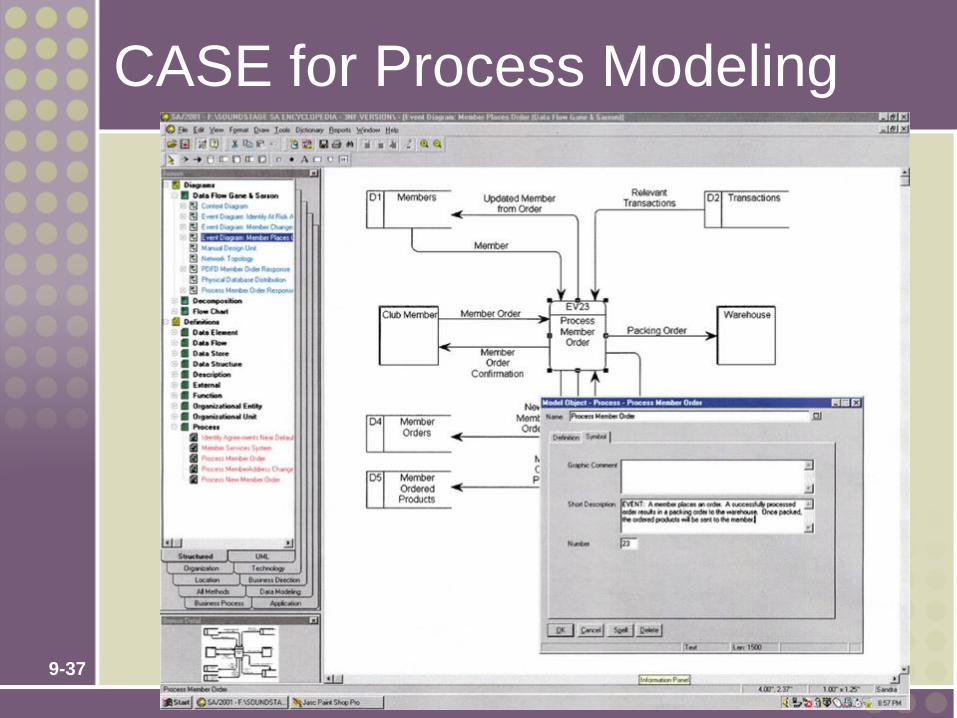
CASE for Process Modeling

9-38
Context Data Flow Diagram
• Context data flow diagram - a process model used to document the scope for a system. Also called the environmental model. 1. Think of the system as a "black box." 2. Ask users what business transactions the system
must respond to. These are inputs, and the sources are external agents.
3. Ask users what responses must be produced by the system. These are outputs, and the destinations are external agents.
4. Identify any external data stores, if any. 5. Draw a context diagram.
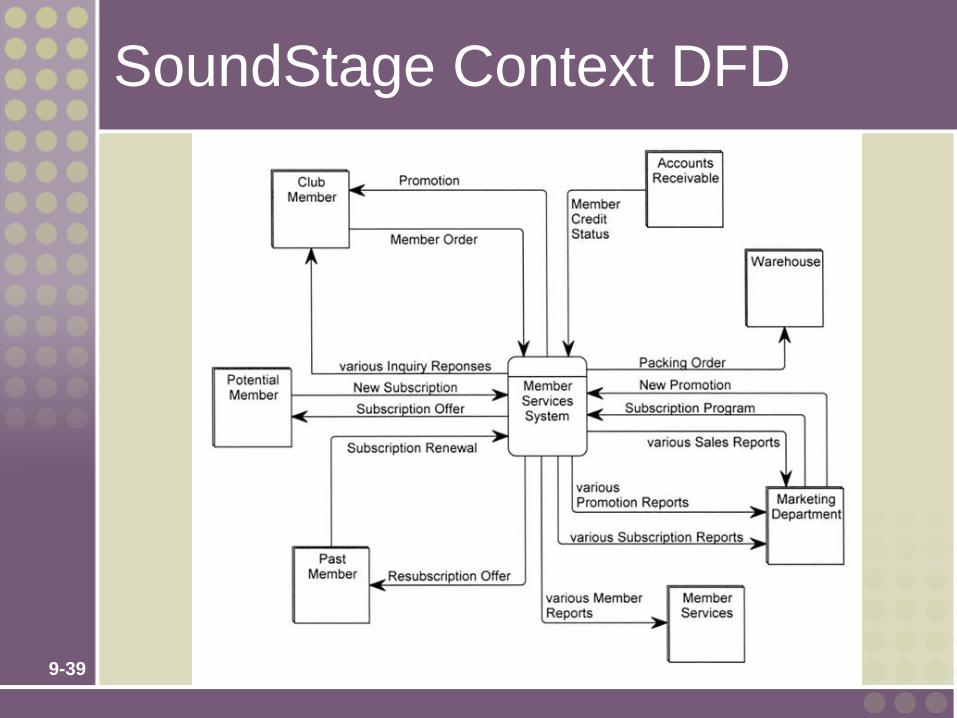
9-39
SoundStage Context DFD
9-40
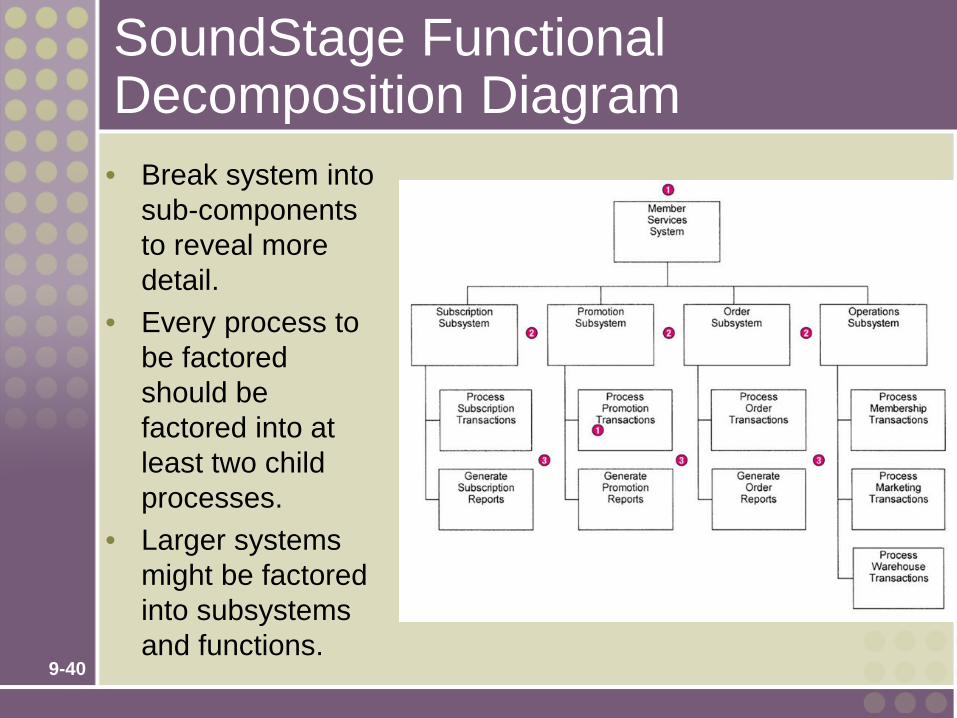
SoundStage Functional Decomposition Diagram • Break system into
sub-components to reveal more detail.
• Every process to be factored should be factored into at least two child processes.
• Larger systems might be factored into subsystems and functions.
9-41
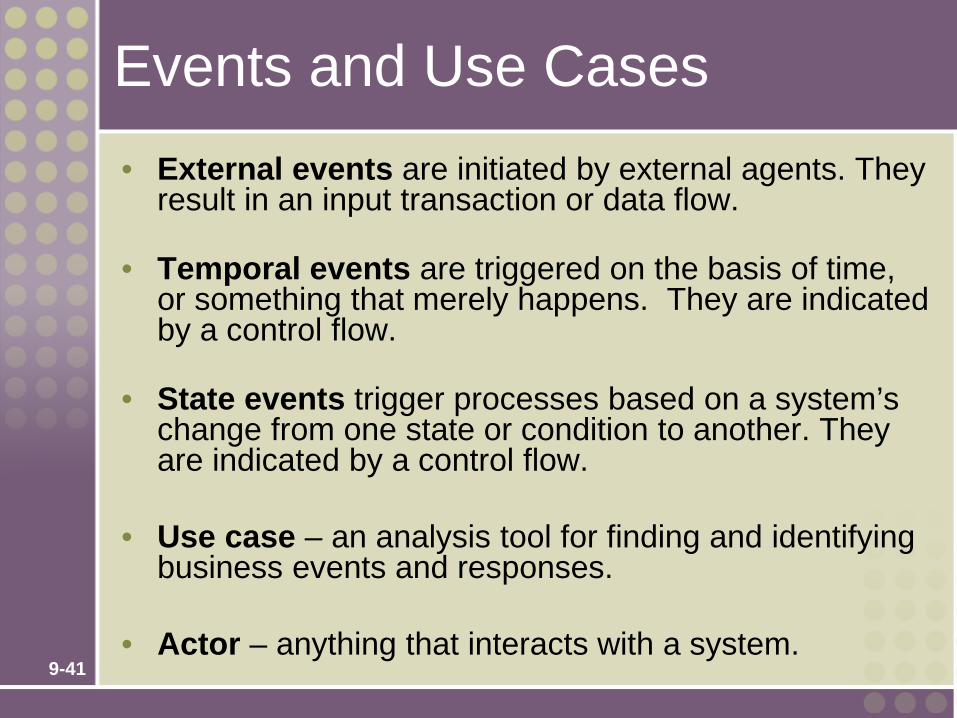
Events and Use Cases • External events are initiated by external agents. They
result in an input transaction or data flow.
• Temporal events are triggered on the basis of time, or something that merely happens. They are indicated by a control flow.
• State events trigger processes based on a system’s change from one state or condition to another. They are indicated by a control flow.
• Use case – an analysis tool for finding and identifying business events and responses.
• Actor – anything that interacts with a system.

9-42
SoundStage Partial Use Case List
Actor/ External Agent
Event (or Use Case)
Trigger Response
Marketing Establishes a new membership subscription plan to entice new members.
New Member Subscription Program
Generate Subscription Plan Confirmation. Create Agreement in the database.
Marketing Establishes a new membership resubscription plan to lure back former members.
Past Member Resubscription Program
Generate Subscription Plan Confirmation. Create Agreement in the database.
(time) A subscription plan expires.
(current date) Generate Agreement Change Confirmation. Logically delete Agreement in database.
Member Joins club by subscribing.
New Subscription
Generate Member Directory Update Confirmation. Create Member in database. Create first Member Order and Member Ordered Products in database.

9-43
SoundStage Partial Event Decomposition Diagram
9-44
Event Diagrams
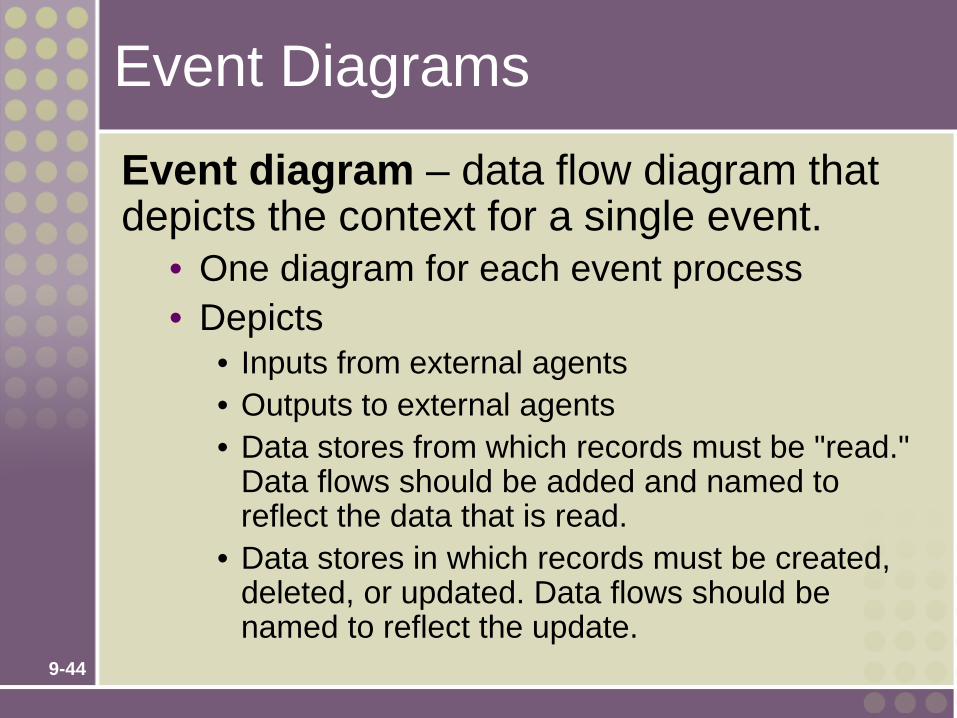
Event diagram – data flow diagram that depicts the context for a single event.
• One diagram for each event process • Depicts
• Inputs from external agents • Outputs to external agents • Data stores from which records must be "read."
Data flows should be added and named to reflect the data that is read.
• Data stores in which records must be created, deleted, or updated. Data flows should be named to reflect the update.
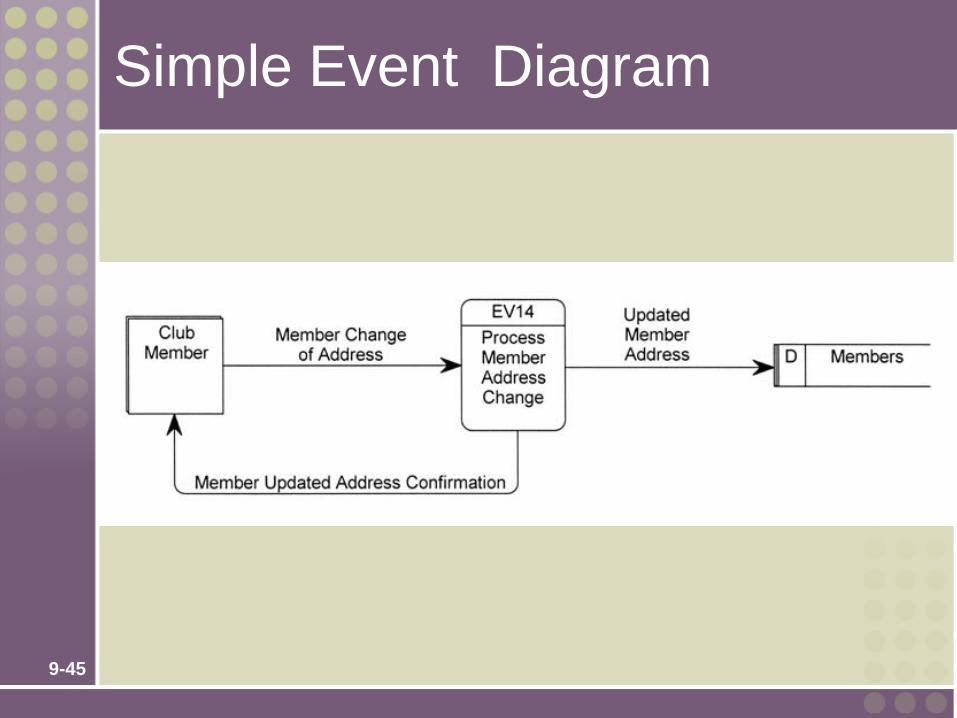
9-45
Simple Event Diagram
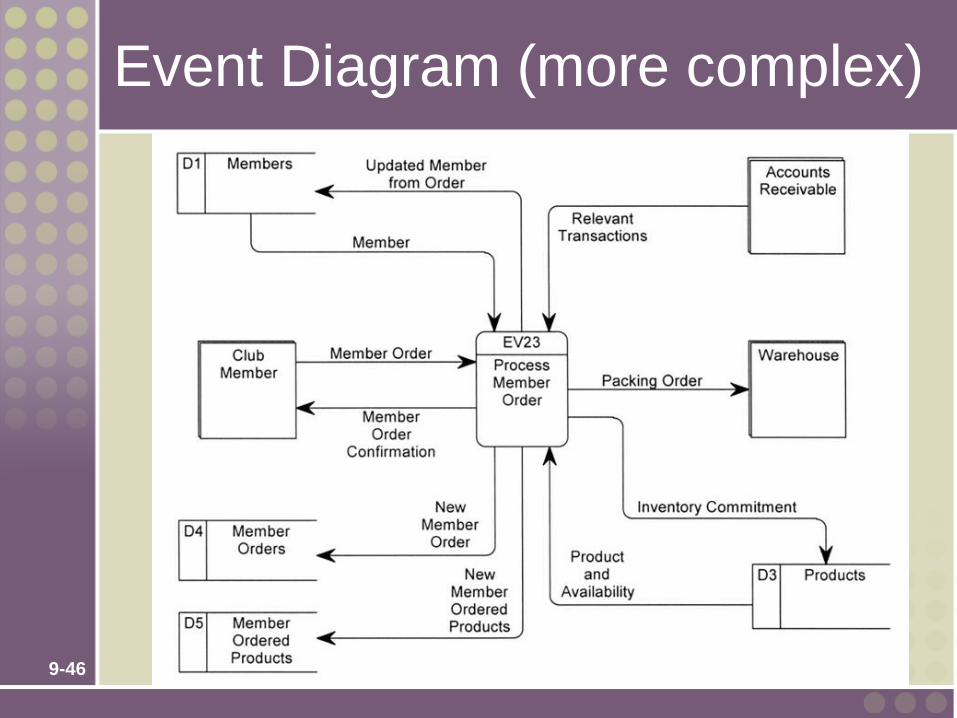
9-46
Event Diagram (more complex)

9-47
Temporal Event Diagram

9-48
System DFD
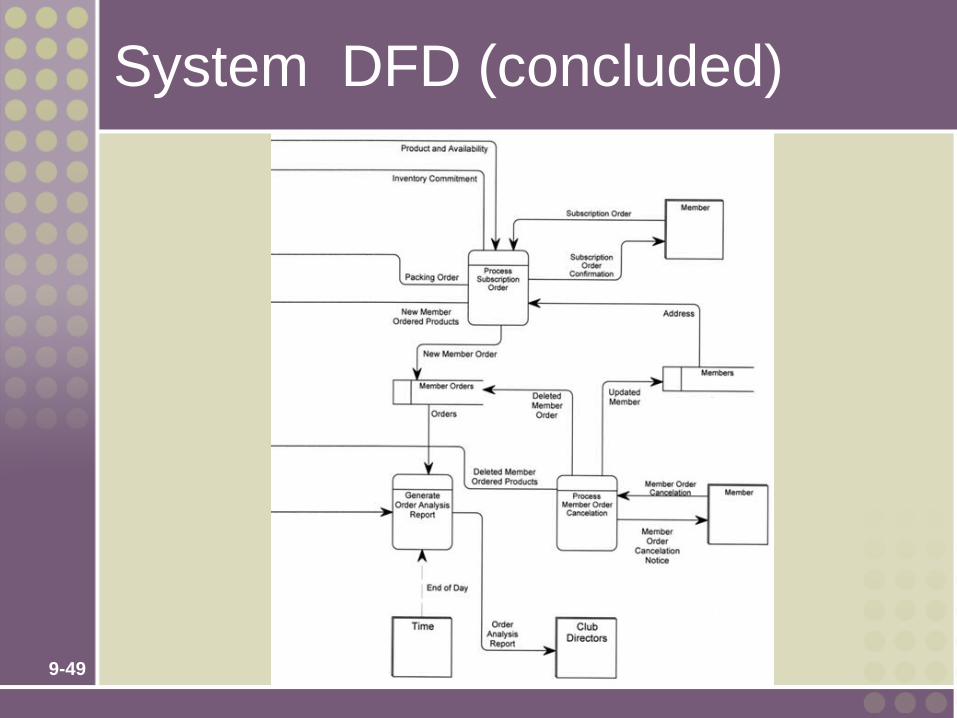
9-49
System DFD (concluded)

9-50
Balancing
Balancing - a concept that requires that data flow diagrams at different levels of detail reflect consistency and completeness
• Quality assurance technique • Requires that if you explode a process to
another DFD to reveal more detail, you must include the same dta flows and data stores

9-51
Primitive Diagrams
• Some (not necessarily all) event processes may be exploded into primitive diagrams to reveal more detail. • Complex business transaction processes • Process decomposed into multiple
elementary processes • Each elementary process is cohesive - it
does only one thing • Flow similar to computer program structure
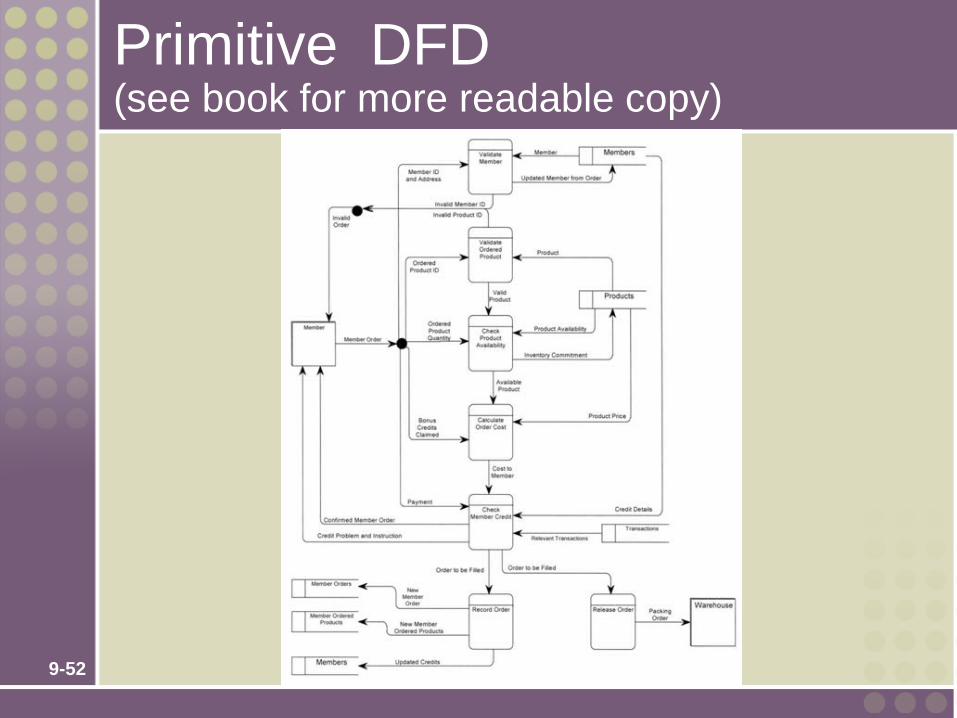
9-52
Primitive DFD (see book for more readable copy)

9-53
Specifying a Data Flow Using a CASE Tool
9-54
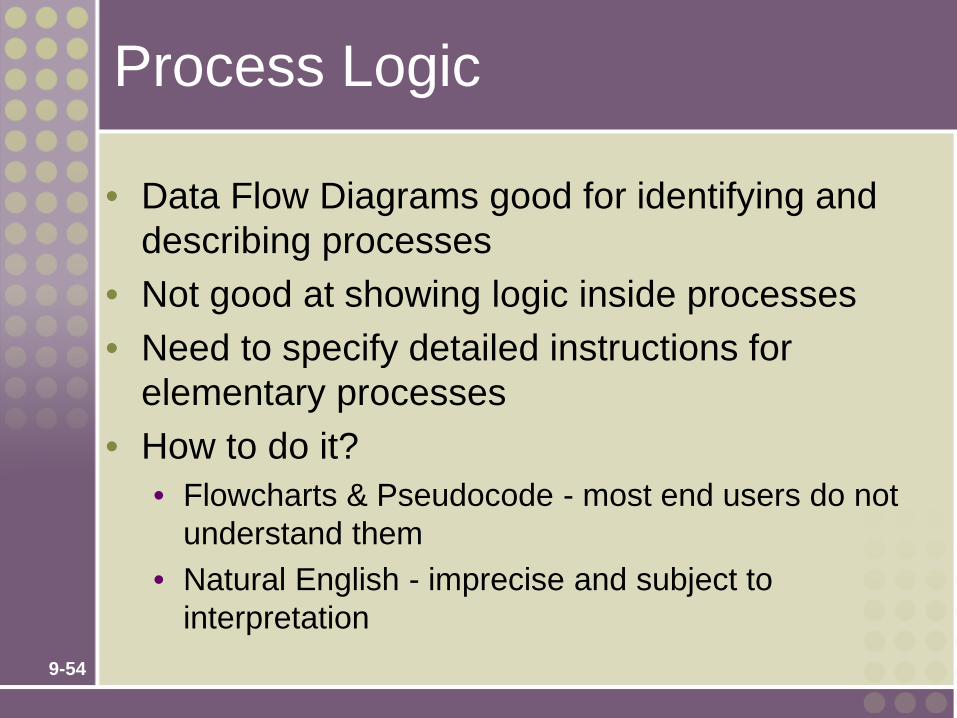
Process Logic
• Data Flow Diagrams good for identifying and describing processes
• Not good at showing logic inside processes • Need to specify detailed instructions for
elementary processes • How to do it?
• Flowcharts & Pseudocode - most end users do not understand them
• Natural English - imprecise and subject to interpretation

9-55
Source: Adapted from Matthies, Leslie, The New Playscript Procedure, (Stamford, CT: Office Publications, Inc. 1977)
Problems with Natural English • Many do not write well and do not question writing abilities. • Many too educated to communicate with general audience • Some write everything like it was a program. • Can allow computing jargon, acronyms to dominate
language. • Statements frequently have excessive or confusing scope. • Overuse compound sentences. • Too many words have multiple definitions. • Too many statements use imprecise adjectives. • Conditional instructions can be imprecise. • Compound conditions tend to show up in natural English.

9-56
Structured English
Structured English – a language syntax for specifying the logic of a process.
• Based on the relative strengths of structured programming and natural English.
9-57
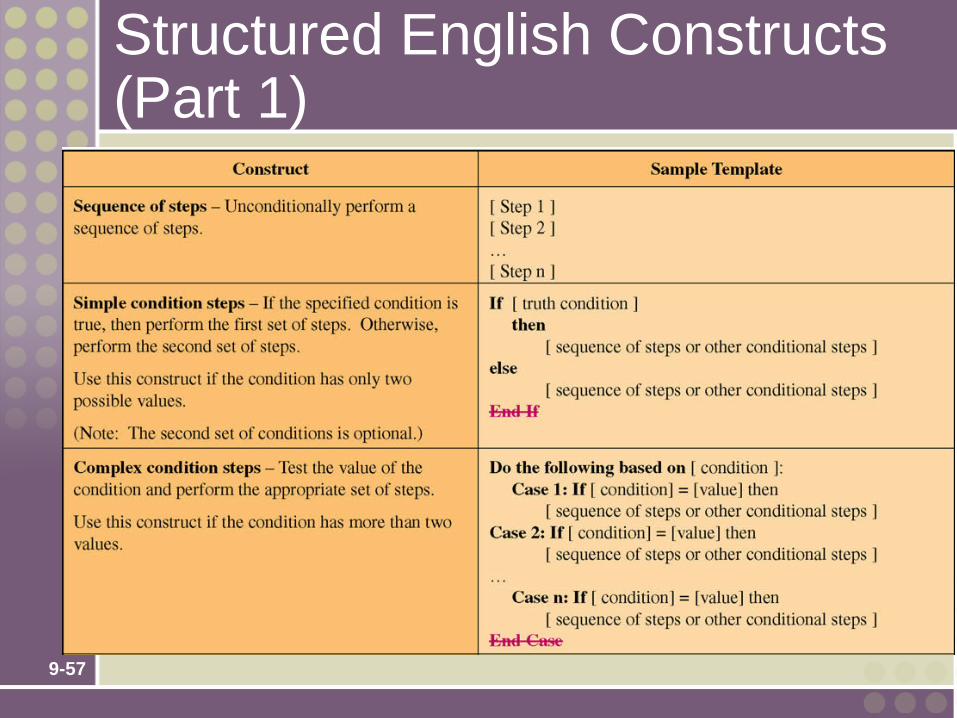
Structured English Constructs (Part 1)

9-58
Structured English Constructs (Part 2)

9-59
Structured English Restrictions on Process Logic
• Only strong, imperative verbs may be used. • Only names that have been defined in project
dictionary may be used. • Formulas should be stated clearly using
appropriate mathematical notations. • Undefined adjectives and adverbs are not
permitted. • Blocking and indentation are used to set off the
beginning and ending of constructs. • User readability should always take priority.

9-60
Policies and Decision Tables
Policy – a set of rules that govern show a process is to be completed. Decision table – a tabular form of presentation that specifies a set of conditions and their corresponding actions.
• As required to implement a policy.

9-61
A Simple Decision Table
9-62
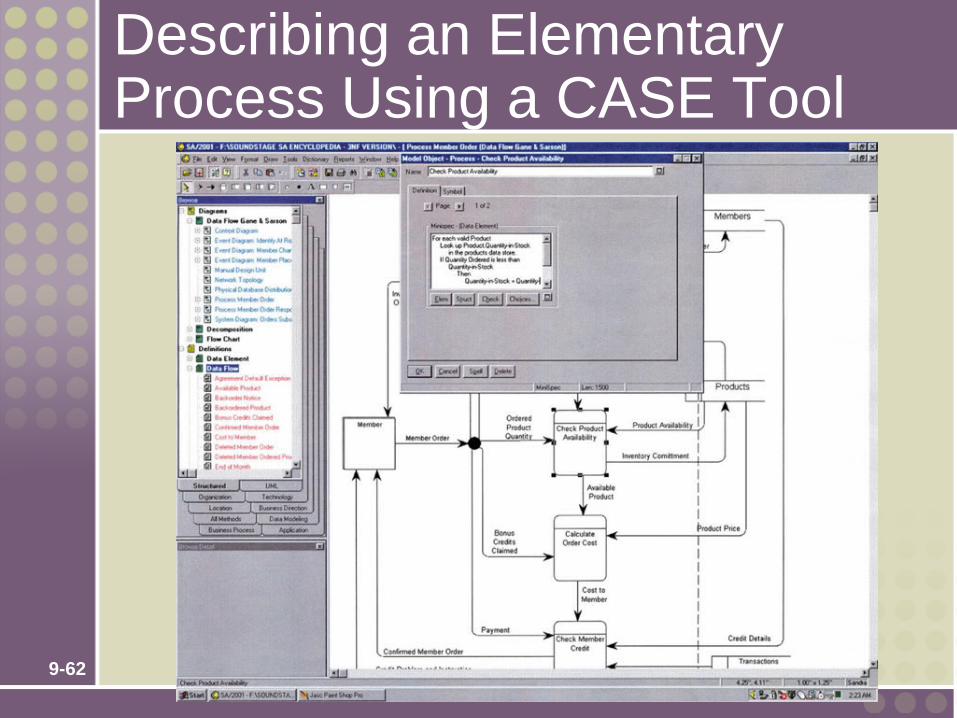
Describing an Elementary Process Using a CASE Tool

9-63
Data & Process Model Synchronization CRUD Matrix

9-64
Process Distribution