Chapter 8 Introduction to Air PollutionAir...
11
1 Chapter 8 Environmental Transport and Fate Chapter 8 – Introduction to Air Pollution Air Pollution Benoit Cushman-Roisin Thayer School of Engineering Dartmouth College (cartoon floating on the web without attribution)
Transcript of Chapter 8 Introduction to Air PollutionAir...
1
Chapter 8
Environmental Transport and Fate
Chapter 8
–
Introduction to
Air PollutionAir Pollution
Benoit Cushman-RoisinThayer School of Engineering
Dartmouth College
(cartoon floating on the web without attribution)

2
Type Example Scales Physics involved
Local Plume from industrial ~1 km horizontally near-ground air layer subject
smokestack ~10’s m in vertical to surface roughness and
fraction of 1 hour convection
Types of air pollution
Urban Smog over ~10 km horizontally local winds, atmospheric
Los Angeles ~100-1000m in vertical boundary layer
several hours to days hills and mountains
Regional Acid rain ~100 km horizontally weather patterns
several km in vertical cloud formation
several days
Continental 1986 Chernobyl size of continent or ocean prevailing winds
2011 Fukushima troposphere weather patterns
radioactive fallout days to weeks
Global Climate change size of planet
troposphere and stratosphere
decades and beyond
hydrological cycle
prevailing winds
equator-to-pole gradients
(http://oceanworld.tam
u.e
There is a strong correlation between time scale, length scale and chemical species
edu/resources/oceanography-book/atmosphere.htm
l)

3
Deadly air-pollution episode in London on 5–9 December 1952, during which SO2 concentration (from stagnating combustion smoke) rose to a peak of 1.34 ppm.
For comparison, the US EPA standard for 1 day is 0 14 ppmfor 1 day is 0.14 ppm.
(Source: Scorer, 1997, page 416)
Surge in number of deaths
(Source: Boubel et al., 1994, page 281)
Surge in number of deaths correlates with peak in SO2
concentration. Several thousand deaths were blamed on this pollution episode (4000 in the first two weeks and up to 12000 over a longer period).
Pollutant Exposure duration Standard Cause for concern
CO 1 hour 35 ppm headaches, asphyxiation
Carbon monoxide 8 hours 9 ppm decreased exercise tolerance
NO2 1 year 0.053 ppm aggravation of respiratory disease
Nitrogen dioxide
U.S. National Ambient Air Quality Standards (NAAQS)
g
SO2 3 hours 0.50 ppm shortness of breath
Sulfur dioxide 1 day 0.14 ppm wheezing, odor
1 year 0.03 ppm acid precipitation
damage to vegetation and lakes
O3 1 hour 0.12 ppm eye irritation
Ozone 8 hours 0.08 ppm interference with breathing
damage to materials and plants
Pb 3 months 1 5 g/m3 blood poisoningPb
Lead
3 months 1.5 g/m blood poisoning
impaired infant development
PM2.5 24 hours
1 year
65 g/m3
15 g/m3
lung damage
PM10 24 hours
1 year
150 g/m3
50 g/m3
visibility
respiratory disease

4
(http://ww
w.kow
oma
.de/en/gps/additional/atmosp
h
Question: Why does the temperature drop with height above ground?
here.htm)
A parcel of air in hydrostatic equilibrium
Balance of vertical forces:
pressure from above + weight+ weight= pressure from below
zpdzzp
gVAzpdzzp
AzpmgAdzzp
)()(
0)]()([
)()(
gdz
zpdzzp )()(
gdz
dp since mass m = density x volume V
volume V = area A x height dz.

5
Compressibility of air
1) Air is an ideal gas: TRp with T = absolute temperature = oC + 273.15R = 287 m2/s2.K
Take z-derivativedT
RTd
Rdp
Take z derivativedzdzdz
2) Consider a change in height(de)compression work is compensated by a change in internal energy:
Internal energy = E = mC T dVpdE Internal energy = E = mCvTwith Cv = 718 m2/s2.K
dz
dp
dz
dTC
m
dz
dp
dz
dTmC
p
v
v
2
Work performed = –pdV
Since this energy-work exchange is performed in the absence of heat exchange, it is called an adiabatic exchange.
An atmosphere with interchangeable air parcels
descent, z↓
compression
ascent, z↑
expansion
z
pressure increases p↑
volume shrinks V↓ dV<0
pressure squeezes the parcel
parcel receives work
parcel gains energy
pressure decreases p↓
volume expands V↑ dV>0
parcel uses its pressureto push air out of the way
parcel performs work
parcel loses energy
temperature increases
T↑
temperature decreases
T↓
This explains why temperature normally drops with altitude.

6
Combining hydrostatic equilibrium with ideal-gas compressibility & adiabatic change:
dz
dTRT
dz
dR
dz
dp
gdz
dp ● Hydrostatic equilibrium
● Ideal gas
Eliminate to get:dz
dp
dz
dTRT
dz
dRg dzdzdz
dz
dp
dz
dTCv
2
● Adiabatic change
dzdz
Now eliminate to have an equation solely for :dz
dT
dz
d
dz
dTRT
dz
dT
p
CRg v
2
TRp Use here And we are left with:
dz
dTRCg v )(
dz
dTRCg v )( can be recast as
pC
g
dz
dT with Cp = Cv + R = 718 + 287 = 1005 m2/s2.K
We note that in such equilibrium atmosphere, the temperature T decreases monotonically with altitude z. The rate of decrease is:
m
K
Ksm
sm
C
g
p
00976.0/1005
/81.922
2
about 1oC per 100m of elevation.
pC
g is called the adiabatic lapse rate.
It describes the thermal structure of the atmosphere when it is in equilibrium.

7
The atmosphere can be in any of four possible cases:
pC
g
dz
dT1)
Temperature drops too fast with height.Air is top heavy and unstable.Convection ensues to remove this instability 1
2
3
4
pC
g
dz
dT
0dTg dT
0
Convection ensues to remove this instability.
2)
3) 4)
1
Atmosphere is in equilibrium.It state is said to be neutral.Vertical motions are not created but not impaired either.
0dzCp dz
03) 4)
Temperature does not drop fast enough with height.Higher air is warmer and floats on top.Lower air is colder and lies at the bottom.Thermal stratification is impairing vertical exchanges.Atmosphere is said to be stable.
Atmosphere is strongly stratified.It state is qualified as very stable.The situation is called an inversion.
stableStagnation, unhealthy
unstablewell ventilated, healthy
neutralsomewhat mixed, healthy

8
Correction to take into account humidity in the air
Layers of gravitational stability and instability in a compound temperature profile
This leads to the concept of mixing height.
Th i i h i ht i th thi k f thThe mixing height is the thickness of the atmosphere over which overturns when a layer becomes unstable.
The mixing height is usually longer than the thickness of the original unstable layer because mixing engulfs a portion of the stable layer.
9
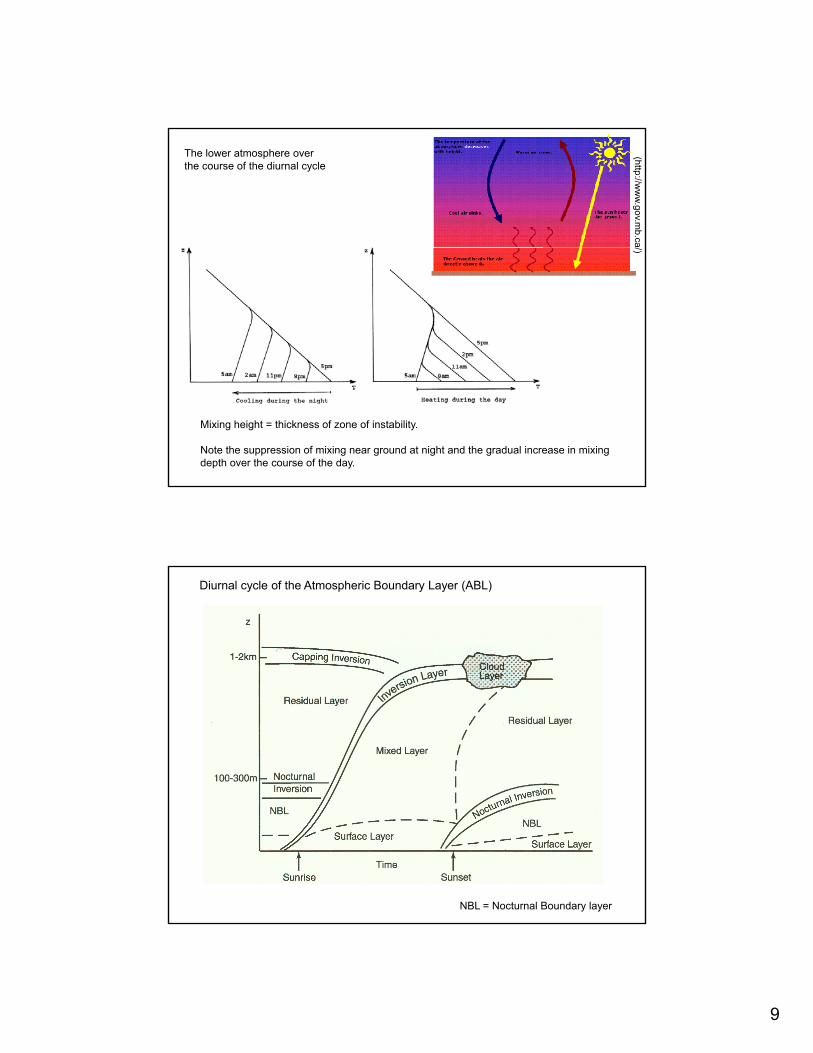
The lower atmosphere over the course of the diurnal cycle
(http
://ww
w.g
ov.m
b.ca//)
Mixing height = thickness of zone of instability.
Note the suppression of mixing near ground at night and the gradual increase in mixing depth over the course of the day.
Diurnal cycle of the Atmospheric Boundary Layer (ABL)
NBL = Nocturnal Boundary layer

10
An example of mixing depth variation over the course of the day (Schenectady, New York, in a summer day of 1994)
This mixing height is on the large side.
A typical mixing height is on the order of 1000m to 1500m.
noon midnight
Reasons for inversion
High-pressure weather disturbance(anticyclone)
Clear winter night
11
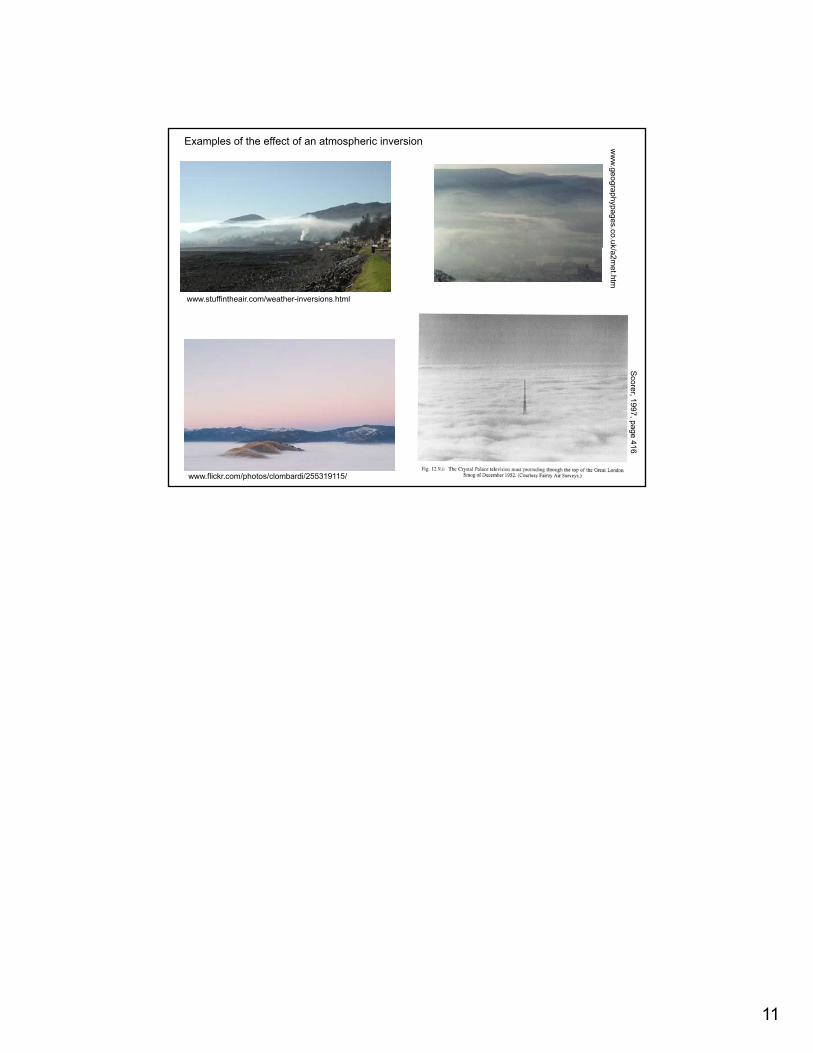
Examples of the effect of an atmospheric inversion ww
w.ge
ogra
ph
ypa
ges.co
.uk
www.stuffintheair.com/weather-inversions.html
k/a2me
t.htm
www.flickr.com/photos/clombardi/255319115/
Sco
rer, 1
99
7, p
age
41
6