CHAPTER 7: WATER AND WETLANDS RESOURCES
19
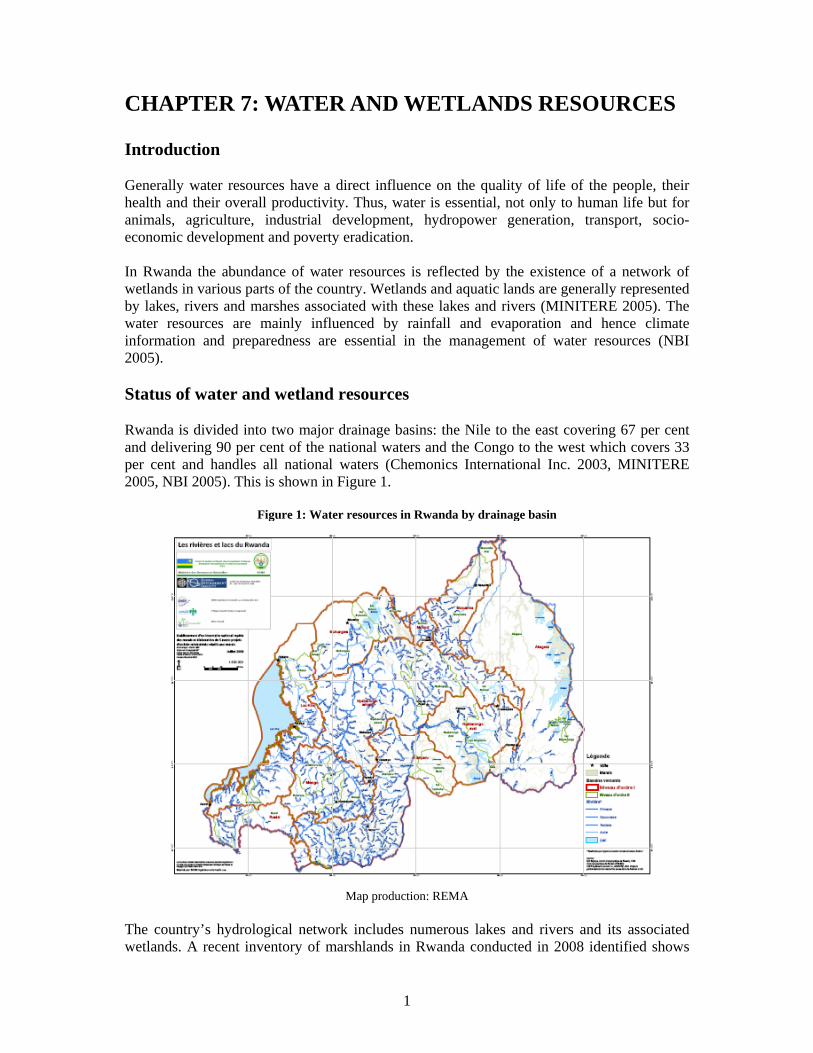
1 CHAPTER 7: WATER AND WETLANDS RESOURCES Introduction Generally water resources have a direct influence on the quality of life of the people, their health and their overall productivity. Thus, water is essential, not only to human life but for animals, agriculture, industrial development, hydropower generation, transport, socio- economic development and poverty eradication. In Rwanda the abundance of water resources is reflected by the existence of a network of wetlands in various parts of the country. Wetlands and aquatic lands are generally represented by lakes, rivers and marshes associated with these lakes and rivers (MINITERE 2005). The water resources are mainly influenced by rainfall and evaporation and hence climate information and preparedness are essential in the management of water resources (NBI 2005). Status of water and wetland resources Rwanda is divided into two major drainage basins: the Nile to the east covering 67 per cent and delivering 90 per cent of the national waters and the Congo to the west which covers 33 per cent and handles all national waters (Chemonics International Inc. 2003, MINITERE 2005, NBI 2005). This is shown in Figure 1. Figure 1: Water resources in Rwanda by drainage basin Map production: REMA The country’s hydrological network includes numerous lakes and rivers and its associated wetlands. A recent inventory of marshlands in Rwanda conducted in 2008 identified shows
Transcript of CHAPTER 7: WATER AND WETLANDS RESOURCES
1
CHAPTER 7: WATER AND WETLANDS RESOURCES Introduction Generally water resources have a direct influence on the quality of life of the people, their health and their overall productivity. Thus, water is essential, not only to human life but for animals, agriculture, industrial development, hydropower generation, transport, socio-economic development and poverty eradication. In Rwanda the abundance of water resources is reflected by the existence of a network of wetlands in various parts of the country. Wetlands and aquatic lands are generally represented by lakes, rivers and marshes associated with these lakes and rivers (MINITERE 2005). The water resources are mainly influenced by rainfall and evaporation and hence climate information and preparedness are essential in the management of water resources (NBI 2005). Status of water and wetland resources Rwanda is divided into two major drainage basins: the Nile to the east covering 67 per cent and delivering 90 per cent of the national waters and the Congo to the west which covers 33 per cent and handles all national waters (Chemonics International Inc. 2003, MINITERE 2005, NBI 2005). This is shown in Figure 1.
Figure 1: Water resources in Rwanda by drainage basin
Map production: REMA
The country’s hydrological network includes numerous lakes and rivers and its associated wetlands. A recent inventory of marshlands in Rwanda conducted in 2008 identified shows

2
860 marshlands, covering a total surface of 278 536 ha, which corresponds to 10.6 per cent of the country surface, 101 lakes covering 149487 ha, and 861 rivers totalling 6462 km in length (REMA 2008). The major lakes include Kivu,Bulera, Ruhondo, Muhazi, Cyohoha, Sake, Kilimbi, Mirayi, Rumira, Kidogo, Mugesera, Nasho, Mpanga, Ihema, Mihindi, Rwampanga and Bisoke. The major rivers include the Akagera, Akanyaru, Base, Kagitumba, Mukungwa, Muvumba, Nyabarongo, and Ruvubu in the Nile Basin and Koko, Rubyiro, Ruhwa, Rusizi, Sebeya in the Congo Basin (Chemonics International Inc. 2003, Kabalisa 2006, NBI 2005). Table 1 gives more information on the major lakes and figure 2 shows the water resources network of Rwanda.
Figure 2: Rwanda’s water resources network in 2009
U g a n d a
B u r u n d i
D.
R.
C
.
Ta
nz
an
i a
Rwamagana
Kayonza
Nyanza
Ruhango
Muhanga
Ngororero
Kamonyi
Gicumbi
Rulindo
Nyaruguru
Gatsibo
Nyamagabe
Rutsiro
Musanze
Bugesera
Gasabo
Burera
Kicukiro
Karongi
Rusizi
NyabihuRubavu Gakenke
Nyagatare
Nyarugenge
KireheNgoma
Nyamasheke
Huye
Gisagara
VolcanoesNational
ParkAkageraNational
Park
NyungweNational
Park
Kigali
Butare
Byumba
Kibuye
Cyangugu
Gisenyi
Ruhengeri
Nyanza
Gikongoro
Rwamagana
Nyagatare
Kibungo
Gitarama
350000
350000
400000
400000
450000
450000
500000
500000
550000
550000
600000
600000
9720
000
9720
000
9760
000
9760
000
9800
000
9800
000
9840
000
9840
000
9880
000
9880
000
Large RiverMedium RiverSmall RiverWetland
LakeForestDistrictUrban Zone ‹
1:1.000.000
1 centimeter = 10.000 metersRwanda Local Projection 92 Transverse MercatorFalse Easting: 500 000, False Northing: 10 000 000,Origin Latitude: 0, Central Meridian: 30, Scale Factor: 0.9999
Administrative Boundaries 2006 revised by INS and MINALOC, 2005Administrative Offices 2009 by MINALOC, 2009Road Network 2007 produced by MININFRA, 2007All other Data produced by Service National de Recensement, 2002
' by CGIS-NUR. All Rights Reserved. CGIS-NUR, April 2009.
0 5 10 15 202,5Kilometers
Rwanda - Water Resources 2009 1 : 1’000’000
Map production: REMA
Table 1: Major Lakes in Rwanda
Group Lakes Area (ha) Characteristics
Kivu 102,000 • Depth: 478 – 480 m • Low oxygen content
Lakes on the north
Bulera, Ruhondo and smaller ones like Karago
5500 (Bulera), 2800 (Ruhondo)
• High altitude lakes • Relatively acidic • Deep lakes • Low biodiversity and

3
Group Lakes Area (ha) Characteristics phytoplankton
Lakes of the centre
Muhazi 3,400 Av. Depth: 3 – 5m
Lakes of Bugesera
Rweru, Cyohoha south, Cyohoha north, Kidogo, Gashanga, Rumira, Kilimbi, Gaharwa
+/- 12,000 • Av. Depth: 3-5m • High PH • High turbidity • High P and organic
content. Lakes of Gisaka
Mugesera, Birira and Sake 8,000
Lakes of Nasho Basin
Mpanga, Cyambwe and Nasho
4,300
Lakes of Akagera National Park
Ihema, Kivumba, Hago, Mihindi, Rwanyakizinga
+/- 14600
Source: Adapted from Kabalisa 2006, MINITERE 2005, NBI 2005. Ground water Data on ground water and aquifers in Rwanda is incomplete. However information available estimates that the discharge for the available resource is 66m3/second and there are about 22,000 recognized sources which have a discharge of 9.0 m3/second (NBI 2005, Kabalisa 2006). Figure 3 shows the ground water potential in the country.
Figure 3: Ground waters’ potential in Rwanda
Source: Kabalisa 2006
Surface water stock estimates Table 2 shows the catchments of some of the major rivers and their tributaries. The catchment surface areas give an approximate indication for management options for integrated water resources management at the catchment or sub-catchment level.
4
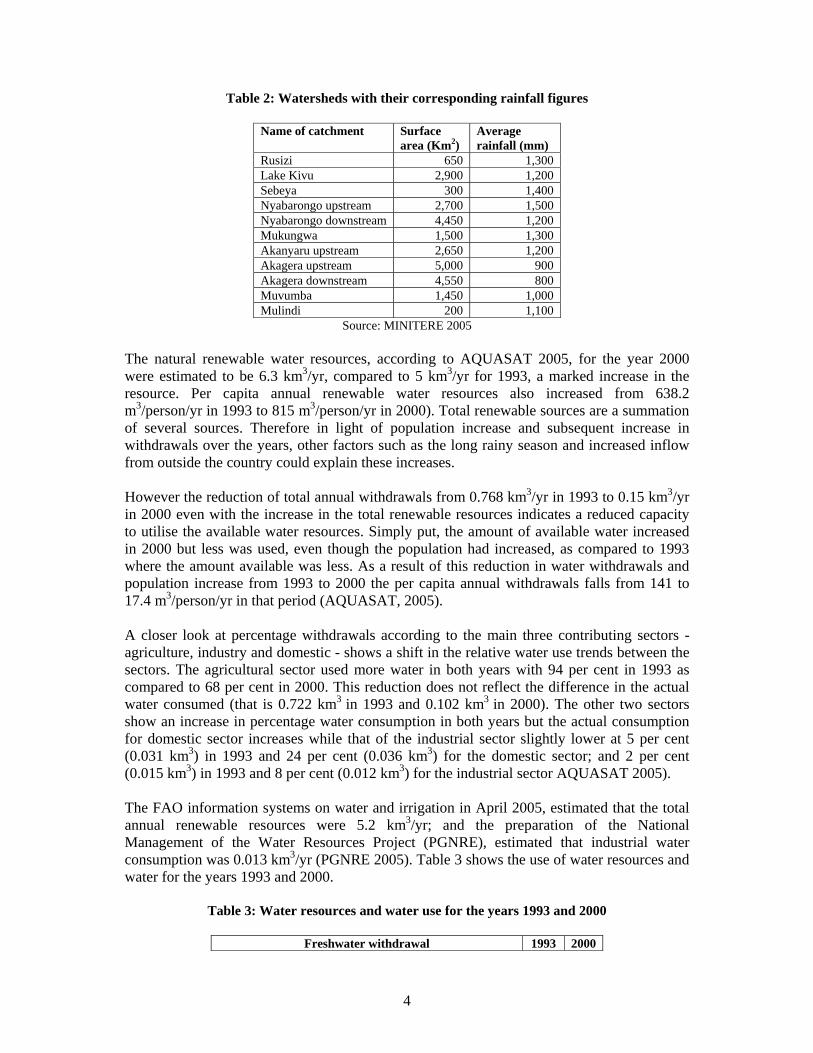
Table 2: Watersheds with their corresponding rainfall figures
Name of catchment Surface area (Km2)
Average rainfall (mm)
Rusizi 650 1,300 Lake Kivu 2,900 1,200 Sebeya 300 1,400Nyabarongo upstream 2,700 1,500Nyabarongo downstream 4,450 1,200 Mukungwa 1,500 1,300 Akanyaru upstream 2,650 1,200 Akagera upstream 5,000 900 Akagera downstream 4,550 800Muvumba 1,450 1,000Mulindi 200 1,100
Source: MINITERE 2005 The natural renewable water resources, according to AQUASAT 2005, for the year 2000 were estimated to be 6.3 km3/yr, compared to 5 km3/yr for 1993, a marked increase in the resource. Per capita annual renewable water resources also increased from 638.2 m3/person/yr in 1993 to 815 m3/person/yr in 2000). Total renewable sources are a summation of several sources. Therefore in light of population increase and subsequent increase in withdrawals over the years, other factors such as the long rainy season and increased inflow from outside the country could explain these increases. However the reduction of total annual withdrawals from 0.768 km3/yr in 1993 to 0.15 km3/yr in 2000 even with the increase in the total renewable resources indicates a reduced capacity to utilise the available water resources. Simply put, the amount of available water increased in 2000 but less was used, even though the population had increased, as compared to 1993 where the amount available was less. As a result of this reduction in water withdrawals and population increase from 1993 to 2000 the per capita annual withdrawals falls from 141 to 17.4 m3/person/yr in that period (AQUASAT, 2005). A closer look at percentage withdrawals according to the main three contributing sectors - agriculture, industry and domestic - shows a shift in the relative water use trends between the sectors. The agricultural sector used more water in both years with 94 per cent in 1993 as compared to 68 per cent in 2000. This reduction does not reflect the difference in the actual water consumed (that is 0.722 km3 in 1993 and 0.102 km3 in 2000). The other two sectors show an increase in percentage water consumption in both years but the actual consumption for domestic sector increases while that of the industrial sector slightly lower at 5 per cent (0.031 km3) in 1993 and 24 per cent (0.036 km3) for the domestic sector; and 2 per cent (0.015 km3) in 1993 and 8 per cent (0.012 km3) for the industrial sector AQUASAT 2005). The FAO information systems on water and irrigation in April 2005, estimated that the total annual renewable resources were 5.2 km3/yr; and the preparation of the National Management of the Water Resources Project (PGNRE), estimated that industrial water consumption was 0.013 km3/yr (PGNRE 2005). Table 3 shows the use of water resources and water for the years 1993 and 2000.
Table 3: Water resources and water use for the years 1993 and 2000
Freshwater withdrawal 1993 2000

5
Total annual renewable water resources(Km2/yr) 5 6.3 Per capita annual renewable water resources (m3/person/yr) 638.2 815 Total annual withdrawals (Km2/yr) 0.768 0.15 Per capita annual withdrawals (m3/person/yr) 141 17.4 Sectoral withdrawal as per cent of total annual withdrawal
Agricultural 94 68 Domestic 5 24 Industry 2 8
Source: AQUASAT 2005 Water availability and use The pressures on water resources primarily result from utilizing the natural resources to meet basic needs as well as social-economic development. The effects of water resources use is demonstrated in the changes in the quantity and quality of water. All aspects of human activities in Rwanda have produced varying impacts and degrees of modification to the available water resources and these impacts are manifest at the catchment and sub-catchment levels as the following examples illustrate.
Domestic water use The figures from ELECTROGAZ show that the water demand in Kigali city is 55,080 m3 per day, whereas nominal production is 30,525 m3 per day. This illustrates a deficit in the drinking water requirements for Kigali. It is estimated that water demand over the next decade will double in Kigali and rural areas and more than double for the semi-urban settlements. Table 4 shows the estimated consumption of water in 2005 and the project water demand for 2020.
Table 4: Potable water needs
Types of settlements
Estimated consumption (l/home/day)
Projected needs for 2020 (l/home/day)
Kigali 48 90 Semi-urban 35 90 Rural 10 20
Source: MINITERE 2005
Rainwater harvesting in Rubavu district. Such technologies help increase access to potable water
Photo credit: REMA

6
Industrial water use The study on the Knowledge and Management of Water data done under the preparation of the National Management of the Water Resources Project (PGNRE) indicates that industrial water requirements will be between 300,000 and 900,000 m³/yr by 2020 in urban areas. The study also projects that coffee washing stations will consume 130.000 m ³/yr by the year 2010 in the rural areas (PGNRE 2005). Table 5 shows the number of industries that contribute to water withdrawals.
Table 5: Types of industries that contribute to water withdrawal
Industry types Number Agro-processing 40 Chemical industries 29 Printeries and paper industries 14 Metal works 10 Mining 7Non metals & fabrication 6leather and tanning 3 Textile 2 Electricity, gas and water supply 1
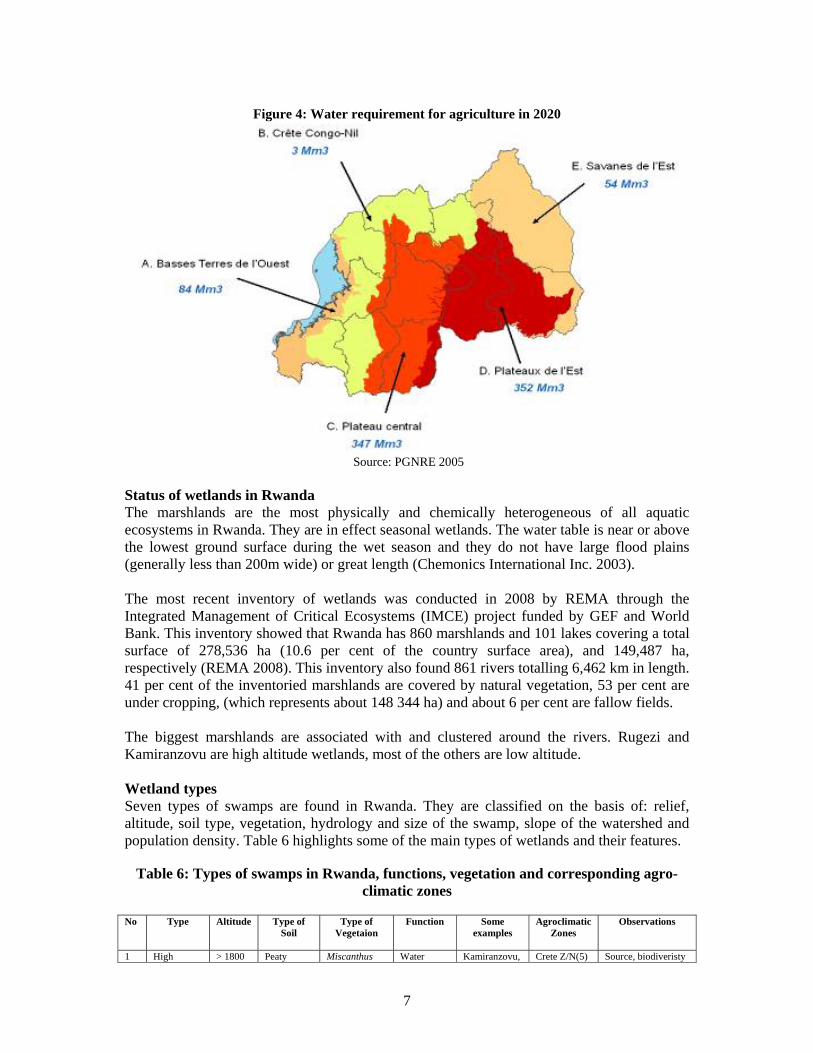
MINITERE 2005 Agriculture water use Rwanda’s agriculture is rain-fed and is therefore exposed to vagaries of climate fluctuation. Many areas which use poor farming methods without integrating soil and water resources conservation tend to have weak agricultural productivity. In such instances, soil moisture becomes the limiting factor for crop growth (Kabalisa 2006). In 2000, the total national water withdrawal for agriculture was estimated at 150 million m3/year and the share of agriculture estimated at 68 per cent. Rice growing (on 8,500 ha) constituted the crop that used most irrigation at about 25,500,000 m3 (Kabalisa 2006). The government is making efforts to promote irrigation including hillside irrigation, especially in the drylands of the eastern province, to increase food security. This is in light of research that projects the agricultural water requirements for 2020. It shows that the eastern region will require more water than at present, while the Congo-Nile ridge region which will have enough rainfall will only require the development of rain harvesting systems to allow the utilisation of water in drier seasons (Kabalisa 2006). Figure 4 shows the agricultural water requirements in 2020.
7
Figure 4: Water requirement for agriculture in 2020
Source: PGNRE 2005
Status of wetlands in Rwanda The marshlands are the most physically and chemically heterogeneous of all aquatic ecosystems in Rwanda. They are in effect seasonal wetlands. The water table is near or above the lowest ground surface during the wet season and they do not have large flood plains (generally less than 200m wide) or great length (Chemonics International Inc. 2003). The most recent inventory of wetlands was conducted in 2008 by REMA through the Integrated Management of Critical Ecosystems (IMCE) project funded by GEF and World Bank. This inventory showed that Rwanda has 860 marshlands and 101 lakes covering a total surface of 278,536 ha (10.6 per cent of the country surface area), and 149,487 ha, respectively (REMA 2008). This inventory also found 861 rivers totalling 6,462 km in length. 41 per cent of the inventoried marshlands are covered by natural vegetation, 53 per cent are under cropping, (which represents about 148 344 ha) and about 6 per cent are fallow fields. The biggest marshlands are associated with and clustered around the rivers. Rugezi and Kamiranzovu are high altitude wetlands, most of the others are low altitude. Wetland types Seven types of swamps are found in Rwanda. They are classified on the basis of: relief, altitude, soil type, vegetation, hydrology and size of the swamp, slope of the watershed and population density. Table 6 highlights some of the main types of wetlands and their features.
Table 6: Types of swamps in Rwanda, functions, vegetation and corresponding agro-climatic zones
No Type Altitude Type of
Soil Type of
Vegetaion
Function Some examples
Agroclimatic Zones
Observations
1 High > 1800 Peaty Miscanthus Water Kamiranzovu, Crete Z/N(5) Source, biodiveristy
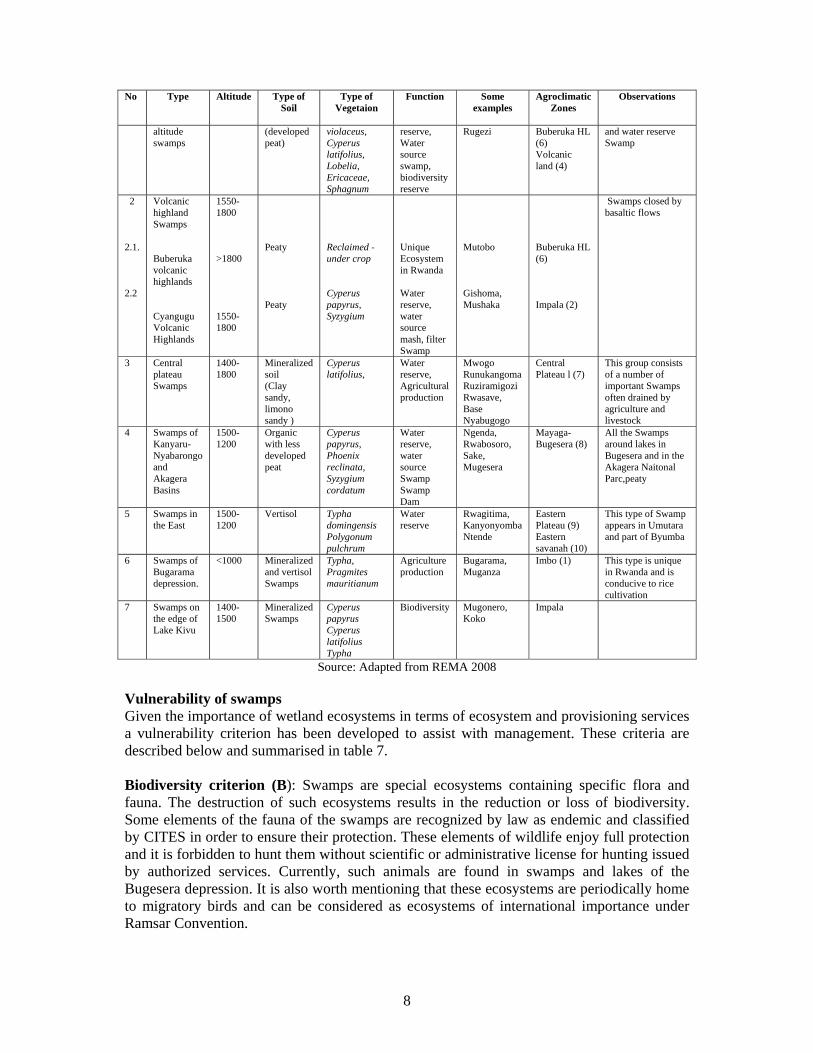
8
No Type Altitude Type of Soil
Type of Vegetaion
Function Some examples
Agroclimatic Zones
Observations
altitude swamps
(developed peat)
violaceus, Cyperus latifolius, Lobelia, Ericaceae, Sphagnum
reserve, Water source swamp, biodiversity reserve
Rugezi Buberuka HL (6) Volcanic land (4)
and water reserve Swamp
2
2.1.
2.2
Volcanic highland Swamps Buberuka volcanic highlands Cyangugu Volcanic Highlands
1550-1800 >1800 1550-1800
Peaty Peaty
Reclaimed - under crop Cyperus papyrus, Syzygium
Unique Ecosystem in Rwanda Water reserve, water source mash, filter Swamp
Mutobo Gishoma, Mushaka
Buberuka HL (6) Impala (2)
Swamps closed by basaltic flows
3 Central plateau Swamps
1400-1800
Mineralized soil (Clay sandy, limono sandy )
Cyperus latifolius,
Water reserve, Agricultural production
Mwogo Runukangoma Ruziramigozi Rwasave, Base Nyabugogo
Central Plateau l (7)
This group consists of a number of important Swamps often drained by agriculture and livestock
4 Swamps of Kanyaru-Nyabarongo and Akagera Basins
1500-1200
Organic with less developed peat
Cyperus papyrus, Phoenix reclinata, Syzygium cordatum
Water reserve, water source Swamp Swamp Dam
Ngenda, Rwabosoro, Sake, Mugesera
Mayaga-Bugesera (8)
All the Swamps around lakes in Bugesera and in the Akagera Naitonal Parc,peaty
5 Swamps in the East
1500-1200
Vertisol Typha domingensis Polygonum pulchrum
Water reserve
Rwagitima, Kanyonyomba Ntende
Eastern Plateau (9) Eastern savanah (10)
This type of Swamp appears in Umutara and part of Byumba
6 Swamps of Bugarama depression.
<1000 Mineralized and vertisol Swamps
Typha, Pragmites mauritianum
Agriculture production
Bugarama, Muganza
Imbo (1) This type is unique in Rwanda and is conducive to rice cultivation
7 Swamps on the edge of Lake Kivu
1400-1500
Mineralized Swamps
Cyperus papyrus Cyperus latifolius Typha
Biodiversity Mugonero, Koko
Impala
Source: Adapted from REMA 2008 Vulnerability of swamps Given the importance of wetland ecosystems in terms of ecosystem and provisioning services a vulnerability criterion has been developed to assist with management. These criteria are described below and summarised in table 7. Biodiversity criterion (B): Swamps are special ecosystems containing specific flora and fauna. The destruction of such ecosystems results in the reduction or loss of biodiversity. Some elements of the fauna of the swamps are recognized by law as endemic and classified by CITES in order to ensure their protection. These elements of wildlife enjoy full protection and it is forbidden to hunt them without scientific or administrative license for hunting issued by authorized services. Currently, such animals are found in swamps and lakes of the Bugesera depression. It is also worth mentioning that these ecosystems are periodically home to migratory birds and can be considered as ecosystems of international importance under Ramsar Convention.
9
Criterion of the presence of peat (P): This criterion is very important for high-altitude swamps and those of Bugesera depression. These swamps are vulnerable, because they consist of layers of organic material constantly waterlogged and therefore unstable. The development of these types of swamp usually causes landslides and the gravity will depend on the slope and the subsidence accompanied with drainage, with regular risks of self combustion. High altitude peat swamps are generally water reservoirs for areas located downstream. The draining of peat lands may cause such significant negative impacts downstream (the case of Rugezi in 2004). Hydrological criterion (H): This criterion is very important because it concerns the water conditions that determine the health of the swamp ecosystem. Thus, some swamps, especially those of high altitude, are sources of major rivers (like Kamiranzovu swamp in the Nyungwe national park and the Rugezi swamp in Bulera district). The drainage of these swamps may lead to drought in downstream or other forms of imbalance in the environment like increased erosion or disruption of the climate. Swamps dams are also affected by this criterion. Swamp dams are the portion of swamp serving as a stopper, located between a lake and a river downstream. It prevents the water upstream from flowing downstream, leading to the creation of a lake or water reservoir. These types of swamps play the role of stopper between the upstream lakes and rivers downstream. Their exploitation may lead to the disappearance of such lakes for instance Lake Cyohoha North. Swamps that serve as water catchments for the water supply of towns and cities are also vulnerable because their drainage can cause disruptions in water supply, with important socio-economic impacts like water-related diseases or the interruption of production in industry that relies on the use of water as part of their processes. Central plateau swamps are the exception. They are generally large and receive water from high altitudes and watershed runoff. Such types of swamps have no water problem and can be exploited for production through appropriate land management. Close to a park or a natural reserve (P): Swamps along the boundaries of the Akagera National Park are home to wild animals, especially hippos, buffaloes, giraffes, impalas and sitatunga. They also serve as areas for watering animals in the park. In light of that these swamps are regarded as critical ecosystems. These swamps are also considered as buffer zones between the park and the neighbouring populations. Cross-border Criterion (Cr): Cross-border swamps are considered as those which straddle several sectors, districts or countries. They deserve special attention from all parties concerned. Indeed, most efforts to understand and safeguard natural resources and cross-border ecosystems are often circumscribed within the limits of administrative entities (sectors, districts and countries). However, if there are no joint management efforts, the effects of mismanagement of a part affect the whole swamp. This joint management is more difficult in the case of swamp belonging to several countries. For this reason, these swamps should have a special status.
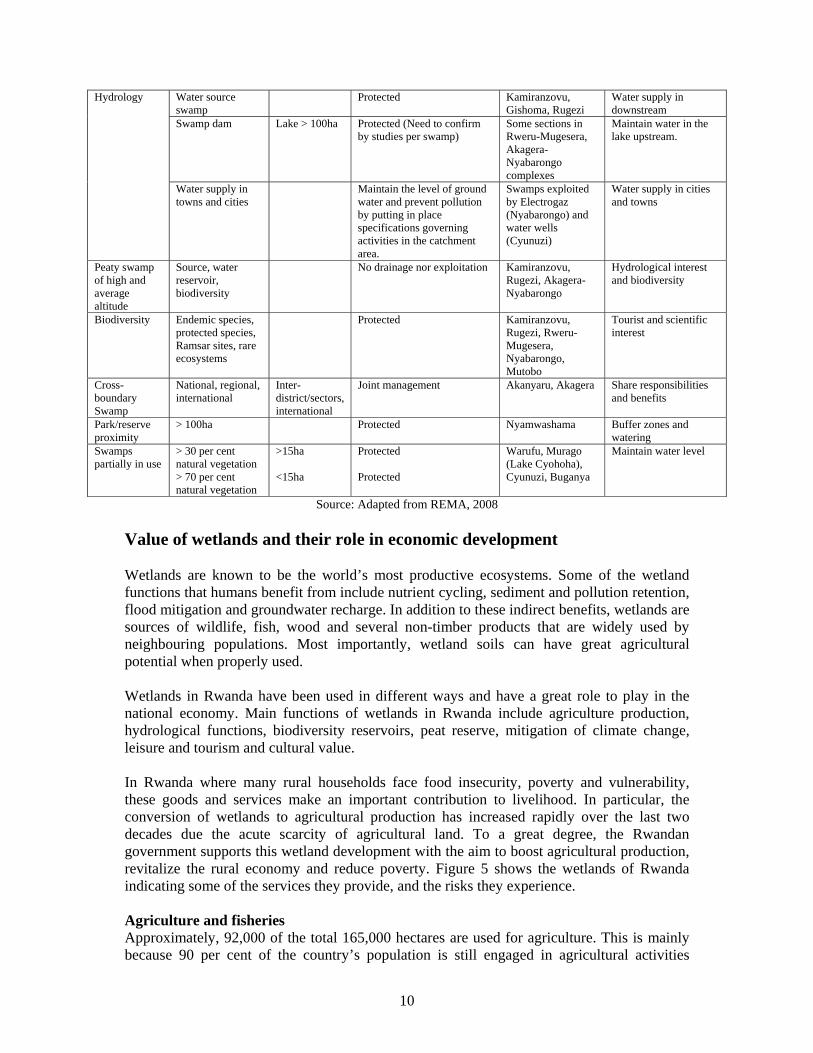
Table 7: Swamps according to the vulnerability criteria
Criteria Sub criterion level 1
Sub criterion level 2
Decision Examples Observation - Justification
10
Hydrology Water source swamp
Protected Kamiranzovu, Gishoma, Rugezi
Water supply in downstream
Swamp dam Lake > 100ha Protected (Need to confirm by studies per swamp)
Some sections in Rweru-Mugesera, Akagera- Nyabarongo complexes
Maintain water in the lake upstream.
Water supply in towns and cities
Maintain the level of ground water and prevent pollution by putting in place specifications governing activities in the catchment area.
Swamps exploited by Electrogaz (Nyabarongo) and water wells (Cyunuzi)
Water supply in cities and towns
Peaty swamp of high and average altitude
Source, water reservoir, biodiversity
No drainage nor exploitation Kamiranzovu, Rugezi, Akagera- Nyabarongo
Hydrological interest and biodiversity
Biodiversity Endemic species, protected species, Ramsar sites, rare ecosystems
Protected Kamiranzovu, Rugezi, Rweru-Mugesera, Nyabarongo, Mutobo
Tourist and scientific interest
Cross-boundary Swamp
National, regional, international
Inter-district/sectors, international
Joint management Akanyaru, Akagera Share responsibilities and benefits
Park/reserve proximity
> 100ha Protected Nyamwashama Buffer zones and watering
Swamps partially in use
> 30 per cent natural vegetation > 70 per cent natural vegetation
>15ha <15ha
Protected Protected
Warufu, Murago (Lake Cyohoha), Cyunuzi, Buganya
Maintain water level
Source: Adapted from REMA, 2008 Value of wetlands and their role in economic development Wetlands are known to be the world’s most productive ecosystems. Some of the wetland functions that humans benefit from include nutrient cycling, sediment and pollution retention, flood mitigation and groundwater recharge. In addition to these indirect benefits, wetlands are sources of wildlife, fish, wood and several non-timber products that are widely used by neighbouring populations. Most importantly, wetland soils can have great agricultural potential when properly used. Wetlands in Rwanda have been used in different ways and have a great role to play in the national economy. Main functions of wetlands in Rwanda include agriculture production, hydrological functions, biodiversity reservoirs, peat reserve, mitigation of climate change, leisure and tourism and cultural value. In Rwanda where many rural households face food insecurity, poverty and vulnerability, these goods and services make an important contribution to livelihood. In particular, the conversion of wetlands to agricultural production has increased rapidly over the last two decades due the acute scarcity of agricultural land. To a great degree, the Rwandan government supports this wetland development with the aim to boost agricultural production, revitalize the rural economy and reduce poverty. Figure 5 shows the wetlands of Rwanda indicating some of the services they provide, and the risks they experience. Agriculture and fisheries Approximately, 92,000 of the total 165,000 hectares are used for agriculture. This is mainly because 90 per cent of the country’s population is still engaged in agricultural activities

11
(MINAGRI 2008). Most of the Rwanda marshlands are under traditional cropping. However, some have been developed through extensive drainage or irrigation. Some of these wetlands have been reclaimed increasingly for rice production and sugar cane growing. Wetland grasslands provide critical areas for livestock grazing, especially during the dry season. Wetlands constitute an important fish habitat and may support large populations of fish. Many local communities depend on these fish sources for their livelihood. Experimental fishing is being trialled in Lake Ihema.
Figure 5: Wetlands of Rwanda – services provided and threats experienced
Map production: REMA
Biodiversity High altitude marshlands host a higher amount of vegetation species compared to other marshlands: 51 species in Rugezi, 44 species in Kamiranzovu. This may result from specific ecological conditions first, and then from their size and protected status. Other marshlands that host large biodiversity include the marshlands of Akagera and associated lakes, Akanyaru-Nyabarongo and associated lakes, Kamiranzovu (part of Nyungwe Forest) and Rugezi marshland, which is the only Ramsar site (REMA 2008) Outside of the national parks where the fauna is formally protected, the lakeside and marshy Rweru-Mugesera complex hosts the most diverse mammals’ species. Crocodiles, varans (sand crocodiles) and snakes are also well represented there. The lakeside and marshy Akanyaru complex, Nyabarongo and Akagera National Park are especially rich habitats for ornithological fauna. Rwanda hosts a number of migrating birds species protected by CITES. These migrating species have been observed in Murago, Gishoma, Rweru-Mugesera complex, on the lakeshore of Lake Ihema. Some species mentioned on IUCN list and
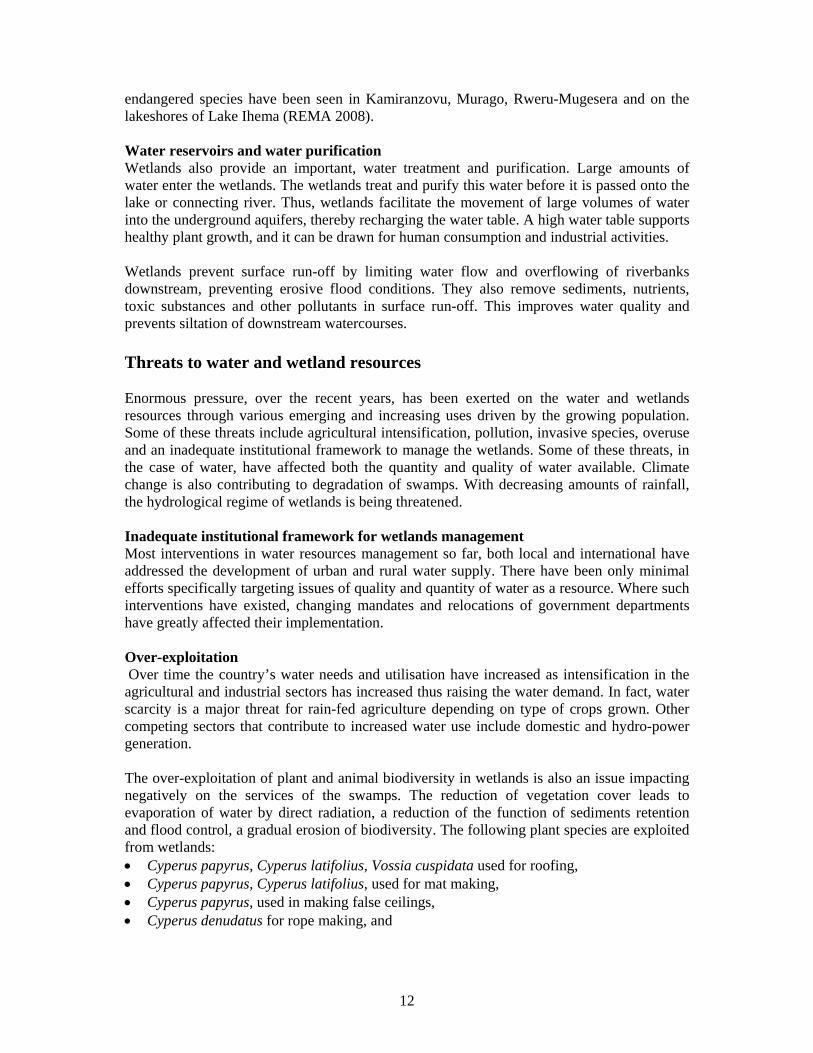
12
endangered species have been seen in Kamiranzovu, Murago, Rweru-Mugesera and on the lakeshores of Lake Ihema (REMA 2008). Water reservoirs and water purification Wetlands also provide an important, water treatment and purification. Large amounts of water enter the wetlands. The wetlands treat and purify this water before it is passed onto the lake or connecting river. Thus, wetlands facilitate the movement of large volumes of water into the underground aquifers, thereby recharging the water table. A high water table supports healthy plant growth, and it can be drawn for human consumption and industrial activities. Wetlands prevent surface run-off by limiting water flow and overflowing of riverbanks downstream, preventing erosive flood conditions. They also remove sediments, nutrients, toxic substances and other pollutants in surface run-off. This improves water quality and prevents siltation of downstream watercourses. Threats to water and wetland resources Enormous pressure, over the recent years, has been exerted on the water and wetlands resources through various emerging and increasing uses driven by the growing population. Some of these threats include agricultural intensification, pollution, invasive species, overuse and an inadequate institutional framework to manage the wetlands. Some of these threats, in the case of water, have affected both the quantity and quality of water available. Climate change is also contributing to degradation of swamps. With decreasing amounts of rainfall, the hydrological regime of wetlands is being threatened. Inadequate institutional framework for wetlands management Most interventions in water resources management so far, both local and international have addressed the development of urban and rural water supply. There have been only minimal efforts specifically targeting issues of quality and quantity of water as a resource. Where such interventions have existed, changing mandates and relocations of government departments have greatly affected their implementation. Over-exploitation Over time the country’s water needs and utilisation have increased as intensification in the agricultural and industrial sectors has increased thus raising the water demand. In fact, water scarcity is a major threat for rain-fed agriculture depending on type of crops grown. Other competing sectors that contribute to increased water use include domestic and hydro-power generation. The over-exploitation of plant and animal biodiversity in wetlands is also an issue impacting negatively on the services of the swamps. The reduction of vegetation cover leads to evaporation of water by direct radiation, a reduction of the function of sediments retention and flood control, a gradual erosion of biodiversity. The following plant species are exploited from wetlands: • Cyperus papyrus, Cyperus latifolius, Vossia cuspidata used for roofing, • Cyperus papyrus, Cyperus latifolius, used for mat making, • Cyperus papyrus, used in making false ceilings, • Cyperus denudatus for rope making, and

13
• Medicinal plants are collected by traditional healers and sold on local markets or home treatment.
The hunting of certain animals of the swamps exerts a pressure on these animals and they disappear or migrate towards other habitats sometimes less indicated to shelter them. Uncontrolled fishing especially in Lakes Ihema and Mugesera is at the origin of the disappearance of certain species of fish and birds. Other products exploited from wetlands include clay, sand and peat. Clay is used for making bricks and tiles for building. Peat is used as fuel in prisons, industries and schools as an alternative energy source to wood. There are no clear guidelines for peat harvesting. Land use practices Wetlands in Rwanda are mainly threatened by reclamation and degradation, especially those outside national parks. Human activities threatening wetlands in Rwanda include settlements and road construction, drainage, unplanned conversion to agriculture, industrial pollution sewage and excessive harvest of products. Land use practices such as trampling of stocks, human disturbances, burning of vegetation, soil excavation processes have devastated vegetation cover to such an extent that the soil surface of areas has become susceptible to erosion. Increased housing developments associated with urbanisation, directly affects the soils’ physical characteristics thus lowering water infiltration and increasing runoff and soil erosion with increased potential for floods. This has happened in Kigali and to a lesser extent in other provincial towns across the country. Roofing of housing complexes and paving of roads and other access routes has reduced the surface area available for soil infiltration. During the rainy season much of the run-off flows to the valleys below with minimal infiltration which is one of the main ground water recharge pathways. In cases of the existence of open sewers and exposed drainage canals, the rain water carries along with it the domestic waste directly into the marshlands below as is the case for the Gikondo and Nyabugogo wetlands for Kigali. The direct impact of reduced soil infiltration is increased run-off, soil erosion on bare soils and siltation of water ways in the lower slopes or marshlands. Soil erosion is discussed in more detail in Chapter 3: Land use and agriculture. Also associated with urbanisation is watershed destruction and increasing incidences of dumping of untreated effluent in rivers and marshlands (MINIFRA 2003). In urban areas wetlands are most likely to be used as dumping sites for wastes or wetlands may be converted to other forms of land use, such as residential and industrial development, road construction, or aquaculture. The Gikondo industrial area located in Gikondo-Nyabugogo wetland greatly affects the ability of the wetland to clean wastewater and control siltation of streams (REMA 2006).
Building in a wetland

14
Photo credit: REMA
Agriculture intensification Given the land shortage in Rwanda, wetlands have been put under intensive cultivation for crops such as sugarcane, rice, flowers, sweet potatoes, and Eucalyptus. Other uses include conversion of wetlands into livestock grazing areas. This has however, been reduced due to the zero-grazing policy being enforced by government. Approximately 30 per cent (90,000 ha) of the swamps area is already being used for agriculture. Of these, 5,000 ha are used all year round (MINIRENA 2008). Cultivation of swampland affects their chemical, physical and hydrological nature. The use of chemical fertilisers, fungicides and insecticides has modified the chemical composition of these hydrologically-connected water resources. These chemicals seep through the wetlands and join other water sources most of which form rural domestic water supply points such as wells and streams. Spillages from industrial processes also pollute water and wetlands, for instance, during the washing of coffee. The physical and hydrological modifications mainly relate to erosion due to inappropriate agricultural practices. Drains and channels constructed to divert or to increase water out-flow from wetlands lower the water table and can lead to loss of biodiversity through drying out of the wetlands Pollution A study on water quality conducted by the National University of Rwanda in 2002 confirmed that water quality is an issue in this country. Many of the parameters sampled showed measurements higher than WHO recommended standards for drinking water quality (see table 8).
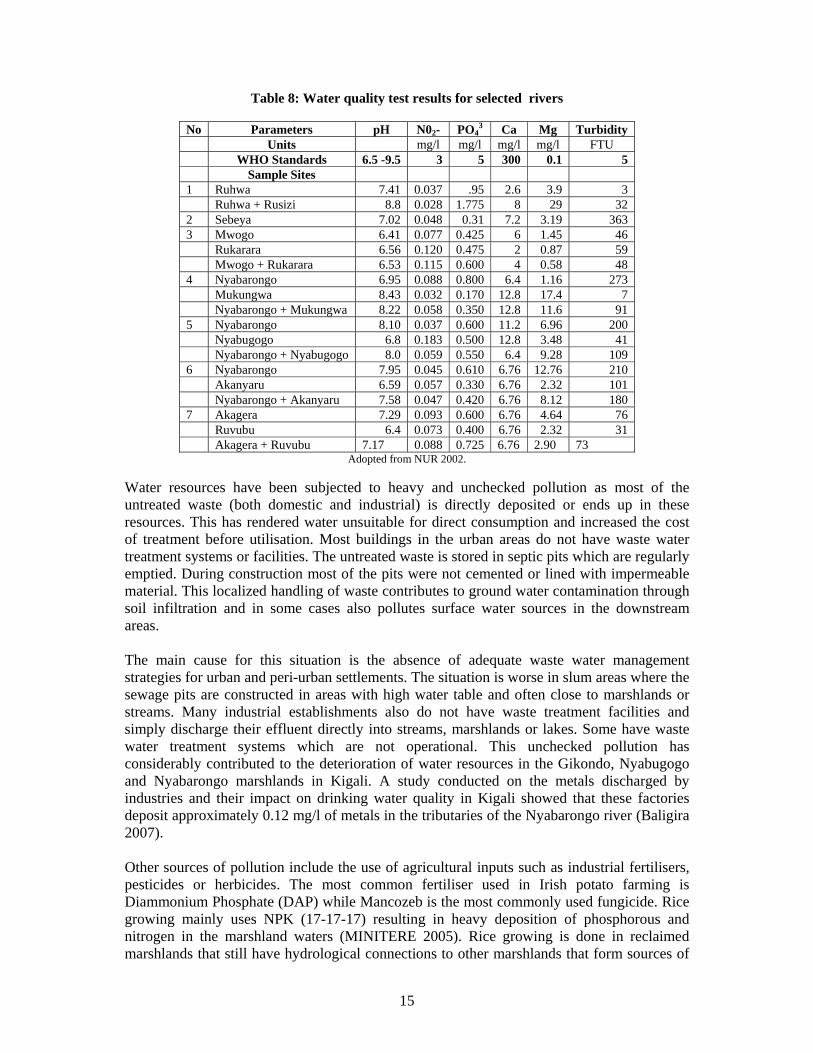
15
Table 8: Water quality test results for selected rivers
No Parameters pH N02- PO43 Ca Mg Turbidity
Units mg/l mg/l mg/l mg/l FTU WHO Standards 6.5 -9.5 3 5 300 0.1 5 Sample Sites 1 Ruhwa 7.41 0.037 .95 2.6 3.9 3 Ruhwa + Rusizi 8.8 0.028 1.775 8 29 32 2 Sebeya 7.02 0.048 0.31 7.2 3.19 363 3 Mwogo 6.41 0.077 0.425 6 1.45 46 Rukarara 6.56 0.120 0.475 2 0.87 59 Mwogo + Rukarara 6.53 0.115 0.600 4 0.58 48 4 Nyabarongo 6.95 0.088 0.800 6.4 1.16 273 Mukungwa 8.43 0.032 0.170 12.8 17.4 7 Nyabarongo + Mukungwa 8.22 0.058 0.350 12.8 11.6 91 5 Nyabarongo 8.10 0.037 0.600 11.2 6.96 200 Nyabugogo 6.8 0.183 0.500 12.8 3.48 41 Nyabarongo + Nyabugogo 8.0 0.059 0.550 6.4 9.28 109 6 Nyabarongo 7.95 0.045 0.610 6.76 12.76 210 Akanyaru 6.59 0.057 0.330 6.76 2.32 101 Nyabarongo + Akanyaru 7.58 0.047 0.420 6.76 8.12 180 7 Akagera 7.29 0.093 0.600 6.76 4.64 76 Ruvubu 6.4 0.073 0.400 6.76 2.32 31 Akagera + Ruvubu 7.17 0.088 0.725 6.76 2.90 73
Adopted from NUR 2002.
Water resources have been subjected to heavy and unchecked pollution as most of the untreated waste (both domestic and industrial) is directly deposited or ends up in these resources. This has rendered water unsuitable for direct consumption and increased the cost of treatment before utilisation. Most buildings in the urban areas do not have waste water treatment systems or facilities. The untreated waste is stored in septic pits which are regularly emptied. During construction most of the pits were not cemented or lined with impermeable material. This localized handling of waste contributes to ground water contamination through soil infiltration and in some cases also pollutes surface water sources in the downstream areas. The main cause for this situation is the absence of adequate waste water management strategies for urban and peri-urban settlements. The situation is worse in slum areas where the sewage pits are constructed in areas with high water table and often close to marshlands or streams. Many industrial establishments also do not have waste treatment facilities and simply discharge their effluent directly into streams, marshlands or lakes. Some have waste water treatment systems which are not operational. This unchecked pollution has considerably contributed to the deterioration of water resources in the Gikondo, Nyabugogo and Nyabarongo marshlands in Kigali. A study conducted on the metals discharged by industries and their impact on drinking water quality in Kigali showed that these factories deposit approximately 0.12 mg/l of metals in the tributaries of the Nyabarongo river (Baligira 2007). Other sources of pollution include the use of agricultural inputs such as industrial fertilisers, pesticides or herbicides. The most common fertiliser used in Irish potato farming is Diammonium Phosphate (DAP) while Mancozeb is the most commonly used fungicide. Rice growing mainly uses NPK (17-17-17) resulting in heavy deposition of phosphorous and nitrogen in the marshland waters (MINITERE 2005). Rice growing is done in reclaimed marshlands that still have hydrological connections to other marshlands that form sources of

16
water for some rivers and lakes. Coffee growing contributes to water pollution both during the growing phase and processing (washing) stage. Invasive species Water hyacinth, an aquatic weeds is threatening lakes and rivers in Rwanda. It grows rapidly to form thick mats on water surfaces, increases swamps areas, reduces water supply and undermines transport, hydroelectric power production, fisheries and fish breeding. It can also affect human health by harbouring mosquitoes (malaria), snails (bilharzias), and snakes (Chemonics International Inc. 2003). Water hyacinth has covered large sections of most of the lakes in the eastern province making them difficult to navigate. In some case the weeds have contributed to the drying up of shallow seasonal lakes. Strategies for improving water and wetlands resources Reform of the water sector Water resources management has over the years focused on water supply with little emphasis on the water resources management issues such as the monitoring of water resources, evaluation of aquifers and others. With the reform of the water sector, transferring the water supply and sanitation functions to the Ministry of Infrastructure (MININFRA) with MINIRENA retaining the resources management and regulation functions, a better management of water resources is envisaged (MINIRENA 2008). Under the EDPRS, water resources utilization for growth is expected to increase, as more land will be put under irrigation; more hydro-power generation potential will be exploited; and more industrial activities is anticipated (especially the water-intensive washed coffee processing). Strategic natural water bodies will be exploited for recreation including hotels and other recreation facilities. All these potentially imply more water abstraction that requires a rational management regime (MINIRENA 2008). Improving wetlands management Rwanda does not have a wetlands policy and wetlands are currently being managed under the Environmental Organic Law and the Land Law. Conservation of wetlands in vital particularly in protecting and promoting wetlands normal functions. Using a watershed approach appears to be the best strategy for the management and rehabilitation of wetlands in Rwanda. Such an approach would be designed to (i) restore the protection benefits; (ii) limit negative effects on transboundary water resources; and (iii) conserve biodiversity in both natural and modified environments (Chemonics International Inc. 2003). It is this approach which is proposed for four major complex wetlands considered to be critical ecosystems, Kamiranzovu wetland in western province, Rweru-Mugesera wetland in Eastern province, Rugezi-Ruhondo wetland shared by Musanze and Gicumbi in Northern provinces, and Akagera wetland shared by Kibungo and Umutara in Eastern province, under a GEF/WB project (Integrated Management of Critical Ecosystems). Although wetlands management is prioritised in some Districts Development Plans, distances along river shores of respectively 10 meters for crops and 20 meters for housing are not always respected. Around some marshlands, buffer zones of 50 meters have been delineated and agro-forestry species have been planted, still annual crops often continue to be planted between trees and even between the wooded strips and in the marshlands and the buffer zones cannot serve their purpose of erosion control and protection against flooding.

17
Experience has demonstrated that initiatives aimed at wetland conservation and management must be recognized as a long term process that aims at building a strong knowledge base. Uses that involve some level of modification of the original state of wetlands must be accepted as management options, subject to ensuring the maintenance of essential hydrological, ecological or other system functions. Capacity for wetlands management must be built at all levels to address institutional sustainability, ownership, user rights and access.
Protection of river banks is essential for the integrity of the water and wetlands resources
Photo credit: REMA
Improving water management With regards to water management, there is a need to establish a comprehensive database which will allow control and maintenance of data integrity and at the same time allow regular update of information on national water quality and quantity. Only 22 out of an existing 69 hydrological stations have been in operation since the beginning of 2008. The rest are not fully functional. This state highlights the need for immediate action as follows: • The stations have to be under the overall supervision of a permanent institution with the
mandate and capacity to regularly collect and process information on water. • An inventory needs to be conducted to ascertain the conditions of the existing stations.
The inventory will point out the stations that need repairs and re-equipping especially since the change in water levels and general water resource conditions rendered some stations irrelevant and unproductive.
• A survey needs to be conducted to locate other appropriate (new) sites for the establishment of water monitoring stations in addition to the existing ones.

18
• The stations should all be equipped to also measure water quality parameters without limiting the measurements to water level, discharge rate and turbidity (in a few cases) as is currently being done.
Addressing water pollution To address the problem of water pollution, there is a need to establish standards and regulations to control industrial waste. Efforts should be made to implement cleaner production methods for all industries and this could preferably be coupled with the ‘polluter pays’ principle that will ensure that all polluting industries take responsibility of their actions and take on a more positive role towards the reduction of pollution of water resources and the environment as a whole. Relevant institutions like REMA, the Rwanda Utilities Regulatory Authority and the Rwanda Bureau of Standards should be sufficiently equipped with skills and the resources to monitor the enforcement and compliance of all industries with the regulations. Conclusion Water directly influences the quality of people’s life, their health and productivity. Access to clean and safe water is vital for good health and for various economic activities. Although Rwanda possesses abundant water resources, the distribution of drinkable water is still inadequate. Wetlands provide an important function of water treatment and purification and serve as sources of water for the lakes and connecting rivers in the country. But they, too, are under pressure from many sources. Over the years, there have been various challenges in the water sector in Rwanda. A number of responses including the reform of the water sector and improved management of water and wetlands resources including development of standards and regulations are being implemented and should lead to improvements. Relevant institutions like REMA, RURA and RBS should be sufficiently equipped with skills and the resources to monitor the enforcement and compliance of all industries with the regulations. References AQUASTAT(2005). Systèmes d’information de la FAO sur l’eau et l’agriculture/. Food and Agriculture Organization of the United Nations (FAO), Rome. Baligira R. (2007). Examen critique et enquête de l’état de la gestion des données de la qualité de l’eau au Rwanda ainsi que les recommandations pour son amélioration., Nile Transboundary Environmental Action Project, Nile Basin Initiative (NBI), Kigali. Chemonics International Inc. (2008). Rwanda Environmental Threats and Opportunities Assessment 2008 Update. EPIQ IQC Contract No. EPP-I-00-03-00014-00, Task Order 02. Biodiversity Analysis and Technical Support for USAID/Africa, USAID, Kigali. Kabalisa V. P., (2006). Analyse contextuelle en matière de Gestion Intégrée des Ressources en Eau au Rwanda, Document de Travail pour l’ONG Protos (Rapport final). MINAGRI (2008). Strategic Plan for the Transformation of Agriculture in Rwanda – phase II (PASTA II). Ministry of Agriculture and Animal Resources (MINAGRI), Kigali. MINIFRA (2003). Stratégie nationale en matière de la qualité des ressources en eau au Rwanda (SNAQUE). Ministères des Infrastructures (MININFRA), Kigali.
19
MINIRENA (2008): Five-Year Strategic Plan For The Environment And Natural Resources Sector (2009 – 2013). Ministry of Natural Resources (MINIRENA), Kigali. MINITERE (2005). Rapport du Projet de Gestion Nationale des Ressources en Eau. Composantes D : Etudes Techniques. Ministère des Terres, de l’Environnement, des Forêts, de l’Eau et des Mines (MINITERE), Kigali. NBI (2005). National Nile Basin Water Quality Monitoring Report for Rwanda. Nile Transboundary Environmental Action Project, Nile Basin Initiative (NBI), Kigali. NUR (2002). Les polluants des eaux du Rwanda et leur impact sur l’environnement sous régional. Commission de recherche de l’Université Nationale du Rwanda (NUR), Kigali. PGNRE (2005). Connaissance et Gestion des données sur l’eau au Rwanda. Etudes techniques Rapport général. Projet de Gestion Nationale des Ressources en Eau (PGNRE), Kigali, 2005 REMA (2006). Economic Analysis Of Natural Resource Management In Rwanda. Rwanda Environment Management Authority (REMA), Kigali. REMA (2008). Etablissement d’un inventaire national rapide des marais et élaboration de cinq avant projets d’arrêts ministériels relatifs aux marais (4 modules). Draft. Office Rwandais de Protection de l’Environnement (REMA), Kigali.