Chapter 7 Hydraulic Model Updates - Modesto, CA
17
7-1 City of Modesto September 2017 Water Master Plan o\c\418\02-14-36\wp\mp\100814_7Ch7 CHAPTER 7 Hydraulic Model Updates (Contiguous Service Area) The City currently has a hydraulic model developed to simulate its contiguous water system performance. As part of this WMP, the City’s existing contiguous water system hydraulic model was updated to accurately reflect existing water system conditions. This Chapter describes the updates, calibration, and verification of the City’s existing contiguous water system hydraulic model. The resulting updated hydraulic model was subsequently used to evaluate the adequacy of both the existing and future contiguous water systems (Chapter 8 and 9 respectively). The hydraulic model updates, calibration, and verification efforts are described below in the following sections: • Current Hydraulic Model Description • Recommended Model and GIS Mapping Protocols • Hydraulic Model Update Methodology • Hydraulic Model Updates • Hydraulic Model Calibration (Steady-State) • Hydraulic Model Validation (Extended Period Simulation) 7.1 CURRENT HYDRAULIC MODEL DESCRIPTION The City’s current hydraulic model of its existing contiguous water system was developed in 2003 1 by West Yost. Additional updates to the City’s hydraulic model were completed in 2007 as part of the 2010 Engineer’s Report 2 , which captured improvements to the contiguous water system up to about 2006. In 2010, the contiguous system hydraulic model was converted from Innovyze’s H2OMap® software to the InfoWater® software and provided to the City. Since 2010, City staff has been updating the hydraulic model on an “as -needed” basis, typically as part of specific hydraulic modeling investigations by City staff. As part of the development of this WMP, a comprehensive hydraulic model update was undertaken to incorporate new or changed pipeline facilities that were constructed since about 2006. The model is currently not an all-pipe model, and generally does not include pipelines that are 4-inches in diameter or less (though some small diameter pipelines were included for model refinement). These updates will improve the model and make it more representative of the City’s existing contiguous water system by adding new distribution, transmission, and looping pipelines not previously included in the model. 1 City of Modesto Hydraulic Model Development, Calibration and Verification, West Yost, August 23, 2003. 2 City of Modesto 2010 Water System’s Engineer’s Report, Appendix A, West Yost, October 5, 2009.
Transcript of Chapter 7 Hydraulic Model Updates - Modesto, CA
7-1 City of Modesto
September 2017 Water Master Plan o\c\418\02-14-36\wp\mp\100814_7Ch7
CHAPTER 7
Hydraulic Model Updates (Contiguous Service Area)
The City currently has a hydraulic model developed to simulate its contiguous water system
performance. As part of this WMP, the City’s existing contiguous water system hydraulic model
was updated to accurately reflect existing water system conditions. This Chapter describes the
updates, calibration, and verification of the City’s existing contiguous water system hydraulic
model. The resulting updated hydraulic model was subsequently used to evaluate the adequacy
of both the existing and future contiguous water systems (Chapter 8 and 9 respectively).
The hydraulic model updates, calibration, and verification efforts are described below in the
following sections:
• Current Hydraulic Model Description
• Recommended Model and GIS Mapping Protocols
• Hydraulic Model Update Methodology
• Hydraulic Model Updates
• Hydraulic Model Calibration (Steady-State)
• Hydraulic Model Validation (Extended Period Simulation)
7.1 CURRENT HYDRAULIC MODEL DESCRIPTION
The City’s current hydraulic model of its existing contiguous water system was developed in
20031 by West Yost. Additional updates to the City’s hydraulic model were completed in 2007
as part of the 2010 Engineer’s Report2, which captured improvements to the contiguous water
system up to about 2006. In 2010, the contiguous system hydraulic model was converted from
Innovyze’s H2OMap® software to the InfoWater® software and provided to the City. Since
2010, City staff has been updating the hydraulic model on an “as-needed” basis, typically as part
of specific hydraulic modeling investigations by City staff.
As part of the development of this WMP, a comprehensive hydraulic model update was
undertaken to incorporate new or changed pipeline facilities that were constructed since about
2006. The model is currently not an all-pipe model, and generally does not include pipelines that
are 4-inches in diameter or less (though some small diameter pipelines were included for model
refinement). These updates will improve the model and make it more representative of the City’s
existing contiguous water system by adding new distribution, transmission, and looping pipelines
not previously included in the model.
1 City of Modesto Hydraulic Model Development, Calibration and Verification, West Yost, August 23, 2003.
2 City of Modesto 2010 Water System’s Engineer’s Report, Appendix A, West Yost, October 5, 2009.
Chapter 7 Hydraulic Model Updates (Contiguous Service Area)
7-2 City of Modesto
September 2017 Water Master Plan o\c\418\02-14-36\wp\mp\100814_7Ch7
In addition to these pipeline updates, new water system facilities (i.e., new wells and Tier 2
improvements) were incorporated and demands in the hydraulic model were re-allocated based
on existing (2013) water demands using spatially-located water meter and flat account data.
Once the existing contiguous water system hydraulic model was updated, additional work was
performed to calibrate and verify its capability of representing the current network. These tasks
are discussed in more detail below.
7.2 RECOMMENDED MODEL AND GIS MAPPING PROTOCOLS
As part of the overall update the hydraulic model, West Yost collaborated with City staff to
develop recommended model and GIS protocols that will allow the City, as it moves forward, to
develop an all-pipe model that has a one-to-one relationship with the City’s water system GIS
pipeline data. The overall goal of the model and GIS protocols is to streamline hydraulic model
updates so that the hydraulic model could be updated efficiently and regularly to reflect newly
installed/modified water system pipelines and facility conditions.
West Yost prepared a Technical Memorandum (TM) summarizing the recommended model and
GIS mapping protocols on November 13, 2014 (see Appendix J).
7.3 HYDRAULIC MODEL UPDATE METHODOLOGY
To update the existing contiguous water system hydraulic model, West Yost performed the
following tasks:
• Developed hydraulic model management and documentation protocols and GIS and
hydraulic model linkages in an effort to maintain an up-to-date hydraulic model;
• Updated existing pipelines and added new pipelines;
• Updated existing and added new water system facilities (e.g., storage reservoirs,
pressure regulating stations (control valves), wells and pump stations);
• Allocated existing water demands using the City’s spatially-located meter and flat
account information; and
• Calibrated and verified that the hydraulic model system configuration is generally
representative of the City’s current water system based on system pressures, flows,
and tank elevations observed in the field and from the SCADA system.
To accomplish these tasks, West Yost worked closely with City Engineering and Operations staff
to obtain and review the following:
• Information on existing storage tanks, booster pump stations, wells, pressure
regulating stations, and other water supply facilities;
• Drawings associated with recent water system improvements from the City’s
As-Built Vaults (the majority of projects were found in Vaults 8, 9, and 10);
Chapter 7 Hydraulic Model Updates (Contiguous Service Area)
7-3 City of Modesto
September 2017 Water Master Plan o\c\418\02-14-36\wp\mp\100814_7Ch7
• City’s GIS database (last updated on 1/21/2015) of water system facilities
(e.g., pipelines, wells, pump stations, etc.);
• City Water Operations staff field notes and mapbooks;
• Metered account and flat rate account information; and
• Historical SCADA system data.
7.4 HYDRAULIC MODEL UPDATES
The following subsections summarize the tasks completed to update the City’s current hydraulic
model for the contiguous water system.
7.4.1 Review of Existing Water System Facilities
Based on a review of the available facilities data on the existing contiguous water system,
provided to West Yost by City staff, the following facilities have been added or updated in the
City’s current contiguous water system hydraulic model:
• Transmission pipelines along the Virginia Corridor;
• Transmission pipelines in South Modesto;
• Various pipeline replacements throughout the contiguous service area;
• New pipeline installation by the City and developers;
• Pipelines with incorrect diameters (based on the City’s most recent geodatabase, and
City Water Operations staff input) and/or C-factors;
• Miscellaneous small diameter looping pipelines;
• Well 63 (McKinley Park);
• Well 66 (Tank 10 Fill Well);
• Facilities associated with Tier 2 Downstream Water System Improvements; and
• Well pump curves, design points, and well pumping levels (updated to reflect pump
test data from October and November 2014).
West Yost reviewed drawings provided by the City and updated the City’s existing contiguous
hydraulic model to reflect the as-built drawings. After the model pipelines were updated to
reflect the as-built drawings, they were then compared to the City’s GIS database (dated
1/21/2015). Inconsistencies between the two were identified and provided to City Water
Operations staff on large-scale maps to facilitate review and comment. The model was then
further updated to incorporate review comments by City Water Operations staff.
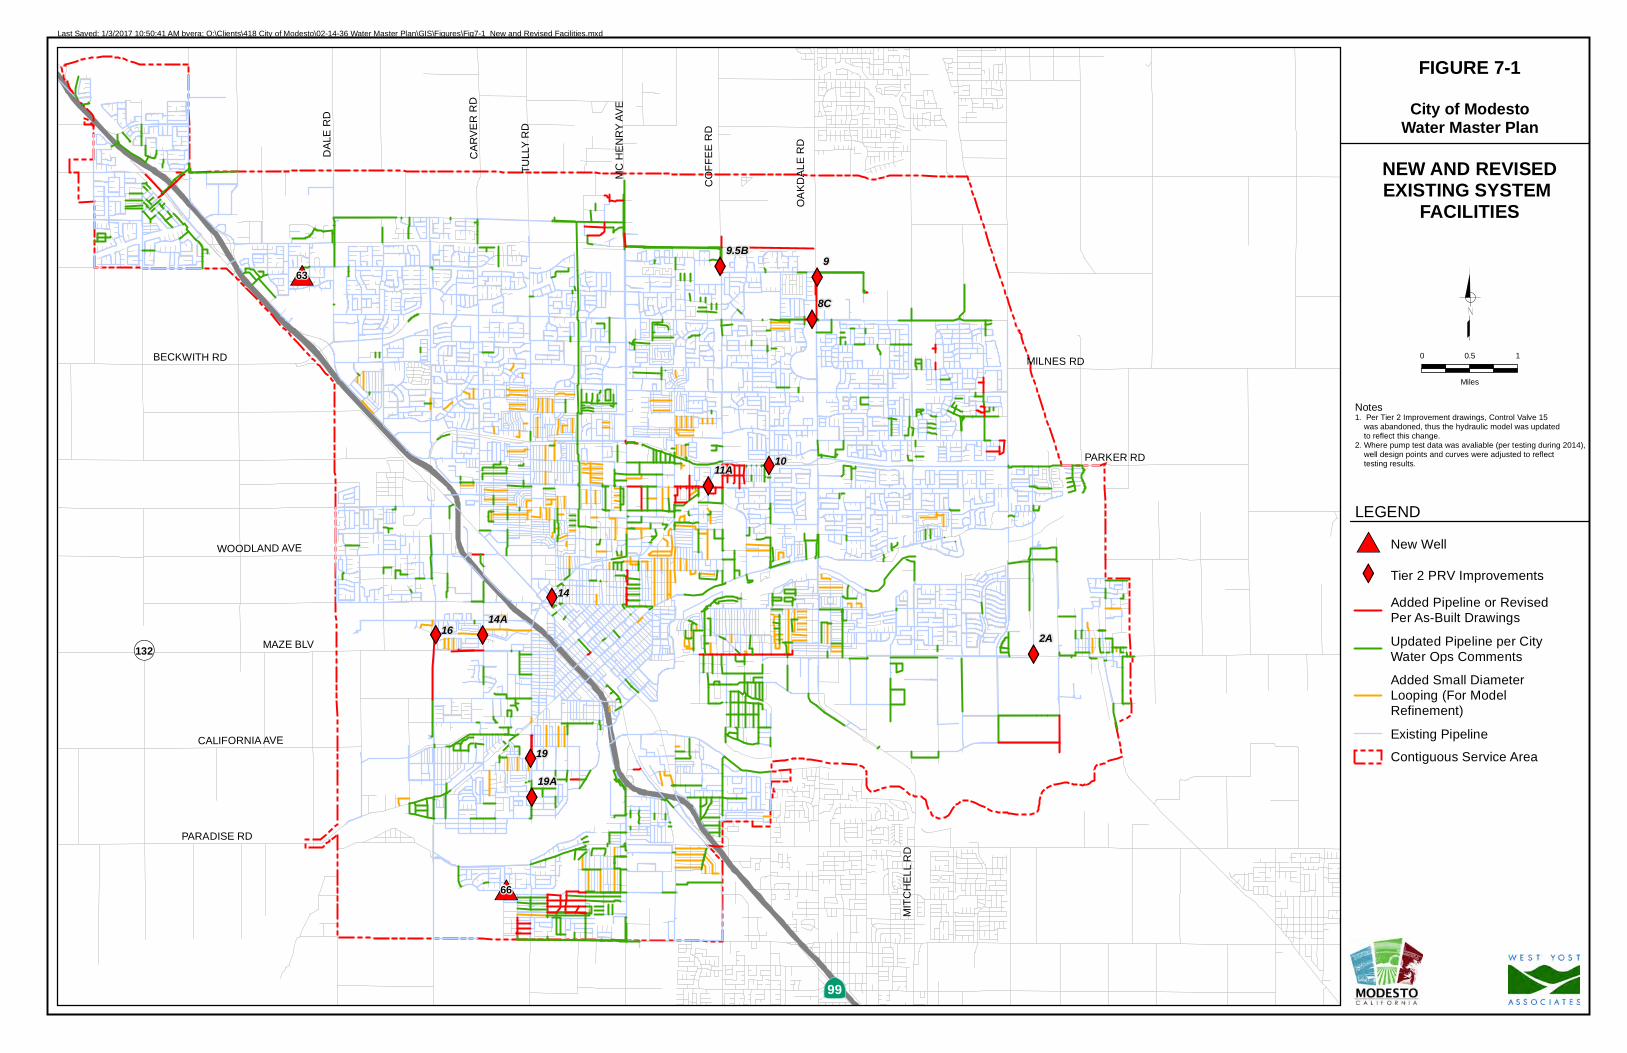
The locations of the new and revised system facilities listed above that have been incorporated
into the current model to accurately represent the City’s existing contiguous distribution system
are shown on Figure 7-1.
Chapter 7 Hydraulic Model Updates (Contiguous Service Area)
7-4 City of Modesto
September 2017 Water Master Plan o\c\418\02-14-36\wp\mp\100814_7Ch7
7.4.2 Water Demand Allocation
Water demands were allocated in the hydraulic model using the spatially-located water meter
and flat rate account data described in Chapter 3. InfoWater’s® Demand Allocator Tool
automatically assigns the spatially-located demand point to the closest pipeline node in the water
system. West Yost staff then reviewed the allocated water demand to confirm that the demands
were allocated properly.
Water demand within the hydraulic model was allocated by account type to provide City staff
with additional flexibility in the model. Table 7-1 presents the demand column assigned to each
account type within the hydraulic model.
Table 7-1. Account Type Assignment
Account Type Demand Column in Model(a)
Metered Accounts 1
Flat Rate Accounts 2
Buildout Demands 3
(a) Column number corresponds to Demand # Column in the junction database of the InfoWater Model.
7.5 HYDRAULIC MODEL CALIBRATION (STEADY-STATE)
The City’s hydraulic model was calibrated to confirm that the computer simulation model can
accurately represent the operation of the City’s contiguous water system under varying
conditions. West Yost prepared a TM summarizing the recommended hydrant test locations and
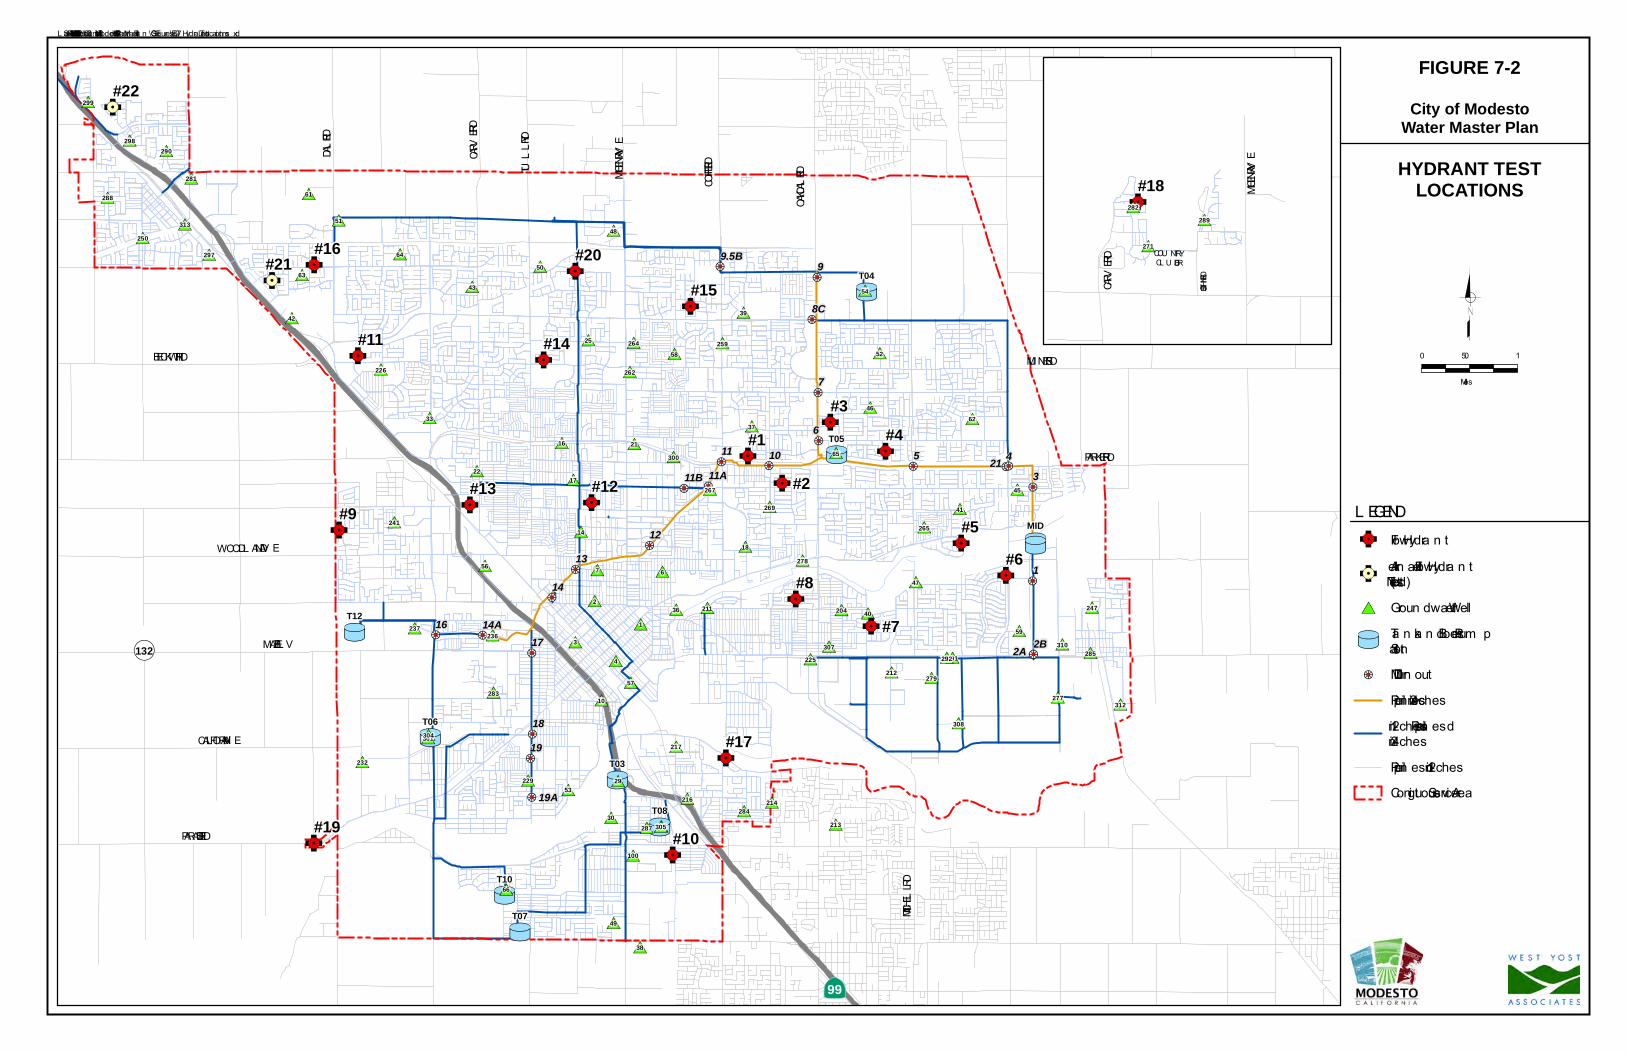
procedures on June 19, 2015 (see Appendix K). A summary of the hydrant tests, results, and
hydraulic model calibration, findings, and conclusions is presented below.
7.5.1 Development of Hydrant (C-Factor) Tests
Locations were chosen for possible hydrant flow testing as shown on Figure 7-2. Selection of
these hydrant test sites was primarily based on pipeline size, material and age. However, hydrant
test locations also considered proximity to drainage features or nearby beneficial uses
(e.g., parks, storm drain basins, open lots, etc.), repeat tests3 and overall coverage of the City’s
contiguous area. These hydrant tests were used to evaluate pipeline friction coefficients
(C-Factors) currently assigned in the model4, C-Factors assigned to new pipelines, and to ensure
that the hydraulic model closely represented actual observed pressure conditions in the field.
3 Tests identified as a “Repeat Test” are repeat tests from the Hydraulic Model Development, Calibration and
Verification Technical Memorandum completed by West Yost in 2003. The purpose of repeating the hydrant test is
to confirm or compare the assigned C-Factor determined in the 2003 calibration effort.
4 C-Factors currently assigned in the model are based on Table 6 from the Hydraulic Model Development,
Calibration and Verification Technical Memorandum completed by West Yost in 2003.
Chapter 7 Hydraulic Model Updates (Contiguous Service Area)
7-5 City of Modesto
September 2017 Water Master Plan o\c\418\02-14-36\wp\mp\100814_7Ch7
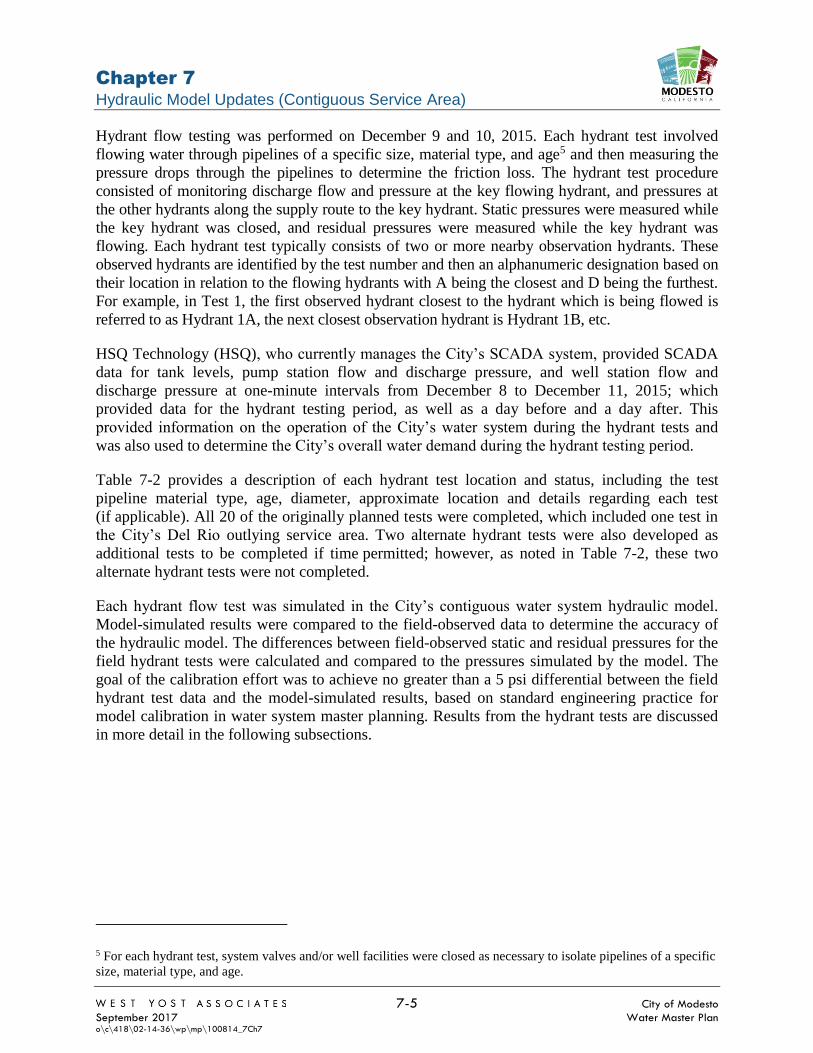
Hydrant flow testing was performed on December 9 and 10, 2015. Each hydrant test involved
flowing water through pipelines of a specific size, material type, and age5 and then measuring the
pressure drops through the pipelines to determine the friction loss. The hydrant test procedure
consisted of monitoring discharge flow and pressure at the key flowing hydrant, and pressures at
the other hydrants along the supply route to the key hydrant. Static pressures were measured while
the key hydrant was closed, and residual pressures were measured while the key hydrant was
flowing. Each hydrant test typically consists of two or more nearby observation hydrants. These
observed hydrants are identified by the test number and then an alphanumeric designation based on
their location in relation to the flowing hydrants with A being the closest and D being the furthest.
For example, in Test 1, the first observed hydrant closest to the hydrant which is being flowed is
referred to as Hydrant 1A, the next closest observation hydrant is Hydrant 1B, etc.
HSQ Technology (HSQ), who currently manages the City’s SCADA system, provided SCADA
data for tank levels, pump station flow and discharge pressure, and well station flow and
discharge pressure at one-minute intervals from December 8 to December 11, 2015; which
provided data for the hydrant testing period, as well as a day before and a day after. This
provided information on the operation of the City’s water system during the hydrant tests and
was also used to determine the City’s overall water demand during the hydrant testing period.
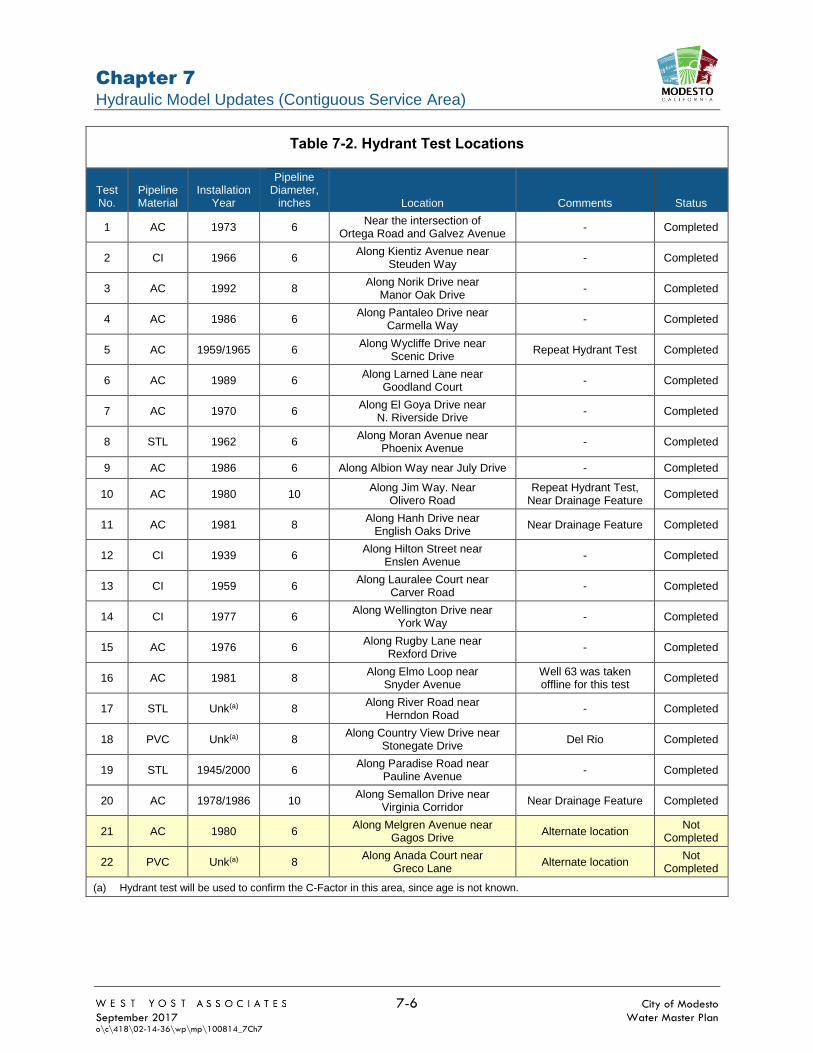
Table 7-2 provides a description of each hydrant test location and status, including the test
pipeline material type, age, diameter, approximate location and details regarding each test
(if applicable). All 20 of the originally planned tests were completed, which included one test in
the City’s Del Rio outlying service area. Two alternate hydrant tests were also developed as
additional tests to be completed if time permitted; however, as noted in Table 7-2, these two
alternate hydrant tests were not completed.
Each hydrant flow test was simulated in the City’s contiguous water system hydraulic model.
Model-simulated results were compared to the field-observed data to determine the accuracy of
the hydraulic model. The differences between field-observed static and residual pressures for the
field hydrant tests were calculated and compared to the pressures simulated by the model. The
goal of the calibration effort was to achieve no greater than a 5 psi differential between the field
hydrant test data and the model-simulated results, based on standard engineering practice for
model calibration in water system master planning. Results from the hydrant tests are discussed
in more detail in the following subsections.
5 For each hydrant test, system valves and/or well facilities were closed as necessary to isolate pipelines of a specific
size, material type, and age.
Chapter 7 Hydraulic Model Updates (Contiguous Service Area)
7-6 City of Modesto
September 2017 Water Master Plan o\c\418\02-14-36\wp\mp\100814_7Ch7
Table 7-2. Hydrant Test Locations
Test No.
Pipeline Material
Installation Year
Pipeline Diameter,
inches Location Comments Status
1 AC 1973 6 Near the intersection of
Ortega Road and Galvez Avenue - Completed
2 CI 1966 6 Along Kientiz Avenue near
Steuden Way - Completed
3 AC 1992 8 Along Norik Drive near
Manor Oak Drive - Completed
4 AC 1986 6 Along Pantaleo Drive near
Carmella Way - Completed
5 AC 1959/1965 6 Along Wycliffe Drive near
Scenic Drive Repeat Hydrant Test Completed
6 AC 1989 6 Along Larned Lane near
Goodland Court - Completed
7 AC 1970 6 Along El Goya Drive near
N. Riverside Drive - Completed
8 STL 1962 6 Along Moran Avenue near
Phoenix Avenue - Completed
9 AC 1986 6 Along Albion Way near July Drive - Completed
10 AC 1980 10 Along Jim Way. Near
Olivero Road Repeat Hydrant Test,
Near Drainage Feature Completed
11 AC 1981 8 Along Hanh Drive near
English Oaks Drive Near Drainage Feature Completed
12 CI 1939 6 Along Hilton Street near
Enslen Avenue - Completed
13 CI 1959 6 Along Lauralee Court near
Carver Road - Completed
14 CI 1977 6 Along Wellington Drive near
York Way - Completed
15 AC 1976 6 Along Rugby Lane near
Rexford Drive - Completed
16 AC 1981 8 Along Elmo Loop near
Snyder Avenue Well 63 was taken offline for this test
Completed
17 STL Unk(a) 8 Along River Road near
Herndon Road - Completed
18 PVC Unk(a) 8 Along Country View Drive near
Stonegate Drive Del Rio Completed
19 STL 1945/2000 6 Along Paradise Road near
Pauline Avenue - Completed
20 AC 1978/1986 10 Along Semallon Drive near
Virginia Corridor Near Drainage Feature Completed
21 AC 1980 6 Along Melgren Avenue near
Gagos Drive Alternate location
Not Completed
22 PVC Unk(a) 8 Along Anada Court near
Greco Lane Alternate location
Not Completed
(a) Hydrant test will be used to confirm the C-Factor in this area, since age is not known.
Chapter 7 Hydraulic Model Updates (Contiguous Service Area)
7-7 City of Modesto
September 2017 Water Master Plan o\c\418\02-14-36\wp\mp\100814_7Ch7
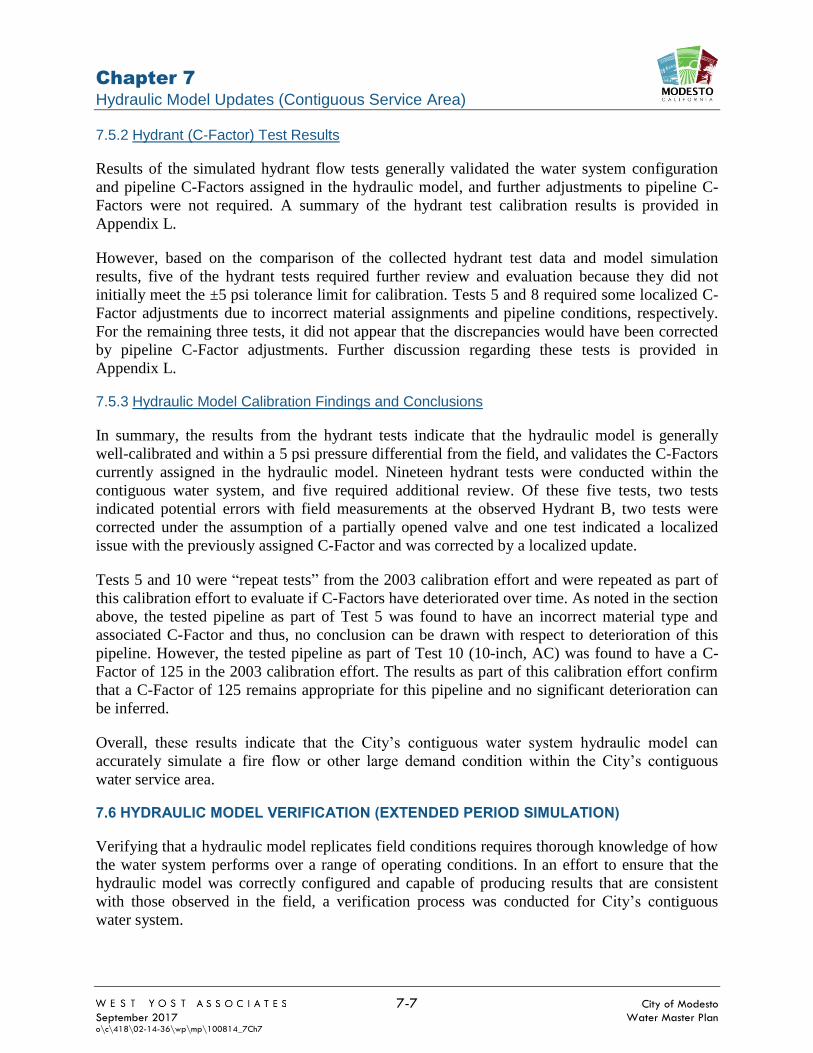
7.5.2 Hydrant (C-Factor) Test Results
Results of the simulated hydrant flow tests generally validated the water system configuration
and pipeline C-Factors assigned in the hydraulic model, and further adjustments to pipeline C-
Factors were not required. A summary of the hydrant test calibration results is provided in
Appendix L.
However, based on the comparison of the collected hydrant test data and model simulation
results, five of the hydrant tests required further review and evaluation because they did not
initially meet the ±5 psi tolerance limit for calibration. Tests 5 and 8 required some localized C-
Factor adjustments due to incorrect material assignments and pipeline conditions, respectively.
For the remaining three tests, it did not appear that the discrepancies would have been corrected
by pipeline C-Factor adjustments. Further discussion regarding these tests is provided in
Appendix L.
7.5.3 Hydraulic Model Calibration Findings and Conclusions
In summary, the results from the hydrant tests indicate that the hydraulic model is generally
well-calibrated and within a 5 psi pressure differential from the field, and validates the C-Factors
currently assigned in the hydraulic model. Nineteen hydrant tests were conducted within the
contiguous water system, and five required additional review. Of these five tests, two tests
indicated potential errors with field measurements at the observed Hydrant B, two tests were
corrected under the assumption of a partially opened valve and one test indicated a localized
issue with the previously assigned C-Factor and was corrected by a localized update.
Tests 5 and 10 were “repeat tests” from the 2003 calibration effort and were repeated as part of
this calibration effort to evaluate if C-Factors have deteriorated over time. As noted in the section
above, the tested pipeline as part of Test 5 was found to have an incorrect material type and
associated C-Factor and thus, no conclusion can be drawn with respect to deterioration of this
pipeline. However, the tested pipeline as part of Test 10 (10-inch, AC) was found to have a C-
Factor of 125 in the 2003 calibration effort. The results as part of this calibration effort confirm
that a C-Factor of 125 remains appropriate for this pipeline and no significant deterioration can
be inferred.
Overall, these results indicate that the City’s contiguous water system hydraulic model can
accurately simulate a fire flow or other large demand condition within the City’s contiguous
water service area.
7.6 HYDRAULIC MODEL VERIFICATION (EXTENDED PERIOD SIMULATION)
Verifying that a hydraulic model replicates field conditions requires thorough knowledge of how
the water system performs over a range of operating conditions. In an effort to ensure that the
hydraulic model was correctly configured and capable of producing results that are consistent
with those observed in the field, a verification process was conducted for City’s contiguous
water system.
Chapter 7 Hydraulic Model Updates (Contiguous Service Area)
7-8 City of Modesto
September 2017 Water Master Plan o\c\418\02-14-36\wp\mp\100814_7Ch7
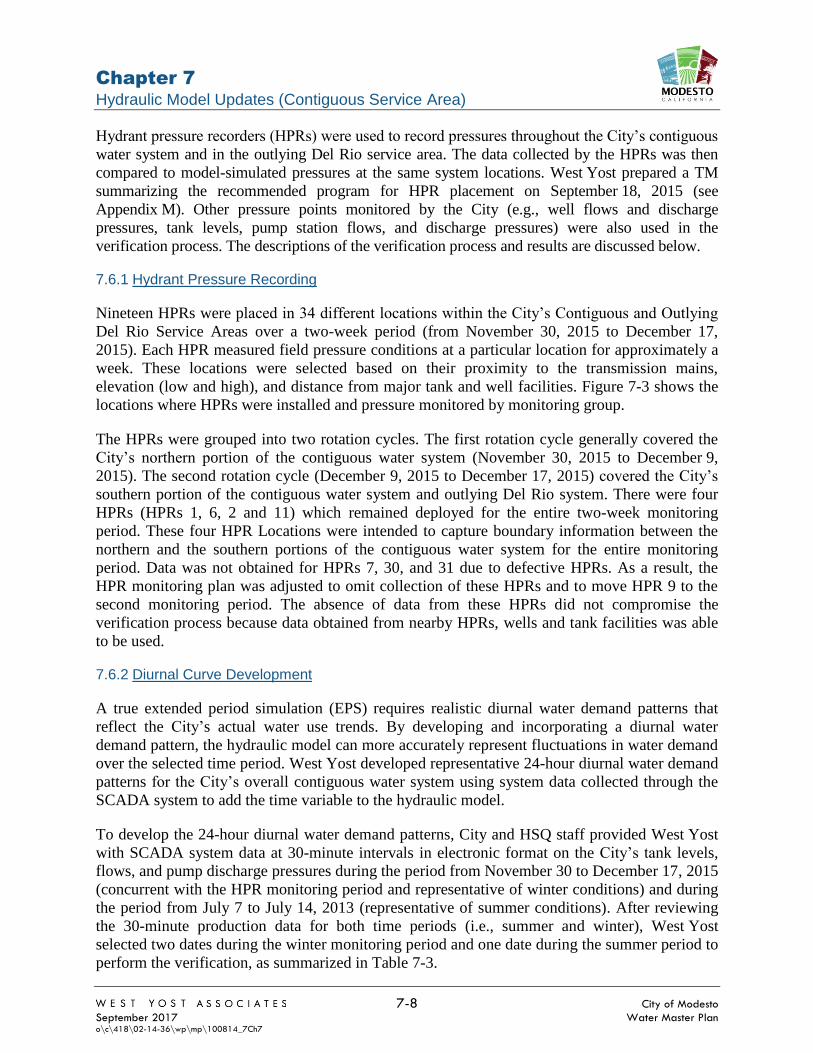
Hydrant pressure recorders (HPRs) were used to record pressures throughout the City’s contiguous
water system and in the outlying Del Rio service area. The data collected by the HPRs was then
compared to model-simulated pressures at the same system locations. West Yost prepared a TM
summarizing the recommended program for HPR placement on September 18, 2015 (see
Appendix M). Other pressure points monitored by the City (e.g., well flows and discharge
pressures, tank levels, pump station flows, and discharge pressures) were also used in the
verification process. The descriptions of the verification process and results are discussed below.
7.6.1 Hydrant Pressure Recording
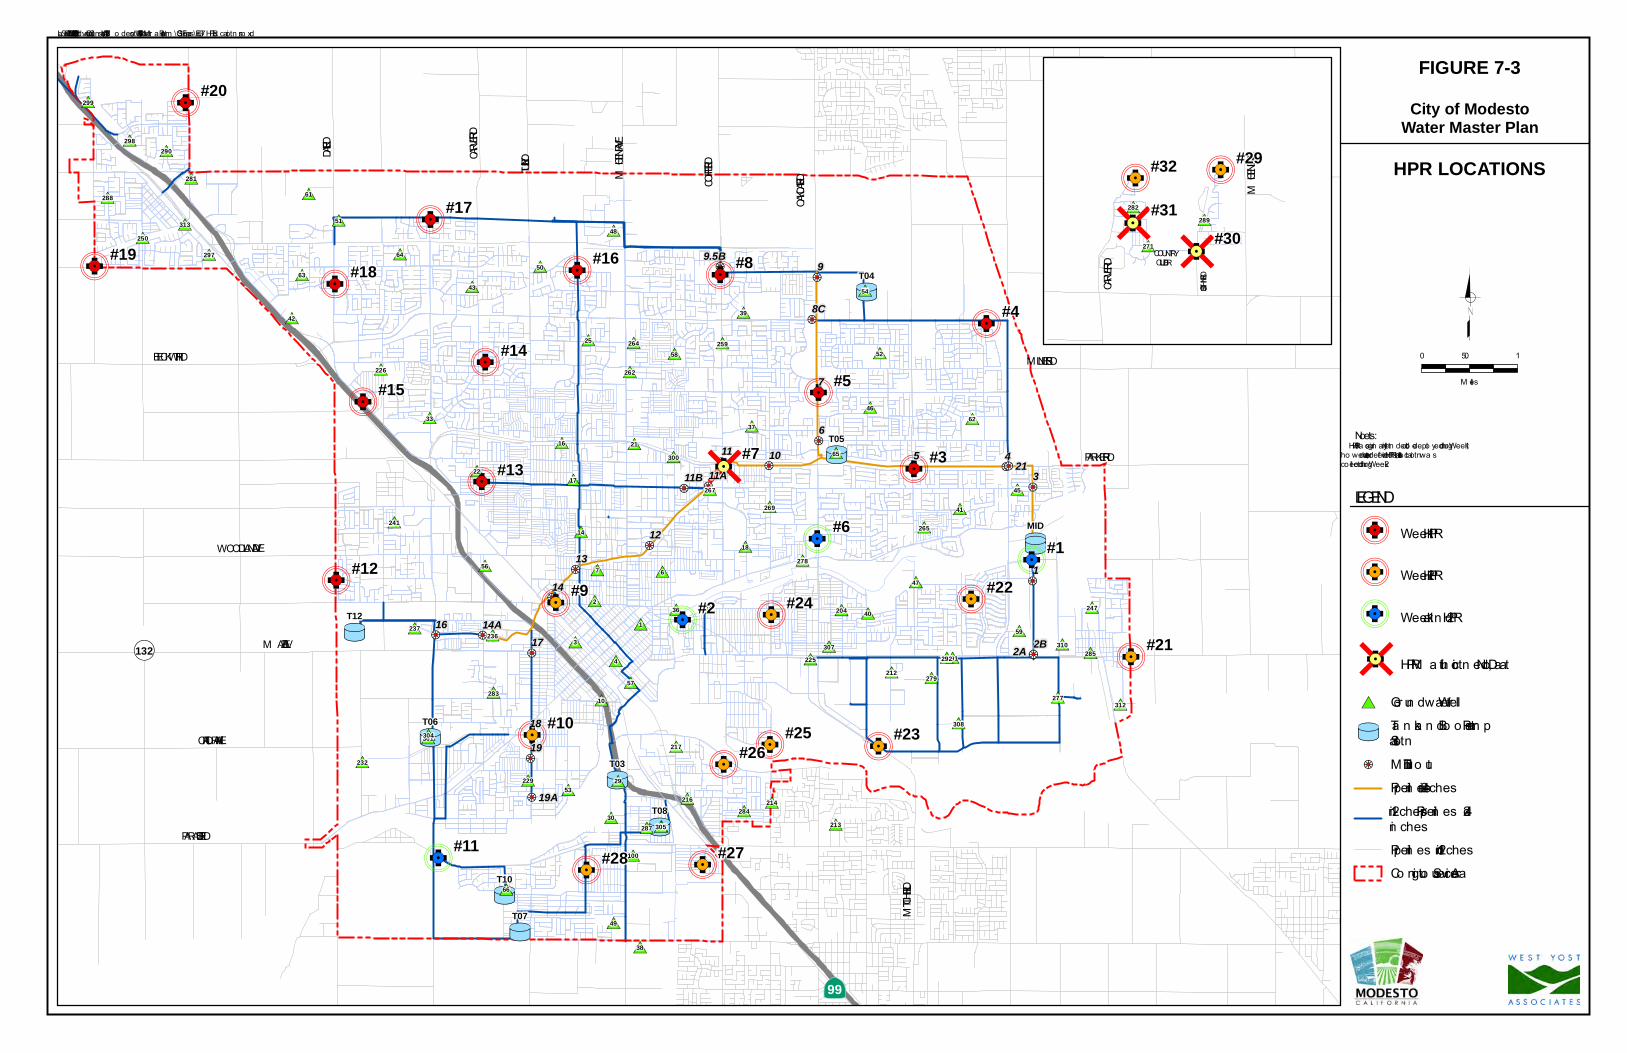
Nineteen HPRs were placed in 34 different locations within the City’s Contiguous and Outlying
Del Rio Service Areas over a two-week period (from November 30, 2015 to December 17,
2015). Each HPR measured field pressure conditions at a particular location for approximately a
week. These locations were selected based on their proximity to the transmission mains,
elevation (low and high), and distance from major tank and well facilities. Figure 7-3 shows the
locations where HPRs were installed and pressure monitored by monitoring group.
The HPRs were grouped into two rotation cycles. The first rotation cycle generally covered the
City’s northern portion of the contiguous water system (November 30, 2015 to December 9,
2015). The second rotation cycle (December 9, 2015 to December 17, 2015) covered the City’s
southern portion of the contiguous water system and outlying Del Rio system. There were four
HPRs (HPRs 1, 6, 2 and 11) which remained deployed for the entire two-week monitoring
period. These four HPR Locations were intended to capture boundary information between the
northern and the southern portions of the contiguous water system for the entire monitoring
period. Data was not obtained for HPRs 7, 30, and 31 due to defective HPRs. As a result, the
HPR monitoring plan was adjusted to omit collection of these HPRs and to move HPR 9 to the
second monitoring period. The absence of data from these HPRs did not compromise the
verification process because data obtained from nearby HPRs, wells and tank facilities was able
to be used.
7.6.2 Diurnal Curve Development
A true extended period simulation (EPS) requires realistic diurnal water demand patterns that
reflect the City’s actual water use trends. By developing and incorporating a diurnal water
demand pattern, the hydraulic model can more accurately represent fluctuations in water demand
over the selected time period. West Yost developed representative 24-hour diurnal water demand
patterns for the City’s overall contiguous water system using system data collected through the
SCADA system to add the time variable to the hydraulic model.
To develop the 24-hour diurnal water demand patterns, City and HSQ staff provided West Yost
with SCADA system data at 30-minute intervals in electronic format on the City’s tank levels,
flows, and pump discharge pressures during the period from November 30 to December 17, 2015
(concurrent with the HPR monitoring period and representative of winter conditions) and during
the period from July 7 to July 14, 2013 (representative of summer conditions). After reviewing
the 30-minute production data for both time periods (i.e., summer and winter), West Yost
selected two dates during the winter monitoring period and one date during the summer period to
perform the verification, as summarized in Table 7-3.
Chapter 7 Hydraulic Model Updates (Contiguous Service Area)
7-9 City of Modesto
September 2017 Water Master Plan o\c\418\02-14-36\wp\mp\100814_7Ch7
Table 7-3. Summary of Verification Dates
Water Demand Scenario Time Frame
Winter: HPR Rotation 1 December 3, 2015
Winter: HPR Rotation 2 December 15, 2015
Summer July 9, 2013
The winter verification dates were selected because HPRs were deployed in two cycles and thus,
one day within each rotation cycle was selected. For the summer, the date selected was
concurrent with the peak demand during the two weeks of summer data provided. West Yost
subsequently developed 24-hour diurnal water demand patterns for each of these dates and
integrated them into the hydraulic model. A separate EPS was then performed for each of the
diurnal water demand patterns. The primary purpose of the verification was to verify that the
model can generally replicate the City’s well and tank facilities and that pressures generally meet
observed trends and remain within ±5 psi. To verify whether the City’s hydraulic model was
accurately predicting actual water system tank levels, flow and pressures, model-simulated tank
levels, flows and pressures were compared to the field-observed data. Results from the
verification process are discussed below.
7.6.3 Verification Results
As noted above, West Yost evaluated and verified three different demand conditions. Graphs of
the representative comparisons between model-simulated and field-observed tank levels, flows,
and pressures for major facilities are provided in Appendices N, O, and P. Example graphs of the
representative comparisons between model-simulated and field-observed tank levels, flows and
pressures are shown on Figure 7-4 through Figure 7-6. Results from each of the different
verification scenarios are discussed in the sections below.
7.6.3.1 Winter [12/03/2015] Verification Results
Graphs of the representative comparisons between model-simulated and field-observed tank
levels, flows, and pressures for major facilities and HPRs for this verification scenario are
provided in Appendix N. Based on the City’s SCADA system, Terminal Reservoir, Tank 7 and
Tank 3 were offline during this day. Therefore, the entire contiguous water system demand was
met by the remaining contiguous service area tanks and wells.
Graphs of the representative comparisons between model-simulated and field-observed pressures
at each HPR location are provided on Appendix N Figures 1 through 8. As shown by the figures,
the model-simulated pressures trend closely to the field-recorded pressure readings during the
extended period simulation and remain within ±5 psi throughout the entire simulation.
Verification results throughout the entire contiguous service area indicate that model-simulated
flows out of the tank facilities generally trended well. As shown on Appendix N Figures 9 through
17, though flows are not exact, model-simulated tank booster pump station flows trend well with
SCADA recorded flows and nearly all model-simulated discharge pressures are within ±5 psi of
SCADA recorded pressures. Model-simulated tank levels also trended well with SCADA recorded
Chapter 7 Hydraulic Model Updates (Contiguous Service Area)
7-10 City of Modesto
September 2017 Water Master Plan o\c\418\02-14-36\wp\mp\100814_7Ch7
levels. Differences between model-simulated tank levels and SCADA recorded levels can be
attributed to differences in model-simulated flows. Similar to tank and booster pump station
results, model-simulated flows and pressures comparisons at the City’s wells are similar to the
collected SCADA system data. As shown on Appendix N Figures 18 through 27, though flows are
not exact, the model-simulated flow trends follow closely to SCADA recorded flows and nearly all
model-simulated pressures are within ±5 psi of SCADA recorded pressures. Overall, the
comparisons between model-simulated and field-observed data from the City’s wells and tanks
indicate that the model was able to generally replicate field conditions.
7.6.3.2 Winter [12/15/2015] Verification Results
Graphs of the representative comparisons between model-simulated and field-observed tank
levels, flows, and pressures for major facilities and HPRs for this verification scenario are
provided in Appendix O. Based on the City’s SCADA system, Tank 7 and Tank 12 were offline
during this day. Tank 3 only operated during the first two hours and remained offline for the rest
of the day. Terminal Reservoir was online during this verification day and was supplemented by
the remaining tanks and wells. It should be noted that fewer wells were online during this day as
a result of Terminal Reservoir being online.
Graphs of the representative comparisons between model-simulated and field-observed pressures
at each HPR location are provided on Appendix O Figures 1 through 7. As shown by the figures,
the model-simulated pressures trend closely to the field-recorded pressure readings during the
extended period simulation and remain within ±5 psi throughout the entire simulation. It should
be noted that model-simulated (and SCADA recorded) system pressures are much more
stabilized due to the operation of Terminal Reservoir.
Verification results throughout the entire contiguous service area indicate that model-simulated
flows out of the tank facilities generally trended well. As shown on Appendix O Figures 8
through 16, though flows are not exact, model-simulated booster pump station flows trend well
with SCADA recorded flows and nearly all model-simulated discharge pressures are within
±5 psi of SCADA recorded pressures. Model-simulated tank levels also trended well with
SCADA recorded levels. Differences between model-simulated tank levels and SCADA
recorded levels can be attributed to differences in model-simulated flows. Similar to the tank and
booster pump station results, model-simulated flows and pressures comparisons at the City’s
wells are similar to the collected SCADA system data. As shown on Appendix O Figures 17
through 22, though flows are not exact, the model-simulated flow trends follow closely to
SCADA recorded flows and nearly all model-simulated pressures are within ±5 psi of SCADA
recorded pressures. Overall, the comparisons between model-simulated and field-observed data
from the City’s wells and tanks indicate that the model was able to generally replicate
field conditions.
Chapter 7 Hydraulic Model Updates (Contiguous Service Area)
7-11 City of Modesto
September 2017 Water Master Plan o\c\418\02-14-36\wp\mp\100814_7Ch7
7.6.3.3 Summer [07/09/2013] Verification Results
Graphs of the representative comparisons between model-simulated and field-observed tank
levels, flows, and pressures for major facilities for this verification scenario are provided in
Appendix P. Since HPR information is not available to confirm operations of the major facilities,
only pressure comparisons are provided for major facilities to evaluate if the model could
replicate similar pressure trends at major supply facilities during this verification day.
As shown on Appendix P Figures 1 through 15, verification results at the City’s major tank and
well facilities active during this verification day indicate that the model-simulated pressures are
similar to the collected SCADA data. Overall, the comparisons between model-simulated and
field-observed data from the City’s tanks and wells indicate that the model was able to generally
replicate field conditions.
7.6.4 Hydraulic Model Verification Findings and Conclusions
Overall, the results from the hydraulic model verification process validated the existing system
configuration and demand allocation in the hydraulic model. Tank level, pump station flow rate,
and discharge pressure comparisons at nearly all of the City’s operated facilities trended well
with the collected SCADA system data during the three selected 24-hour periods selected.
Comparisons of HPR and model-simulated pressure data also trended well during the two
selected verification days (where HPR data is available).
Based on the results from each of the verification days, it can be concluded that the hydraulic
model provides an accurate operational representation of the City’s existing contiguous water
system, and is suitable for use as a planning and operational tool. However, it is recommended
that the City continue to update and verify the pipeline system configurations in the hydraulic
model as facilities are constructed or replaced, to maintain a hydraulic model that will continue
to accurately represent the City’s existing contiguous water system.
0 10.5
Miles
Notes1. Per Tier 2 Improvement drawings, Control Valve 15 was abandoned, thus the hydraulic model was updated to reflect this change.2. Where pump test data was avaliable (per testing during 2014), well design points and curves were adjusted to reflect testing results.
FIGURE 7-1City of Modesto
Water Master Plan
NEW AND REVISEDEXISTING SYSTEM
FACILITIES
#*
#*
XW XW
XW
XWXW
XW
XW
XWXW
XW
XW
BECKWITH RD
TU
LLY
RD
MC
HE
NR
Y A
VE
CO
FF
EE
RD
WOODLAND AVE
PARADISE RD
MILNES RD
PARKER RD
OA
KD
AL
E R
D
CA
RV
ER
RD
DA
LE
RD
MAZE BLV
CALIFORNIA AVE
MIT
CH
EL
L R
D
ÄÆ99
132
¬«132
63
66
9.5B9
8C
1011A
14
19
14A16
19A
2A
LEGEND
#* New Well
XW Tier 2 PRV Improvements
Added Pipeline or RevisedPer As-Built Drawings
Updated Pipeline per CityWater Ops Comments
Added Small DiameterLooping (For ModelRefinement)
Existing Pipeline
Contiguous Service Area
Last Saved: 1/3/2017 10:50:41 AM bvera; O:\Clients\418 City of Modesto\02-14-36 Water Master Plan\GIS\Figures\Fig7-1_New and Revised Facilities.mxd
0 10.5
Miles
FIGURE 7-2City of Modesto
Water Master Plan
HYDRANT TESTLOCATIONS
UT
UT
UT
UT
UT
UT
UT
UT
UTUT
#*#*
#*
#*
#*
#*
#*
#*
#*
#*
#*
#*
#*
#*
#*
#*
#*
#*
#*
#*
#*
#*
#*
#*
#*#*
#*
#*
#*
#*
#*
#*
#*
#*#*
#*
#*
#*
#*
#*
#*
#*
#*
#*
#* #*
#*
#*
#*
#*
#*
#*
#*
#*
#*
#*
#*
#*
#*
#*
#*
#*
#*#*
#*
#*#*
#*
#*
#*
#*
#*
#*
#*
#*
#*
#*
#*
#*
#*#*
#*
#*
#*#*
#*#*#*
#*
#*
#*
#*
#*
!!2
!!2
!!2
!!2!!2
!!2
!!2
!!2
!!2
!!2
!!2
!!2
!!2
!!2
!!2!!2
!!2
!!2
!!2
!!2
!!2
!!2!!2
!!2
!!2
G!.
G!.G!.
G!.
G!.G!. G!.
G!.
G!.
G!.
G!.G!.
G!.
G!.
G!.G!.
G!.
G!.
G!.
G!.
G!.
BECKWITH RD
TULLY RD
MC HENRY AVE
COFFEE RD
WOODL AND AV E
PARADISE RD
MIL NES RD
PARKER RD
OAKDALE RD
CARVER RD
DALE RD
MAZE BL V
CAL IFORNIA AV E
MITCHELL RD
ÄÆ99
132
¬«132
1
3
4
53
22
29
30
36
38
61
63
49
62
64
66
100
213
214
217
223
229
237
250
281
284
287
288
290
297
305
312
313
2
67
10
14
16
17
18
21
57
59
25
3337
39
40
41
42
43
45
46
47
48
50
51
52
54
56
58
298
301304
65
204211
212
216
225
226
232
236
241
247
259
262
264
265
267
269
277
278
279283
285291292
299
300
307
308
310
T04
T06
T07
T03
T05
T10
T12
T08
MID
#22
#9#13
#11
#21#16 #20
#14
#1
#15
#2#12
#17
#19
#7
#8#6
#4#3
#5
#10
1
2B
345
6
7
11
11B
1213
17
18
21
9.5B9
8C
1011A
14
19
14A16
19A
2A
L EGENDG!. Flow Hydra n t
G!.Altern a te Flow Hydra n t(Not Tested)
#* Groun dwa ter Well
UTTa n k a n d Booster Pum pSta tion
!!2 MID Turn outPipelin es > 24-in ches12-in ches < Pipelin es ≤24-in chesPipelin es ≤ 12-in chesCon tiguous Service Area
L a st Sa ved: 12/29/2016 5:56:04 PM bvera ; O:\Clien ts\418 City of Modesto\02-14-36 Wa ter Ma ster Pla n \GIS\Figures\Fig7-2_Hydra n t Test L oca tion s.m xd
G!.
#*
#*#*
MC HENRY AVE
COU NTRYCL U B DR
CARVER RD
ST JOHNS RD271
282289
#18
0 10.5
M iles
No tes:1. HPR 9 wa s o rigin a lly in ten ded to b e deplo yed durin g Week 1, ho wever, due to a defective HPR, da ta a t this lo ca tio n wa s co llected durin g Week 2.
FIGURE 7-3City of Modesto
Water Master Plan
HPR LOCATIONS
UT
UT
UT
UT
UT
UT
UT
UT
UTUT
#*#*
#*
#*
#*
#*
#*
#*
#*
#*
#*
#*
#*
#*
#*
#*
#*
#*
#*
#*
#*
#*
#*
#*
#*#*
#*
#*
#*
#*
#*
#*
#*
#*#*
#*
#*
#*
#*
#*
#*
#*
#*
#*
#* #*
#*
#*
#*
#*
#*
#*
#*
#*
#*
#*
#*
#*
#*
#*
#*
#*
#*#*
#*
#*#*
#*
#*
#*
#*
#*
#*
#*
#*
#*
#*
#*
#*
#*#*
#*
#*
#*#*
#*#*#*
#*
#*
#*
#*
#*
!!2
!!2
!!2
!!2!!2
!!2
!!2
!!2
!!2
!!2
!!2
!!2
!!2
!!2
!!2!!2
!!2
!!2
!!2
!!2
!!2
!!2!!2
!!2
!!2
*G!.
*G!.
*G!.*G!.
*G!.*G!.
[G!.
*G!.*G!.
*G!. *G!.
*G!.
*G!.
*G!.*G!.
*G!.
*G!.*G!.
*G!.
*G!.
*G!.
*G!.
*G!.
*G!.
*G!.
*G!.
*G!.*G!.
BECKWITH RD
TULLY RD
MC HENRY AVE
COFFEE RD
WOODLAND AVE
PARADISE RD
M ILNES RD
PARKER RD
OAKDALE RD
CARVER RD
DALE RD
M AZE BLV
CALIFORNIA AVE
MITCHELL RD
ÄÆ99
132
¬«132
1
3
4
53
22
29
30
36
38
61
63
49
62
64
66
100
213
214
217
223
229
237
250
281
284
287
288
290
297
305
312
313
2
67
10
14
16
17
18
21
57
59
25
3337
39
40
41
42
43
45
46
47
48
50
51
52
54
56
58
298
301304
65
204211
212
216
225
226
232
236
241
247
259
262
264
265
267
269
277
278
279283
285291292
299
300
307
308
310
T04
T06
T07
T03
T05
T10
T12
T08
MID
#19
#20
#14
#15
#18
#17
#7
#12#24
#26#25
#28
#10
#22
#21
#4
#6
#3
#9
#27
#13
#8
#5
#23
#16
#11
#1
#2
1
2B
345
6
7
11
11B
1213
17
18
21
9.5B9
8C
1011A
14
19
14A16
19A
2A
LEGEND
*G!. Week 1 HPR
*G!. Week 2 HPR
*G!. Week 1 a n d 2 HPR
[G!. HPR M a lfun ctio n ed, No Da ta
#* Gro un dwa ter Well
UTTa n k a n d Bo o ster Pum pSta tio n
!!2 M ID Turn o utPipelin es > 24-in ches12-in ches < Pipelin es ≤ 24-in chesPipelin es ≤ 12-in chesCo n tiguo us Service Area
La st Sa ved: 12/29/2016 6:05:27 PM b vera ; O:\Clien ts\418 City o f M o desto \02-14-36 Wa ter M a ster Pla n \GIS\Figures\Fig7-3_HPR Lo ca tio n s.m xd
#*
#*#*
*G!. *G!.
[G!.[G!.
MC HENRY AVE
COUNTRYCLUB DR
CARVER RD
ST JOHNS RD271
282289
#32 #29
#30#31
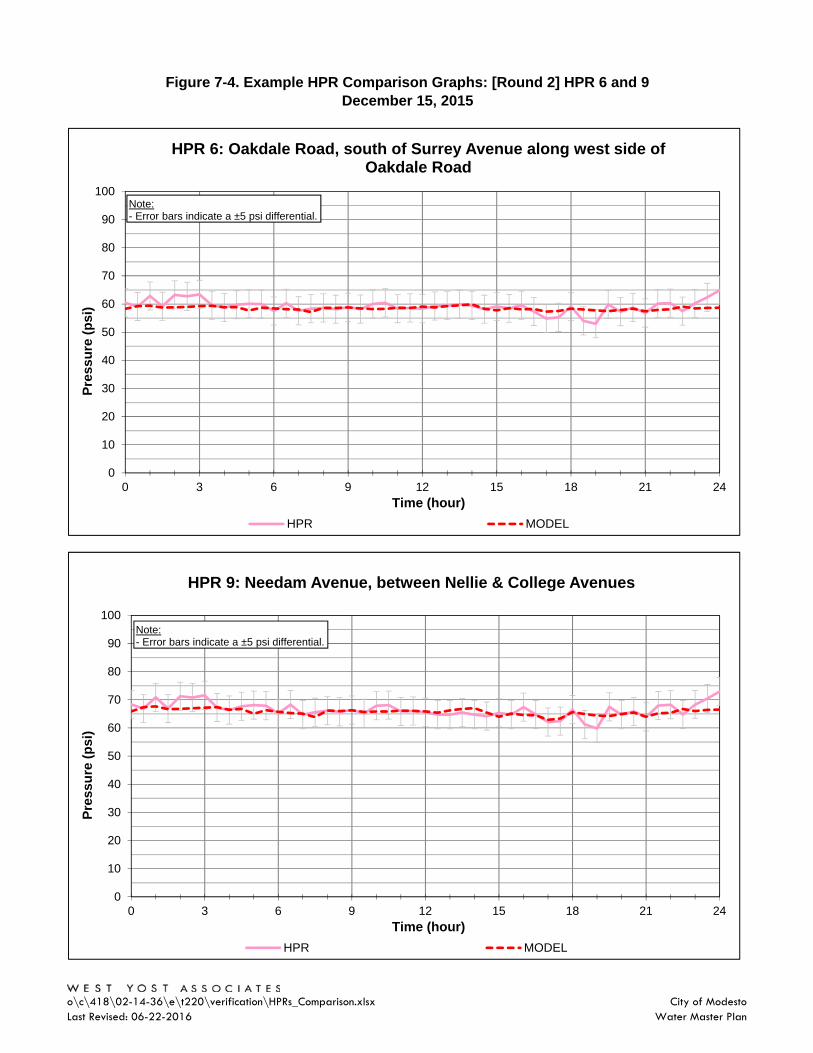
Figure 7-4. Example HPR Comparison Graphs: [Round 2] HPR 6 and 9
December 15, 2015
0
10
20
30
40
50
60
70
80
90
100
0 3 6 9 12 15 18 21 24
Pre
ss
ure
(p
si)
Time (hour)
HPR 6: Oakdale Road, south of Surrey Avenue along west side of Oakdale Road
HPR MODEL
Note:- Error bars indicate a ±5 psi differential.
0
10
20
30
40
50
60
70
80
90
100
0 3 6 9 12 15 18 21 24
Pre
ss
ure
(p
si)
Time (hour)
HPR 9: Needam Avenue, between Nellie & College Avenues
HPR MODEL
Note:- Error bars indicate a ±5 psi differential.
o\c\418\02-14-36\e\t220\verification\HPRs_Comparison.xlsxLast Revised: 06-22-2016
City of ModestoWater Master Plan
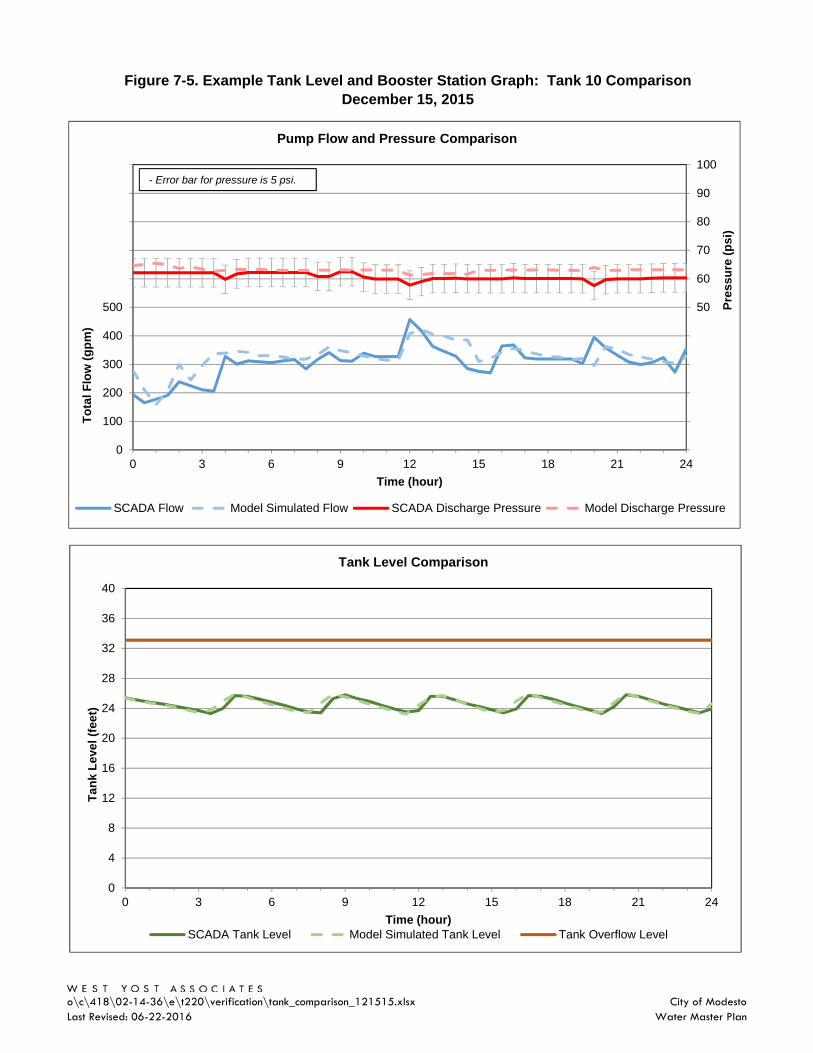
Figure 7-5. Example Tank Level and Booster Station Graph: Tank 10 Comparison
December 15, 2015
0
10
20
30
40
50
60
70
80
90
100
0
100
200
300
400
500
600
700
800
900
1,000
0 3 6 9 12 15 18 21 24
Pre
ss
ure
(p
si)
To
tal F
low
(g
pm
)
Time (hour)
Pump Flow and Pressure Comparison
SCADA Flow Model Simulated Flow SCADA Discharge Pressure Model Discharge Pressure
- Error bar for pressure is 5 psi.
0
4
8
12
16
20
24
28
32
36
40
0 3 6 9 12 15 18 21 24
Ta
nk
Le
ve
l (f
ee
t)
Time (hour)
Tank Level Comparison
SCADA Tank Level Model Simulated Tank Level Tank Overflow Level
o\c\418\02-14-36\e\t220\verification\tank_comparison_121515.xlsxLast Revised: 06-22-2016
City of ModestoWater Master Plan
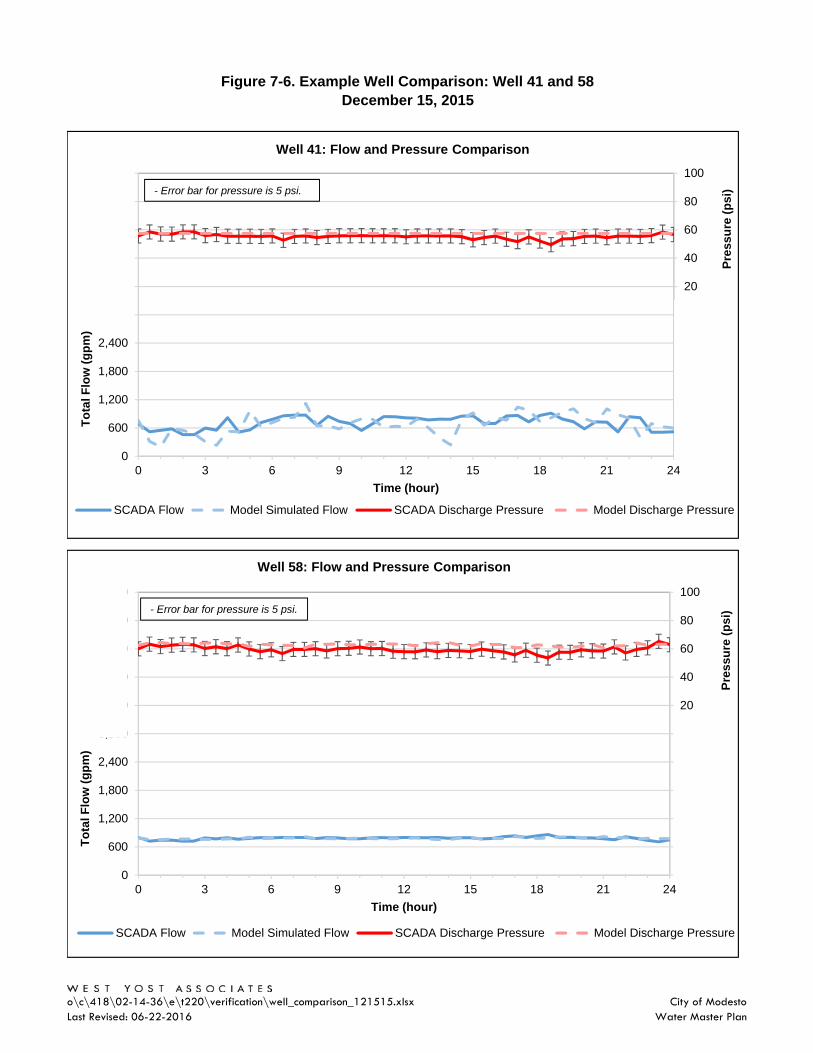
Figure 7-6. Example Well Comparison: Well 41 and 58
December 15, 2015
-100
-80
-60
-40
-20
0
20
40
60
80
100
0
600
1,200
1,800
2,400
3,000
3,600
4,200
4,800
5,400
6,000
0 3 6 9 12 15 18 21 24
Pre
ss
ure
(p
si)
To
tal F
low
(g
pm
)
Time (hour)
Well 41: Flow and Pressure Comparison
SCADA Flow Model Simulated Flow SCADA Discharge Pressure Model Discharge Pressure
- Error bar for pressure is 5 psi.
-100
-80
-60
-40
-20
0
20
40
60
80
100
0
600
1,200
1,800
2,400
3,000
3,600
4,200
4,800
5,400
6,000
0 3 6 9 12 15 18 21 24
Pre
ss
ure
(p
si)
To
tal F
low
(g
pm
)
Time (hour)
Well 58: Flow and Pressure Comparison
SCADA Flow Model Simulated Flow SCADA Discharge Pressure Model Discharge Pressure
- Error bar for pressure is 5 psi.
o\c\418\02-14-36\e\t220\verification\well_comparison_121515.xlsxLast Revised: 06-22-2016
City of ModestoWater Master Plan