La Junta Nacional contra el analfabetismo (1950-1970): un ...

Chapter 7
Growth: Part 1
Outline and notes base mostly on Cowen and Tabarrok (2011).
Three Key Facts
1. GDP per Capita Today Varies Enormously among Nations
Luxembourg has per capital GDP of nearly $104,000! Ours
is half that ($52,000). China is low (¡$6200/person). Bu-
rundi’s is less than $300.
2. Everyone Used to Be Poor
“GDP per capita was about the same in year 1 as it would
be 1,000 years later and indeed about the same as it had
been 1,000 years earlier. For most of recorded human his-
1

Figure 7.1: GDP Per Capita Varies Among Nations. 80% of the world is
below average!
2

Figure 7.2: Everyone used to be poor.
tory, there was no long-run growth in real per capita GDP.
Countries might grow in particular good years, but soon
enough a disaster would ensue and the gains would be given
back. Only beginning in the nineteenth century does it be-
come clear that some parts of the world began to grow at
a rate unprecedented in human history.”
3. There are Growth Miracles and Growth Disasters
In 1950 Nigeria and South Korea were very similar in terms
of per capita GDP. In sixty years, South Korea has grown
into a major industrial economy that enjoys a high living
3

standard and a high quality of life. Meanwhile, Nigeria has
barely grown at all and life there for most is miserable and
short.
Argentina is another growth disaster. In 1900 it was one of
the wealthiest countries in the world, quite similar to the
U.S. Since then bad policies have stifled growth and it is
now relatively poor ($11,000/person) and things continue
to get worse.
Miracles and Disasters
1. Miracles
(a) Japan: annual rate of real growth 1950-1970 = 8.5%
(b) South Korea: annual rate of real growth 1950-1970 =
7.2%
2. Disasters
(a) Argentina: In 1900 it was one of the richest countries
in the world. Now, its per capita GDP is 1/3 that of
the U.S.
(b) Nigeria: has barely grown since 1950. It is poorer now
than it was in 1974.
4

Figure 7.3: Miracles Happen!
5

Measuring Growth
How is it measured? We saw in previous chapters:
gt =yt − yt−1
yt−1× 100 (7.1)
Example:
Year real GDP per capita
2008 $15000 billion
2009 $15500 billion
g2009 =15500 − 15000
15000× 100 = 3.3% (7.2)
6

Rule of 70
How long does it take for a quantity to double?
Time to Double =70
% growth rate(7.3)
Example:
If real GDP per capita is growing at an annual growth rate
of 3.5%, it will double in 20 years.
70
3.5%= 20 years (7.4)
Annual Growth Rate, % Years to Double
0 Never
1 70
2 35
3 23.3
4 17.5
Small changes in the growth rate result in large changes over
time.
7

Figure 7.4: Understanding the wealth of nations. It depends on more than
the amount of natural resources, technology, capital and labor one has.
8

Factors of Production
Physical Capital: the stock of tools, structures, and equip-
ment.
Human Capital: the productive knowledge and skills that work-
ers acquire through education, training and experience.
Technical Knowledge: knowledge about how the world works
that is used to produce goods and services.
Land: is a catch-all that includes natural resources, climate,
and other features of the physical environment that firms
use to produce things.
The amount of available resources only tells
part of the story.
• Why do some countries have more physical and human cap-
ital and use more advanced technology?
• Why do some countries obtain greater output from the re-
sources they have than others?
• The answers lie in the institutions and incentives that coun-
tries adopt.
9

Figure 7.5: A natural experiment: In 1950 North and South Korea have
same people and culture and similar levels of physical capital and access
to the same technology. North Korea became a communist state with a
centrally planned economy. South Korea adopted the capitalist free market
model. This picture shows what the result is 50 years later.
10

Institutions
Institutions represent the rules of the game that structure eco-
nomic incentives.
1. Property Rights
2. Honest Government
3. Political Stability
4. Dependable Legal System
5. Competitive and Open Markets
Property Rights
Property right The right to use, control and obtain the ben-
efits associated with a particular good.
Private property right A private property right exists when
the property right is: 1) Exclusively held by one owner and
2) Transferable to someone else as the owners wishes.
11

The incentives created by private property rights
• Private property owners gain by using their property in
ways that benefit themselves and others; they lose by ig-
noring the wishes of others.
• Private owners have strong incentives to care for and prop-
erly manage their property.
• Private property owners have strong incentives to conserve
for the future if the property is expected to increase in value
over time.
• Private owners who negligently use their property can be
held accountable for that misuse. There is a link between
ownership and responsible use of property.
Private property rights provide each individual, however self-
ish, with incentives to cooperate with others and to do things
that are productive with their property. Private ownership gives
people incentives to take others wants into account.
Property right boils down to the right to benefit from one’s
own effort.
• Property rights provide incentives to work.
• Property rights encourage investment in physical and hu-
man capital.
12
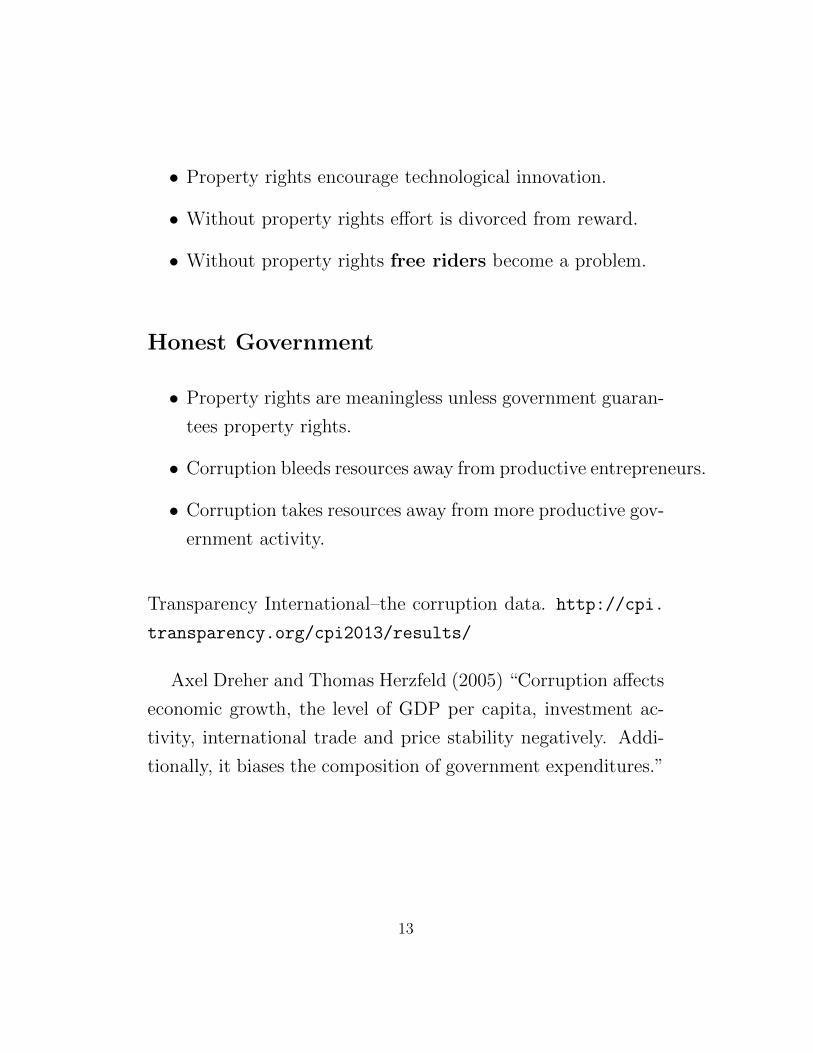
• Property rights encourage technological innovation.
• Without property rights effort is divorced from reward.
• Without property rights free riders become a problem.
Honest Government
• Property rights are meaningless unless government guaran-
tees property rights.
• Corruption bleeds resources away from productive entrepreneurs.
• Corruption takes resources away from more productive gov-
ernment activity.
Transparency International–the corruption data. http://cpi.
transparency.org/cpi2013/results/
Axel Dreher and Thomas Herzfeld (2005) “Corruption affects
economic growth, the level of GDP per capita, investment ac-
tivity, international trade and price stability negatively. Addi-
tionally, it biases the composition of government expenditures.”
13

Figure 7.6: Counties that have honest governments clearly are richer than
those that are corrupt. Do riches lead to less corruption or does less corrup-
tion lead to riches?! Our theory suggests the latter.
14

Political Stability
Political Stability – change of government within the rule of law.
Changing governments without the rule of law results in un-
certainty which leads to less investment in physical and human
capital.
In many nations civil war, military dictatorship, and anarchy
have destroyed the institutions necessary for economic growth.
Dependable Legal System
• A dependable legal system facilitates the making and en-
forceability of contracts.
• Protects property from others including government.
• The legal system in some governments is so poor that no one
knows who owns what. Example: In India, residents who
purchase land may have to do so more than once because
of lack of proper record keeping.
15

Competitive and Open Markets
• Encourage the efficient organization of resources.
• About half the differences in per capita income across coun-
tries is explained by a failure to use capital efficiently.
• Example: One study found that if India used its physical
and human capital as efficiently as the U.S., India would
be four times richer than it is today.
How and why do poor countries use their cap-
ital inefficiently?
• They tend to adopt inefficient and unnecessary regulations.
In many times this is part of an effort to protect friends of
the regime.
• Example: until recently in India, it was illegal to produce
shirts using large-scale production
16

Crony Capitalism
Here is a link to an excellent website that discusses the
meaning and manifestations of crony capitalism, which in its
most basic form is where government and business cooperate
to their mutual benefits–usually at the expense of the
consumers in society. http://www.intellectualtakeout.
org/library/business-and-economics/
free-market-capitalism-vs-crony-capitalism
“By contrast, whether referred to as cronyism, corporatism,
mercantilism, liberal fascism, or venture socialism, crony cap-
italism is simply the cooperation of government and business.
While this cooperation benefits the involved business and politi-
cian(s), it generally hurts the politically and corporately uncon-
nected. Furthermore, the power and benefits of crony capitalism
can often lead to corruption, a fact which James Madison recog-
nized when he stated, ‘Wherever there is an interest and power
to do wrong, wrong will generally be done, and not less read-
ily by a powerful & interested party than by a powerful and
interested prince.’ ” Intellectual Takeout (2013)
So why does the U.S. score worse on the corruption scale
(19th in 2012) than countries like Canada, Australia, Finland,
Denmark, Barbados, and Singapore? Source: http://www.
transparency.org/ Here are some of the things that are con-
17

sidered examples of cronyism:
“The mechanisms of crony capitalism are numerous: Bailouts,
stimulus, special loans, too-big-to-fail, favors, mandates, barri-
ers to entry, political appointments, tax breaks, campaign con-
tributions, ‘sole-source’ procurement, connections, grants, government-
union cooperation, exemptions, government sponsored enter-
prises, political insider trading, and legal bribery.” Intellectual
Takeout (2013).
Many of these sound quite familiar to those of us who follow
current events here in the U.S. and do not help our ranking
relative to the rest of the world.
Corruption1
Generally speaking, corruption can be defined as “ ‘the abuse of
entrusted power for private gain.’ Corruption can be classified as
grand, petty and political, depending on the amounts of money
lost and the sector where it occurs.
Grand corruption consists of acts committed at a high level
of government that distort policies or the central functioning of
the state, enabling leaders to benefit at the expense of the public
1From the FAQ at Transparency International (2013)
18

good.
Petty corruption refers to everyday abuse of entrusted power
by low- and mid-level public officials in their interactions with
ordinary citizens, who often are trying to access basic goods or
services in places like hospitals, schools, police departments and
other agencies.
Political corruption is a manipulation of policies, institutions
and rules of procedure in the allocation of resources and financ-
ing by political decision makers, who abuse their position to
sustain their power, status and wealth.” Transparency Interna-
tional (2013)
19

Bibliography
Cowen, Tyler and Alex Tabarrok (2011), Modern Principles of
Economics, 2nd edn, Worth, New York.
Intellectual Takeout (2013), ‘Free market capitalism vs. crony
capitalism’, http://www.intellectualtakeout.org/.
Transparency International (2013), ‘Faqs on corruption’,
http://www.transparency.org/whoweare/organisation/faqs on corruption/2/.
20