Chapter 7 Drivers of Change in Ecosystem Condition and ...€¦ · Drivers of Change in Ecosystem...
50
Chapter 7 Drivers of Change in Ecosystem Condition and Services Coordinating Lead Author: Gerald C. Nelson Lead Authors: Elena Bennett, Asmeret Asefaw Berhe, Kenneth G. Cassman, Ruth DeFries, Thomas Dietz, Andrew Dobson, Achim Dobermann, Anthony Janetos, Marc Levy, Diana Marco, Nebojsa Nakic ´enovic ´, Brian O’Neill, Richard Norgaard, Gerhard Petschel-Held, Dennis Ojima, Prabhu Pingali, Robert Watson, Monika Zurek Review Editors: Agnes Rola, Ortwin Renn, Wolfgang Weimer-Jehle Main Messages ............................................. 175 7.1 Introduction ........................................... 175 7.2 Indirect Drivers ........................................ 176 7.2.1 Demographic Drivers 7.2.2 Economic Drivers: Consumption, Production, and Globalization 7.2.3 Sociopolitical Drivers 7.2.4 Cultural and Religious Drivers 7.2.5 Science and Technology Drivers 7.3 Direct Drivers ......................................... 199 7.3.1 Climate Variability and Change 7.3.2 Plant Nutrient Use 7.3.3 Land Conversion 7.3.4 Biological Invasions and Diseases 7.4 Examples of Interactions among Drivers and Ecosystems ......... 212 7.4.1 Land Use Change 7.4.2 Tourism 7.5 Concluding Remarks .................................... 214 NOTES ................................................... 214 REFERENCES .............................................. 214 173
Transcript of Chapter 7 Drivers of Change in Ecosystem Condition and ...€¦ · Drivers of Change in Ecosystem...

Chapter 7
Drivers of Change in Ecosystem Condition andServices
Coordinating Lead Author: Gerald C. NelsonLead Authors: Elena Bennett, Asmeret Asefaw Berhe, Kenneth G. Cassman, Ruth DeFries, Thomas Dietz,
Andrew Dobson, Achim Dobermann, Anthony Janetos, Marc Levy, Diana Marco, Nebojsa Nakicenovic,Brian O’Neill, Richard Norgaard, Gerhard Petschel-Held, Dennis Ojima, Prabhu Pingali, RobertWatson, Monika Zurek
Review Editors: Agnes Rola, Ortwin Renn, Wolfgang Weimer-Jehle
Main Messages . . . . . . . . . . . . . . . . . . . . . . . . . . . . . . . . . . . . . . . . . . . . . 175
7.1 Introduction . . . . . . . . . . . . . . . . . . . . . . . . . . . . . . . . . . . . . . . . . . . 175
7.2 Indirect Drivers . . . . . . . . . . . . . . . . . . . . . . . . . . . . . . . . . . . . . . . . 1767.2.1 Demographic Drivers7.2.2 Economic Drivers: Consumption, Production, and Globalization7.2.3 Sociopolitical Drivers7.2.4 Cultural and Religious Drivers7.2.5 Science and Technology Drivers
7.3 Direct Drivers . . . . . . . . . . . . . . . . . . . . . . . . . . . . . . . . . . . . . . . . . 1997.3.1 Climate Variability and Change7.3.2 Plant Nutrient Use7.3.3 Land Conversion7.3.4 Biological Invasions and Diseases
7.4 Examples of Interactions among Drivers and Ecosystems . . . . . . . . . 2127.4.1 Land Use Change7.4.2 Tourism
7.5 Concluding Remarks . . . . . . . . . . . . . . . . . . . . . . . . . . . . . . . . . . . . 214
NOTES . . . . . . . . . . . . . . . . . . . . . . . . . . . . . . . . . . . . . . . . . . . . . . . . . . . 214
REFERENCES . . . . . . . . . . . . . . . . . . . . . . . . . . . . . . . . . . . . . . . . . . . . . . 214
PAGE 173
173
................. 11411$ $CH7 10-27-05 08:42:07 PS

174 Ecosystems and Human Well-being: Scenarios
BOXES
7.1 War as a Driver of Change in Ecosystem Services andHuman Well-being
7.2 Drivers of Land Use Change in Central Asia
FIGURES
7.1 Global Population Projections, 2005–2100
7.2 MA World Population Scenarios, 2000–2100
7.3 Changes in Economic Structure for Selected Countries,1820–1992
7.4 Income Level and Distribution, 1970 and 2000
7.5 Income per Person, per Capita (GNI) Average, 1999–2003*
7.6a Average GDP per Capita Annual Growth Rate, 1990–2003*
7.6b Average GDP Annual Growth Rate, 1990–2003*
7.7 World Trade and GDP Growth, 1930–95
7.8 World Merchandise Trade by Major Trade Groups,1950–2001
7.9 Metals Intensity of Use per Unit of GDP (PPP) as a Functionof GDP (PPP) per Capita for 13 World Regions*
7.10 Energy Intensity Changes with Changes in per CapitaIncome for China, India, Japan, and United States*
7.11 Energy Intensity Changes over Time for China, India, Japan,and United States*
7.12 Pathways of the Ecological Impacts of Tourism onBiodiversity
7.13 Variations of the Earth’s Surface Temperature, 1000–2100*
7.14 Past and Future Carbon Dioxide Concentrations*
7.15 Concentration of Greenhouse Gases*
*This appears in Appendix A at the end of this volume.
PAGE 174
7.16 Trends in Global Consumption of Nitrogen Fertilizers,1961–2001*
7.17 Trends in Maize Grain Yield, Use of Nitrogen Fertilizer, andNitrogen Use Efficiency in United States, 1965–2000
7.18 Trends in Global Consumption of Phosphate Fertilizer,1961–2002*
7.19 Phosphorus Accumulation in Agricultural Soils, 1960–95, asDetermined by Global Budget
7.20 Estimated Inputs, Outputs, and Change in Storage ofPhosphorus on Agricultural Lands in Lower- and Higher-income Countries, 1961–96
7.21 Trends in Global Consumption of Potash Fertilizer,1961–2000
7.22 An Overview of the Causative Patterns of TropicalDeforestation*
TABLES
7.1 Global Population Trends since 1950
7.2 Fertility, Mortality, and Migration Assumptions, by Scenario
7.3 Per Capita GDP Growth Rates for Selected Regions andTime Periods
7.4 Examples of Productivity Growth for the Entire Economy andfor Selected Sectors and Countries
7.5 Rate of Growth of Wheat Yield by Mega-environment, EliteSpring Wheat Yield Trial, 1964–95
7.6 Observed and Modeled Changes in Extremes of Weatherand Climate
7.7 Regional Creation of Reactive Nitrogen in the Mid-1990s
................. 11411$ $CH7 10-27-05 08:42:07 PS

175Drivers of Change in Ecosystem Condition and Services
Main Messages
A driver is any natural or human-induced factor that directly or indirectlycauses a change in an ecosystem. A direct driver unequivocally influencesecosystem processes. An indirect driver operates more diffusely, by alteringone or more direct drivers. Millennium Ecosystem Assessment categories ofindirect drivers of change are demographic, economic, sociopolitical, scientificand technological, and cultural and religious. Important direct drivers includechanges in climate, plant nutrient use, land conversion, and diseases andinvasive species.
World population, a key indirect driver, will likely peak before the end ofthe twenty-first century at less than 10 billion people. The global populationgrowth rate peaked at 2.1% per year in the late 1960s and fell to 1.35% peryear by 2000, when global population reached 6 billion. Population growth overthe next several decades is expected to be concentrated in the poorest urbancommunities in sub-Saharan Africa, South Asia, and the Middle East. Popula-tions in all parts of the world are expected to experience substantial agingduring the next century. While industrial countries will have the oldest popula-tions, the rate of aging could be extremely fast in some developing countries.
Between 1950 and 2000, world GDP grew by 3.85% per year on average,resulting in an average per capita income growth rate of 2.09%. In the MAscenarios, per capita income grows two to four times between 2000 and 2050,depending on scenario. Total economic output grows three to six times duringthat period. With rising per capita income, the structure of consumptionchanges, with wide-ranging potential for effects on ecosystem condition andservices. At low incomes, demand for food quantity initially increases and thenstabilizes. Food expenditures become more diverse, and consumption of in-dustrial goods and services rises. These consumption changes drive areaexpansion for agriculture and energy and materials use. In the MA scenarios,land used for agriculture and biofuels expands from 4.9 million square kilome-ters in 2000 to 5.3–5.9 million square kilometers in 2050. Water withdrawalsexpand by 20–80% during the same period.
In the 200 years for which reliable data exist, the overall growth of consumptionhas outpaced increases in materials and energy efficiency, leading to absoluteincreases of materials and energy use.
Nations with lower trade barriers, more open economies, and transparentgovernment processes tend to have higher per capita income growthrates. International trade is an important source of economic gains, as it en-ables comparative advantage to be exploited and accelerates the diffusion ofmore efficient technologies and practices. Where inadequate property rightsexist, trade can accelerate exploitation of ecosystem services.
Economic policy distortions such as taxes and subsidies can have seri-ous environmental consequences, both in the country where they areimplemented and abroad. Subsidies to conventional energy are estimated tohave been $250–300 billion a year in the mid-1990s. Changes in greenhousegas emissions in the MA scenarios range from negative (a decline of 25%) topositive (160%), depending on overall economic growth and subsidy reduc-tions. The 2001–03 average subsidies paid to the agricultural sectors of OECDcountries were over $324 billion annually. OECD protectionism and subsidiescost developing countries over $20 billion annually in lost agricultural income.
Since the mid-twentieth century, public sector investments in crop researchand infrastructure development have resulted in substantial yield increasesworldwide in some major food crops. These yield increases have reduced thedemand for crop area expansion arising from population and income growth.
PAGE 175
Among the main direct drivers, Earth’s climate system has changed sincethe pre-industrial era, in part due to human activities, and is projected tocontinue to change throughout the twenty-first century. During the last100 years, the global mean surface temperature has increased by about 0.6�
Celsius, precipitation patterns have changed spatially and temporally, andglobal average sea level rose 0.1–0.2 meters. The global mean surface tem-perature is projected to increase 1.4–5.8� Celsius between 1990 and 2100,accompanied by more heat waves. Precipitation patterns are projected tochange, with most arid and semiarid areas becoming drier and with an in-crease in heavy precipitation events, leading to an increased incidence infloods and drought. Global mean sea level is projected to increase by 0.05–0.32 meters in the 1990–2050 period under the MA scenarios (0.09–0.88meters between 1990 and 2100).
Plant nutrient application is essential to food production, but currentmethods of use contribute to environmental and socioeconomic prob-lems caused by greenhouse gas emissions, eutrophication, and off-farmhypoxia. Nitrogen application has increased eightfold since 1960, but 50% ofthe nitrogen fertilizer applied is often lost to the environment. Improvements innitrogen use efficiency require more investment in technologies that achievegreater congruence between crop nitrogen demand and nitrogen supply fromall sources and that do not reduce farmer income. Phosphorus application hasincreased threefold since 1960, with steady increase until 1990, followed byleveling off at a level approximately equal to 1980s applications. Thesechanges are mirrored by phosphorus accumulation in soils, which can serveas an indicator of eutrophication potential for freshwater lakes and P-sensitiveestuaries.
Land cover change is a major driver of ecosystem condition and ser-vices. Deforestation and forest degradation affect 8.5% of the world’s remain-ing forests, nearly half of which are in South America. Deforestation and forestdegradation have been more extensive in the tropics over the past few dec-ades than in the rest of the world, although data on boreal forests are espe-cially limited, and the extent of change in this region is less well known.Approximately 10% of the drylands and hyper-arid zones of the world areconsidered degraded, with the majority of these areas in Asia. Cropped areascurrently cover approximately 30% of Earth’s surface. In the MA scenarios,cropped areas (including pastures) increase 9–21% between 1995 and 2050.
Human-driven movement of organisms, deliberate and accidental, iscausing a massive alteration of species ranges and contributing tochanges in ecosystem function. In some ecosystems, invasions by alienorganisms and diseases result in the extinction of native species or a hugeloss in ecosystem services. However, introductions of alien species can alsobe beneficial in terms of human population; most food is produced from intro-duced plants and animals.
7.1 IntroductionThis chapter examines indirect and direct drivers of changein ecosystem services (the two right boxes in the MA con-ceptual framework; see Chapter 1 for the diagram and de-scription of the conceptual framework). The goal is toprovide an overview at the global level of important driversof ecosystem condition and the ability to deliver servicesthat improve human well-being.
It is important to recognize that this chapter does notcover the remaining two boxes of the framework—themechanisms by which the drivers interact with specific eco-systems to alter their condition and ability to deliver services
................. 11411$ $CH7 10-27-05 08:42:08 PS

176 Ecosystems and Human Well-being: Scenarios
and the effects on human well-being. That discussion is leftto the individual condition and services chapters in the Cur-rent State and Trends volume and to later chapters in thisvolume. For selected driver categories, we do provide abrief overview of some general ecosystem consequencesand some review of the range of values in the scenarios.The MA conceptual framework is not the only way to or-ganize an assessment of ecosystems. Other popular frame-works that examine human-environment interactionsinclude the ecological footprint (Wackernagel and Rees1996), IPAT and its derivatives (Ehrlich and Holden 1971;York et al. 2003b), and consumption analysis (Arrow et al.2004).
The MA definition of a driver is any natural or human-induced factor that directly or indirectly causes a change inan ecosystem. A direct driver unequivocally influences eco-system processes. An indirect driver operates more diffusely,by altering one or more direct drivers. The categories ofglobal driving forces used in the MA are: demographic, eco-nomic, sociopolitical, cultural and religious, science and technology,and physical and biological. Drivers in all categories other thanphysical and biological are considered indirect. Importantdirect (physical and biological) drivers include changes inclimate, plant nutrient use, land conversion, and diseasesand invasive species.
This chapter does not include natural drivers such assolar radiation, natural climate variability and extremeweather events, or volcanic eruptions and earthquakes. Al-though some of these can have significant effects on ecosys-tem services (such as the explosion of the Krakatoa volcanoin 1883, which resulted in lower temperatures globally forseveral years, with negative impacts on agriculture world-wide), space limitations preclude their inclusion. The focushere is on anthropogenic drivers.
7.2 Indirect DriversWe begin this chapter with a discussion of indirect drivercategories—demographic, economic, sociopolitical, cul-tural and religious, and science and technology.
7.2.1 Demographic Drivers
The number of people currently residing on Earth is widelyacknowledged to be an important variable in influencingecosystem condition. There is also a growing recognitionthat how population is distributed across age groups, urbanand rural regions, living arrangements, and geographic re-gions affects consumption patterns and therefore ecosystemimpacts. These influences are also moderated by resourcesavailable to individuals, how they choose to allocate them(economic, sociopolitical, and cultural drivers), and thechanging technical relationships needed to convert raw ma-terials provided by ecosystems into services of value to hu-mans (science and technology drivers). In this section, weaddress population dynamics, focusing on current conditions,projections of the future, and the primary determinants ofpopulation change: fertility, mortality, and migration.
PAGE 176
7.2.1.1 Current Conditions
Global population increased by 2 billion during the lastquarter of the twentieth century, reaching 6 billion in 2000.During that time, birth rates in many parts of the world fellfar more quickly than anticipated, and life expectancies—with some notable exceptions—improved steadily. Nowpopulation growth rates are declining nearly everywhere.The global growth rate peaked at 2.1% per year in the late1960s and has since fallen to 1.35% (see Table 7.1), and theannual absolute increment of global population peaked atabout 87 million per year in the late 1980s and is now about78 million (United Nations 2003a). This does not mean thatlittle additional population growth is to be expected; globalpopulation is likely to increase by another 2 billion over thenext few decades. (See Figure 7.1.) Nonetheless, the end ofworld population growth, while not imminent, is now onthe horizon (Lutz et al. 2001).
Within the boundaries of the MA ecosystems, the culti-vated system contains the greatest number of people (4.1billion in 2000). The coastal system has the highest popula-tion density, at 170 people per square kilometer (see MACurrent State and Trends, Table 5.1). Population growth overthe period 1990–2000 has varied across ecosystems. Thehighest growth rate (18.5% net over the decade) occurredin drylands. The greatest increase in population density wasfound in the coastal zone, where population growth totaled23.3 people per square kilometer over the decade. The cul-tivated systems witnessed the greatest total increase in popu-lation during the period—506 million additional people.(See MA Current State and Trends, Chapter 5.)
The recent decades of great demographic change haveproduced unprecedented demographic diversity across re-gions and countries (Cohen 2003). Substantial populationincreases are still expected in sub-Saharan Africa, SouthAsia, and the Middle East. In Europe and East Asia, growthhas slowed or even stopped, and rapid aging has become aserious concern.
Traditional demographic groupings of countries arebreaking down. In the United States, a high-income coun-try, a doubling of population in the future is anticipated.Many developing countries, including China, Thailand,and North and South Korea, now have low fertility ratesthat until recently were found only in high-income coun-tries. In 24 countries, mainly in Europe, fertility has fallento very low levels—below an average of 1.5 births perwoman—prompting serious concerns not only about agingbut also about population decline.
Mortality and urbanization rates vary widely acrosscountries as well. Life expectancies are substantially higherin high-income countries (about 75 years) than in develop-ing ones (63 years), although the gap has closed from over17 years of difference in the early 1970s to about 12 yearstoday. Particular countries or regions have done much bet-ter, or worse, than the average: life expectancy in East Asiagrew impressively over the past few decades, while im-provements stalled in Russia and have been reversed insome parts of Africa (due primarily to the impact of HIV/AIDS).
................. 11411$ $CH7 10-27-05 08:42:09 PS

177Drivers of Change in Ecosystem Condition and Services
Table 7.1 Global Population Trends since 1950 (United Nations 2003d)
Total population size
1950 1975 2000(million)
Higher-income countries 813 1,047 1,194
Lower-income countries 1,706 3,021 4,877
Africa 221 408 796
Asia 1,398 2,398 3,680
Europe 547 676 728
Latin America and Caribbean 167 322 520
North America 172 243 316
Oceania 13 22 31
World 2,519 4,068 6,071
Population growth rate per year
1950–55 1970–75 1995–2000(percent)
Higher-income countries 1.20 0.78 0.34
Lower-income countries 2.08 2.36 1.61
Africa 2.19 2.66 2.35
Asia 1.95 2.24 1.41
Europe 0.99 0.59 0.02
Latin America and Caribbean 2.65 2.45 1.56
North America 1.71 0.97 1.07
Oceania 2.15 2.07 1.41
World 1.80 1.94 1.35
Life expectancy, both sexes combined
1950–55 1970–75 1995–2000(years)
Higher-income countries 66.1 71.4 74.8
Lower-income countries 41.0 54.7 62.5
Africa 37.8 46.2 50.0
Asia 41.4 56.3 65.7
Europe 65.6 71.0 73.2
Latin America and Caribbean 51.4 60.9 69.4
North America 68.8 71.6 76.4
Oceania 60.3 65.8 73.2
World 46.5 58.0 64.6
Total fertility rate
1950–55 1970–75 1995–2000(fertility rate)
Higher-income countries 2.84 2.13 1.58
Lower-income countries 6.16 5.42 3.11
Africa 6.74 6.71 5.22
Asia 5.89 5.06 2.72
Europe 2.66 2.16 1.42
Latin America and Caribbean 5.89 5.03 2.72
North America 3.47 2.01 2.01
Oceania 3.90 3.25 2.45
World 5.02 4.48 2.83
2
4
6
8
10
12
14
16
2000 2010 2020 2030 2040 2050 2060 2070 2080 2090 2100
Year
Po
pu
lati
on
(b
illio
n)
USCBWorld BankUnited NationsIIASA
IIASA median
IIASA 0.025
IIASA 0.975
UN high
UN low
UN medium
Figure 7.1. Global Population Projections, 2005–2100 (Lutz et al.2001; United Nations 2003c; United States Census Bureau 2003;World Bank 2003)
Regions are also distinguished by different urbanizationlevels. High-income countries typically have populationsthat are 70–80% urban. Some developing-country regions,such as parts of Asia, are still largely rural, while LatinAmerica, at 75% urban, is indistinguishable from high-
PAGE 177
income countries in this regard. Within the MA systemboundaries, the coastal zone has the highest urbanizationrate, at 64% (see MA Current State and Trends, Chapter 27;see also the discussion of urbanization in the land conver-sion section later in this chapter).
The diversity of current conditions means that the out-look for future demographic change is highly variable aswell. Current age structures are a key determinant of popu-lation growth over the next few decades, due to the ‘‘mo-mentum’’ inherent in young populations. Thus, currentlyhigh-fertility regions with young age structures (sub-Saharan Africa, Middle East, and South Asia) have somepopulation growth built in. In contrast, the very low fertil-ity and relatively old age structures of some European coun-tries have generated ‘‘negative momentum,’’ a built-intendency for the population to decline even if fertility risesin the future (Lutz et al. 2003).
Differences in urbanization, education, economic andsocial conditions (especially for women), and other deter-minants of fertility change are also major factors in the out-look for future demographic changes, and vary widely. As aresult, growth over the next several decades is expected tobe concentrated in particular sub-populations, especially thepoorest, urban communities in developing countries. In ad-dition, while substantial population aging is expected in allregions during the century, there will be strong differences
................. 11411$ $CH7 10-27-05 08:42:10 PS
178 Ecosystems and Human Well-being: Scenarios
in timing and degree. The lowest fertility high-incomecountries are already aging and will lead the transition torelatively old age structures, but in some developing coun-tries such as China, which saw sharp declines in fertilityover the past few decades, aging is expected to proceedmore quickly.
7.2.1.2 Determinants of Fertility, Mortality, and Migration
Since the 1940s, demographers have projected futurechanges in population size and composition by age and sexusing the cohort component method, which involves firstprojecting trends in the components of population change:fertility, mortality, and migration. Trends in these variablesare themselves influenced by a wide range of social, eco-nomic, and cultural factors. This section briefly sketches theprincipal determinants for each component.
7.2.1.2.1 Fertility
The conceptual basis for projecting future fertility changesin a country differs, depending on its current level of fertil-ity. Unless otherwise indicated, what is meant by ‘‘fertility’’is the period total fertility rate. The TFR is defined as thenumber of children a woman would give birth to if throughher lifetime she experienced the set of age-specific fertilityrates currently observed. Since age-specific rates generallychange over time, TFR does not in general give the actualnumber of births a woman alive today can be expected tohave. Rather, it is a synthetic index meant to measure age-specific birth rates in a given year.
In those countries with high fertility—defined here asfertility above the ‘‘replacement level’’ of slightly more thantwo births per woman—demographic transition theoryprovides the primary basis for forecasting fertility trends.The concept of demographic transition is a generalizationof events observed over the past two centuries in thosecountries with the highest incomes today. While differentsocieties experienced the transition in different ways, ingeneral these societies have gradually shifted from small,slowly growing populations with high mortality and highfertility to large, slowly growing populations with low mor-tality and low fertility (Knodel and Walle 1979; van de Kaa1996; Lee 2003). During the transition itself, populationgrowth accelerates because the decline in death rates pre-cedes the decline in birth rates, creating a sudden ‘‘surplus’’of births over deaths.
Evidence from all parts of the world overwhelminglyconfirms the relevance of the concept of demographic tran-sition. The transition is well advanced in all developingcountries, except in sub-Saharan Africa, and even there thebeginnings of a fertility decline have become apparent(Cohen 1998a; Garenne and Joseph 2002). Fertility is al-ready at or below replacement level in several developingcountries, including China.
The idea that reduced demand for children drives fertil-ity decline was given theoretical rigor in the 1960s with thedevelopment of a theory based on changes in determinantsof parents’ demand for children (Becker 1960; Becker andLewis 1973; Becker and Barro 1988). The model assumesthat fertility falls because, as economic development pro-
PAGE 178
ceeds, parents’ preferences shift toward higher ‘‘quality’’children requiring greater investments in education andhealth, while increases in women’s labor force participationand wages increase the opportunity costs of raising children.At the same time, development leads to a decline in someof the economic benefits parents may derive from children,such as household labor, income, and old age security.Thus, as the net cost of children rises, demand falls.
While an important advance in understanding fertilitybehavior, this framework by itself is insufficient to explainthe diversity of observed fertility change. It has been ex-tended and made more flexible by taking into account so-ciological aspects such as the effects of development onattitudes toward fertility regulation (Easterlin 1969, 1975),the importance of education and social change in changingwomen’s childbearing desires and their ability to achievethem, changes in cultural contexts such as a decline in reli-gious beliefs and increased materialism (Lesthaeghe 1983;Ryder 1983), and shifts away from extended family struc-tures toward the child-centered nuclear family (Caldwell1982). Many researchers have also emphasized the impor-tance of the spread of new ideas in general, and in particularthose regarding the feasibility and acceptability of birth con-trol (Cleland and Wilson 1987; Bongaarts and Watkins1996).
Population-related policies have clearly played a role inthe decline of fertility in developing countries over the pastseveral decades and are likely to be one determinant of fu-ture fertility. For example, it is widely acknowledged thatChina’s population policy played a central role in its veryrapid decline in fertility in the 1970s and in maintainingChina’s currently low fertility. Future changes to its one-child policy could affect fertility trends over the comingdecades, although this link should not be considered auto-matic (Wong 2001).
Family planning programs in many parts of the worldhave been aimed at meeting ‘‘unmet need’’ for contracep-tion by helping couples overcome obstacles (social and cul-tural, as well as economic) to contraceptive use (Bongaarts1994). Measuring the influence on fertility of family plan-ning programs is difficult, but one estimate concluded that43% of the fertility decline in developing countries betweenthe early 1960s and late 1980s could be attributed to pro-gram interventions (Bongaarts 1997). Although familyplanning programs have been the main intervention tolower fertility, they have often been implemented concomi-tantly with general economic development programs, edu-cational programs, and health programs, each of which mayhave an indirect effect on changing fertility. Future changein fertility may also be affected by public policies that ad-dress such social and economic factors as women’s status,educational and employment opportunities, and publichealth, as called for by the Cairo Program of Action, anoutcome of the 1994 International Conference on Popula-tion and Development in Cairo. Although these policies arenot primarily motivated by their potential effect on demo-graphic trends, achieving them would likely lead to lowerfertility (and lower mortality).
................. 11411$ $CH7 10-27-05 08:42:11 PS

179Drivers of Change in Ecosystem Condition and Services
While each perspective on the determinants of fertilityand mortality change offers important insights, no single,simple theory explains the multifaceted history of demo-graphic transition around the world. Each explanation suf-fers from its own shortcomings, and for each, exceptionscan be found (Oppenheim-Mason 1997; Robinson 1997).It is probably best to think of fertility and mortality transi-tions as being driven by a combination of factors rather thana single cause, but determining the precise mix of factors atwork in a particular population at a given time remains anelusive goal (Hirschman 1994; National Research Council2000).
Demographic transition theory provides little guidanceon future fertility trends in countries that have already com-pleted the transition to low fertility. Traditionally, manypopulation forecasters assumed that fertility in all countrieswould eventually stabilize at replacement level, leading tostabilization of population growth. This approach has beenstrongly criticized as assigning a magnetic force to ‘‘replace-ment-level’’ fertility, without any empirical evidence thattotal fertility rates will naturally drift to that level (Demeny1997). Total fertility has been below replacement level in20 European countries for at least two decades, and it iscurrently below 1.5 children per woman in 21 Europeancountries (United Nations 2003a). Fertility has also fallenbelow replacement level in several developing countries. By2000, 59 countries were below replacement level fertility,accounting for 45% of the world population (United Na-tions 2003a).
Many arguments support the idea that fertility will de-cline below replacement level in more populations in thefuture. These arguments can be grouped together under theterm ‘‘individuation,’’ which encompasses the weakeningof family ties, characterized by declining marriage rates andhigh divorce rates, the increasing independence and careerorientation of women, and value shifts toward materialismand consumerism (Bumpass 1990). Individuation, togetherwith increasing demands and personal expectations for theamount of attention, time, and money devoted to children,is likely to result in fewer couples who have more thanone or two children and an increasing number of childlesswomen.
While current trends and some plausible explanationsmay suggest that low fertility will continue, there is nocompelling theory that can predict reproductive behaviorin low-fertility societies. Although fertility typically contin-ues to fall after reaching replacement level, there is no clearpattern to subsequent fertility trends. In some countries, fer-tility falls quickly to very low levels, while in others it hasfollowed a more gradual slide. In the United States, Swe-den, and some other countries, fertility declined well belowreplacement level and then rose nearly to replacement levelagain (and in Sweden, then returned again to low levels).
Some of these changes have been due to changes in thetiming of births, even if the actual number of births womenhave over their lifetimes has changed little. Since the meanage of childbearing has been increasing in many high-income countries over the past several decades, part of thedecline in TFR has been due to this timing effect and not
PAGE 179
to a change in the completed fertility of women (Bongaartsand Feeney 1998). Proposed explanations for the trendtoward later childbearing include economic uncertainty foryoung adults, lack of affordable housing, increases in highereducation enrollment rates, and difficulties women face incombining child raising with careers, including cultural fac-tors and inflexible labor markets (Kohler et al. 2002).
Some demographers argue that the TFR is likely to in-crease in the future once the mean age of childbearing stopsrising, as happened in the 1980s in the United States whenfertility rose to its current, near-replacement level. An addi-tional argument against continued very low fertility is thatin surveys conducted in much of Europe, women consis-tently say they want about two children (Bongaarts 1999).There are many reasons why women may fail to reach thistarget (career plans, divorce, or infertility, for example), butthis finding suggests that fertility is unlikely to remain ex-tremely low, especially if societies make it easier for womento combine careers and childbearing. Nonetheless, it is un-clear whether the younger women who are currently post-poning births will recuperate this delayed fertility at olderages (Lesthaeghe and Willems 1999; Frejka and Calot2001).
7.2.1.2.2 Mortality
Mortality decline as a component of the demographic tran-sition has typically begun with reductions in infectious dis-ease driven by improvements in public health and hygienealong with better nutrition as incomes rose and the impactsof famines reduced (Lee 2003). Reduced infant mortality,in particular, is a relatively straightforward consequence ofpublic health and sanitation expenditures. Later, reductionsin mortality are driven by reductions in chronic and degen-erative diseases such as heart disease and cancer.
Mortality projections are based on projecting future lifeexpectancy at birth—that is, the average number of years achild born today can expect to live if current age-specificmortality levels continued in the future. (Life expectancy—like the total fertility rate—measures the situation at a givenperiod of time; it does not reflect the actual experience ofan individual. Nonetheless, life expectancy provides a usefulsummary of the mortality rates for each age and sex groupin a population at a particular time.)
Uncertainties about future changes in life expectancy arequite different in high- and low-mortality countries. In thelatter, primarily in industrial regions, mortality is concen-trated at old ages. The long-term outlook for life expec-tancy improvements depends mainly on whether or not abiological upper limit to life expectancy exists and, if itdoes, how soon it might be reached. Death rates have beendeclining steadily at old ages, but there is a range of opin-ions on how long this trend can continue.
One point of view is that life expectancy in higher-income countries is unlikely to increase much beyond 85years from its current level of about 75 years. Some haveargued that this age represents an intrinsic (genetically de-termined) limit to the human life span (DeFries et al. 2002).Reductions in mortality that do occur are likely to increasean individual’s chances of surviving to the maximum life
................. 11411$ $CH7 10-27-05 08:42:12 PS
180 Ecosystems and Human Well-being: Scenarios
span but not extend the maximum itself. Others argue thatwhile the intrinsic limit may be modifiable, in practicalterms it is unlikely to be exceeded without unforeseeablemedical breakthroughs (Olshansky et al. 1990; Olshansky etal. 2001). This view is based on calculations showing thatincreasing life expectancy to 85 years would require dra-matic reductions in mortality rates, particularly among theelderly. Olshansky et al. point out that complete eliminationof deaths from diseases such as heart disease, cancer, anddiabetes—which account for a large proportion of deathsamong the elderly—would not extend average life expec-tancy beyond 90. Only breakthroughs in controlling thefundamental rate of aging could do that.
Other researchers hold that reduced mortality amongthe oldest ages could produce substantial improvements inlife expectancy. Data from several higher-income countriesshows that death rates at old ages have been falling overthe past several decades, and this improvement has beenaccelerating, not decelerating, as would be expected if alimit were being approached (Vaupel 1997; Oeppen andVaupel 2002).
In most developing countries, possible limits to the lifespan are not as relevant to projections because life expectan-cies are lower and mortality is not as concentrated at theoldest ages. Future life expectancy will be determined bythe efficiency of local health services, the spread of tradi-tional diseases such as malaria and tuberculosis and of newdiseases such as HIV/AIDS, as well as living standards andeducational levels. Projecting mortality in developingcountries is difficult because of the relative scarcity and poorquality of data on current and past trends. In addition, thefuture course of the HIV/AIDS epidemic could substan-tially affect mortality in many countries, especially in sub-Saharan Africa where HIV prevalence rates are especiallyhigh. HIV/AIDS has slowed, and in some cases reversed,the impressive gains in life expectancy in developing coun-tries over the past several decades. In Botswana, for exam-ple, life expectancy has dropped from about 65 years in theearly 1990s to 56 years in the late 1990s and is expected todecline to below 40 years by 2005 (United Nations 2003e).
The possibility of environmental feedbacks is sometimessuggested as important when considering future mortalityrates. The most frequently discussed possibilities for futureeffects center around the idea of carrying capacity (the max-imum number of people that Earth can support) and thepotential health impacts of climate change. Currently, how-ever, population projections do not take explicit account ofpossible large-scale environmental feedbacks on mortalitythat have not yet occurred, although they do implicitlyconsider smaller effects, since they have affected averagetrends in the past, and since past trends serve as an importantcomponent of projections (National Research Council2000).
There are at least three reasons that carrying capacity isnot considered in long-term population projections. First,there is no agreement on what the limiting factors to popu-lation growth might be. Carrying capacity is contingent oneconomic structure, consumption patterns, preferences (in-cluding those regarding the environment), and their evolu-
PAGE 180
tion over time (Arrow et al. 1995), defying attempts toattach a single number to the concept. Any proposed limitrelevant to projections over the next century or two woulddepend primarily on which factor or factors were assumedto be limiting, as well as on how thinly any one factor hadto be spread to begin to exert its limiting influence. Pro-posed limits have been based on a wide range of factors,including supplies of energy, food, water, and mineral re-sources, as well as disease and biological diversity. No con-sensus on the human carrying capacity has emerged; on thecontrary, the range of estimates has widened over time(Cohen 1995). Second, even if the relevant factors could beagreed on, it would be difficult to project the future evolu-tion of those factors for use in population projections (Key-fitz 1982). Future agricultural systems, energy supplies, andwater availability are difficult to foresee in their own right,and there is no consensus in these areas to which demog-raphers might turn. Third, even if these factors could bereliably predicted, their effects are mediated through eco-nomic, political, and cultural systems in ways that are notpossible to quantify with confidence (Cohen 1998b).
Environmental effects on mortality short of a large-scalecatastrophe have received increasing attention, especiallythose that might be driven by future climate change, partic-ularly in combination with other trends such as changingspatial distributions of population, land use change, and ag-ricultural intensification. The ultimate mortality impact ofthese environmental health risks is uncertain (Daily andEhrlich 1996). (See Chapter 9 of IPCC (2002) for a discus-sion of climate change and human health, and Chapter 11in this volume.) Yet even the most pessimistic forecasts foradditional deaths, when spread over large populations, donot significantly change the general outlook for mortalityglobally.
7.2.1.2.3 International migration
Future international migration is more difficult to projectthan fertility or mortality. Migration flows often reflectshort-term changes in economic, social, or political factors,which are impossible to predict. And since no single, com-pelling theory of migration exists, projections are generallybased on past trends and current policies, which may not berelevant in the future. Even past migration flows provideminimal guidance because there is often little informationabout them.
Projections of international migration generally beginwith consideration of current and historical trends (Zlotnik1998; United Nations 2003b). For example, most projec-tions foresee continued net migration into traditional re-ceiving countries such as the United States, Canada, andAustralia. These trends may then be modified based on po-tential changes in underlying forces affecting migration.The forces are complex, and no single factor can explainthe history of observed migration trends. For example, pop-ulation growth rates in sending regions are not a good indi-cator of emigration flows. In general, correlations betweenrates of natural increase in developing countries and levelsof emigration to higher-income countries have been weakor nonexistent.
................. 11411$ $CH7 10-27-05 08:42:14 PS

181Drivers of Change in Ecosystem Condition and Services
A number of theories from different disciplines have at-tempted to explain migration flows (Massey et al. 1998).International migration is often viewed mainly as a mecha-nism for redistributing labor to where it is most productive(Todaro 1976), driven by differences in wages among areas.Individuals decide whether to migrate by weighing the esti-mated benefits of higher wages in a new location againstthe costs of moving. The choice of destination will dependon where migrants perceive their skills to be most valuable.
This basic model emphasizing the labor market has beenextended to address recognized shortcomings. The newerapproach, sometimes called new economics models, as-sumes that migration decisions are not strictly individual butare affected by the preferences and constraints of families.Decisions are made not only to maximize income, for ex-ample, but also to meet family or household demands forinsurance. By diversifying family labor, households canminimize risks to their well-being (Stark 1991).
Migration theory also requires consideration of politicalfactors, especially to explain why international flows aremuch lower than would be predicted based solely on eco-nomic costs and benefits. Since a fundamental function ofthe state is to preserve the integrity of a society by control-ling entry of foreigners, explanations must balance the in-terests of the individual with those of society as expressedthrough migration policies.
The various factors influencing migration decisions areoften categorized according to whether they attract mi-grants to a region of destination (‘‘pull’’ factors), drive mi-grants out of regions of origin (‘‘push’’ factors), or facilitatethe process of migration (‘‘network’’ factors) (Martin andWidgren 1996). In addition to the factors evoked by thesetheories, others might include the need to flee life-threaten-ing situations, the existence of kin or other social networksin destination countries, the existence of an undergroundmarket in migration, and income inequality and changes incultural perceptions of migration in sending countries thatare induced by migration itself (United Nations 1998).
An additional factor particularly relevant to the MA isthe potential for growing numbers of ‘‘environmental refu-gees’’—people driven to migrate by environmental factors(El-Hinnawi 1985). There is considerable debate on the rel-evance of environmental change to migration (Suhrke1994; Hugo 1996). At one end is the view that environ-mental conditions are just one of many ‘‘push’’ factors in-fluencing migration decisions (MacKellar et al. 1998).Environmental change, in this view, primarily acts indi-rectly by reducing income (by, for example, reducing ag-ricultural productivity), making income less stable ornegatively affecting health or environmental amenities. Italso acts in concert with other factors, and therefore its rela-tive role is difficult to isolate. At the other end lies the viewthat deteriorating environmental conditions are a key causeof a significant number of migrants in developing countries(Jacobson 1989; Myers 2002). While other factors such aspoverty and population growth may interact with environ-mental change, environmental degradation is assumed toplay a principal role.
PAGE 181
The degree to which environmental migration is rele-vant to long-term population projections depends in parton the anticipated magnitude of the population move-ments. One estimate puts the number of environmental ref-ugees in the mid-1990s at 25 million (over half of them insub-Saharan Africa) (Myers and Kent 1995; Myers 2002).In comparison, there were about 26 million refugees as tra-ditionally defined and an estimated 125 million interna-tional migrants—that is, people living in a country otherthan the one in which they were born (Martin and Wid-gren 1996; United Nations 1998). According to the UnitedNations High Commissioner on Refugees, there wereabout 13 million refugees in 1995, and an additional 13million ‘‘persons of concern to the UNHCR,’’ a group thatincludes people forced from their homes or communitiesbut still residing in their own countries. Since Myers in-cludes displaced persons who have not crossed internationalborders in his definition of ‘‘environmental refugees,’’ thetotal figure—26 million—is the most relevant for compari-son. Myers (2002) predicts that the number of environmen-tal refugees is likely to double by 2010, and could swell to200 million by 2025 due to the impacts of climate changeand other sources of environmental pressure.
The potential relevance of these figures to populationprojections also depends on the level of aggregation. Mostenvironmental migration occurs within national boundariesand therefore would not affect any of the long-term popu-lation projections. Additionally, some long-term projectionsare made at the level of world regions, so that much of theinternational migration would be masked as well. Finally, ifenvironmental migration occurs in the future, its relevancecompared with other factors driving migration, such as eco-nomic imbalances, must be weighed before concluding it isimportant to long-range population projections.
7.2.1.3 Demographic Change and Ecosystem Consequences
The ways in which population change influences ecosys-tems are complex. The basic pathway is from growing con-sumption driven by population to production processes thatrely in part on ecosystem services to meet that consump-tion. The ultimate effects on ecosystems of an additionalperson are influenced by the entire range of indirect drivers.Research on direct population-environment interactionshas focused increasingly on demographic characteristics thatgo beyond population size, and on a wide range of mediat-ing factors.
For example, the energy studies literature has identifiedhousehold characteristics such as size, age, and compositionas key determinants of residential energy demand (Schipper1996a). Household size appears to have an important effecton per capita consumption, most likely due to the existenceof substantial economies of scale in energy use at the house-hold level (Ironmonger et al. 1995; Vringer and Blok 1995;O’Neill and Chen 2002). Smaller household size is oftenaccompanied by a larger number of households, and there issome evidence that the number of households, rather thanpopulation size per se, drives environmentally significantconsumption (Cramer 1997, 1998). Research on ecologicalimpacts of changes in household size and numbers has a
................. 11411$ $CH7 10-27-05 08:42:15 PS

182 Ecosystems and Human Well-being: Scenarios
shorter history but has also suggested a link between thetwo (Liu et al. 2003). Much of this literature is based oncase studies, which suggest the importance of local contextin determining population and land use interactions (Na-tional Academy of Sciences 2001). It has also been suggestedthat larger populations create difficulties for democratic in-stitutions and thus environmental governance (Dahl andTufte 1973; Frey and Al-Mansour 1995; Dietz 1996/1997).
These relationships may be important determinants ofaggregate consumption in the future, since the proportionof the population living in various household types mayshift substantially. The aging process itself leads to a shifttoward smaller households, as children become a smallerfraction of the population. In addition, changes in prefer-ences for nuclear over extended households may lead toeven greater shifts in developing countries.
7.2.1.4 Overview of Demographic Drivers in the MA Scenarios
Four population projections were developed for the MAScenarios Working Group to use in the quantification ofstorylines. All four projections are based on the IIASA 2001probabilistic projections for the world (Lutz et al. 2001),but they are designed to be consistent with the four MAstorylines, as judged by the Working Group with additionalinput from IIASA demographers (O’Neill 2005).
Table 7.2 lists the qualitative assumptions about fertility,mortality, and migration for each storyline. These assump-tions are expressed in terms of high, medium, and low(H/M/L) categories, defined not in absolute but in relativeterms—that is, a high fertility assumption for a given regionmeans that fertility is assumed to be high relative to themedian of the probability distribution for future fertility inthe IIASA projections. Since the storylines describe eventsunfolding through 2050, the demographic assumptionsspecified here apply through 2050 as well. For the period2050–2100, the demographic assumptions were assumed toremain the same, in order to gauge the consequences oftrends through 2050 for the longer term. This is not in-tended to reflect any judgment regarding the plausibility oftrends beyond 2050.
Figure 7.2 shows results for global population size. Therange of population values in the scenarios is 8.1–9.6 billionin 2050 and 6.8–10.5 billion in 2100. These ranges cover50–60% of the full uncertainty distribution for population
Table 7.2 Fertility, Mortality, and Migration Assumptions, by Scenarioa
Variable Global Orchestration TechnoGarden Order from Strength Adapting MosaicFertility HF: low
LF: lowVLF: medium
HF: mediumLF: mediumVLF: medium
HF: highLF: highVLF: low
Order from Strength until 2010, deviate to medium by 2050
Mortality D: lowI: low
D: mediumI: medium
D: highI: high
Order from Strength until 2010, deviate to medium by 2050
Migration high medium low low
Key: I � more-developed country regions, D � less-developed country regions, HF � high-fertility regions (TFR � 2.1 in year 2000), LF � low-fertilityregions (1.7 � TFR � 2.1), VLF � very-low-fertility regions (TFR � 1.7).
Notes: aIn the ITASA projections, migration is assumed to be zero beyond 2070, so all scenarios have zero migration in the long run.
PAGE 182
2000 2020 2040 2060 2080 2100
Year
UN 2002, High Scenario
IIASA 2001,90th percentile
,
IIASA 2001,10th percentile
UN 2002, Low Scenario
OSAM
TG
GO
0
2
4
6
8
10
12
14
Po
pu
lati
on
(b
illio
n)
Figure 7.2. MA World Population Scenarios, 2000–2100. OS:Order from Strength, TG: TechnoGarden, AM: Adapting Mosaic, GO:Global Orchestration. An overview of each scenario can be found inthe Summary.
size in the IIASA projections. The primary reason that thesescenarios do not fall closer to the extremes of the full uncer-tainty distribution is that they correlate fertility and mortal-ity: the Order from Strength scenario generally assumeshigh fertility and high mortality, and the Global Orchestra-tion scenario generally assumes low fertility and low mortal-ity. Both of these pairs of assumptions lead to moremoderate population size outcomes.
7.2.2 Economic Drivers: Consumption, Production, andGlobalization
Economic activity is a consequence of humans striving toimprove their well-being. It is the myriad of technologicalprocesses that combine physical inputs, many derived fromecosystems, with human effort to generate goods and ser-vices that can improve human well-being. This activity isinfluenced by the endowment of natural resources, includ-ing ecosystem services (natural capital), the number andskills of humans (human capital), the stock of built resources(manufactured capital), and the nature of human institu-tions, both formal and informal (social capital). An earlydefinition of social capital was ‘‘features of social organiza-tion, such as trust, norms, and networks that can improvethe efficiency of society by facilitating coordinated actions’’(Putnam et al. 1993, p 167). We expand the definition hereto include formal institutions, such as the various levels of
................. 11411$ $CH7 10-27-05 08:42:19 PS

183Drivers of Change in Ecosystem Condition and Services
governments and their policies and regulations, and culturaland religious aspects of social organization.
Economic activity is also strongly influenced by availabletechnologies. Local resource endowments of all kinds, andtechnologies, can be enhanced by access to other markets.International flows of goods and services, capital, labor, andideas change the mix of economic activities that can be un-dertaken at home and the variety of items available for con-sumption.
7.2.2.1 Economic Growth, Changing Consumption Patterns,and Structural Transformation
Human well-being is clearly affected by economic growthand its distribution. Income received by individuals andfamilies determines their level and nature of consumption.As per capita income grows, the nature of consumptionchanges, shifting from basic needs to goods and services thatimprove the quality of life. Businesses respond to thesechanging demands by producing an evolving mix of prod-ucts.
As income increases, the mix of economic activitieschanges. This process, sometimes referred to as structuraltransformation, is driven by human behavior summarizedin the form of two related economic ‘‘laws’’ with importantconsequences for ecosystems—Engel’s law and Bennett’slaw. Engel’s law, named after the German statistician whofirst observed the resulting statistical regularity, states that asincome grows, the share of additional income spent on fooddeclines. This relationship follows from basic human behav-ior. After basic food needs are met, the demand for an addi-tional quantity of food drops off rapidly. Bennett’s law statesthat as incomes rise, the source of calories changes. (Amonograph by M. K. Bennett on Wheat in National Dietsin a 1941 issue of Wheat Studies (Bennett 1941) and relatedcomparative studies of the consumption of staple foods ledto the empirical generalization that there is an inverse rela-tionship between the percentage of total calories derivedfrom cereals and other staple foods and per capita income.)The importance of starchy staples (e.g. rice, wheat, pota-toes) declines, and diets include more fat, meat and fish, andfruits and vegetables. This behavior is the result of a generalhuman desire for more dietary diversity and the ability toafford it as income rises.
These laws have several consequences for ecosystemcondition and demand for ecosystem services. As incomegrows, the demand for nonagricultural goods and servicesincreases more than proportionally. Producers respond bydevoting relatively more resources to industry and serviceactivities than agriculture. The share of agricultural outputin total economic activity falls. The shift to a more diversediet, in particular to more animal- and fish-based proteinintake, slows the shift away from agriculture. Total con-sumption of starchy staples rises over some range of incomesas animal consumption that relies on feed grains graduallyreplaces direct human consumption of those grains. Even-tually the demand for more diverse diets is satisfied, andfurther income growth is spent almost entirely on nonagri-cultural goods and services.
PAGE 183
Industrial output share rises initially but then falls.Throughout the process of economic development, the im-portance of services in economic output rises continuously.A consequence of this shift toward services is that by thelate 1990s, services provided more than 60% of global output,and in many countries an even larger share of employment(World Trade Organization 2004). In 2000, agriculture ac-counted for 5% of world GDP, industry accounted for 31%,and service industries, 64% (World Resources Institute et al.2002).
Figure 7.3 documents the shift in economic structure inthe past two centuries of the world’s largest economies fromagricultural production to industry and, to a greater extent,services. In developing regions a marked decline in the con-tribution of agriculture to GDP has occurred in recentyears, but the contribution of services is larger than it washistorically in industrial countries at the same level of in-come.
The shift away from agriculture and toward nonagricul-tural goods and then services is sometimes viewed as a proc-ess that ultimately reduces pressures on ecosystems, sinceservices are assumed to be the least demanding of ecosystemproducts. But this outcome must be interpreted carefully. Itis important to distinguish between absolute and relativechanges. High-income countries almost always producemore agricultural output than when they were poor, butindustrial and services output grows much faster, so the rela-tive contribution of agriculture declines. Technologicalchange further replaces most of the labor force in agricul-ture, potentially altering the demands for ecosystem ser-vices. The way agricultural statistics are reported also tendsto overemphasize the extent of the decline in the economicimportance of agriculture. In developing countries, the ag-ricultural sector is ‘‘vertically integrated’’—farmers produceeverything from seeds and agricultural infrastructure to foodservices. In high-income countries, ‘‘agricultural’’ statisticsfocuses only on production of primary products. ‘‘Food’’production is reported in statistics on industry, transport,and services (fast food, restaurants, and so on).
Urbanization also influences the structure of food con-sumption, increasing the service content dramatically. Ruralconsumers are more likely to consume food produced athome. Urban consumers are more likely to demand easilyprepared, quick meals and to purchase them from restau-rants. Supermarkets replace neighborhood stores and streetvendors.
A few examples from Asian countries with rapidly risingincomes illustrate these phenomena, although similarchanges are occurring throughout the developing worldtoday and happened in the industrial world in the twentiethcentury. Data from China show that the human intake ofcereals and the consumption of coarse grains decreased dur-ing the past two decades in both urban and rural popula-tions, and there was a dramatic increase in the consumptionof animal foods. A similar, but less dramatic change is alsoobserved in India, with figures that suggest a doubling inthe intake of fat calories over a 20-year period. Althoughthe Indian consumption of rice and wheat has been increas-ing, the percentage of all cereals in household expenditure
................. 11411$ $CH7 10-27-05 08:42:20 PS

184 Ecosystems and Human Well-being: Scenarios
Figure 7.3. Changes in Economic Structure for Selected Countries, 1820–1992 (Nakicenovic et al. 2000; Maddison 1995)
has been declining. Meat consumption in India has beengrowing, although not as fast as in China (FAO 2004). Themajor increases in food consumption in India are in milk,eggs, fruit, and vegetables. Vegetable oil demand is alsogrowing (USDA 2001).
By 2002, the share of supermarkets in the processed andpackaged food retail market was 33% in Southeast Asia and63% in East Asia. The share of supermarkets in fresh foodswas roughly 15–20% in Southeast Asia and 30% in East Asiaoutside China. The 2001 supermarket share of Chineseurban food markets was 48%, up from 30% in 1999. Super-markets are also becoming an emerging force in South Asia,particularly in urban India since the mid-1990s (Pingali andKhwaja in press).
7.2.2.2 Economic Growth, Distribution, and Globalization
The rate of growth and its sectoral composition depend onresource endowments, including ecosystem condition, onthe technologies available, and on the extent of marketreach. Hence the effects of global economic performanceon ecosystems are more than straightforward changes in na-tional income. International trade, capital flows, technologytransfer, and technical change are crucial elements in globalgrowth.
Perhaps the most comprehensive compilation of data onhistorical economic development is that of Maddison(1995). Table 7.3 shows Maddison’s per capita GDP growthrate estimates for selected regions and time periods. Since1820, global GDP has increased by a factor of 40, or at arate of about 2.2% per year. In the past 110 years, global percapita GDP grew by a factor of more than five, or at a rateof 1.5% per year. Between 1950 and 2000, world GDPgrew by 3.85%, resulting in an average per capita incomegrowth rate of 2.09% for that period (Maddison 2003).
PAGE 184
In the late twentieth century, income was distributedunevenly both within countries and around the world. (SeeFigure 7.4.) The level of per capita income was highest inNorth America, Western Europe, Australasia, and North-east Asia (see Figure 7.5 in Appendix A), but growth rateswere highest in South Asia, China, and parts of SouthAmerica (see Figures 7.6a and 7.6b in Appendix A). If thesetrends continue, global income disparities will be reduced,although national disparities might increase. Africa is a con-spicuous exception to the trend of growing incomes.
Economic growth is facilitated by trade. Growth in in-ternational trade flows has exceeded growth in global pro-duction for many years, and the differential may begrowing. (See Figure 7.7.) In 2001, international trade ingoods was equal to 40% of gross world product (WorldBank 2003). Growth in trade of manufactured goods hasbeen much more rapid than trade in agricultural or miningproducts. (See Figure 7.8.)
High incomes in OECD countries and rapid growth inincome in some lower-income countries, combined withunprecedented growth of global interconnectedness, isleading to dramatic changes in lifestyles and consumptionpatterns. For example, tourism is one of the most rapidlygrowing industries, and growth in trade of processed foodproducts and fresh fruits and vegetables is much more rapidthan growth in trade of raw agricultural commodities.
Economic growth requires an expansion of physical andinstitutional infrastructure. The development of this infra-structure can play a major role in the impacts on ecosys-tems. In a review of 152 studies of tropical deforestation,Geist and Lambin (2002) found that 72 studies cited infra-structure extension (including transportation, markets, set-tlements, public services, and private-sector activities) as animportant direct driver. In a similar study evaluating 132
................. 11411$ $CH7 10-27-05 08:42:23 PS

185Drivers of Change in Ecosystem Condition and Services
Table 7.3 Per Capita GDP Growth Rates for Selected Regions and Time Periods (Nakicenovic et al. 2000, based on Maddison 1995,with 1990–2000 data from Maddison 2003)
1870–1913 1913–50 1950–80 1980–92 1990–2000(percent per year)
Western Europe 1.3 0.9 3.5 1.7 1.7
Australia, Canada, New Zealand, United States 1.8 1.6 2.2 1.3 1.9
Eastern Europe 1.0 1.2 2.9 –2.4 0.6
Latin America 1.5 1.5 2.5 –0.6 1.4
Asia 0.6 0.1 3.5 3.6 3.2
Africa 0.5 1.0 1.8 –0.8 0.1
World (sample of 199 countries) 1.3 0.9 2.5 1.1 1.5
Figure 7.4. Income Level and Distribution, 1970 and 2000. Note:the data used are adjusted to 1985 prices and are PPP adjusted,drawing on various Summers and Heston/Penn-World Tables work.(Sala-i-Martin 2003, as reproduced in Barro and Sala-i-Martin 2003)
studies on desertification, they found infrastructure exten-sion cited 73 times (Geist and Lambin 2004).
7.2.2.3 Economic Distortions
Government policies can alter market outcomes, increasingor reducing prices and changing production and consump-tion levels. By some estimates, distortions in agriculturalmarkets are the largest. Total support to agriculture inOECD countries averaged over $324 billion per year in2001–03; about three quarters of this amount was used to
PAGE 185
Figure 7.7. World Trade and GDP Growth, 1930–95 (World TradeOrganization 2003)
Figure 7.8. World Merchandise Trade by Major Trade Groups,1950–2001 (http://www.wto.org/English/res_e/statis_e/its2002_e/its02_longterm_e.htm)
................. 11411$ $CH7 10-27-05 08:42:39 PS

186 Ecosystems and Human Well-being: Scenarios
support farm income directly, while the remainder wentinto general infrastructure improvements, research, market-ing, and so on (OECD 2004). Many of these subsidies werein the form of higher prices to farmers, providing directincentive to increase agricultural production. In low-income countries, on the other hand, governments some-times tax agriculture directly or indirectly and do notprovide support systems of research, marketing, and trans-portation infrastructure (Anderson and Hayami 1986).
According to the U.N. Environment Programme(UNEP 1999), global energy subsidies currently total $200billion a year (de Moor 2002). OECD countries spend some$82 billion a year subsidizing energy production, mostlythrough tax breaks, cheap provision of public infrastructureand services, subsidized capital, and price support (OECD1997). Globally, more than 80% of the subsidies are for fossilfuels use, among the most polluting energy sources.
7.2.2.4 Determinants of Economic Growth and Development
Economic growth and development depend on growth inthe availability of resources, the mobility of those resources,the efficiency of their use, and the institutional and policyenvironment. Growth in per capita output depends on totaloutput growing more rapidly than population.1
Numerous preconditions must be met before any ‘‘takeoff ’’ into accelerated rates of productivity and economicgrowth can materialize. Research based on historical evi-dence allows a number of generalizations as to the patternsof advances in productivity and economic growth—the im-portance of economic openness to trade and capital flowsand the contribution of technological change eitherthrough innovation or adoption. Little research has beenundertaken on the role of ecosystems in economic growth.
Chenery et al. (1986) and Barro (1997) indicate strongempirical evidence of a positive relationship between tradeopenness and productivity, industrialization, and economicgrowth. For example, between 1990 and 1998 the 12 fast-est-growing developing countries saw their exports ofgoods and services increase 14% and their output 8%(World Bank 2002). Dosi et al. (1990) highlight the criticalroles of policies and institutions in realizing economic gainsfrom the international division of labor.
It is theoretically possible that trade liberalization couldhave negative economic impacts on countries where prop-erty rights are not well defined, but little empirical evidenceexists of this actually occurring. However, not all tradeflows are equal in their effects on growth. Dollar and Col-lier (2001) found that the countries experiencing the mostrapid trade-driven economic growth were trading a largeshare of high-technology products.
The late twentieth century trend toward more openeconomies led to greater uniformity in macroeconomic(monetary, fiscal, and exchange rate) policies across theworld and facilitated capital mobility. International capitalflows are critical to economic growth because they relieveresource constraints and often facilitate technology transfersthat enhance productivity of existing resources. But not alldeveloping countries participated equally. For instance, the
PAGE 186
vast majority of private-sector capital flows is concentratedin the 10 largest developing countries (World Bank 2002).
Adoption of technical improvements leads to the pro-ductivity growth essential to improvements in per capitaincome. Expenditures on research and development typi-cally have high returns. Late-developing countries can, fora time, rely on borrowing technologies to improve produc-tivity. Growth rates tend to be lower for economies at thetechnology and productivity frontier. For instance, nine-teenth-century productivity and per capita GDP growthrates in the rapidly industrializing United States far ex-ceeded those of England, then at the technology and pro-ductivity frontier. Likewise, in the post–World War IIperiod, growth rates in Japan and most of Western Europeexceeded U.S. rates (by then at the technology and produc-tivity frontier) (Maddison 1991, 1995). High human capital(education), a favorable institutional environment, freetrade, and access to technology are key factors for rapid eco-nomic catch-up.
Sustained high-productivity growth and in some casesexploitation of natural resources (including ecosystem ser-vices) resulted in the current high levels of per capita in-come in OECD countries. Latecomers (such as Austria,Japan, and Scandinavia) rapidly caught up to the productiv-ity frontier of other OECD economies in the post–WorldWar II period. Per capita GDP growth rates of 3.5% peryear were, for instance, achieved in Western Europe be-tween 1950 and 1980. The developing economies of Asiaachieved high per capita GDP growth rates beginning inthe 1960s. Per capita GDP growth rates of individual coun-tries have been extremely high for short periods—8% a yearin Japan in 1950–73, 7% in Korea between 1965 and 1992,and over 6% per year in China from the early 1980s to themid-2000s (Maddison 1995).
7.2.2.5 Economic Productivity and Energy and MaterialsIntensity
Economy activity requires energy and physical inputs, someof which are ecosystem services, to produce goods and ser-vices. The rate of conversion of inputs to economically val-uable outputs is an important determinant of the impact onecosystems. Materials and energy requirements (inputs) perunit of economic activity (often measured by GDP) are re-ferred to as materials and energy intensity, respectively.Some evidence suggests that materials and energy intensityfollow an inverted U-curve (IU hypothesis) as incomegrows—that is, the requirements per unit of economic ac-tivity rise for some earlier increases in economic activityand then decline. For some materials, the IU hypothesis(Moll 1989; Tilton 1990) holds quite well. The underlyingexplanatory factors are a mixture of structural change in theeconomy along with technology and resource substitutionand innovation processes. Recent literature suggests that anN-shaped curve better describes the relationship of materialintensity in high-income countries (De Bruyn and Op-schoor 1994; De Bruyn et al. 1995; Suri and Chapman1996; Ansuategi et al. 1997).2
Figure 7.9 in Appendix A shows material intensity ver-sus per capita income data for 13 world regions for some
................. 11411$ $CH7 10-27-05 08:42:40 PS

187Drivers of Change in Ecosystem Condition and Services
metals (van Vuuren et al. 2000; see also the discussion inDe Vries et al. 1994). Figure 7.10 in Appendix A shows asimilar curve for total energy intensity (including traditionalnoncommercial energy forms) for 11 world regions, againas a function of per capita income (Nakicenovic et al. 1998).
Commercial energy intensity of GDP generally followsthe IU hypothesis, although the initially rising part of com-mercial energy intensity stems from replacing traditionalenergy forms and technologies with modern commercialenergy forms. Traditional energy sources such as fuelwood;agricultural wastes, including dung; work of animals; windmills; and water wheels have low energy intensity comparedwith modern energy sources such as oil products and elec-tricity. The traditional methods of biomass combustion arenot only inefficient but lead to a wide range of health haz-ards, such as indoor air pollution (Smith and Mehta 2003).Replacing traditional energy sources and carriers with mod-ern sources increases the conversion efficiencies, especiallyat the point of end use. Consequently, the resulting aggre-gate total (commercial plus noncommercial) energy inten-sity shows a persistent declining trend over time, especiallywith rising incomes (Watson et al. 1996; Nakicenovic et al.1998). (See Figure 7.11 in Appendix A.)
There are two important points to retain from Figures7.9–7.11 in Appendix A. First, energy and materials inten-sity (that is, energy use per unit of economic output) tendto decline with rising levels of GDP per capita. In otherwords, energy and material productivity—the inverse ofenergy intensity—improve in line with overall macro-economic productivity.
Second, growth in productivity and intensity improve-ment has historically been outpaced by economic outputgrowth. Hence, materials and energy use have risen in abso-lute terms over time (Nriagu 1996; Watson et al. 1996;Grubler 1998). An important issue for the future is whethertechnological advancement can outpace economic growthand lead to reductions in materials and energy use.
It is also important to emphasize that energy and mate-rial intensity are affected by many factors other than macro-economic productivity growth. OECD (1998) notes thathigh rates of productivity increase have been associated inthe past with new competitive pressures, strong price orregulatory incentives, catching up or recovery, and a good‘‘climate for innovation.’’ Table 7.4 summarizes selectedmacroeconomic, labor, energy, and material productivityincreases that have been achieved in a range of economiesand sectors at different times. (See also the discussion lateron science and technology drivers.) This historical evidencesuggests that continued productivity growth is a reasonableassumption for the future.
For instance, low historical rates of energy intensity im-provement reflect the low priority placed on energy effi-ciency by most producers and users of technology. Onaverage, energy costs account for only about 5% of GDP.Energy intensity reductions average about 1% per year, incontrast to improvements in labor productivity above 2%per year over the period 1870 to1992. Over shorter timeperiods, and given appropriate incentives, energy intensityimprovement rates can be substantially higher, as in the
PAGE 187
OECD countries after 1973 or in China since 1977, whereenergy intensity improvement rates of 5% have been ob-served.
Rapid productivity growth can also occur during peri-ods of successful economic catch-up; for instance, Japaneselabor productivity grew at 7.7% annually during 1950–73(Maddison 1995). Similar high-productivity growth wasalso achieved in industrial oil usage in the OECD or U.S.car fuel economies after 1973. Of the examples given inTable 7.4, productivity increases are the highest for com-munication. Many observers consider that communicationmay become as an important a driver of economic growthin the future as traditional resource- and energy-intensiveindustries have been in the past.
7.2.2.6 Economic Drivers and Ecosystem Consequences
The twin questions of the sustainability of economicgrowth and its impact on the environment were given highvisibility by the 1987 report of the World Commission onEnvironment and Development (World Commission onEnvironment and Development 1987). Researchers havestarted to look for empirical evidence to answer these ques-tions and provide a theoretical basis for understanding theinteractions between economic development and environ-mental quality (Grossman 1995; Dasgupta et al. 1997).
Some argue that continuous economic growth requiresan ever-increasing amount of resources and energy and pro-duces rising pollution and waste levels. As Earth’s naturalresources and its capacity to absorb waste are finite, contin-uous economic growth will eventually overwhelm the car-rying capacity of the planet (Georgescu-Roegen 1971 citedin Meadows et al. 1972; Panayotou 2000). Therefore, theyargue, economic systems must eventually be transformed tosteady-state economies, in which economic growth ceases(Daly 1991).
Others argue that economic growth results eventually ina strengthening of environmental protection measures andhence an increase in environmental quality. Higher per cap-ita income levels spur demand for a better environment,which induces development of policies and regulations toaddress environmental quality problems. As the IU hypoth-esis suggests, initial empirical research found that at lowerlevels of income, economic growth is connected with in-creasing environmental damage. But after reaching a certainlevel of per capita income, the impact on at least some ele-ments of environmental quality reverses.
Pollution abatement efforts appear to increase with in-come, a growing willingness to pay for a clean environ-ment, and progress in the development of clean technology.This process seems well established for traditional pollut-ants, such as particulates and sulfur (e.g., World Bank 1992;Kato 1996; Viguier 1999), and there have been some claimsthat it might apply to greenhouse gas emissions. Schmalen-see et al. (1998) found that CO2 emissions have flattenedand may have reversed for highly developed economiessuch as the United States and Japan. This IU relationship issometimes referred to as the Environmental Kuznets Curve,named for a similar-looking relationship between incomeand inequality identified by Simon Kuznets (Kuznets 1955).
................. 11411$ $CH7 10-27-05 08:42:40 PS

188 Ecosystems and Human Well-being: Scenarios
Table 7.4 Examples of Productivity Growth for the Entire Economy and for Selected Sectors and Countries (Nakicenovic et al. 2000)
Sector/Technology Region Productivity Indicator Period Annual Productivity Change(percent)
Whole economy a 12 countries Europe GDP/capita 1870–1992 1.7
Whole economy a 12 countries Europe GDP/hour worked 1870–1992 2.2
Whole economy a U.S. GDP/hour worked 1870–1973 2.3
Whole economy a U.S. GDP/hour worked 1973–92 1.1
Whole economy a Japan GDP/hour worked 1950–73 7.7
Whole economy a South Korea GDP/hour worked 1950–92 4.6
Whole economy b World GDP/primary energy 1971–95 1.0
Whole economy b OECD GDP/primary energy 1971–95 1.3
Whole economy b U.S. GDP/primary energy 1800–1995 0.9
Whole economy b United Kingdom GDP/primary energy 1890–1995 0.9
Whole economy b China GDP/primary energy 1977–95 4.9
Whole economy c Japan GDP/material use 1975–94 2.0
Whole economy c U.S. GDP/material use 1975–94 2.5
Agriculture d,e Ireland tons wheat/hectare 1950–90 5.3
Agriculture e Japan tons rice/hectare 1950–96 2.2
Agriculture e India tons rice/hectare 1950–96 2.0
Industry a OECD (6 countries) value added/hour worked 1950-84 5.3
Industry a Japan value added/hour worked 1950–73 7.3
Industry b OECD industrial production/energy 1971–95 2.5
Industry b OECD industrial production/energy 1974–86 8.0
New cars f U.S. vehicle fuel economy 1972–82 7.0
New cars f U.S. vehicle fuel economy 1982–92 0.0
Commercial aviation g World ton-km/energy 1974–88 3.8
Commercial aviation g World ton-km/energy 1988–95 0.3
Commercial aviation g World ton-km/labor 1974–95 5.6
Telephone call costs d Transatlantic London–NY, costs for 3 minutes 1925–95 8.5
Telephone cables d Transatlantic telephone calls/unit cable mass 1914–94 25.0
Data sources: a Maddison 1995. b OECD and IEA statistics. c WRI 1997. d OECD 1998b; Waggoner 1996; Hayami and Ruttan 1985.e FAO (various years 1963–96) Production Statistics. f Includes light trucks; Schipper 1996. g International Civil Aviation Organization statistics.
(See Grossman and Krueger 1992; Shafik and Bandyopad-hay 1992; Panayotou 1993.)
The principal explanation for this relationship is changesin economic structure, from more industrial to more ser-vices, which occur with development and technical innova-tion that provides more resource-efficient technologies(Stern 2004). (While it often assumed that the shift towardservices will reduce environmental impact, this assertion hasbeen challenged (Salzman and Rejeski 2002; York et al.2003b). In addition, a number of more indirect factors, suchas the growing awareness of environmental problems, edu-cation, and improved environmental regulations, are nowalso seen as affecting the shape of the curve (Stern 2004).
The EKC hypothesis has generated many studies (for athorough literature review, see Panayotou 2000 and Stern2004). Stern (2004) provides one of the most recent reviewsof the criticism and states that ‘‘there is little evidence for acommon inverted U-shaped pathway which countries fol-low as their income rises.’’ There are three main criticismsof the EKC results: First, its econometric foundations havebeen challenged (Harbaugh et al. 2000; Stern 2004). A sec-
PAGE 188
ond issue is the choice of indicators selected to representenvironmental quality (Grossman 1995). A third criticismhighlights omitted variables. Panayotou (2000) describes theuse of per capita income in the EKC analysis as an ‘‘omni-bus variable representing a variety of underlying influ-ences.’’ Urbanization, infrastructure, poverty, and incomedistribution are other factors in the complex interplay be-tween economic growth, population, and environment(see, e.g., Rotmans and de Vries 1997; DeVries et al. 1999;O’Neill et al. 2001).
In summary, the EKC is at best a reduced form descrip-tion, not a precise formulation of cause and effect, whichcaptures a few of the complex interactions among eco-nomic activity and ecosystem condition and service. Otherattempts at describing, identifying, and explaining aggregaterelationships between economic activity and the environ-ment, such as the ecological footprint (York et al. 2003a),are subject to similar criticisms.
In conclusion, there is controversy about whether thecurrent rate of global economic growth is sustainable. Thereis little question that some, perhaps many, of the world’s
................. 11411$ $CH7 10-27-05 08:42:42 PS

189Drivers of Change in Ecosystem Condition and Services
ecosystems have experienced unsustainable pressure as re-sources are extracted and ecosystem services are used toproduce this growth. However, given the complexity of theinteractions among economy and environment, simple for-mulations of the relationships between ecosystem sustain-ability and economic growth are not possible.
7.2.2.7 Tourism as an Example of Economic Drivers and theEnvironment
Tourism provides a good example of the complexities ofthe interactions among economic growth and ecosystems.World tourism spending is expected to grow at over 6% peryear (World Tourism Organization as referenced in Hawk-ins and Lamoureux 2001), making it one of the world’sfastest growing industries and a major source of foreign ex-change earning and employment for many developingcountries.3
Tourism is increasingly focusing on natural environ-ments. Specialty tourism, including ecotourism, accountedfor about 20% of total international travel in the late 1990s(World Tourism Organization (1998) as cited in Hawkinsand Lamoureux 2001). Ecotourism has the potential tocontribute in a positive manner to socioeconomic well-being, but fast and uncontrolled growth can be the majorcause of ecosystem degradation and loss of local identityand traditional cultures. Paradoxically, the very success oftourism can lead to the degradation of the natural environ-ment. By drawing on local natural resources, tourism canreduce a location’s attractiveness to tourists. The discussionsin Weaver (2001) on tourism in rainforests, mountain eco-systems, polar environments, islands and coasts, deserts, andmarine environments highlight these trade-offs.
Tourism is sometimes seen as an opportunity for eco-nomic development, economic diversification, and thegrowth of related activities, especially in developing coun-tries. Among the benefits are direct revenues, generated byfees and taxes incurred and by voluntary payments for theuse of biological resources. These revenues can be used forthe maintenance of natural areas and a contribution of tour-ism to economic development, including linkage effects toother related sectors and job creation. However, it is wellknown that in developing countries a significant share ofthe initial tourist expenditures leave the destination countryto pay for imported goods and services (Lindberg 2001).
Sustainable tourism can make positive improvements tobiological diversity conservation, especially when localcommunities are directly involved with operators. If localcommunities receive income directly from a tourist enter-prise, they are more likely to provide greater protection andconservation of local resources. Moreover, sustainable tour-ism can serve as an educational opportunity, increasingknowledge of and respect for natural ecosystems and bio-logical resources. Other benefits include providing incen-tives to maintain traditional arts and crafts and traditionalknowledge, plus innovations and practices that contributeto the sustainable use of biological diversity.
The impacts of tourism on ecosystems in general and onbiodiversity in particular can be positive or negative, director indirect, and temporary or lasting, and they vary in scale
PAGE 189
from global to local (van der Duim and Caalders 2002). Thedifferent pathways these effects take are depicted in Figure7.12.
Clearly, tourism acts on various direct drivers of the MAconceptual framework. Gossling (2002a) reports:• Changes in land cover and land use due to tourism-
related investments, including accommodation and golfcourses, amount to more than 500,000 square kilome-ters, with the largest contribution coming from trafficinfrastructure. Yet these numbers must be interpretedwith caution, as roads, airports, and railways are used fornontourism activities also.
• Energy use and related carbon emissions occur due totransportation, but also due to accommodation and on-site activities. The overall contribution to carbon emis-sions is estimated to be on the order of 5%, of whichtransportation contributes about 90%.
• Biotic exchange is difficult to assess on a global scale, butvarious processes for exchange do exist. This includesthe intentional or unintentional introduction of newspecies, both in the home and the hosting region. Ex-tinction due to collection, hunting, or gathering ofthreatened species is another direct effect.
• Of indirect effect, yet from the human ecology perspec-tive of high relevance, is the change of the human-nature relationships due to intercultural exchange duringtravel. Though it is believed that traveling can contrib-ute to the increase in environmental consciousness ofthe guest, it is also possible that the people in the hostcountry change their perception and understanding ofthe environment, for example by introducing the mod-ern separation of ‘‘culture’’ and ‘‘nature’’ into indige-nous societies (Gossling 2002b).The potential adverse impacts of tourism can be roughly
divided into environmental and socioeconomic, the latteroften imposed on local and indigenous communities.
Direct use of natural resources, both renewable andnonrenewable, in the provision of tourist facilities is one ofthe most significant direct impacts of tourism in a givenarea. Land conversion for accommodation and infrastruc-ture provision, the choice of the site, and the use of buildingmaterials are mechanisms by which ecosystems can be al-tered (Buckley 2001). Negative impacts on species compo-sition and on wildlife can be caused by even such benignbehavior as bird-watching (Sekercioglu 2002) and exacer-bated by inappropriate behavior and unregulated tourismactivities (such as off-road driving, plant-picking, hunting,shooting, fishing, and scuba diving). Tourist transportationcan increase the risk of introducing alien species (water-borne pathogenic bacteria and protozoa, for instance)(Buckley 1998 as cited in Buckley 2001). And the mannerand frequency of human presence can disturb the behaviorof animals, as in the collapse of the feeding and mating sys-tems of the Galapagos land iguana caused by tourist distur-bance (Edington and Edington 1986 as cited in Buckley2001).
Tourism has for many years been focused on mountainand coastal areas. In the mountains, sources of damage in-clude erosion and pollution from the construction of hiking
................. 11411$ $CH7 10-27-05 08:42:42 PS

190 Ecosystems and Human Well-being: Scenarios
Figure 7.12. Pathways of the Ecological Impacts of Tourism on Biodiversity (van der Duim and Caalders 2002)
trails, bridges in high mountains, camp sites, chalets, andhotels (Frost 2001). In marine and coastal environments,impacts arise from inappropriate planning, irresponsible be-havior by tourists and operators, and lack of education onand awareness of the impacts of, for example, tourist resortsalong the coastal zones (Cater and Cater 2001; Halpenny2001).
Tourism is a water-intensive activity with a large pro-duction of waste. The extraction of groundwater by sometourism activities can cause desiccation, resulting in loss ofbiological diversity. Moreover, the disposal of untreated ef-fluents into surrounding rivers and seas can cause eutrophi-cation, and it can also introduce pathogens into waterbodies. Disposal of waste produced by the tourism industrymay cause major environmental problems.
Negative socioeconomic and cultural consequences oftourism include impacts on local communities and culturalvalues (Wearing 2001). Increased tourism activities cancause an influx of people seeking employment or entrepre-neurial opportunities who may not be able to find suitableemployment. If an economy relies heavily on tourism, arecession elsewhere can result in a sudden loss of incomeand jobs. When tourism development occurs, economic
PAGE 190
benefits are sometimes unequally distributed among mem-bers of local communities. Lindberg (2001) points out thatin some circumstances, tourism can actually increase ine-qualities, and thus relative poverty, in communities. How-ever, there appears to be no evidence about whether thisis a systematic problem or relatively infrequent. Negativecultural outcomes include intergenerational and genderconflicts, changes in traditional practices, and loss of accessby indigenous and local communities to their land and re-sources as well as sacred sites. Positive outcomes include arenewed interest in maintaining local cultural practices.
Within the tourism industry and also within research ontourism, the notion of ‘‘sustainable tourism’’ has emergedto promote traveling with fewer negative impacts on sus-tainability. According to the World Tourism Organization,sustainable tourism development meets the needs of presenttourists and host regions while protecting and enhancingopportunities for the future. It is envisaged as leading tomanagement of all resources in such a way that economic,social, and aesthetic needs can be fulfilled while maintainingcultural integrity, essential ecological processes, biologicaldiversity, and life support systems. Projects with headlineslike ‘‘ecotourism’’ or ‘‘alternative tourism’’ have emerged
................. 11411$ $CH7 10-27-05 08:42:45 PS

191Drivers of Change in Ecosystem Condition and Services
under the overall premise of sustainable tourism. Thoughsuccess stories do exist, there is evidence that the majorityof projects cannot be genuinely conceived of as being sus-tainable (Collings 1999).
7.2.2.8 Overview of Economic Drivers in the MA Scenarios
The MA scenarios include a rich set of economic drivers,and Chapter 9 provides a more-detailed discussion of these.A useful summary statistic is the differences in per capitaincome. In the MA scenarios, per capita income grows twoto four times between 2000 and 2050, depending on sce-nario. Total economic output grows three to six times dur-ing that period.
7.2.3 Sociopolitical Drivers
‘‘Sociopolitical’’ drivers encompass the forces influencingdecision-making in the large conceptual space betweeneconomics and culture. The boundaries among economic,sociopolitical, and cultural driver categories are fluid,changing with time, level of analysis, and observer (Young2002).
Sociopolitical driving forces have been seen as importantin past environmental change (see, e.g., Redman 1999; deVries and Goudsblom 2002). However, these drivers havebeen more the subject of taken-for-granted assumptionsand speculation than sound theoretical and empirical re-search, so the basis for strong conclusions about how thesedrivers work is limited. This is an active area of researchacross many disciplines, so the state of knowledge is im-proving rapidly. In this regard it is important to rememberthe adage that the lack of evidence of an effect is not evi-dence for a lack of effect. Sociopolitical drivers may besome of the most fundamental influences on how humansinfluence the environment. They should always be givencareful consideration in understanding environmentalchange, and they deserve high priority in future researchagendas.
Some topics under the general theme of sociopoliticaldrivers have been well researched. For example, a strongliterature examines governance of the commons at scalesranging from the local to the global.
Many writers have argued for the importance of democ-racy and equitable distribution of power for protecting theenvironment, and there are numerous accounts of how ar-bitrary uses of power harm the environment (see, for exam-ple, Ehrlich and Ehrlich 2004). When we turn to thescientific literature investigating the effects of democraticinstitutions and other political forms as drivers of environ-mental impact, however, systematic research is still in itsearly stages. There is some theoretical work of long standing(e.g., Beck 1992; Buttel 2003; Mol and Sonnenfeld 2000;Schnaiberg 1980; York and Rosa 2003). But once we movefrom the well-developed literature on institutions for com-mons governance, empirical and analytical research is stillin the early stages of development. Thus we can character-ize the directions current research is taking but cannot drawstrong conclusions.
PAGE 191
For convenience in discussing this general literature, wehave divided sociopolitical drivers into four categories re-lated to governance:• the quantity of public participation in public decision-
making,• the makeup of participants in public decision-making,• the mechanisms of dispute resolution, and• the role of the state relative to the private sector.
7.2.3.1 The Quantity of Public Participation in PublicDecision-making
The general role of the public in decision-making appearsto be expanding, as evidenced by the extent of democrati-zation. Despite some backsliding, there has been a trendaway from centralized authoritarian governments and a riseof elected democracies. As well, there is some evidence ofimproving administrative competence across the develop-ing world (Kaufmann et al. 2003). It is generally assumedthat democratization leads to government actions that arefriendlier to the environment, but the evidence in supportof this assertion is limited (Congleton 1996; York et al.2003a).
The literature on public participation in environmentalassessment and decision-making is much more robust andindicates that such involvement at the local and regionallevel generally leads to more-sustainable approaches tomanaging resources (Stern and Fineberg 1996; Dietz andStern 1998; Tuler and Webler 1999; Lubell 2000; Beierleand Cayford 2002; Dietz et al. 2003).
Finally, there is a substantial and robust literature on akey category of environmental problem—the governanceof commons (Ostrom et al. 2002). Some strong generaliza-tions have emerged from this literature that contrast withHardin’s original stark conclusions (Hardin 1968). We aremore likely to govern commons sustainably when:• ‘‘Resources and use of the resources by humans can be
monitored, and the information can be verified and un-derstood at relatively low cost, . . .
• rates of change in resources, resource-user populations,technology and economic and social conditions aremoderate,
• communities maintain frequent face-to-face communi-cation and dense social networks—sometimes called so-cial capital—that increase the potential for trust, allowpeople to express and see emotional reactions to distrustand lower the cost of monitoring behavior and inducingrule compliance,
• outsiders can be excluded at relatively low cost fromusing the resource . . . , and
• users support effect monitoring and rule enforcement’’(Dietz et al. 2003, p. 1908).The challenge is to find ways of structuring decision-
making processes that support the emergence of these con-ditions or that adapt when they do not obtain.
7.2.3.2 The Makeup of Participants in Public Decision-making
The voices heard in public decision-making and how theyare expressed have changed, as evidenced in the changingrole of women, the rise of civil society, and the growth of
................. 11411$ $CH7 10-27-05 08:42:46 PS

192 Ecosystems and Human Well-being: Scenarios
engaged fundamentalism. Democratic institutions have alsoencouraged decentralized decision-making, with the in-tended beneficiaries having a greater say in the decisionsmade. This trend has helped empower local communities,especially rural women and resource-poor households. De-centralization trends have also had an impact on decisionsmade by regional and international institutions, with theincreasing involvement of NGOs and grassroots organiza-tions, such as traditional peoples groups.
The power of NGOs arises in part from their ability tomobilize voters in societies where the average citizen doesnot participate actively in the political process. Hence, moreopenness and transparency in public decision-making en-hances the influence of NGOs (Princen and Finger 1994).
7.2.3.3 The Mechanisms of Dispute Resolution
The mechanisms by which nations solve their disputes,peaceful and otherwise, are changing. Although the coldwar has ended, the persistence of regional and civil warsand other international conflicts in some parts of the worldcontinues to be a matter of concern. There is an urgentneed to understand the driving forces behind such conflictsand their impact on sustainable livelihoods and the naturalresource base. (See Box 7.1.)
Numerous mechanisms have been proposed to help in-corporate the views of diverse stakeholders into environ-mental decision-making (Renn et al. 1995). While it is notyet clear how these function in practice, there is a growingbody of research on public participation in environmentalassessment and decision-making, and several synthetic ef-forts to understand these processes are under way (U.S. Na-tional Research Council; Kasemir et al. 2003).
7.2.3.4 The Role of the State Relative to the Private Sector
The declining importance of the state relative to the privatesector—as a supplier of goods and services, as a source ofemployment, and as a source of innovation—seems likelyto continue. The future functions of the state in provision-ing public goods, security, and regulation are still evolving,particularly in the developing world. In all countries theimplications of privatization trends on the sustainable man-agement of the local and global resource base are still notclear. The old two-way relationships between governmentsand private firms have been radically changed with theemergence of large numbers of NGOs, which have becomeimportant actors in the political and social scene. For exam-ple, some environmental NGOs employ scientists who playimportant roles in bridging scientific communities to assessenvironmental problems, educating the public, and influ-encing the political process.
An important driver of the new role of NGOs has beenimproved communications technologies that make it easierfor large numbers of like-minded people to work together.Clearly, there is a rapid transition under way in how weorganize and communicate. A major intellectual effort tocome to grips with this driver helps identify the issues butby no means provides a clear picture (Castells 1996).
PAGE 192
7.2.3.5 Education, Knowledge, and Sociopolitical Drivers
Democracy allows more participants into the political proc-ess, but what if some people know more than others, or ifpeople know different things? Formal schooling increaseseconomic productivity and the ability to comprehend andparticipate in the political process, but it is also likely tocontribute to the loss of some indigenous and experientialknowledge. Formal education is often lowest among thepoor who interact most directly with ecosystems.
Average levels of formal education are increasing aroundthe globe, but with great differences in rates, especiallywithin developing regions (United Nations 2003a). Somedeveloping countries, such as China, have invested heavilyin primary and secondary education over the past severaldecades and can anticipate an increasingly well educatedpopulation as educated children become educated adults. Incontrast, other regions, such as South Asia and sub-SaharanAfrica, have very low average education levels that will takedecades to increase substantially (Lutz and Goujon 2001).
Formal education beyond secondary school becomes in-creasingly specialized. Knowledge narrowing, comple-mented by the economic gains of specialization providedby expanding markets, means the attention of any particularindividual is increasingly focused on a small subset of thehuman enterprise. Thus knowledge and employment spe-cialization, along with the shift to urban life, have separatedpeople from traditional understandings of nature as a wholeand divided modern understanding into multiple parts anddisbursed it among people (Giddens 1990). Another conse-quence is that while the ‘‘volume’’ of knowledge is fargreater today than at any time in the past, it is widely dis-persed. The deep knowledge held by one type of experts isvery difficult to link with that of other experts. And synthe-ses of knowledge into general information that can bewidely conveyed to inform collective action are also diffi-cult. The modern human dilemma can be characterized asthe challenge of rallying disparate human knowledge ofcomplex systems to inform action (Norgaard 2004).
Incorporating the knowledge of separate experts indemocratic and bureaucratic systems presents its own chal-lenges. The primary response, generally referred to as ‘‘pro-gressive governance,’’ has been to argue that the voice ofexperts should be heard before legislatures vote or adminis-trators decide. Progressive governance is not without itsown problems. The separate voices of different expertsrarely speak coherently to systemic social and ecologicalproblems, nor do they speak to the concerns of people, es-pecially local people. Facts and values are not always separa-ble, and experts end up speaking for particular interests evenwhen they think they are speaking for the public. Expertsalso become captured by special interest groups, and gov-ernment agencies can become an interest of their own. In-teragency task forces, stricter peer review, and increasingpublic participation through hearings and other mechanismsoffset some of these problems (Dupre 1986; Jasanoff 1990;Irwin 1995; Fischer 2000).
7.2.3.6 Sociopolitical Drivers and Ecosystem Consequences
Widely accepted generalizations about the effects of socio-political drivers on ecosystems do not exist. Some examples
................. 11411$ $CH7 10-27-05 08:42:48 PS

193Drivers of Change in Ecosystem Condition and Services
BOX 7.1
War as a Driver of Change in Ecosystem Services and Human Well-being
War acts as both a direct and an indirect driver of change in ecosystem soil erosion with consequent problems of reduced crop yield, reducedservices and human well-being, as nature becomes the intended victim or wildlife populations, and sedimentation of rivers and reservoirs (Berhe inrecipient of ‘‘collateral damage.’’ The number of wars waged reached a press).maximum of 187 in the mid-1980s. That number was reduced by half by Indirect impacts of wars include changes in land use as cultivators2000 (Marshall et al. 2003). Most of these wars were internal conflicts. change crops, abandon fields, or retreat to more secure areas that areThey were distributed highly unevenly across the world, predominantly in sometimes environmentally sensitive. Infrastructure damage or construc-poor countries. (See MA Current State and Trends, Chapter 5, for a map tion of new roads alters the incentives of an ecosystem’s inhabitantsof the distribution of internal wars from 1975 to 2003.) (Westing 1988; W. Ghiorghis 1993; Berhe 2000). War-driven environmen-
During the twentieth century, 191 million people lost their lives in con- tal degradation can initiate social degradation and protracted cycles offlict-related incidents; 60% of these were non-military casualties (Krug social and environmental decline by creating poverty, overexploitation of2002). Since World War II, more than 24 million people have been killed marginal resources, underdevelopment, and in extreme cases famine andand another 50 million injured in state-sponsored wars and armed conflicts social destruction (Lanz 1996; Berhe 2000, in press).globally. Civilian casualties accounted for 90% of the dead. Between 1985 Since the fall of the Soviet Union, the danger of nuclear weapons hasand 1995 alone, UNICEF estimated that wars have claimed the lives of 2 become a serious threat. It is estimated that a large-scale nuclear warmillion children, wounded or disabled 4–6 million, orphaned 1 million, and could result in more than 1 billion deaths and injury of an equal numberleft 12 million children homeless (UNICEF 1996; Pendersen 2002). Glob- of people due to the combined effects of blast, fire, and radiation. Amongally, armed conflicts around the world were responsible for the internal the most serious environmental consequences of a nuclear war of thisdisplacement of 11.7 million people during 1998 alone. In addition, armed magnitude are subfreezing temperatures; a reduction in solar radiation atconflicts forced 23 million people to seek refuge outside their countries in Earth’s surface by half; triple the amount of UV-B radiation; increased1997 alone, while an additional 2.5 million abandoned their livelihoods doses of ionizing radiation from gamma and neuron flux of the fireballand crossed national boundaries as a result of war-related violence (Krug and radioactive debris fallout; chemical pollution of surface waters with2002). pyrotoxins released from chemical storage areas; atmospheric pollution
Environmental effects of warfare include damage to animals, defolia- from the release of nitric oxide, ozone, and pyrogenic pollutants from thetion, destruction of flora, degradation of soil, and loss of biodiversity detonation; and release of toxic chemicals from secondary fires and stor-(Pendersen 2002). The impacts of war on nature depend on the magni- age areas (Ehrlich et al. 1983).tude and duration of the conflict and its effects, the type of ecosystem Landmines are not usually considered weapons of mass destruction,involved (its resistance and resilience), the type of weapons used, the but more people have been killed and injured by anti-personnel minesprocess of weapons production, and the cumulative effects sustained from than by nuclear and chemical weapons combined. Land mines maim orthe military campaigns. The main activities that result in protracted and kill an estimated 400 people a week (International Campaign to Ban Land-persistent effects on ecosystem health, services, and human well-being mines 2002). It is believed that there are about 80–110 million landminesare the manufacturing and testing of nuclear weapons, aerial and naval spread in 82 countries, with another 230 million waiting to be deployed inbombardment of landscapes, dispersal of landmines and de-mining, and 94 countries (Berhe 2000; International Campaign to Ban Landminesthe use and storage of military toxins and waste (Leaning 2000). 2002). The distribution is not uniform. In Cambodia and Bosnia, there is
Ecological disturbance from armed conflict is not solely a contempo- approximately one mine in the ground for each citizen; in Afghanistan,rary issue. Scorched earth tactics (meant to inflict maximum damage to Iraq, Croatia, Eritrea, and Sudan, the ratio is one mine for every tworesources and facilities in an area in order to deny their use by the enemy) persons (Berhe 2000).were used by the Greeks in the Peloponnesian wars (431–04 BC) (Thu- A landmine costs $3 to manufacture but $300–1,000 to clear (Nachoncydides 1989). Romans applied salts to soils in Carthage after their victory 2000). Landmines introduce nonbiodegradable and toxic waste of de-in the Punic wars (264–146 BC), and dykes were destroyed in the Nether- pleted uranium and 2,4,6-trinitrotoulene (TNT), hexahydro-1,3,5-trinitro-lands to prevent a French invasion in 1792 (Bodansky 2003). 1,3,5-triazide (RDX, or Cyclonite), or tetryl as high-explosive filters. These
Modern warfare, however, has had particularly severe impacts. Chemi- compounds have been known to leach into soil and underground watercal defoliants, bombs, and physical disruption by the United States army as the metal or timber casing of the mine disintegrates (Gray 1997).destroyed 14% of the Vietnamese total forest cover between 1961 and The impacts on ecosystem services and human well-being include1970, including 54% of the mangrove forests (Bodansky 2003). access denial (which can lead to ecosystem recovery), disruption of land
In the first Gulf War in 1991, Iraq released about 2 million barrels of stability, pollution, and loss of biodiversity in the short run. These effectsoil into the Persian Gulf and ignited 736 Kuwaiti oil wells, spreading clouds can be manifested as being biophysical, chemical, socioeconomic, or po-of black soot throughout the Middle East and the surrounding regions. litical in nature. The biophysical or chemical effects include destruction ofThe soot emission changed the local temperature, and the sulfur released soil structure: an increased rate of sediment transport by erosion andwith it contributed to acid rain. The effects suffered due to oil contamina- loads into streams; contamination with toxic pollutants; and a changingtion included lesions and cancerous growths, sublethal effects of lower proportion, diversity, and productivity of flora and fauna coupled with habi-tolerance to environmental stress, and loss of insulation and motility by tat destruction. The socioeconomic or political effects include loss of in-mammals from oiling of feathers and fur (World Conservation Monitoring come, food shortage, poverty, vulnerability, change in population per unitCenter 1991). area, increased social polarization, declining health care, migration or dis-
During the Eritrean war for independence from Ethiopia (1961–91), placement, destruction of essential infrastructures, arrested development30% forest cover of the country was reduced to less than 1%. The near- of regions, and sociopolitical instability (Berhe 2000).complete elimination of vegetation of some areas resulted in high rates of
PAGE 193................. 11411$ $CH7 10-27-05 08:42:50 PS

194 Ecosystems and Human Well-being: Scenarios
can be found in the final section of this chapter, on interac-tions among drivers and ecosystems.
7.2.3.7 Overview of Sociopolitical Drivers in the MA Scenarios
Sociopolitical drivers enter the MA scenarios in a numberof ways—human capital and research investments, extent ofinternational cooperation and attitudes toward environ-mental policies, and lifestyle choices affecting energy de-mand. (See Chapter 9 for further information on thedifferent assumptions made about these in the four MA sce-narios.)
7.2.4 Cultural and Religious Drivers
The word ‘‘culture’’ has many definitions in both the socialsciences and in ordinary language. To understand culture asa driver of ecosystem change, it may be most useful to focuson the values, beliefs, and norms that a group of peopleshare and that have the most influence on decision-makingabout the environment. (Of course, other aspects of culture,such as risk perception and willingness to accept risk, orpreference for present versus future benefits, also influenceenvironmental decision-making, but they are less salient tothis discussion.) In this sense, culture conditions individuals’perceptions of the world, influences what they consider im-portant, and suggests courses of action that are appropriateand inappropriate. And while culture is most often thoughtof as a characteristic of national or ethnic groups, this defi-nition also acknowledges the emergence of cultures withinprofessions and organizations, along with the possibility thatan individual may be able to draw on or reconcile morethan one culture.
There is a substantial literature examining the role ofculture in shaping human environmental behavior. Produc-tive work on this has focused on approaches that link di-rectly with the social psychology of environmental concernand the influence of values, beliefs, and norms on individualdecisions. Broad comparisons of whole cultures have notproved useful because they ignore vast variations in values,beliefs, and norms within cultures. But a growing numberof studies are conducted in parallel in multiple societies andallow for systematic examination of the role of culturewithout overgeneralizing (Dunlap and Mertig 1995; Rosaet al. 2000; Hanada 2003). This work builds on social psy-chological analyses conducted within nations and culturesand then systematically compares them across nations.
Consumption behavior, especially in affluent nationsand within affluent groups in developing nations, may be aparticularly important driver of environmental change, butits cultural elements have not been extensively studied(Stern et al. 1997). It is clear that there is broad concernwith the environment throughout the globe (Dunlap et al.1993), but it is less clear how that concern translates intoeither changes in consumer behavior or political action.This is because consumption has many determinants be-yond satisfying basic human needs. Values and beliefs re-garding the environmental impacts of consumption mayplay a role, but consumption is also driven by peer groupexpectations and efforts to establish a personal identity, both
PAGE 194
of which are the targets of advertising. Further, some con-sumption is relatively easy to change (such as turning off alight), while other aspects require substantial investments(such as buying a high-efficiency refrigerator) (Dietz andStern 2002).
A substantial body of literature provides lessons on howpolicies and programs can most effectively produce culturalchange around environmental behavior (Dietz and Stern2002). Obviously, the relationship between culture and be-havior is context-specific. Indeed, one important lesson ofresearch on this topic is that overarching generalizations areseldom correct.
The ability of culture to shape behavior depends on theconstraints faced by individuals, and the effects of changingconstraints on behavior depend on the culture of the indi-viduals encountering the changes (Gardner and Stern 1995;Guagnano et al. 1995). In many circumstances changingvalues, beliefs, and norms will have no effect on behaviorbecause individuals face structural constraints to pro-environmental behavior. (For example, public educationabout the problems of using tropical hardwoods will havelittle impact if people have no way of knowing the originsof lumber they may purchase.) In other circumstanceschanging constraints on behavior will have little effect be-cause the mix of values, beliefs, and norms provides littlereason to behave in an environmentally protective way.(For instance, making environmentally friendly foodchoices available may not influence consumptions if peopleare not aware of the environmental impacts of their con-sumption patterns).
Just as it is important to differentiate structural con-straints (how hard it is to behave in an environmentally pro-tective way) from culture (values, norms, and beliefs), it isalso important to realize that there are multiple forms ofpro-environmental behavior, and different factors may drivethem. For example, Stern (Stern et al. 1999; Stern 2000)notes that environmental consumer behavior, environmen-tal political behavior, and a willingness to make sacrificesto protect the environment, while positively correlated, aresomewhat distinct and are influenced by different elementsof culture.
There has been extensive and diverse research on theinfluence of values on pro-environmental behavior. A tradi-tion stretching from Kluckholm (1952) through Rokeach(1968, 1973) to Schwartz (1987, 1990, 1992) has providedtheoretical and empirical arguments to support the idea thatvalues—things that people consider important in theirlife—are important in shaping behavior and are relativelystable over the life course (Schwartz 1996). Two strains ofresearch have applied this logic to environmental concerns.Inglehart (1995) has suggested that a set of values he labels‘‘post-materialist’’ predict environmental concern. His ar-gument is that only once people have achieved a reasonabledegree of material security can they assign priority to issuessuch as the environment. This argument has some strongparallels to the Environmental Kuznets Curve and to theecological modernization theory in sociology (York et al.2003b). However, as indicated, there is considerable con-troversy regarding the empirical support for this argument
................. 11411$ $CH7 10-27-05 08:42:51 PS
195Drivers of Change in Ecosystem Condition and Services
at either the individual or the national level (e.g., Brechinand Kempton 1994; Dunlap and Mertig 1995; Brechin andKempton 1997; Dunlap and Mertig 1997; Brechin 1999;Stern et al. 1999; York et al. 2003b).
A number of researchers have suggested that altruism isa key value underpinning environmental concern, and thatthe scope of altruism may be limited to other humans ormay extend to other species and the biosphere itself (Dun-lap et al. 1983; Merchant 1992; Stern et al. 1993; Karp1996). Empirical work in this tradition has deployedSchwartz’s cross-cultural measures of values, and finds fairlyconsistent support for the idea that altruism predicts envi-ronmental concern, as well as evidence that traditional val-ues—which might be termed conservatism and appear tobe related to fundamentalism in many faiths (Schwartz andHuismans 1995)—lead to less concern with the environ-ment (e.g., Kempton et al. 1995; Karp 1996; Schultz andZelezny 1998; Schultz and Zelezny 1999; Stern et al. 1999).
The social psychological literature places considerableemphasis on beliefs as predictors of behaviors. At one level,this literature emphasizes very specific beliefs about a be-havior—its consequences, the difficulty in conducting it,and so on (Ajzen and Fishbein 1980; Ajzen 1991). Whilethis approach is helpful in designing interventions to changeenvironmentally significant behavior, such beliefs are gener-ally not what is thought of as culture. However, it has beenargued that broad general beliefs about the environmentand human interactions with it provide a backdrop that in-fluence the acceptability of or resistance to more specificbeliefs (Stern et al. 1995).
One of the most widely used measures of environmentalconcern, the ‘‘new ecological paradigm,’’ can be interpre-ted as a measure of such general beliefs (Dunlap et al. 2002).The idea is that people vary in the degree to which theythink that human interventions can cause significant harmto the environment. Variation in this general view makesindividuals more or less accepting of new information aboutspecific environmental problems. There is evidence thatthis new paradigm as well as values influence risk perception(Whitfield et al. 1999), including perception of ecologicalrisk (Slimak 2003).
Norms are also a key part of culture related to environ-mental behavior. Norms signal to the individual what is ap-propriate behavior. Substantial work has been done on whatactivates norms regarding pro-environmental behavior (VanLiere and Dunlap 1978; Stern et al. 1986). Norms havebeen shown to be particularly important in local commonsmanagement, where they often guide behaviors that pre-vent overexploitation of a common pool resource (Ostromet al. 2002).
Flowing from White’s essay (White 1967), there hasbeen substantial interest in the possible influences of reli-gion on environmental concern and pro-environmental be-havior. Some work on values has shown that traditionalvalues are negatively related to environmental concern.There is a substantial literature in the United States thatseems to indicate that adherents to fundamentalist Christianbeliefs have less environmental concern than those with
PAGE 195
more liberal or moderate beliefs (Eckberg and Blocker1989, 1996; Kanagy and Willits 1993).
While the social psychological literature is quite rich, asnoted, the literature on cross-national comparisons is justemerging. The implications of that literature for our under-standing of how environmental policy might be developedare unclear. And work on how environmentally relevantvalues, beliefs, and norms change is still in its earliest stages(but see Richerson et al. 2002).
7.2.4.1 Cultural and Religious Drivers and EcosystemConsequences
It is common to hear arguments that we can best protectecosystems, and by implication the services they provide,by changing values, beliefs, and norms. Yet as this sectionhas described, values, beliefs, and norms—culture—arecomplex in themselves and their links to environmentallyconsequential behavior add further complexity. Changingvalues or beliefs will have little effect if changes in behaviorto benefit the environment have high costs in time ormoney. In other cases, simply making people aware of theecosystem consequences of their behavior can bring aboutsubstantial change, such as the growing demand for ‘‘eco-system-friendly’’ consumer goods (Thogersen 2002). Whilecultural and religious factors may have a substantial influ-ence on ecosystems, research has shown that broad general-izations are unwarranted and that analyses must always becontext-specific.
7.2.4.2 Overview of Cultural and Religious Drivers in the MAScenarios
Few cultural and religious drivers are built explicitly intothe MA scenario quantitative modeling. However, changesin culture are an important part of the qualitative elementsof some of the scenarios, particularly in Adapting Mosaicand to a certain extent in TechnoGarden. Both scenariosare built on the assumption that a general shift will occur inthe way ecosystems and their services are valued. In bothcases decision-makers at various scales develop a proactiveapproach to ecosystem management, but they pursue differ-ent management strategies to reach this goal. In Techno-Garden, the supply of ecosystem services is maintained bycontrolling ecosystem functions via technology. In Adapt-ing Mosaic, the aim is to create a set of flexible, adaptivemanagement options through a learning approach. Cultur-ally diverse forms of learning about and adapting to ecosys-tem changes are fostered. Devising ways of incorporatingtraditional ecological and local knowledge into manage-ment processes and protecting the cultural and spiritual val-ues assigned to nature in various cultures become part ofthe developed strategies.
7.2.5 Science and Technology Drivers
The development and diffusion of scientific knowledge andtechnologies that exploit knowledge have profound impli-cations for ecological systems and human well-being. Thetwentieth century saw tremendous advances in understand-ing how the world works physically, chemically, biologi-
................. 11411$ $CH7 10-27-05 08:42:52 PS

196 Ecosystems and Human Well-being: Scenarios
cally, and socially and in the applications of that knowledgeto human endeavors. Earlier sections have documented ex-amples of tremendous productivity gains in many industries.
From the introduction of the automobile in the earlyyears to commercialization of genetically modified cropsand widespread use of information technology more re-cently, many new products drew both praise and damnationregarding their effects on ecosystems. The twenty-first cen-tury is likely to see continued breathtaking advances in ap-plications of materials science, molecular biology, andinformation technology—with real potential to improvehuman well-being and uncertain consequences for ecosys-tems.
Humans have been extremely successful in institutional-izing the process of scientific and technical change. Organi-zational structures that encourage researchers to makebreakthroughs and to use them to develop potentially valu-able products—such as research universities, publiclyfunded research centers, public-private collaborations forresearch and development, private research programs, regu-latory institutions, and international agreements that collec-tively determine intellectual property rules (patents andcopyrights, for instance)—are either in place or being im-plemented in the industrial world. However, they are notin place in most developing countries. Furthermore, institu-tions to use and reward development of indigenous knowl-edge are not well developed.
Society’s ability to manage the process of product dis-semination—identifying the potential for adverse conse-quences and finding ways to minimize them—has notalways kept pace with our ability to develop new productsand services. This disparity became especially obvious as theintroduction of genetically modified crops met widespreadopposition in some parts of the world. The protests in partresulted from the speed of advancement, as the rate of com-mercial adoptions of the first products of this new technol-ogy was unprecedented. At least 30 years passed betweenthe development and widespread use of hybrid maize inindustrial countries. For semi-dwarf rice and wheat in de-veloping countries, a similar rate of use was reached only15 years after development began. But use of geneticallymodified soybeans reached similar levels of use after only 5years in Argentina and the United States. The use of theInternet accelerated worldwide communication and the or-ganization of protests.
The state of scientific and technical knowledge at anymoment depends on the accumulation of knowledge overtime. Decision-makers can affect the rate of change in sci-entific and technical knowledge through setting researchpriorities and changing levels of funding. Domestic govern-ment funding for science and technology is driven byobjectives such as scientific education, technology develop-ment, export markets, commercialization and privatization,and military power. The private sector responds to the per-ceived future for their products, looking for those that willbe the most acceptable and profitable.
7.2.5.1 Innovation and Technological Change
The importance of ‘‘advances in knowledge’’ and technol-ogy in explaining the historical record of productivity
PAGE 196
growth has already been mentioned. In the original studyon contributions of productivity growth to overall growthby Solow (1957), productivity enhancements were esti-mated to account for 87% of per capita growth (the remain-der was attributed to increases in capital inputs). Since then,further methodological and statistical refinements have re-duced the unexplained ‘‘residual’’ of productivity growththat is equated to advances in knowledge and technology,but they remain the largest single source of long-run pro-ductivity and economic growth. Science and technologyare estimated to have accounted for more than one third oftotal GDP growth in the United States from 1929 to theearly 1980s (Denison 1985), and for 16–47% of GDPgrowth in selected OECD countries for the period 1960 to1995 (Table 10.1 in Barro and Sala-i-Martin 2004).4
The observed slowdown in productivity growth ratesfrom the early 1970s to the mid- 1990s is generally interpre-ted as a weakening of the technological frontier in theOECD countries (Maddison 1995; Barro 1997), althoughquantitative statistics (and even everyday experience) do notcorroborate the perception of a slowdown in technologicalinnovation and change. An alternate interpretation is thatthe OECD countries have moved out of a long period ofindustrialization and into post-industrial development asservice economies. In such economies, productivity is hardto measure, partly because services include a mixture ofgovernment, nonmarket, and market activities, partly be-cause economic accounts measure services primarily via in-puts (such as the cost of labor) rather than outputs, andpartly because it is difficult to define service quality. Never-theless, labor productivity in the service sector appears togrow more slowly than in the agricultural and industrialsectors (Millward 1990; Baumol 1993).
Finally, another interpretation is that productivitygrowth lags behind technological change because institu-tional and social adjustment processes take time to be im-plemented (Freeman and Perez 1988; David 1990). Oncean appropriate ‘‘match’’ (Freeman and Perez 1988) betweeninstitutional and technological change is achieved, produc-tivity growth accelerates. Maddison (1995) observed thatthe nineteenth century productivity surge in the UnitedStates was preceded by a long period of investment in infra-structure. Landes (1969) notes that both the German andJapanese economic accelerations were preceded by long pe-riods of investment in education. Maddison (1995) has fur-ther suggested that recent developments in informationtechnology involve considerable investment, both in hard-ware and in human learning. There is some preliminary evi-dence that the payoff from this investment is beginning tobe important in the early twenty-first century.
7.2.5.2 Agricultural Science and Technology
We focus here on agricultural science and technology be-cause of its obvious implications for land conversion andwidespread consequences for many ecosystems. Theground-breaking research of Gregor Mendel in the 1860son the heritability of phenotypical characteristics in gardenpeas laid the foundation for plant and livestock breedingresearch and the improvement of food crops in the twenti-
................. 11411$ $CH7 10-27-05 08:42:53 PS

197Drivers of Change in Ecosystem Condition and Services
eth century (Huffman and Evenson 1993). Since the begin-ning of that century, there have been three waves ofagricultural biological technology development and diffu-sion.
The first wave took place mainly in North America andEurope in the 1930s and focused on important temperateclimate crops. The discovery of hybridization—in which across of two genetically very different parent plants can pro-duce a plant of greater vigor and higher yield than the par-ents—set the stage for major yield improvements in someof the most important food crops, especially maize. The firstmaize hybrids were commercially available for farmers inthe U.S. Corn Belt in the 1930s. Average U.S. maize yieldsimproved from 24.4 bushels per acre (1.53 tons per hectare)in 1860 to 116.2 bushels per acre (7.31 tons per hectare) in1989, a more than fourfold increase over about 130 years.But even crops such as wheat, for which hybridization hasnot been commercially viable, saw similar improvements.Wheat yields grew from 11.0 bushels per acre (0.74 tonsper hectare) in 1860 to 32.8 bushels per acre (2.21 tons perhectare) in 1989 (Huffman and Evenson 1993).
Some of the key developments were agricultural re-search systems that included universities, agricultural fieldstations, agricultural input companies, and extension ser-vices covering the chain from basic crop improvement re-search via field trials to disseminating information and newseed material to farmers (Ruttan 2001).
Agronomic research on improved inputs for crop pro-duction like fertilizer or pesticides and new agriculturalmanagement practices emerged, which further enhancedcrop yields in farmers’ fields. Funding for organized agricul-tural research was mainly provided by the public sector inthe first half of the century, while the importance of private-sector research grew substantially in the second half as theprivate sector gained legal rights to protect genetic modifi-cations (Huffman and Evenson 1993). In labor-scarce coun-tries, particularly the United States, the private sector playeda central role from the beginning in the development ofagricultural machinery.
The second wave of agricultural technology develop-ment was particularly important in the developing worldbecause it extended plant breeding and nutrient manage-ment techniques to important food crops in low-incomecountries. Since the early 1960s, productivity growth hasbeen significant for rice in Asia, wheat in irrigated and fa-vorable production environments worldwide, and maize inMesoamerica and selected parts of Africa and Asia. Highrates of investment in crop research, infrastructure, andmarket development combined with appropriate policysupport fueled this land productivity (Pingali and Heisey2001).
The Green Revolution strategy for food crop produc-tivity growth was explicitly based on the premise that, givenappropriate institutional mechanisms, technology spilloversacross political and agro-climatic boundaries can be cap-tured. Hence the Consultative Group on International Ag-ricultural Research was established specifically to generatespillovers, particularly for nations that are unable to captureall the benefits of their research investments.
PAGE 197
The major breakthroughs in yield potential that epito-mize the Green Revolution came from conventional plantbreeding approaches, characterized as crossing plants withdifferent genetic backgrounds and selecting from among theprogeny individual plants with desirable characteristics. Re-peating the process over several generations leads to plantvarieties with improved characteristics such as higher yields,improved disease resistance, and improved nutritional qual-ity. The yields for the major cereals, especially with in-creased use of inorganic fertilizers with high nitrogencontent, have continued to rise at a steady rate after theinitial dramatic shifts in the 1960s for rice and wheat. Forexample, Table 7.5 shows that yields in irrigated springwheat rose at the rate of 1% per year over the past threedecades, an increase of around 100 kilograms per hectareper year (Pingali and Rajaram 1999).
In addition to work on shifting the yield frontier of ce-real crops, plant breeders continue to have successes in theless glamorous areas of maintenance research. These includedevelopment of plants with durable resistance to a widespectrum of insects and diseases, plants that are better ableto tolerate a variety of physical stresses, crops that requiresignificantly fewer days from planting to harvest, and cerealgrain with enhanced taste and nutritional qualities.
The third, ongoing wave of agricultural technology de-velopment has been called the Gene Revolution and isbased on techniques of transferring genetic material fromone organism to another that would not occur via normalreproductive methods. The early phase of this wave wascharacterized by the development of a few commercialproducts (glyphosate-resistant soybeans, and maize and cot-ton that are resistant to lepidopteran pests), principally byprivate research firms (Nelson 2001). These early productsof genetic engineering do not have higher potential yieldsthan traditional varieties, but they often have higher effec-tive yields because they reduce the cost of pest control. Va-rieties of food crops with other desirable characteristics suchas increased beta-carotene content (the so-called golden
Table 7.5 Rate of Growth of Wheat Yield by Mega-environment,Elite Spring Wheat Yield Trial, 1964–95. Wheat breeders classifythe developing world’s spring wheat-growing areas into six distinctmega-environments: irrigated (ME1); high rainfall (ME2); acid soil(ME3); drought-prone (ME4); high temperature (ME5); and high lati-tude (ME6). A mega-environment is a broad, frequently transconti-nental but not necessarily contiguous area occurring in more thanone country, with similar biotic and abiotic stresses, cropping sys-tem requirements, volume of production, and, possibly, consumerpreferences (Pingali and Rajaram 1999; Lantican et al. 2003).
PeriodME1–
IrrigatedME2–High
RainfallME4–
Drought-proneME5–High
Temperature(percent per year/kilograms per year)
1964–78 1.22 1.72 1.54 1.41
71.6 81.5 32.4 34.9
1979–99 0.82 1.16 3.48 2.10
53.5 62.5 87.7 46.1
................. 11411$ $CH7 10-27-05 08:42:54 PS

198 Ecosystems and Human Well-being: Scenarios
rice), increased drought tolerance (wheat), and virus resis-tance (papaya) are in various stages of development.
Substantial empirical evidence exists on the production,productivity, income, and human welfare impacts of mod-ern agricultural science and the international flow of mod-ern varieties of food crops. Evenson and Gollin (2003)provide detailed information for all the major food crops onthe extent of adoption and impact of improved variety use.The adoption of modern varieties during the first 20 yearsof the Green Revolution—aggregated across all crops—reached 9% in 1970 and rose to 29% in 1980. In the subse-quent 20 years, far more adoption has occurred than in thefirst two decades. By 1990, adoption of improved varietieshad reached 46%, and it was 63% by 1998. Moreover, inmany areas and in many crops, first-generation modern va-rieties have been replaced by second and third generationsof improved varieties (Evenson and Gollin 2003).
Much of the increase in agricultural output over the past40 years has come from an increase in yields per hectarerather than an expansion of area under cultivation. For in-stance, FAO data indicate that for all developing countries,wheat yields rose by 208% from 1960 to 2000, rice yieldsrose 109%, maize yields rose 157%, potato yields rose 78%,and cassava yields rose 36% (FAOSTAT). (See MA CurrentState and Trends, Chapter 26, for information on crop areaexpansion.) Trends in total factor productivity are consistentwith partial productivity measures, such as rate of yieldgrowth. Pingali and Heisey (2001) provide a comprehen-sive compilation of total factor productivity evidence forseveral countries and crops.
Widespread adoption of improved seed-fertilizer tech-nology led to a significant growth in food supply, contribut-ing to a fall in real food prices. The primary effect ofagricultural technology on the non-farm poor, as well as onthe rural poor who are net purchasers of food, is throughlower food prices.
The effect of agricultural research on improving the pur-chasing power of the poor—both by raising their incomesand by lowering the prices of staple food products—is prob-ably the major source of nutritional gains associated withagricultural research. Only the poor go hungry. Because arelatively high proportion of any income gains made by thepoor is spent on food, the income effects of research-induced supply shifts can have major nutritional implica-tions, particularly if those shifts result from technologiesaimed at the poorest producers (Pinstrup-Andersen et al.1976; Hayami and Herdt 1977; Scobie and Posada 1978;Binswanger 1980; Alston et al. 1995).
Several studies have provided empirical support to theproposition that growth in the agricultural sector has econ-omy-wide effects. One of the earliest studies showing thelinkages between the agricultural and nonagricultural sec-tors was done at the village level by Hayami et al. (1978).Hayami provided an excellent micro-level illustration of theimpacts of rapid growth in rice production on land andlabor markets and the nonagricultural sector.
More recent assessments on the impacts of productivitygrowth on land and labor markets have been done by Pins-trup-Andersen and Hazell (1985) and by David and Otsuka
PAGE 198
(1994). Pinstrup-Andersen and Hazell (1985) argued thatlandless labor did not adequately share in the benefits of theGreen Revolution because of depressed wage rates attribut-able to migrants from other regions. David and Otsuka(1994), on the other hand, found that migrants shared inthe benefits of the Green Revolution through increasedemployment opportunities and wage income. The latterstudy also documented that rising productivity caused landprices to rise in the high-potential environments where theGreen Revolution took off. For sector-level validation ofthe proposition that agriculture does indeed act as an engineof overall economic growth, see Hazell and Haggblade(1993), Delgado et al. (1998), and Fan et al. (1998).
The profitability of farming systems using improved va-rieties has been maintained despite falling food prices (inreal terms), owing to a steady decline in the cost per ton ofproduction (Pingali and Traxler 2002). Savings in produc-tion costs have come about from technical change in cropmanagement and increased input-use efficiencies. Once im-proved varieties have been adopted, the next set of technol-ogies that makes a significant difference in reducingproduction costs includes machinery, land managementpractices (often in association with herbicide use), fertilizeruse, integrated pest management, and (most recently) im-proved water management practices.
Although many Green Revolution technologies weredeveloped and extended in package form (such as new plantvarieties plus recommended fertilizer, pesticide, and herbi-cide rates, along with water control measures), many com-ponents of these technologies were taken up in a piecemeal,often stepwise manner (Byerlee and Hesse de Polanco1986). The sequence of adoption is determined by factorscarcities and the potential cost savings achieved. Herdt(1987) provided a detailed assessment of the sequentialadoption of crop management technologies for rice in thePhilippines. Traxler and Byerlee (1992) provided similar ev-idence on the sequential adoption of crop managementtechnologies for wheat in Sonora, northwestern Mexico.
Although high-potential environments gained the mostin terms of productivity growth from the Green Revolu-tion varieties, the less favorable environments benefited aswell through technology spillovers and through labor mi-gration to more productive environments. According toDavid and Otsuka (1994), wage equalization across favor-able and unfavorable environments was one of the primarymeans of redistributing the gains of technological change.(Wages of workers in unfavorable environments are pulledup by demand for additional labor in the favorable environ-ments.) Renkow (1993) found similar results for wheatgrown in high- and low-potential environments in Paki-stan.
Byerlee and Moya (1993), in their global assessment ofthe adoption of improved wheat varieties, found that overtime the adoption of modern varieties in unfavorable envi-ronments caught up to levels of adoption in more favorableenvironments, particularly when germplasm developed forhigh-potential environments was further adapted to themore marginal environments. In the case of wheat, the rateof growth in yield potential in drought-prone environ-
................. 11411$ $CH7 10-27-05 08:42:55 PS

199Drivers of Change in Ecosystem Condition and Services
ments was around 2.5% per year during the 1980s and1990s (Lantican et al. 2003). Initially the growth in yieldpotential for the marginal environments came from techno-logical spillovers as varieties bred for the high-potential en-vironments were adapted to the marginal environments.During the 1990s, however, further gains in yield potentialcame from breeding efforts targeted specifically at the mar-ginal environments.
Since the 1990s, the locus of agricultural research anddevelopment has shifted dramatically from the public to theprivate multinational sector. Three interrelated forces in thislatter wave of globalization are transforming the system forsupplying improved agricultural technologies to the world’sfarmers. The first is the evolving environment for protect-ing intellectual property in plant innovations. The second isthe rapid pace of discovery and the growth in importanceof molecular biology and genetic engineering. Finally, ag-ricultural input and output trade is becoming more openin nearly all countries. These developments have created apowerful new set of incentives for private research invest-ment, altering the structure of the public/private agricul-tural research endeavor, particularly with respect to cropimprovement (Falcon and Fowler 2002; Pingali and Traxler2002).
7.2.5.3 Science and Technology Drivers and EcosystemConsequences
The consequences of technical change for ecosystems areas diverse as those for economic drivers, because technicalchange alters the interplay among inputs, resource use, andoutputs. Two examples—in agriculture and fisheries—illustrate this complexity. The development of high-yield-ing crop varieties meant that less land could be used toproduce the same amount of food with positive effects onthe condition of the unconverted ecosystems. The inven-tion of the Haber-Bosch process to convert atmosphericnitrogen cheaply into nitrogenous fertilizer meant thatplants with high yield response to this fertilizer were fa-vored in the marketplace. More nitrogen was applied tofields, altering dramatically the natural nitrogen cycle, withnegative consequences in coastal ecosystems. (See later dis-cussion on nitrogen use and ecosystem consequences.) Useof pesticides also had unintended consequences, such as thereduction in availability of by-product protein from irri-gated fields (fish and amphibians).
Improved marine fishing technologies have made it pos-sible to extract considerable fish biomass from the marinesystem. In fact, humankind has probably reached the maxi-mum (and in some places exceeded) levels of fish biomassremoval before significant ecosystem changes are induced.(Since fish biomass is a small fraction of the marine standingbiomass, current fish extraction probably removes only asmall portion of total marine biomass; recent initiatives suchas the Scientific Committee on Ocean Research workshopon the impacts of fishing on marine ecosystems are tryingto address the question of impacts.) For example, in theGulf of Thailand higher trophic animals are no longer pres-ent and the system is dominated by lower trophic specieswith a high biomass turnover (Christianson 1998). Re-
PAGE 199
search in West Africa (Alder and Sumaila 2004) and theNorth Atlantic (Christianson et al. 2003) indicates similarchanges.
A less diverse system is in principle more vulnerable (lessresistant) to perturbations such as disease and climatechange, but there is little documented evidence that the lossof fish biomass is driving changes in the carbon and nitrogencycle as well as diseases. In parts of the Caribbean, removalof the top predators ultimately resulted in the areas shiftingfrom coral-dominated reefs to algal-dominated ones. In thiscase, the removal of top predators resulted in reefs domi-nated by sea urchins, but a disease wiped them out so therewere few animals left to clean algae from the corals, result-ing in a rapid shift from coral to algal-dominated reefs. (Thisprocess is described in detail in Chapter 19 of the CurrentState and Trends volume.)
7.2.5.4 Overview of Science and Technology Drivers in the MAScenarios
The MA scenarios include a number of different science andtechnology drivers. A qualitative assessment about changesin aggregate technology development is implemented in avariety of assumptions about crop yield changes, energy andwater efficiency, and materials intensity. The assumptionsabout the development of science and technology in eachof the scenarios can be found in Chapter 9.
7.3 Direct DriversThis section reviews some of the most important directdrivers of ecosystem condition: climate variability andchange, plant nutrient use, land conversion, invasive spe-cies, and diseases.
7.3.1 Climate Variability and Change
Key climatic parameters that affect ecological systems in-clude mean temperature and precipitation and their vari-ability and extremes, and in the case of marine systems, sealevel. In this section we review the available record on cli-mate and the drivers of climate variability and change.
This section is primarily based on the expert and gov-ernment peer-reviewed reports from the IntergovernmentalPanel on Climate Change—especially on the Working GroupI Report of the Third Assessment Report (Houghton et al.2001; IPCC 2002) and the Special Report on EmissionsScenarios (Nakicenovic et al. 2000)—and on the Conven-tion on Biological Diversity Technical Series No. 10 (Secre-tariat of the Convention on Biological Diversity 2003).This section highlights the key conclusions of these assess-ments, which, given their comprehensive nature and recentpublication, are still valid.
7.3.1.1 Observed Changes in Climate
The global-average surface air temperature has increased by0.6 0.2� Celsius since about 1860. (See Figure 7.13 inAppendix A.) The record shows a great deal of spatial andtemporal variability; for example, most of the warming oc-curred during two periods (1910–45 and since 1976). It isvery likely that the 1990s was the warmest decade, and 1998
................. 11411$ $CH7 10-27-05 08:42:56 PS

200 Ecosystems and Human Well-being: Scenarios
the warmest year, of the instrumental record. Extending theinstrumental record with proxy data for the NorthernHemisphere indicates that over the past 1,000 years, thetwentieth century’s increase in temperature is likely to havebeen the largest of any century, and the 1990s was likely thewarmest decade (IPCC 2002, p. 42). On average, night-time daily minimum temperatures over land have increasedat about twice the rate of daytime daily maximum tempera-tures since about 1950 (approximately 0.2� versus 0.1� Cel-sius per decade). This has lengthened the freeze-free seasonin many mid- and high-latitude regions.
Precipitation increased by 0.5–1% per decade in thetwentieth century over most mid- and high-latitudes of theNorthern Hemisphere continents. Rainfall has decreasedover much of the sub-tropical land areas (�0.3% per dec-ade), although it appeared to recover in the 1990s. It islikely that there has been an increase in heavy and extremeprecipitation events, on average, in the mid- and high-lati-tudes of the Northern Hemisphere.
There has been a widespread retreat of mountain glaciersin nonpolar regions during the twentieth century, decreasesof about 10% in the extent of snow cover since the late1960s, and a reduction of about two weeks in the annualduration of lake- and river-ice cover in the mid- and highlatitudes of the Northern Hemisphere over the twentiethcentury. Northern Hemisphere spring and summer sea-iceextent has decreased by about 10–15% since the 1950s. It islikely that there has been about a 40% decline in Arctic sea-ice thickness during late summer to early autumn in recentdecades and a considerably slower decline in winter sea-icethickness.
Global-average sea level rose 10–20 centimeters duringthe twentieth century. Warm episodes of the El Nino/Southern Oscillation phenomenon have been more fre-quent, persistent, and intense since the mid-1970s. This re-cent behavior has been reflected in regional variations ofprecipitation and temperature over much of the tropics andsub-tropics.
7.3.1.2 Observed Changes in Atmospheric Composition:Greenhouse Gases and Aerosol Precursors
Since 1750, the atmospheric concentration of carbon diox-ide has increased by about 32% (from about 280 to 376 partsper million in 2003. Approximately 60% of that increase (60ppm) has taken place since 1959 (Keeling and Whorf, atcdiac.esd.ornl.gov/trends/co2/sio-mlo.htm). (See Figure7.14 in Appendix A.) Nearly 80% of the increase during thepast 20 years is due to fossil fuel burning, with the rest beingdue to land use changes, especially deforestation and, to alesser extent, cement production. The rate of increase ofatmospheric CO2 concentration has been about 0.4% peryear over the past two decades. During the 1990s, the an-nual increase varied by a factor of three, with a large part ofthis variability being due to the effect of climate variabilityon CO2 uptake and release by land and oceans.
Atmospheric methane concentrations have increased bya factor of 2.5 since 1750 (from about 700 to 1,750 partsper billion), and they continue to increase. The annual in-crease in CH4 atmospheric concentrations became slower
PAGE 200
and more variable in the 1990s compared with the 1980s.The atmospheric concentration of nitrous oxide has in-creased by about 17% since 1750 (from about 270 to 315parts per billion).
The atmospheric concentrations of many of the halocar-bon gases that are both ozone-depleting and greenhousegases are either decreasing or increasing more slowly in re-sponse to reduced emissions under the regulations of theMontreal Protocol on the ozone layer and its amendments.Their substitute compounds and some other synthetic com-pounds (such as perfluorocarbons and sulfur hexafluoride)are increasing rapidly in the atmosphere, but from recentnear-zero concentrations.
Tropospheric ozone has increased by about 35% since1750 due to anthropogenic emissions of several ozone-forming gases (non-methane hydrocarbons, NOx, and car-bon monoxide). Ozone varies considerably by region, andbecause of its short atmospheric lifetime it responds muchmore quickly to changes in precursor emissions than thelong-lived greenhouse gases, such as CO2.
7.3.1.3 Projections of Changes in Atmospheric Composition:Greenhouse Gases and Aerosol Precursors
Carbon emissions due to fossil-fuel burning are virtuallycertain to be the dominant influence on the trends in atmo-spheric CO2 concentration during the twenty-first century.As the CO2 concentration increases and climate changes,the oceans and land will take up a progressively decreasingproportion of anthropogenic carbon emissions. By the endof the twenty-first century, models project atmosphericconcentrations of CO2 of 540–970 parts per million. (SeeFigure 7.15 in Appendix A.) This range of projected con-centrations is primarily due to differences among the emis-sions scenarios (the IPCC-SRES scenarios show a range of5–28 gigatons of carbon per year in 2100, compared with7.1 gigatons in 1990); different carbon model assumptionswould add at least 10% uncertainty to these projections.Sequestration of carbon by changing land use could influ-ence atmospheric CO2 concentration. However, even if allof the carbon so far released by land use changes could berestored to the terrestrial biosphere (through reforestation,for example), projected levels of CO2 concentration wouldbe reduced by only 40–70 parts per million.
Model projections of the emissions of the non-CO2
greenhouse gases vary considerably by 2100 across theIPCC-SRES emissions scenarios. Annual anthropogenicCH4 and N2O emissions are projected to be 270–890 tera-gram CH4 and 5–17 teragram N in 2100, compared with310 teragram CH4 and 6.7 teragram N in 1990. By the endof the century, models project the atmospheric concentra-tions of CH4 to be 1,550–3,750 parts per billion and ofN2O to be 340–460 parts per billion.
Model projections of the emissions of the precursors oftropospheric ozone—that is, CO, NMHCs, and NOx—alsovary considerably by 2100 across the IPCC-SRES emissionsscenarios. Annual anthropogenic emissions are projected tobe 360–2,600 teragram CO, 90–420 teragram NMHCs,and 19–110 teragram N in 2100, compared with about 880teragram CO, 140 teragram NMHCs, and 31 teragram N
................. 11411$ $CH7 10-27-05 08:42:58 PS

201Drivers of Change in Ecosystem Condition and Services
in 1990. In some scenarios, tropospheric ozone would be-come as important a radiative forcing agent as CH4 andwould threaten the attainment of air quality targets overmuch of the Northern Hemisphere.
The IPCC-SRES scenarios primarily project decreasesin anthropogenic sulfur dioxide emissions, leading to pro-jected decreases in the atmospheric concentrations of sulfateaerosols. Model projections of the emissions of SO2 varyconsiderably by 2100 across the IPCC-SRES emissions sce-narios. Annual anthropogenic SO2 emissions are projectedto be 20–60 teragram S in 2100, compared with about 71teragram S in 1990. In addition, natural aerosols (such as seasalt, dust, and emissions leading to the production of sulfateand carbon aerosols) may increase as a result of changes inclimate and atmospheric chemistry.
7.3.1.4 Existing Projections of Changes in Climate
The global climate of the twenty-first century will dependon natural changes and the response of the climate systemto human activities. Climate models can simulate the re-sponse of many climate variables, such as increases in globalsurface temperature and sea level, in various scenarios ofgreenhouse gas and other human-related emissions. (SeeTable 7.6.) The globally averaged surface air temperatureincrease from 1990 to 2100 for the range of IPCC-SRESscenarios is projected to be 1.4–5.8� Celsius. This increasewould be without precedent during the last thousand years.
Table 7.6 Observed and Modeled Changes in Extremes ofWeather and Climate (IPCC 2002)
ChangeObserved (1950–2000)
Projections from Models(2050–2100)
Higher maximum temperatures and more hot days
nearly all land areas most models
Increase of heat index many land areas most models
More intense precipitation events
many northern hemi-sphere mid- to high-latitude land areas
most models
Higher minimum temperatures and fewer cold days
virtually all land areas most models
Fewer frost days virtually all land areas physically plausiblebased on increasedminimum tempera-tures
Reduced diurnal temperature range
most land areas most models
Summer continental drying
few areas most models
Increase in tropicalcyclone peak wind intensities
not observed, butvery few analyses
some models
Increase in tropicalcyclone mean and peakprecipitation intensities
insufficient data some models
PAGE 201
A coherent picture of regional climate change using re-gionalization techniques is not yet possible. However, basedon recent global model simulations, it is likely that nearly allland areas will warm more rapidly than the global average,particularly those at high latitudes in the cold season. Mostnotable is the warming in the northern regions of NorthAmerica and in northern and central Asia, which is in excessof 40% above the global-mean change. In contrast, thewarming is less than the global-mean change in South andSoutheast Asia in summer and southern South America inwinter.
Globally averaged precipitation is projected to increase.Based on recent global model simulations, it is likely thatprecipitation will increase over northern mid- and high lati-tudes and over Antarctica in winter. At low latitudes, thereare both regional increases and decreases, which are likelyto depend on the emissions scenario, but in general mostarid and semiarid areas are projected to become drier.
Analyses of past data and improvements in climate mod-els have enabled changes in extreme events observed to date(such as heat waves, heavy precipitation events, anddroughts) to be compared to similar changes in model sim-ulations for future climate.
For some other extreme phenomena, many of whichmay have important impacts on ecosystems and society,there is currently insufficient information to assess recenttrends, and the confidence in models and understanding isinadequate to make firm projections on, for instance, theintensity of mid-latitude storms. Further, very small-scalephenomena, such as thunderstorms, tornadoes, hail, andlightning, are not simulated in global models. Recent trendsfor conditions to become more El Nino-like in the tropicalPacific are projected to continue in many models, althoughconfidence in such projections is tempered by some short-comings in how well El Nino is simulated in global climatemodels.
Northern Hemisphere snow cover and sea-ice extent areprojected to decrease further. Glaciers and icecaps (exclud-ing the ice sheets of Greenland and Antarctica) will con-tinue their widespread retreat during the twenty-firstcentury.
For the range of IPCC-SRES scenarios, a sea level riseof 9–88 centimeters is projected for 1990 to 2100, with acentral value of 0.47 meters, which is about two to fourtimes the rate over the twentieth century.
7.3.1.5 Climate Drivers and Ecosystem Consequences
Climate change and elevated atmospheric concentrations ofCO2 are projected to affect individuals, populations, spe-cies, and ecosystem composition and function both directly(through increases in temperature and changes in precipita-tion, changes in extreme climatic events and in the case ofaquatic systems changes in water temperature, sea level, andso on) and indirectly (through climate changing the inten-sity and frequency of disturbances such as wildfires andmajor storms). The magnitude of the impacts will, however,depend on other anthropogenic pressures, particularly in-creased land use intensity and the associated modification,fragmentation, and loss of habitats (or habitat unification,
................. 11411$ $CH7 10-27-05 08:42:59 PS

202 Ecosystems and Human Well-being: Scenarios
especially in the case of freshwater bodies); the introductionof invasive species; and direct effects on reproduction, dom-inance, and survival through chemical and mechanicaltreatments.
No realistic projection of the future state of Earth’s eco-systems can be made without taking into account all ofthese pressures—past, present, and future. Independent ofclimate change, biodiversity is forecast to decrease in thefuture due to the multiple pressures from human activi-ties—climate change constitutes an additional pressure.Quantification of the impacts of climate change alone,given the multiple and interactive pressures acting onEarth’s ecosystems, is difficult and likely to vary regionally.
The general impact of climate change is that the habitatsof many species will move poleward or to higher elevationsfrom their current locations, with the most rapid changesbeing where the general tendency is accelerated by changesin natural and anthropogenic disturbance patterns. For ex-ample, the climatic zones suitable for temperate and borealplant species may be displaced by 200–1,200 kilometerspoleward over the next 100 years. Weedy species (those thatare highly mobile and can establish quickly) and invasivespecies will have advantage over others. Drought and de-sertification processes will result in movements of habitatsof many species toward areas of higher rainfall from theircurrent locations.
Species and ecosystems are projected to be affected byextreme climatic events—for example, higher maximumtemperatures, more hot days, and heat waves are projectedto increase heat stress in plants and animals and reduce plantproductivity. Higher minimum temperatures, fewer colddays, frost days, and cold waves could result in an extendedrange and activity of some pest and disease vectors and in-creased productivity in some plant species and ecosystems.More-intense precipitation events are projected to result inincreased soil erosion, increased flood runoff. Increasedsummer drying over most mid-latitude continental interiorsand associated risk of drought are projected to result in de-creased plant productivity, increased risk of wild fires anddiseases, and pest outbreaks. Increased Asian summer mon-soon precipitation variability and increased intensity ofmid-latitude storms could lead to increased frequency andintensity of floods and damage to coastal areas.
7.3.1.6 Overview of Climate Drivers in the MA Scenarios
The MA scenarios use the IPCC-SRES scenarios as a basisfor their assumptions about the energy and climate develop-ments. The range of climate drivers in the MA scenarioscan be found in Chapter 9.
7.3.2 Plant Nutrient Use
All plants require three macronutrients—nitrogen, phos-phorus, and potassium—and numerous micronutrients forgrowth. Crop production often requires supplementationof natural sources. Nitrogen and phosphorus can move be-yond the bounds of the field to which they are applied,potentially affecting ecosystems offsite. In addition, phos-phorus used in detergents and output from sewer systems
PAGE 202
has been an important contributor to aquatic plant growthin water bodies near population centers in some parts of theworld. In this section, we focus on nitrogen and phosphorusas drivers of ecosystem changes. Potassium is relatively im-mobile and mostly benign offsite, so it is not discussed.Other nutrients, particularly micronutrients, are of greatimportance in many parts of the world as drivers for sustain-able crop production and human health (Welch and Gra-ham 1999). Finally, carbon is itself a fertilizer, and risingcarbon concentrations, especially the upper range acrossIPCC-SRES emissions scenarios, would also affect growthof plants.
7.3.2.1 Nitrogen Use and Trends
Atmospheric N is mostly inert N2 gas, which is fixed intoreactive, biologically available forms through both naturaland anthropogenic fixation processes. Human activities aredramatically changing the rate of N2 fixation and global at-mospheric deposition of reactive N (Galloway and Cowling2002). Reactive N is defined as all biologically, photochem-ically, or radiatively active forms of N, a diverse pool thatincludes mineral N forms such as NO3
- and NH4�, gases
that are chemically active in the troposphere (NOx andNH3), and gases such as N2O that contribute to the green-house effect (Galloway et al. 1995). In 1990, the totalamount of reactive N created by human activities was about141 teragram N per year (see Table 7.7), which represents aninefold increase over 1890, compared with a 3.5-fold in-crease in global population (Galloway and Cowling 2002).Between 1960 and 2002, use of nitrogenous fertilizers in-creased eightfold, from 10.83 million to 85.11 million tonsof nitrogen (IFA 2004).
In the past, creation of reactive N was dominated bynatural processes, which also increased forest biomass pro-duction and storage of atmospheric CO2 in plant and soils(Mosier et al. 2001) At present, biological N2 fixation oc-curring in cultivated crops, synthetic N production throughthe Haber-Bosch process, and fossil-fuel combustion havebecome major sources of reactive N (Galloway and Cowl-ing 2002). Vitousek et al. (1997) estimate that humans haveapproximately doubled the rate of N input to the terrestrialN cycle.
Table 7.7 Regional Creation of Reactive Nitrogen in the Mid-1990s (Galloway and Cowling 2002)
World Regions Reactive Nitrogen Creation
Total(teragramper year)
Per Person(kilogram per year)
Africa 5.3 7
Asia 68.9 17
Europe and former Soviet Union 26.5 44
Latin America 9.4 19
North America 28.4 100
Oceania 2.2 63
World 140.7 24
................. 11411$ $CH7 10-27-05 08:43:02 PS
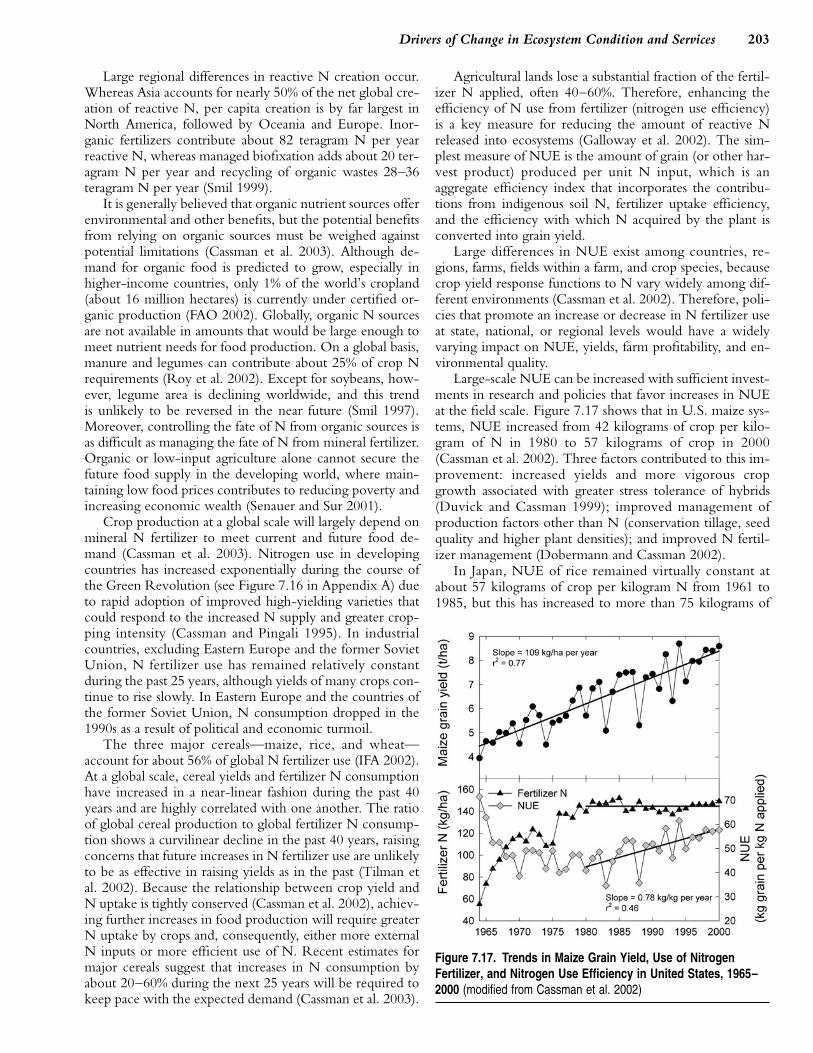
203Drivers of Change in Ecosystem Condition and Services
Large regional differences in reactive N creation occur.Whereas Asia accounts for nearly 50% of the net global cre-ation of reactive N, per capita creation is by far largest inNorth America, followed by Oceania and Europe. Inor-ganic fertilizers contribute about 82 teragram N per yearreactive N, whereas managed biofixation adds about 20 ter-agram N per year and recycling of organic wastes 28–36teragram N per year (Smil 1999).
It is generally believed that organic nutrient sources offerenvironmental and other benefits, but the potential benefitsfrom relying on organic sources must be weighed againstpotential limitations (Cassman et al. 2003). Although de-mand for organic food is predicted to grow, especially inhigher-income countries, only 1% of the world’s cropland(about 16 million hectares) is currently under certified or-ganic production (FAO 2002). Globally, organic N sourcesare not available in amounts that would be large enough tomeet nutrient needs for food production. On a global basis,manure and legumes can contribute about 25% of crop Nrequirements (Roy et al. 2002). Except for soybeans, how-ever, legume area is declining worldwide, and this trendis unlikely to be reversed in the near future (Smil 1997).Moreover, controlling the fate of N from organic sources isas difficult as managing the fate of N from mineral fertilizer.Organic or low-input agriculture alone cannot secure thefuture food supply in the developing world, where main-taining low food prices contributes to reducing poverty andincreasing economic wealth (Senauer and Sur 2001).
Crop production at a global scale will largely depend onmineral N fertilizer to meet current and future food de-mand (Cassman et al. 2003). Nitrogen use in developingcountries has increased exponentially during the course ofthe Green Revolution (see Figure 7.16 in Appendix A) dueto rapid adoption of improved high-yielding varieties thatcould respond to the increased N supply and greater crop-ping intensity (Cassman and Pingali 1995). In industrialcountries, excluding Eastern Europe and the former SovietUnion, N fertilizer use has remained relatively constantduring the past 25 years, although yields of many crops con-tinue to rise slowly. In Eastern Europe and the countries ofthe former Soviet Union, N consumption dropped in the1990s as a result of political and economic turmoil.
The three major cereals—maize, rice, and wheat—account for about 56% of global N fertilizer use (IFA 2002).At a global scale, cereal yields and fertilizer N consumptionhave increased in a near-linear fashion during the past 40years and are highly correlated with one another. The ratioof global cereal production to global fertilizer N consump-tion shows a curvilinear decline in the past 40 years, raisingconcerns that future increases in N fertilizer use are unlikelyto be as effective in raising yields as in the past (Tilman etal. 2002). Because the relationship between crop yield andN uptake is tightly conserved (Cassman et al. 2002), achiev-ing further increases in food production will require greaterN uptake by crops and, consequently, either more externalN inputs or more efficient use of N. Recent estimates formajor cereals suggest that increases in N consumption byabout 20–60% during the next 25 years will be required tokeep pace with the expected demand (Cassman et al. 2003).
PAGE 203
Agricultural lands lose a substantial fraction of the fertil-izer N applied, often 40–60%. Therefore, enhancing theefficiency of N use from fertilizer (nitrogen use efficiency)is a key measure for reducing the amount of reactive Nreleased into ecosystems (Galloway et al. 2002). The sim-plest measure of NUE is the amount of grain (or other har-vest product) produced per unit N input, which is anaggregate efficiency index that incorporates the contribu-tions from indigenous soil N, fertilizer uptake efficiency,and the efficiency with which N acquired by the plant isconverted into grain yield.
Large differences in NUE exist among countries, re-gions, farms, fields within a farm, and crop species, becausecrop yield response functions to N vary widely among dif-ferent environments (Cassman et al. 2002). Therefore, poli-cies that promote an increase or decrease in N fertilizer useat state, national, or regional levels would have a widelyvarying impact on NUE, yields, farm profitability, and en-vironmental quality.
Large-scale NUE can be increased with sufficient invest-ments in research and policies that favor increases in NUEat the field scale. Figure 7.17 shows that in U.S. maize sys-tems, NUE increased from 42 kilograms of crop per kilo-gram of N in 1980 to 57 kilograms of crop in 2000(Cassman et al. 2002). Three factors contributed to this im-provement: increased yields and more vigorous cropgrowth associated with greater stress tolerance of hybrids(Duvick and Cassman 1999); improved management ofproduction factors other than N (conservation tillage, seedquality and higher plant densities); and improved N fertil-izer management (Dobermann and Cassman 2002).
In Japan, NUE of rice remained virtually constant atabout 57 kilograms of crop per kilogram N from 1961 to1985, but this has increased to more than 75 kilograms of
Figure 7.17. Trends in Maize Grain Yield, Use of NitrogenFertilizer, and Nitrogen Use Efficiency in United States, 1965–2000 (modified from Cassman et al. 2002)
................. 11411$ $CH7 10-27-05 08:43:08 PS
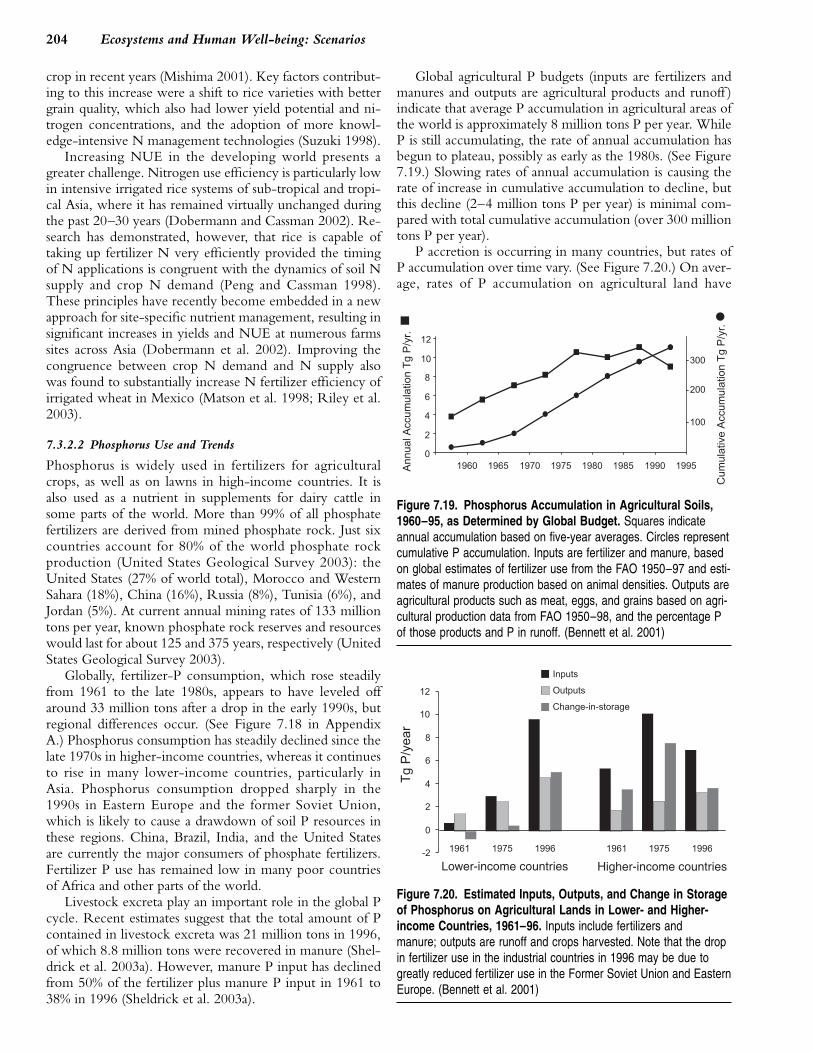
204 Ecosystems and Human Well-being: Scenarios
crop in recent years (Mishima 2001). Key factors contribut-ing to this increase were a shift to rice varieties with bettergrain quality, which also had lower yield potential and ni-trogen concentrations, and the adoption of more knowl-edge-intensive N management technologies (Suzuki 1998).
Increasing NUE in the developing world presents agreater challenge. Nitrogen use efficiency is particularly lowin intensive irrigated rice systems of sub-tropical and tropi-cal Asia, where it has remained virtually unchanged duringthe past 20–30 years (Dobermann and Cassman 2002). Re-search has demonstrated, however, that rice is capable oftaking up fertilizer N very efficiently provided the timingof N applications is congruent with the dynamics of soil Nsupply and crop N demand (Peng and Cassman 1998).These principles have recently become embedded in a newapproach for site-specific nutrient management, resulting insignificant increases in yields and NUE at numerous farmssites across Asia (Dobermann et al. 2002). Improving thecongruence between crop N demand and N supply alsowas found to substantially increase N fertilizer efficiency ofirrigated wheat in Mexico (Matson et al. 1998; Riley et al.2003).
7.3.2.2 Phosphorus Use and Trends
Phosphorus is widely used in fertilizers for agriculturalcrops, as well as on lawns in high-income countries. It isalso used as a nutrient in supplements for dairy cattle insome parts of the world. More than 99% of all phosphatefertilizers are derived from mined phosphate rock. Just sixcountries account for 80% of the world phosphate rockproduction (United States Geological Survey 2003): theUnited States (27% of world total), Morocco and WesternSahara (18%), China (16%), Russia (8%), Tunisia (6%), andJordan (5%). At current annual mining rates of 133 milliontons per year, known phosphate rock reserves and resourceswould last for about 125 and 375 years, respectively (UnitedStates Geological Survey 2003).
Globally, fertilizer-P consumption, which rose steadilyfrom 1961 to the late 1980s, appears to have leveled offaround 33 million tons after a drop in the early 1990s, butregional differences occur. (See Figure 7.18 in AppendixA.) Phosphorus consumption has steadily declined since thelate 1970s in higher-income countries, whereas it continuesto rise in many lower-income countries, particularly inAsia. Phosphorus consumption dropped sharply in the1990s in Eastern Europe and the former Soviet Union,which is likely to cause a drawdown of soil P resources inthese regions. China, Brazil, India, and the United Statesare currently the major consumers of phosphate fertilizers.Fertilizer P use has remained low in many poor countriesof Africa and other parts of the world.
Livestock excreta play an important role in the global Pcycle. Recent estimates suggest that the total amount of Pcontained in livestock excreta was 21 million tons in 1996,of which 8.8 million tons were recovered in manure (Shel-drick et al. 2003a). However, manure P input has declinedfrom 50% of the fertilizer plus manure P input in 1961 to38% in 1996 (Sheldrick et al. 2003a).
PAGE 204
Global agricultural P budgets (inputs are fertilizers andmanures and outputs are agricultural products and runoff )indicate that average P accumulation in agricultural areas ofthe world is approximately 8 million tons P per year. WhileP is still accumulating, the rate of annual accumulation hasbegun to plateau, possibly as early as the 1980s. (See Figure7.19.) Slowing rates of annual accumulation is causing therate of increase in cumulative accumulation to decline, butthis decline (2–4 million tons P per year) is minimal com-pared with total cumulative accumulation (over 300 milliontons P per year).
P accretion is occurring in many countries, but rates ofP accumulation over time vary. (See Figure 7.20.) On aver-age, rates of P accumulation on agricultural land have
Figure 7.19. Phosphorus Accumulation in Agricultural Soils,1960–95, as Determined by Global Budget. Squares indicateannual accumulation based on five-year averages. Circles representcumulative P accumulation. Inputs are fertilizer and manure, basedon global estimates of fertilizer use from the FAO 1950–97 and esti-mates of manure production based on animal densities. Outputs areagricultural products such as meat, eggs, and grains based on agri-cultural production data from FAO 1950–98, and the percentage Pof those products and P in runoff. (Bennett et al. 2001)
Lower-income countries Higher-income countries
Figure 7.20. Estimated Inputs, Outputs, and Change in Storageof Phosphorus on Agricultural Lands in Lower- and Higher-income Countries, 1961–96. Inputs include fertilizers andmanure; outputs are runoff and crops harvested. Note that the dropin fertilizer use in the industrial countries in 1996 may be due togreatly reduced fertilizer use in the Former Soviet Union and EasternEurope. (Bennett et al. 2001)
................. 11411$ $CH7 10-27-05 08:43:10 PS

205Drivers of Change in Ecosystem Condition and Services
started to decline in higher-income countries but are stillrising in lower-income ones. While agricultural lands in thelatter had a net loss of P in 1961, they now accumulatemore phosphorus per year than do higher-income coun-tries’ agricultural areas, making up 5 million of the 8 milliontons per year total global P accumulation on agriculturallands. This accumulation is a global average; actual accumu-lation will vary at regional, national, and local scales.
Calculating nutrient budgets is associated with many un-certainties that are seldom taken into account (Oenema etal. 2003). Many estimates are partial budgets or include nu-merous assumptions about components that are difficult toquantify at the scales of interest. Moreover, great diversityexists in P budgets among countries, within a country, oreven between fields in the same farm. Nutrient audits forChina suggest average annual P losses of 5 kilograms perhectare of agricultural land (Sheldrick et al. 2003b). Simi-larly, an annual loss of 3 kilograms of phosphorus per hect-are was estimated for 38 countries of sub-Saharan Africa(Stoorvogel et al. 1993).
In contrast, on-farm studies conducted at 207 sites inChina, India, Indonesia, Thailand, and the Philippinesshowed an average annual surplus of 12 kilograms P perhectare under double-cropping of irrigated rice (Dober-mann and Cassman 2002). A study in Uganda demonstratedthat the P balance was near neutral for a whole district, butit varied from positive in fields near homesteads to negativein outfields (Bekunda and Manzi 2003). In Southern Mali,P was at balance for the whole region, but large local varia-tions occurred (Van der Pol and Traore 1993). Soil surfaceP balances studied in nine organic farms in the UnitedKingdom were positive in six cases, resulting from supple-mentary P fertilizer (rock phosphate) and additional feed fornon-ruminant livestock, whereas a stockless system withoutP fertilizer resulted in a large P deficit (Berry et al. 2003).In slash-and-burn agriculture, the P balance is only positivewhen fertilizer is applied (Hoelscher et al. 1996).
Global differences in soil quality also affect the relation-ships between fertilizer P use, crop productivity, and risk ofP pollution. In many tropical regions, small farmers operateon acid upland soils with high P-fixation potential. Recla-mation of P-deficient land requires larger phosphate appli-cations (Uexkuell and Mutert 1995) and good soilconservation to prevent P losses by erosion.
7.3.2.3 Potassium Use and Trends
Annual global potash production amounts to about 26 mil-lion tons, of which 93% is used in agriculture. Roughly96% of all potash is produced in North America, Westernand Eastern Europe, and the Middle East. Nine companiesin Canada, Russia, Belarus, Germany, the United States,and Israel account for 87% of the global potash production.Large amounts of potash fertilizers are shipped around theglobe to satisfy the needs of crop production for this impor-tant macronutrient.
Trends in global potash fertilizer use are similar to thoseobserved for N and P: stagnating or slightly declining usein many higher-income countries, significant increases inselected lower-income countries, and a sharp drop in East-
PAGE 205
ern Europe and the former Soviet Union in recent years.(See Figure 7.21.)
Negative potassium (or K) budgets in many parts of thedeveloping world raise concern about the long-term sus-tainability of crop production, particularly under intensivecultivation. For example, although K use has increased onagricultural land in China during the past 20 years, the na-tion’s overall annual K budget remains highly negative atabout negative 60 kilograms per hectare (Sheldrick et al.2003b). Similar estimates for India and Indonesia suggestannual K losses of about 20–40 kilograms of K per hectare,and these losses have been increasing steadily during the past40 years. An average annual K loss of nearly 20 kilogramsper hectare was estimated for all of sub-Saharan Africa(Stoorvogel et al. 1993). Average annual K losses of about50 kilograms per hectare are common in double croppingrice systems of Asia (Dobermann et al. 1998).
Overall, potassium deficiency in agriculture is not yetwidespread, but if present trends continue, it is only a mat-ter of time until depletion of soil K resources will reachlevels that could cause significant limitations for crop pro-duction. Because most of the K taken up by plants is con-tained in vegetative plant parts, recycling of crop residueand organic wastes is a key issue for sustaining K input-output balances. Mineral fertilizer use must be balancedwith regard to K, which is an important measure to increaseyields and nitrogen use efficiency. To achieve this, annualrates of K use in the developing world may have to risemuch faster than those of N use.
7.3.2.4 Plant Nutrient Drivers and Ecosystem Consequences
7.3.2.4.1 Nitrogen and ecosystem consequences
Synthetic production of fertilizer N has been a key driverof the remarkable increase in food production that has oc-curred during the past 50 years (Smil 2001), but crop pro-duction also contributes much to global accumulation ofreactive N. Only about half of all anthropogenic N inputson croplands are taken up by harvested crops and their resi-
Figure 7.21. Trends in Global Consumption of Potash Fertilizer,1961–2000 (IFA 2003)
................. 11411$ $CH7 10-27-05 08:43:15 PS

206 Ecosystems and Human Well-being: Scenarios
dues. Losses to the atmosphere amount to 26–60 milliontons N per year, while waters receive 32–45 million tonsN per year from leaching and erosion (Smil 1999). Manyuncertainties are associated with these estimates, but thereis increasing concern about the enrichment of the biospherewith reactive N forms and significant changes in reactive Ndistribution (Galloway and Cowling 2002). The key chal-lenge is to meet the greater N requirements of higher-yield-ing crops while concurrently increasing nitrogen useefficiency and reducing the reactive N load attributable toagriculture.
If left unchecked, significant costs to society may arisethrough both direct and indirect effects on the environmentand human health (Wolfe and Patz 2002) caused by in-creased emissions of NOx, NH3, N2O, NO3, and dissolvedorganic N compounds or by deposition of NOy and NHx
compounds (Mosier et al. 2001; Townsend et al. 2003).Consequences include decreased drinking water quality(Spalding and Exner 1993), eutrophication of freshwaterecosystems (McIsaac et al. 2001), hypoxia in coastal marineecosystems (Rabalais 2002), nitrous oxide emissions con-tributing to global climate change (Smith et al. 1997;Bouwman et al. 2002), and air pollution by NOx in urbanareas (Townsend et al. 2003). Occurrence of such problemsvaries widely in different world regions. However, prelimi-nary estimates for the United Kingdom (Pretty et al. 2000)and Germany (Schweigert and van der Ploeg 2000) suggestthat the environmental costs of excessive N fertilizer usemay be a substantial proportion of the value of all farmgoods produced.
7.3.2.4.2 Phosphorus and ecosystem consequences
Approximately 20–30% of P in fertilizer is taken up by ag-ricultural plants when they grow (Sharpley et al. 1993). Theremainder accumulates in the soil or runs off. Phosphorusmoves downhill in particulate or dissolved form, where ithas secondary impacts on other ecosystems.
Phosphorus is the limiting nutrient in most freshwaterlakes (Vollenweider 1968; Schindler 1977) and is a criticalnutrient in the productivity of marine ecosystems (Tyrell1999). Excess P degrades lakes through a syndrome of in-creased productivity called eutrophication (Vollenweider1968; Schindler et al. 1971; Dillon and Rigler 1974). Phos-phorus is the primary cause of most freshwater eutrophica-tion and a component of estuarine eutrophication.Eutrophic lakes frequently experience noxious algalblooms, increased aquatic plant growth, and oxygen deple-tion, leading to degradation of their ecological, economic,and aesthetic value by restricting use for fisheries, drinkingwater, industry, and recreation (National Research Council1992; Sharpley et al. 1994).
When lakes become eutrophic, many ecosystem servicesare reduced. Water from lakes that experience algal bloomsis more expensive to purify for drinking or other industrialuses (Carpenter et al. 1998). Eutrophication can also restrictuse of lakes for fisheries because low oxygen levels reducefish populations (Smith 1998). While habitat for someaquatic plants, such as noxious algae, are increased by eutro-phication, habitat for other plants, such as aquatic macro-
PAGE 206
phytes, may decrease. Underlying all these changes arereductions in some of the supporting services provided bylakes, such as nutrient cycling. Possibly the most strikingloss is that of many of the cultural services provided bylakes. Foul odors of rotting algae, slime-covered lakes, andtoxic chemicals produced by some blue-green algae duringblooms keep people from swimming, boating, and other-wise enjoying the aesthetic value of lakes.
In marine systems, excess P input causes harmful algalblooms (including blooms of toxic species); growth ofattached algae and macrophytes that can damage benthichabitats, including coral reefs; problems with deoxygen-ation and foul odors; fish mortality; and economic lossesassociated with increased costs of water purification and im-pairment of water supply for agriculture, industry, and mu-nicipal consumption (Postel 1997; Carpenter et al. 1998;Smith 1998). The U.S. Environmental Protection Agencycalled eutrophication the most ubiquitous water qualityproblem in the United States (U.S. Environmental Protec-tion Agency 1996). Although it is currently a key problemprimarily in industrial countries with high rates of fertilizeruse, recent increases in phosphate fertilizer use in develop-ing countries indicate that it may become of increasing im-portance there as well.
It is extremely difficult to control P runoff because itcomes from widely dispersed sources and can vary withweather. Studies indicate that agriculture is a major sourceof P (Sharpley 1995) and that most of the runoff happensduring spring storms that carry soils and their P into bodiesof water (Pionke et al. 1997), but it has proved very difficultto locate particular fields as important sources in ways otherthan through proxy measurements, such as high concentra-tions of P in the soil.
Accumulation of P uphill from bodies of water has beentermed a chemical time bomb (Stigliani et al. 1991) becauseit is simply waiting to be transported to downstream waterbodies through erosion and other processes. As a global av-erage, if we completely ceased all P fertilizer use it wouldtake approximately 40 years for soil P concentrations to re-turn to 1958 levels (calculated based on Bennett et al.2001). It is important to keep in mind that turnover ratesfor P in soils are highly variable in space. Some areas withhigh soil P may have very slow turnover. For example, astudy of the Lake Mendota watershed in Wisconsin USA,suggests that if over fertilizing were to stop, it would stilltake over 260 years for P in the soil to drop to 1974 levels(Bennett et al. 1999). Other budgets for high P soils indicatesimilarly long turnover times. However, many regions, es-pecially in highly weathered tropical soils, have soils that arevery impoverished in P and would have a shorter draw-down time.
7.3.2.4.3 Potassium and ecosystem consequences
Negative environmental impacts of potassium are negligi-ble, so that its major role as an ecosystem driver is that ofincreasing crop productivity. Potassium has no known neg-ative consequences for ecosystems, and its excessive accu-mulation in soils and waters is rare.
................. 11411$ $CH7 10-27-05 08:43:16 PS

207Drivers of Change in Ecosystem Condition and Services
7.3.2.5 Summary of Plant Nutrient Drivers
Human activities have dramatically altered plant nutrientcycles. Human interventions have had a positive impact oncrucial ecosystem services such as food supply but have alsocaused numerous negative consequences for other ecosys-tem services. These impacts (negative and positive) vary bylocation.
Changes in the global atmospheric deposition of reactiveN and in the concentrations of soil P have had a positiveimpact on increasing food production at affordable pricesbut have also had negative consequences for some ecosys-tem services. Traditional cropping practiced before syn-thetic N fertilizers became available could provide today’saverage diets for only about 40% of the existing population(Smil 2001). As the human population continues to in-crease, fertilizer N will continue to play a dominant rolein the global N cycle. Therefore, increases in nitrogen useefficiency are necessary to control the cycling of the mostpotent reactive N compounds. There is much potential forfine-tuning N management in agricultural crops throughtechnologies that achieve greater congruence between cropN demand and N supply from all sources—including fertil-izer, organic inputs, and indigenous soil N (Cassman et al.2002). Such improvements are likely to have a large impacton the global N cycle, but they require collaborationamong agronomists, soil scientists, agricultural economists,ecologists, and politicians (Galloway et al. 2002), as well assignificant long-term investments in research and educa-tion.
Patterns of P supply, consumption, and waste produc-tion have also become decoupled from natural P cycles(Tiessen 1995). Changing the P cycle has had a positiveimpact on production of food from agricultural areas, but anegative impact on provision of services from aquatic eco-systems downstream from those areas. Phosphorus surplusesdue to fertilizer use, livestock industry, and imports of feedand food have become widespread in high-income coun-tries. In contrast, both P surpluses and deficits are found indeveloping countries, including large areas that are naturallyP-deficient. Finding ways to maintain or increase agricul-tural production without sacrificing water quality will be amajor issue in the coming years.
7.3.2.6 Overview of Plant Nutrient Drivers in the MA Scenarios
Changes in nutrient use vary among the scenarios, depend-ing on the key indirect drivers of food demand and techno-logical change. Increased food demand generally leads toincreases in the amount of fertilizer used; however, this canbe tempered by technological change that results in in-creased food production without additional fertilizers.
All scenarios will experience some increase in the use ofN and P fertilizers due to growing human population andincreased demand for food. Global Orchestration is pro-jected to have the highest increase in fertilizer use. Increas-ing economic openness in this scenario makes fertilizersavailable in locations where they currently are not com-monly used. Much of the increase in fertilizer use will be incurrently poor countries. Order from Strength will also
PAGE 207
have a large increase in fertilizer use. In this scenario, how-ever, most of the increase comes from higher use in wealth-ier countries.
Increased agricultural production in wealthier countriesrequires increased efficiency of production from lands al-ready in cultivation in addition to a greater amount of culti-vated land. Without additional technological advances,production is likely to be improved through heavier use offertilizers. Food production in the TechnoGarden scenarioalso increases, but technical change is the primary driver, sofertilizer use increase is the lowest in this scenario. Nutrientuse in the Adapting Mosaic scenario falls in the range of theother scenarios. The environmentally proactive approachshould lead to decreased use of fertilizers, but low amountsof trade will force people in some areas to use fertilizersheavily simply to feed people locally.
7.3.3 Land Conversion
Humans change land use to alter the mix of ecosystem ser-vices provided by that land. Sometimes the land conversioneffort is intentional, such as plowing grassland to growcrops. In other cases, land conversion is a consequence ofother activities. For example, salinization is the unintendedconsequence of irrigation that does not have adequatedrainage.
The Millennium Ecosystem Assessment sponsored aninternational effort to document regions around the worldin which rapid and recent change (since the 1970s) in landcover can be shown to have occurred (Lepers et al. in press).In this section, we summarize its results, focusing on fourtypes of land conversion—deforestation, dryland degrada-tion, agricultural expansion and abandonment, and urbanexpansion.
7.3.3.1 Deforestation
Deforestation is the single most measured process of landcover change at a global scale (FAO 2001a; Achard et al.2002; DeFries et al. 2002). According to most definitions, aforest is defined as land with tree canopy cover above someminimum threshold or as land that is intended to be used asforested land. (Different thresholds have been used to defineforested land; for instance FAO (2001a) uses a 10% tree can-opy cover threshold, whereas the IGBP land-cover classifi-cation uses a 60% threshold (Scepan 1999).) Deforestationoccurs when forest is converted to another land cover andintended land use. Not all disturbances in a forest ecosystemlead to deforestation. Forested land that has been harvestedand has not yet regrown to forest is often still categorizedas forest in many databases. Forest degradation—‘‘changeswithin the forest that negatively affect the structure or func-tion of the stand or site and thereby lower the capacity tosupply products and/or services’’—can but does not neces-sarily lead to deforestation (FAO 2001a).
Afforestation is the conversion from some other land useto forest; reforestation is afforestation on land that at somepoint in the past was forested. Data on afforestation andreforestation are much less readily available than on defores-tation. Few spatially explicit data sets on afforestation, forest
................. 11411$ $CH7 10-27-05 08:43:17 PS
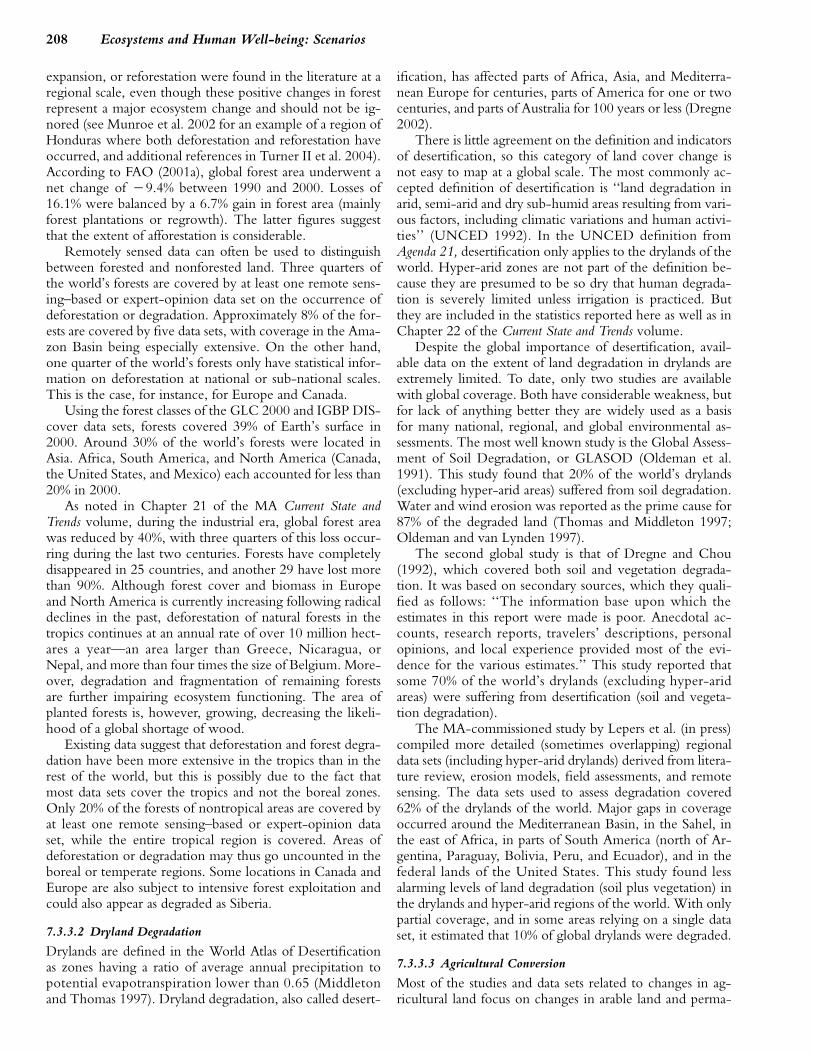
208 Ecosystems and Human Well-being: Scenarios
expansion, or reforestation were found in the literature at aregional scale, even though these positive changes in forestrepresent a major ecosystem change and should not be ig-nored (see Munroe et al. 2002 for an example of a region ofHonduras where both deforestation and reforestation haveoccurred, and additional references in Turner II et al. 2004).According to FAO (2001a), global forest area underwent anet change of �9.4% between 1990 and 2000. Losses of16.1% were balanced by a 6.7% gain in forest area (mainlyforest plantations or regrowth). The latter figures suggestthat the extent of afforestation is considerable.
Remotely sensed data can often be used to distinguishbetween forested and nonforested land. Three quarters ofthe world’s forests are covered by at least one remote sens-ing–based or expert-opinion data set on the occurrence ofdeforestation or degradation. Approximately 8% of the for-ests are covered by five data sets, with coverage in the Ama-zon Basin being especially extensive. On the other hand,one quarter of the world’s forests only have statistical infor-mation on deforestation at national or sub-national scales.This is the case, for instance, for Europe and Canada.
Using the forest classes of the GLC 2000 and IGBP DIS-cover data sets, forests covered 39% of Earth’s surface in2000. Around 30% of the world’s forests were located inAsia. Africa, South America, and North America (Canada,the United States, and Mexico) each accounted for less than20% in 2000.
As noted in Chapter 21 of the MA Current State andTrends volume, during the industrial era, global forest areawas reduced by 40%, with three quarters of this loss occur-ring during the last two centuries. Forests have completelydisappeared in 25 countries, and another 29 have lost morethan 90%. Although forest cover and biomass in Europeand North America is currently increasing following radicaldeclines in the past, deforestation of natural forests in thetropics continues at an annual rate of over 10 million hect-ares a year—an area larger than Greece, Nicaragua, orNepal, and more than four times the size of Belgium. More-over, degradation and fragmentation of remaining forestsare further impairing ecosystem functioning. The area ofplanted forests is, however, growing, decreasing the likeli-hood of a global shortage of wood.
Existing data suggest that deforestation and forest degra-dation have been more extensive in the tropics than in therest of the world, but this is possibly due to the fact thatmost data sets cover the tropics and not the boreal zones.Only 20% of the forests of nontropical areas are covered byat least one remote sensing–based or expert-opinion dataset, while the entire tropical region is covered. Areas ofdeforestation or degradation may thus go uncounted in theboreal or temperate regions. Some locations in Canada andEurope are also subject to intensive forest exploitation andcould also appear as degraded as Siberia.
7.3.3.2 Dryland Degradation
Drylands are defined in the World Atlas of Desertificationas zones having a ratio of average annual precipitation topotential evapotranspiration lower than 0.65 (Middletonand Thomas 1997). Dryland degradation, also called desert-
PAGE 208
ification, has affected parts of Africa, Asia, and Mediterra-nean Europe for centuries, parts of America for one or twocenturies, and parts of Australia for 100 years or less (Dregne2002).
There is little agreement on the definition and indicatorsof desertification, so this category of land cover change isnot easy to map at a global scale. The most commonly ac-cepted definition of desertification is ‘‘land degradation inarid, semi-arid and dry sub-humid areas resulting from vari-ous factors, including climatic variations and human activi-ties’’ (UNCED 1992). In the UNCED definition fromAgenda 21, desertification only applies to the drylands of theworld. Hyper-arid zones are not part of the definition be-cause they are presumed to be so dry that human degrada-tion is severely limited unless irrigation is practiced. Butthey are included in the statistics reported here as well as inChapter 22 of the Current State and Trends volume.
Despite the global importance of desertification, avail-able data on the extent of land degradation in drylands areextremely limited. To date, only two studies are availablewith global coverage. Both have considerable weakness, butfor lack of anything better they are widely used as a basisfor many national, regional, and global environmental as-sessments. The most well known study is the Global Assess-ment of Soil Degradation, or GLASOD (Oldeman et al.1991). This study found that 20% of the world’s drylands(excluding hyper-arid areas) suffered from soil degradation.Water and wind erosion was reported as the prime cause for87% of the degraded land (Thomas and Middleton 1997;Oldeman and van Lynden 1997).
The second global study is that of Dregne and Chou(1992), which covered both soil and vegetation degrada-tion. It was based on secondary sources, which they quali-fied as follows: ‘‘The information base upon which theestimates in this report were made is poor. Anecdotal ac-counts, research reports, travelers’ descriptions, personalopinions, and local experience provided most of the evi-dence for the various estimates.’’ This study reported thatsome 70% of the world’s drylands (excluding hyper-aridareas) were suffering from desertification (soil and vegeta-tion degradation).
The MA-commissioned study by Lepers et al. (in press)compiled more detailed (sometimes overlapping) regionaldata sets (including hyper-arid drylands) derived from litera-ture review, erosion models, field assessments, and remotesensing. The data sets used to assess degradation covered62% of the drylands of the world. Major gaps in coverageoccurred around the Mediterranean Basin, in the Sahel, inthe east of Africa, in parts of South America (north of Ar-gentina, Paraguay, Bolivia, Peru, and Ecuador), and in thefederal lands of the United States. This study found lessalarming levels of land degradation (soil plus vegetation) inthe drylands and hyper-arid regions of the world. With onlypartial coverage, and in some areas relying on a single dataset, it estimated that 10% of global drylands were degraded.
7.3.3.3 Agricultural Conversion
Most of the studies and data sets related to changes in ag-ricultural land focus on changes in arable land and perma-
................. 11411$ $CH7 10-27-05 08:43:19 PS

209Drivers of Change in Ecosystem Condition and Services
nent crops. As defined by FAO, arable land refers to landunder temporary crops, temporary meadows for mowing orpasture, land under market and kitchen gardens, and landtemporarily fallow (less than five years). Permanent croprepresents land cultivated with crops that occupy the landfor long periods and need not be replanted after each har-vest, such as cocoa, coffee, and rubber. This category in-cludes land under flowering shrubs, fruit trees, nut trees,and vines but excludes land under trees grown for wood ortimber (FAO 2001b). As defined by FAO, agricultural landalso includes permanent pasture. However, this category ofland use was not included here due to lack of data and thedifficulty of differentiating pastures from natural unmanagedgrasslands in many parts of the world. So the term ‘‘crop-land class,’’ as used here, refers to arable land and permanentcrops.
The cropland class, defined as areas with at least 10% ofcroplands within each pixel, covered 30% of Earth’s surfacein 1990. The exact proportion was between 12% and 14%,depending on whether Antarctica and Greenland were in-cluded (Ramankutty and Foley 1998). Around 40% of thecropland class was located in Asia; Europe accounted for16% and Africa, North America, and South America eachaccounted for 13%.
Lepers et al. (in press) attempted to assess the change incropland area between 1980 and 1990 by combining datafrom a variety of sources and time periods. This effort re-sulted in unexpected outcomes, including extensive crop-land increase in the central United States, southern Ireland,and the island of Java. It found conversely that cropland areadecreased in China and that there no identifiable hotspotsof cropland increase in the central part of Africa. Clearly,much more analysis is needed to identify changes in thiscritical driver of ecosystem change. (See Box 7.2 for a pro-file of land use change in one region.)
7.3.3.4 Urbanization
In 2000, towns and cities sheltered more than 2.7 billion ofthe world’s 6 billion people (UNDP 2000). Growth inurban population usually results in conversion of agricul-tural, often highly productive land and other land types forresidential, infrastructure, and amenity uses. These growingcities have an impact on their surrounding ecosystemsthrough their demand for food, fuel, water, and other natu-ral resources (Lambin et al. 2003).
So far no global data sets or direct measurements havebeen developed to delineate the changes in extent andshape of urban areas. Only indirect indicators such ashuman population or the evolution through time of thenight-time lights viewed from space can be used as a proxyto measure the change in urban extent. The data presentedhere are based on such indirect indicators and should beconsidered tentative.
Global population is strongly clustered, with 50% of theworld’s population inhabiting less than 3% of the availableland area (excluding Antarctica), at average densities greaterthan 300 people per square kilometer (Small 2001). Today’slargest cities are mainly located on the eastern coast of the
PAGE 209
United States, in western Europe, in India, and in East Asia;the most rapidly growing cities are all located in the tropics.
7.3.4 Biological Invasions and Diseases
7.3.4.1 Biological Invasions and Ecosystem Effects
At present, no definition of biological invasion has beenunanimously accepted by the scientific community, due inpart to the proliferation of terms to describe various con-cepts used by different authors (Richardson et al. 2000).However, consensus is growing around at least two mainaspects of the invasion process: the traits that enable a spe-cies to invade a habitat, called invasiveness, and the habitatcharacteristics that determine its susceptibility to the estab-lishment and spread of an invasive species, its ‘‘invasibility’’(Lonsdale 1999; Alpert et al. 2000).
This conceptual framework allows for an operationaldefinition of invasive species as a species that spreads inspace, either occupying new habitats or increasing its coverin areas previously occupied. This approach allows for amore general treatment of the invasion problem, since casesin which native species become invaders after some habitator climatic change (for example, shrub encroachment, cray-fish, and lampreys (Jeltsch et al.1997; Lodge et al. 2000; vanAuken 2000)) can also be considered. Thus, although mostof invasions are thought to be caused by non-native species,the key distinction becomes between invasive and noninva-sive species rather than between native and non-native spe-cies (Crawley 1986; Alpert et al. 2000; Sakai et al. 2001).
Biological invasions are a global phenomenon, affectingecosystems in most biomes (Mack et al. 2000). Human-driven movement of organisms, deliberate or accidental, hascaused a massive alteration of species ranges, overwhelmingthe changes that occurred after the retreat of the last IceAge (Semken 1983). Ecosystem changes brought about byinvasions can have both short-term (ecological) and long-term (evolutionary) consequences. For example, the tropi-cal alga Caulerpa taxifolia evolved tolerance for colder tem-peratures while it was growing in aquaria. After escaping, itis invading vast portions of the northwest MediterraneanSea (Meisnesz 1999).
Ecological interactions between invaders and native spe-cies can be complex. Invaders can affect native species, butnatives also affect performance of the invaders during theinvasion process.
Acceleration of extinction rates as a result of negativeinteractions is one of the most important consequences ofbiological invasions (Ehrlich and Daily 1993; Daily andEhrlich 1997; Hughes et al. 1998). In the United States,invasions of non-native plants, animals, and microbes arethought to be responsible for 42% of the decline of nativespecies now listed as endangered or threatened (Pimentel2002).
In some cases, the invader causes inhibition of the estab-lishment of native species (a kind of ammensalism) (Walkerand Vitousek 1991). Cases of commensalism and mutualismare less well documented. (Symbiosis is a mutually benefi-cial relationship between two organisms; commensalism isa relationship in which only one of the two organisms ob-
................. 11411$ $CH7 10-27-05 08:43:20 PS

210 Ecosystems and Human Well-being: Scenarios
BOX 7.2
Drivers of Land Use Change in Central Asia
The Central Asian region consists of a broad range of ecosystems and The dissolution of the Soviet Union led to changing pressures on landassociated land uses, spanning an area from west of the Urals to the use once again. Since 1990, land managers have been adjusting to life inMongolian Plateau and the forests of the Far East of Russia. Historically, transition economies, characterized by a combination of volatile markets,this region has been an important supplier of meat, milk, wool, forest prod- policy changes, reductions in public services, and unclear and uncertainucts, and grains. Low population densities of nomadic pastoralists in most land tenure systems. It is not any one of the factors but rather the interac-of this region used the rich grasslands to graze mixed herds of cattle, tions among them that makes these systems and peoples vulnerable.sheep, goats, horses, and camels. Grazing patterns were dictated more by The global factors leading to increased vulnerability in this region stemintra- and interannual climate variability than political or economic factors. from the socioeconomic adjustments to globalization and resource use
Political and social changes have lead to dramatic adjustments in land adjustments resulting from climate warming. In addition, regional adjust-use. During the early 1900s, most croplands and livestock systems were ments have triggered demographic changes and, in some cases, growthplaced under collective management and remained there until the dissolu- to take advantage of opportunities associated with globalization of thetion of the Soviet Union. These land use policies led to major changes in resource base.land management throughout the region and altered the transhumance The consequences of the latest changes include cropland abandon-patterns of livestock and rangeland management. Many aspects of the ment, destocking of certain rangelands and increased stocking of others,traditional nomadic culture were replaced. The largest decline in world degradation of soils due to salinization and desertification, and damage toforests and grassland areas in the past two centuries took place in the wetlands due to modifications of water regimes and industrial develop-Eurasian region. Large-scale agricultural intensification took place during ment. A major shift in livestock rates has been observed in the Eurasianthe Soviet era, and livestock production was made more sedentary. Crop- steppe, with increases in China and Mongolia, where opportunities aroseland conversion peaked during the late 1980s. with free market access, whereas in Central Asian countries major des-
Land degradation due to overgrazing, sowing of monocultures, poor tocking occurred due to loss of social infrastructure. During spring 2003,irrigation management, cropping marginal lands, and increased frequency the region was the source of large dust plumes that traveled as far theof fires has become a serious environmental concern. UNEP estimates North American continent and led to health concerns for the Asian popula-that 60–70% of the grasslands in China, Mongolia, Central Asia, and tions in their path.Russia are overgrazed or degraded due to inappropriate cropping.
tains some sort of advantage, such as between remoras andsharks; mutualism refers to a relationship in which both or-ganisms benefit; ammensalism is an interaction in whichone organism is harmed and the other is unaffected.) Com-mensalism is related to facilitation processes like nurse ef-fects and mutualism. For example, the native Turdus birddisperses seeds of introduced Ligustrum lucidum in Argentina(Marco et al. 2002). An example of mutualism is the intro-duction of exotic N-fixing bacteria or mycorrhizal fungiwith crops (Read et al. 1992).
In many cases, disruption of an interaction in the nativehabitat, like the absence of pathogens, plays an importantrole in contributing to the invasive success of exotic plantand animal species. On average, 84% fewer fungi and 24%fewer viruses infect plant species in the naturalized rangethan in the native range (Mitchell and Power 2003). Tor-chin et al. (2003) show that invasive animal species lose asignificant proportion of the parasite diversity they supportin their native habitat. In a survey of 24 invasive animalspecies, Torchin et al. (2003) show that whereas these spe-cies had an average of 16 species of parasites in their nativerange, only two of the parasites successfully colonized withthe host in the new range. The original parasites were sup-plemented by four parasites native to the host’s exotic habi-tat. This considerable reduction in parasite burden mightgive introduced species an advantage over native specieswith a larger diversity of parasites. Invasive plant species thatare more completely released from pathogens are morewidely reported as harmful invaders of both agricultural andnatural ecosystems.
PAGE 210
The threats that biological invasions pose to biodiversityand to ecosystem-level processes translate directly intoeconomic consequences such as losses in crops, fisheries,forestry, and grazing capacity (Mack et al. 2000). Misman-agement of semiarid grasslands combined with climaticchanges has caused woody plant invasion by native bushesand the loss of grazing lands in North and South America(van Auken 2000). Pimentel (2002) estimated that exoticweeds in crops cost U.S. agriculture $27 billion a year. Ma-rine and estuarine waters in North America are heavily in-vaded, mainly by crustaceans and mollusks in a patterncorresponding to trade routes (Ruiz et al. 2000). U.S. lakesand watersheds are invaded as well. The costs associatedwith zebra mussel (Dreissena polymorpha) invasion were esti-mated at $100 million a year by Pimentel et al. (1999), al-though the $5 billion a year estimated by the Departmentof Environmental Quality of Michigan Government is per-haps a more realistic figure (Michigan Department of Envi-ronmental Quality 2004). Leung et al. (2002) found anexpenditure of up to $324,000 per year to prevent invasionby zebra mussels into a single lake with a power plant.
In spite of these alarming figures, can introductions ofalien species be beneficial? Some 98% of the U.S. food sup-ply comes from introduced species, such as corn, wheat,rice, and other crops, as well as cattle, poultry, and otherlivestock (Pimentel 2002). The same proportion of intro-duced to native food species is likely to be found in mostcountries. Some species are introduced to control other in-troduced species, sometimes successfully (Galerucella calmar-iensis and G. pusilla to control purple loosestrife in North
................. 11411$ $CH7 10-27-05 08:43:21 PS
211Drivers of Change in Ecosystem Condition and Services
America) and sometimes unsuccessfully (Bufo marinus (canetoad) to control greyback cane beetle (Dermolepida albohir-tum (Waterhouse)) and French’s Cane Beetle (Lepidiotafrenchi (Blackburn)) in Australia and other sugar-growingcountries).
Many introduced species are alternative resources fornative species (for example, alien plants and fruit-eatingbirds already mentioned). But how many of them have be-come invasive? In Britain, 71 out of 75 non-native cropplant species are naturalized, in part because they arestrongly selected to growth where they are cultivated (Wil-liamson and Fitter 1996). However, not all habitats areequally invasible. In an extensive study of plant invasions inthe British Isles, Crawley has shown that lowland disturbedhabitats are host to a much larger diversity of alien plantspecies than are upland habitats, which remain relativelyuninvaded (Crawley and May 1987; Crawley 1989).
7.3.4.2 Diseases and Ecosystem Effects
Many biological invasions are regarded as affecting humanwell-being, either by affecting public health or by impairingeconomic activities such as agriculture or fisheries. Amongthe most common sanitary problems are the invasions bydisease-causing organisms or by vectors of disease-causingparasites. Tuberculosis, AIDS, influenza, cholera, bubonicplague, bovine spongiform encephalopathy, and severeacute respiratory syndrome are among the diseases causedby introduced pathogenic biological agents in many coun-tries. For example, more than 100 million people are in-fected with the influenza virus each year in just the UnitedStates, Europe, and Japan. In the United States alone, in-fluenza represents on average $14.6 billion in direct andindirect costs each year. The influenza virus is originallyAsiatic, and aquatic birds provide the natural reservoir fromwhich occasional genetic mutations can spread to domesticpoultry and humans (Zambon 2001).
While the term ‘‘invasive alien species’’ is commonlyassociated with plants and insects, parasites and pathogenspossess a considerable potential to significantly modify eco-system function. This potential stems from both their abilityto multiply very rapidly and also their diversity. Arguablymore than half of biodiversity consists of species that areparasitic on more conspicuous free-living species (Dobsonet al. 1992). In the last 20 years, studies demonstrating howpathogens modify and regulate free-living hosts have com-pletely modified our understanding of the role that parasitesplay in natural and human-modified systems (Dobson andHudson 1986; Dobson and Crawley 1994; Grenfell andDobson 1995). Examples from a range of ecosystems and avariety of key processes are reviewed in this section.
Jim Porter and his colleagues have been intensely moni-toring the coral communities of the Florida Keys since theearly 1990s. The work uses regular digital photographiccensuses along fixed transects throughout the Keys, allow-ing detailed analysis of the growth and structure of the coralcommunity. In the late 1990s the scientists noted dramaticchanges in the structure of the coral community at sometransects. The dominant structural species, Elkhorn coral,was first infected with a new disease syndrome, white pox
PAGE 211
disease (the most severely affected Elkhorn species was Acro-pora cervicornis). This infection affected several Elkhorn coralwhile also rapidly spreading to other coral species (Pattersonet al. 2002). Within a few months, once-vibrant coral reefswere reduced to bare rock. The work provides a vivid ex-ample of how quickly a pathogen can modify and destroythe structure of a complex community. More disconcertin-gly, it is but one of an increasing number of examples thatsuggest pathogen outbreaks are increasing in the oceans(Harvell et al. 1999).
The Florida Keys example echoes a dramatic terrestrialexample that occurred almost a century earlier, when rin-derpest virus was accidentally introduced into sub-SaharanAfrica. Rinderpest virus causes high fatality rates in thehoofed mammals it infects (cattle, wildebeest, and buffalo),is a member of the Morbillivirus family, and is a recent an-cestor of human measles. It took 10 years for rinderpest tospread from the Horn of Africa to the Cape. The pandemicit caused reduced the abundance of susceptible species byup to 90% in many areas (Spinage 1962; Plowright 1982).
The huge reduction in the abundance of herbivores hadimpacts that spread throughout the ecosystems of sub-Saharan Africa (Prins and Weyerhaeuser 1987; McNaughton1992). Fire frequency increased as uneaten grasses accumu-lated and ignited during lightning storms in the dry season.This combined with a reduction in browsers to allow mi-ombo bush to spread across areas that were previously grasssavannas. The absence of prey caused a decline in the abun-dance of lions, although other carnivores, such as cheetahsand hunting dogs, may have increased as habitats appearedthat were better suited to their hunting methods. More in-sidiously, the absence of buffalo, wildebeest, and cattlecaused tsetse flies to increase their feeding rates on humans,which led to a significant epidemic of sleeping sickness(Simon 1962).
The development of a vaccine for rinderpest in the late1950s allowed a reversal of many of these trends (Plowright1982; Dobson and Crawley 1994). Although only cattlehave been vaccinated, their role as reservoir hosts is sharplyillustrated by the speed at which the pathogen disappearedfrom wildlife. This in turn led to a reversal of the balancebetween grassland and miombo bushland and to a signifi-cant increase of, first, herbivores and then the carnivoresthat feed upon them.
In a third example, the fungal disease amphibian chy-tridiomycosis and other pathogens are implicated in am-phibian population declines worldwide (Daszak et al. 2003).Chytridiomycosis appears to be locally increasing in impactor moving into new regions. In common with manyemerging infectious diseases of humans, domestic animals,and other wildlife species, the emergence of chytridio-mycosis may be driven by anthropogenic introduction.Emerging infectious diseases are linked to anthropogenicenvironmental changes that foster increased transmissionwithin or between hosts.
These three examples illustrate how the introduction ofa novel pathogen has caused ecosystem-wide changes inspecies abundance. If pathogens were considered as key-stone species, they would plainly provide some of the most
................. 11411$ $CH7 10-27-05 08:43:23 PS

212 Ecosystems and Human Well-being: Scenarios
dramatic examples of individual species that cause dramaticchanges in the abundance of all others in the ecosystem(Burdon 1991; Power et al. 1996). As ecologists focus moreattention on the role of parasites in natural systems, moreexamples will be found where highly specific pathogenshave significantly affected a single species in a communityand caused cascading effects on other species that use theinfected species as a resource (Dobson and Hudson 1986;Dobson and Crawley 1994). Nevertheless, this emphasis ondramatic examples of ecosystem change should not distractattention from the fundamental role that endemic parasitesplay in driving natural processes.
7.4 Examples of Interactions among Drivers andEcosystemsChanges in ecosystem services are almost always caused bymultiple, interacting drivers. Changes are driven by combi-nations of drivers that work over time (such as populationand income growth interacting with technological advancesthat lead to climate change), over level of organization (suchas local zoning laws versus international environmentaltreaties), and that happen intermittently (such as droughts,wars, and economic crises).
Changes in ecosystem services feed back to the driversof changes. For example, they create new opportunities andconstraints on land use, induce institutional changes in re-sponse to perceived and anticipated resource degradation,and give rise to social effects such as changes in incomeinequality (as there are winners and losers in environmentalchange). Reviews of case studies of deforestation and de-sertification (Geist and Lambin 2002, 2004) reveal that themost common type of interaction is synergetic factor com-binations—combined effects of multiple drivers that areamplified by reciprocal action and feedbacks.
Drivers interact across spatial, temporal, and organiza-tional scales. Global trends like climate change or globaliza-tion can influence regional contexts of local ecosystemmanagement. Research on the combined effects of thesetwo major global trends on the local farmers, other agents,and finally on ecosystems is sparse but growing. For exam-ple, a study in South Africa found that changes in exportprices of cash crops can trigger land use changes on the locallevel and that removal of national credits and subsidies canmake some farmers more vulnerable to environmentalchanges while others profit from easier access to marketsand are less vulnerable to climate change (Leichenko andO’Brien 2002).
Any specific ecosystem change is driven by a network ofinteractions among individual drivers. Though some of theelements of these networks are global, the actual set of in-teractions that brings about an ecosystem change is more orless specific to a particular place. For example, a link be-tween increasing producer prices and the extension of pro-duction can be found in many places throughout the world.The strength of this effect, however, is determined by arange of location-specific factors including production con-ditions, the availability of resources and knowledge, and the
PAGE 212
economic situation of the farmer (Jones 2002). No singleconceptual framework exists that captures the broad rangeof case study evidence (Lambin et al. 2001).
To generalize, simplifications are needed, but these sim-plifications are often sufficient to explain general trends inecosystem change. There exists a broad range of scientificschools of generalizing simplifications, each one enteringthe arena from a different perspective and thus adding dif-ferent pieces to the broadening knowledge base on causesfor ecosystem change. Many of these approaches emergefrom disciplinary perspectives, such as spatial (agro-)eco-nomic models of land use change (Alcamo et al. 1998; Nel-son and Geoghegan 2002). Others use generalizing schemeson a highly aggregated basis like the IPAT approach, whereenvironmental impact is seen as the product of population,affluence, and technology (Ehrlich and Holden 1971; Ehr-lich and Daily 1993; Waggoner and Asubel 2002). Othersanalyze case studies in order to identify common threadsand processes (Scherr 1997; Geist and Lambin 2002), some-times attempting to identify trajectories of environmentalcriticality (Kasperson et al. 1995) or to formulate qualitativemodels (Petschel-Held et al. 1999; Petschel-Held and Mat-thias 2001).
Based on the findings of the Multiscale Assessments ofthe MA and recent literature, examples of causal complexesfor ecosystem change can be given. This section reflects onsome of these patterns, organized along major direct drivers.
7.4.1 Land Use Change
Ten years of research within the international program onland use and land cover change of IGPB concluded thatneither population nor poverty alone constituted the soleand major underlying causes of land cover change world-wide. (See Figure 7.22 in Appendix A.) Rather, responsesto economic opportunities, mediated by institutional fac-tors, drive land cover changes. Opportunities and con-straints for new land uses are created by local as well asnational markets and policies. Global forces become themain determinants of land use change, as they amplify orattenuate local factors (Lambin et al. 2001).
7.4.1.1 Tropical Deforestation
Case study reviews (Geist and Lambin 2002) as well asfindings within the MA’s alternatives to slash-and-burncrosscutting Sub-global Assessment reveal regional patternsfor tropical deforestation. In all regions of the humid trop-ics—Latin America, Southeast Asia, and Central Africa—deforestation is primarily the result of a combination ofcommercial wood extraction, permanent cultivation, live-stock development, and the extension of overland transportinfrastructure.
However, many regional variations on this general pat-tern are found. Deforestation driven by swidden agricultureis more widespread in upland and foothill zones of South-east Asia than in other regions. Road construction by thestate followed by colonizing migrant settlers, who in turnpractice slash-and-burn agriculture, is most frequent in low-land areas of Latin America, especially in the Amazon Basin.
................. 11411$ $CH7 10-27-05 08:43:24 PS

213Drivers of Change in Ecosystem Condition and Services
Pasture creation for cattle ranching is causing deforestationalmost exclusively in the humid lowland regions of main-land South America. The spontaneous expansion of small-holder agriculture and fuelwood extraction for domesticuses are important causes of deforestation in Africa. Theseregional differences mostly come from varying mixes ofeconomic, institutional, technological, cultural, and demo-graphic factors underlying the direct causes of deforestation.
7.4.1.2 Agricultural Intensification
Agricultural intensification is usually defined as substantialuse of purchased inputs, especially fertilizer, in combinationwith new plant varieties that respond well to the increasedinputs. Globally, intensification has been a major contribu-tor to the doubling of food production over the last 40 years(MA Current State and Trends, Chapter 8). In higher-incomecountries, this increase was primarily achieved via intensi-fication. In lower-income countries, 71% of the increase incrop production came from yield growth; the remaining29% from area expansion (Bruinsma 2003). These successesare tempered by concerns about whether they can be main-tained in current locations and about the consequences ofthe driving forces in regions where intensification has notyet occurred.
Lambin et al. (2001) identify three major pathwaystoward agricultural intensification that are supported by anumber of sub-global assessments:• Land scarcity in economies weakly integrated into the
world markets can be caused by interactions amongpopulation growth and institutional changes, such as im-plementation of legal property rights (Ostrom et al.1999). For example, the Western Ghat sub-global assess-ment reports about land reform acts in this respect, bygrowth in population and its density, where it is oftenrelated to land division (Kates and Haarmann 1992). Insome instances land scarcity can contribute to deforesta-tion (see the MA sub-global assessments on the Darjee-ling Region in India and on Papua New Guinea).
• Market integration (called commodification by Lambinet al. 2001) is brought about by interactions among gen-eral infrastructure development (such as road buildingprojects and creation of a national food safety inspectionservice), changes in macroeconomic policies, and tech-nological change. For an individual farmer, it can meanchanges in input prices and availability and changes insales opportunities and prices. Economic specialization,wage labor, contract farming, and other adjustmentsfollow.
• Region-specific interventions, in the form of state-,donor-, or NGO-sponsored projects, are done to fosterdevelopment through commercial agriculture. Many ofthese projects are planned and managed from afar, creat-ing the potential for inefficient management and inade-quate attention to specific local constraints. Theseprojects are also vulnerable to changes in government ordonor policy and to public-sector financial constraints(Altieri 1999). The Sinai sub-global assessment (Egypt)demonstrates this possibility. Agricultural developmentprojects are designed to attract as many as 6 million peo-
PAGE 213
ple to the Sinai region in order to relieve populationpressure from the Nile valley.
7.4.1.3 Urban Growth and Urbanization
Though only about 2% of Earth’s land surface is covered bybuilt-up area (Grubler 1994), the effect of urban systems onecosystems extends well beyond urban boundaries. Threeprocesses of urban change appear to be of relevance for eco-system change: the growth of urban population (urbaniza-tion), the growth of built-up area (urban growth), and thespreading of urban functions into the urban hinterland con-nected with a decrease in the urban-rural gradient in popu-lation density, land prices, and so on (urban sprawl). Eachof these processes has its own pathways in which it affectsecosystems and human well-being:• Urbanization: In developing countries, urban adminis-
tration often is not capable of developing needed infra-structure as fast as urban populations grow (Kropp et al.2001). Insufficient housing conditions, a lack of access tosafe water and sanitation, and major health effects follow.Rural-urban migration is an important source of urban-ization in developing countries. This arises when oppor-tunities for gainful employment in agriculture cannotkeep up with growth in the rural workforce and whenurban areas provide the potential of gainful employ-ment. Degradation of rural environments can contributeto the pressure. There is, however, also a reverse effect,with remittances possibly allowing the use of culturalpractices that reduce pressure on rural ecosystems.
• Urban growth and sprawl: In industrial countries, urbangrowth and in particular urban sprawl play a much moresignificant role: landscapes become fragmented, trafficand energy use increase, and land sealing can changeflood regimes. The latter has been observed in the sub-global assessment of the Kristianstad Vattenrike in Swe-den as a major driving process of ecosystem change.
7.4.2 Tourism
Several of the sub-global assessments report the importanceof tourism, both as a driver of ecosystem change and as apotential response option for income generation and reduc-tion of pressure on ecosystems (e.g., the Southern African,Portugal, Caribbean, Trinidad Northern Range, and CostaRica assessments).
The Southern African Sub-global Assessment provides agood example of how biodiversity serves as an importantbasis for income generation, thus representing a major assetof a region or community (Biggs et al. 2004). In many areasin Southern Africa, nature-based tourism represents a majorsource of income, contributing about 9% of GDP in theSouthern Africa Development Community region. Thoughno quantitative estimates on faunal biodiversity exist for theregion, it is evident that animal biodiversity is one of themost important motives for tourists. Also, nature-basedtourism, together with hunting, contributes to the privati-zation of the nature conservation efforts in the region, as inprivate nature parks. This privatization represents an impor-tant pillar in the overall conservation efforts in the region.
................. 11411$ $CH7 10-27-05 08:43:25 PS

214 Ecosystems and Human Well-being: Scenarios
From an integrated point of view—that is, by consideringthe region as a whole—tourism appears to be more a driverfor ecosystem conservation than for change.
In contrast, the Caribbean Sea Sub-global Assessmentshows the other side of tourism—its negative effects onecosystems and finally on human well-being. Tourism isseen as an indirect and endogenous driver, which togetherwith exogenous drivers acts synergistically on coastal andmarine ecosystems in the region. One major exogenousdriver in the Caribbean is climate change, with a potentialincrease in intensity and frequency of tropical cyclones. Theevidence of effects of climate change in the recent past ismixed, but it is widely seen as a threat for the future. Otherexogenous drivers described by the sub-global assessmentinclude increased river discharge of the Amazon and theintroduction of alien bacterial species carried by dust blownfrom the Sahara. Both bring about changes to marine andcoastal ecosystems.
The exogenous drivers in the Caribbean are believed tolower the resilience of the coastal ecosystem to perturba-tions from infrastructure development along the coast fortourism. These interactions are especially important, astourism constitutes the single most important incomesource for many of the Caribbean states (98% of GDP inBarbados, for instance). This decrease in resilience increasesthe likelihood of major damage by tropical storms, with adirect impact on human well-being.
7.5 Concluding RemarksThis chapter has presented an overview of the importantdrivers of ecosystem change at the global level, with occa-sional forays into regional effects. It has also sketched out afew of the important links between direct and indirect driv-ers and the consequences for ecosystems. Readers interestedin how these interactions might play out in the future areadvised to proceed to later chapters in this volume. Readersinterested in more details about how drivers affect individ-ual ecosystems or services should turn to the Current Stateand Trends volume and its chapters on ecosystems and ser-vices. Finally, for a review of the plethora of options forhuman response to undesirable changes, readers are directedto the Policy Responses volume.
Notes1. This section borrows heavily from Nakicenovic 2000, Section 3.3.2.2. This section borrows heavily from Nakicenovic 2000.3. This section borrows heavily from Convention on Biological Diversity
2003.4. This section borrows extensively from Nakicenovic 2000.
ReferencesAchard, F., H.D. Eva, and H.J. Stibbig, 2002: Determination of deforestation
rates of the world’s humid tropical forests. Science, 297, 999–1002.Ajzen, I., 1991: The Theory of Planned Behavior. Organizational Behavior and
Human Decision Processes, 50, 172–211.Ajzen, I. and M. Fishbein, 1980: Understanding Attitudes and Predicting Behavior.
Prentice-Hall, Englewood Cliffs, New Jersey.Alcamo, J., E. Kreileman, M. Krol, R. Leemans, J. Bollen, J.v. Minnen, M.
Schaefer, S. Toet, and B. deVries, 1998: Global modelling of environmentchange: an overview of IMAGE2.1. In: Global Change Scenarios of the 21st
PAGE 214
Century—Results from the IMAGE2.1 Model, J. Alcamo, R. Leemans, and E.Kreileman (eds.)Oxford.
Alder, J. and R.U. Sumaila, 2004: West Africa: fish basket of Europe past andpresent. Journal of Environment and Development.
Alpert, P., E. Bone, and Holzapfel, 2000: Invasiveness, invasibility and the roleof environmental stress in the spread of non-native plants. Perspectives in PlantEcology, Evolution and Systematics, 31, 52–66.
Alston, J.M., G.W. Norton, and P.G. Pardey, 1995: Science under Scarcity: Princi-ples and Practices for Agricultural Research Evaluation and Priority Setting. CornellUniversity Press, Ithaca.
Altieri, M.A., 1999: The ecological role of biodiversity in agroecosystems. Agri-culture, Ecosystems and Environment, 74, 19–31.
Anderson, K. and Y. Hayami, 1986: The Political Economy of Agricultural Protec-tion: East Asia in International Perspective. Allen and Unwin, Boston, Londonand Sydney.
Ansuategi, A., E. Barbier, and C. Perrings, 1997: The Environmental KuznetsCurve. Amsterdam, USF Workshop on Economic Modelling of SustainableDevelopment: Between Theory and Practice, Tinbergen Institute.
Arrow, K., B. Bolin, R. Costanza, P. Dasgupta, and G.C. Daily, 1995: Eco-nomic growth, carrying capacity, and the environment. Science, 268, 520–521.
Arrow, K., P. Dasgupta, L. Goulder, G. Daily, P. Ehrlich, G. Heal, S. Levin,K.-G. Maler, S. Schneider, D. Starrett, and B. Walker, 2004: Are We Con-suming Too Much? Journal of Economic Perspectives, 18(3), 147–172.
Barro, R.J., 1997: Determinants of Economic Growth. The MIT Press, Cambridge.Barro, R.J. and X. Sala-i-Martin, 2004: Economic Growth. 2 ed. MIT Press,
New York, 654 pp.Baumol, W.J., 1993: Social Wants and Dismal Science: the Curious Case of the
Climbing Costs of Health and Teaching. WP-64–93, Fondazione Enrico Mattei,Milan.
Beck, U., 1992: Risk Society: Toward a New Modernity. Sage Publications,London.
Becker, G., 1960: An Economic Analysis of Fertility. Demographic and EconomicChange in Developed Countries, Universities-National Bureau Conference Series, 11(Princeton: Princeton University Press).
Becker, G.S. and H.G. Lewis, 1973: On the Interaction Between Quantity andQuality of Children. Journal of Political Economy, 82, 279–88.
Becker, G.S. and R. Barro, 1988: A Reformulation of the Economic Theoryof Fertility. Quarterly Journal of Economics, 103, 1–25.
Beierle, T.C. and J. Cayford, 2002: Democracy in Practice: Public Participation inEnvironmental Decisions. Resources for the Future, Washington, D.C.
Bekunda, M. and G. Manzi, 2003: Use of the partial nutrient budget as anindicator of nutrient depletion in the highlands of southwestern Uganda. Nu-trient Cycling in Agroecosystems, 67, 187–195.
Bennett, E.M., S.R. Carpenter, and N.F. Caraco, 2001: Human Impact onErodable Phosphorus and Eutrophication: A Global Perspective. BioScience,51(3), 227–234.
Bennett, E.M., T. Reed-Andersen, J.N. Houser, J.G. Gabriel, and S.R. Car-penter, 1999: A phosphorus budget for the Lake Mendota watershed. Ecosys-tems, 2, 69–75.
Bennett, M.K., 1941: Wheat in National Diets. Wheat Studies, 18(2), 37–76.Berhe, A.A., 2000: Landmines and Land Degradation: A Regional Political Ecology
Perspective on the Impacts of Landmines on Environment and Development in theDeveloping World. Department of Resource Development, Michigan State Univer-sity, East Lansing, Michigan, 157 pp.
Berhe, A.A., In Press: The Impact of Erosion on the Terrestrial Carbon Reser-voir: Ecological and Socioeconomic Implications of Soil Erosion in Eritrea.In: Proceedings of the International Conference Commemorating the 10th Anniversaryof the Independence of Eritrea: Lessons and Prospects. July 22–26, 2001, Asmara,Eritrea.
Berry, P.M., E.A. Stockdale, R. Sylvester-Bradley, L. Philipps, K.A. Smith, E.I.Lord, C.A. Watson, and S. Fortune, 2003: N, P and K budgets for croprotations on nine organic farms in the UK. Soil Use and Management, 19,112–118.
Biggs, R., E. Bohensky, P.V. Desanker, C. Fabricius, T. Lynam, A.A. Misselh-orn, C. Musvoto, M. Mutale, B. Reyers, R.J. Scholes, S. Shikongo, and A.S.van Jaarsveld, 2004: Nature Supporting People. The Southern African MillenniumEcosystem Assessment. Integrated Report. SIBN-0–7988–5528–2, Council forScientific and Industrial Research, Pretoria.
Binswanger, H.P., 1980: Income distribution effects of technical change: Someanalytical issues. South East Asian Economic Review, 1(3), 179–218.
Bodansky, D., 2003: Illegal Regulation of the Effects of Military Activity on theEnvironment. In: BERICHTE des Umweltbundesamtes. 5/03, Erich SchmidtVerlag, Berlin.
................. 11411$ $CH7 10-27-05 08:43:27 PS

215Drivers of Change in Ecosystem Condition and Services
Bongaarts, J., 1994: Population Policy Options in the Developing World. Sci-ence, 263, 771–76.
Bongaarts, J., 1997: The Role of Family Planning Programmes in Contempo-rary Fertility Transitions. In: The Continuing Demographic Transition, G.W.Jones, R.M. Douglas, J.C. Caldwell, and R.M. D’Souza (eds.), ClarendonPress., Oxford, England, 422–43.
Bongaarts, J., 1999: Fertility Decline in the Developed World: Where Will ItEnd? American Economic Review, 89(2), 256–260.
Bongaarts, J. and S.C. Watkins, 1996: Social Interactions and ContemporaryFertility Transitions. Population and Development Review, 22(4), 639–82.
Bongaarts, J. and G. Feeney, 1998: On the Quantum and Tempo of Fertility.Population and Development Review, 24(2), 271–291.
Bouwman, A.F., L.J.M. Boumans, and N.H. Batjes, 2002: Emissions of N2Oand NO from fertilized fields: Summary of available measurement data.Global Biogeochemical Cycles, 16(4), art-1058.
Brechin, S., 1999: Objective problems, subjective values, and global environ-mentalism: Evaluating the postmaterialist argument and challenging a newexplanation. Social Science Quarterly, 80(4), 783–809.
Brechin, S.R. and W. Kempton, 1994: Global Environmentalism: A Challengeto the Postmaterialism Thesis? Social Science Quarterly, 75, 245–269.
Brechin, S.R. and W. Kempton, 1997: Beyond Postmaterialist Values: Nationalversus Individual Explanations of Global Environmentalism. Social ScienceQuarterly, 78, 16–20.
Bruinsma, J.E., 2003: World Agriculture: Towards 2015/2030. Earthscan, Lon-don, UK.
Buckley, R., 2001: Environmental Impacts. In: The Encyclopedia of Ecotourism,D.B. Weaver (ed.), CABI Publishing, Oxon, 193–204.
Buckley, R.C., 1998: Tourism in wilderness: M&M Toolkit. In: Personal, Soci-etal, and Ecological Values of Wilderness: Sixth World Wilderness Congress Proceed-ings on Research, Management, and Allocation, A.E. Watson, G.H. Aplet, andJ.C. Hendee (eds.). 1, Rocky Mountain Research Station, USFS, 115–116.
Bumpass, L., 1990: What’s Happening to the Family? Interactions BetweenDemographic and Institutional Change. Demography, 27(4), 483–98.
Burdon, J.J., 1991: Fungal pathogens as selective forces in plant-populationsand communities. Australian Journal of Ecology, 16, 423–432.
Buttel, F.H., 2003: Environmental Sociology and the Explanation of Environ-mental Reform. Organization and Environment, 16, 306–344.
Byerlee, D. and E. Hesse de Polanco, 1986: Farmers’ stepwise adoption oftechnological packages: Evidence from the Mexican Altiplano. American Jour-nal of Agricultural Economics, 68(3), 519–527.
Byerlee, D. and P. Moya, 1993: Impacts of International Wheat Breeding Researchin the Developing World, 1966–1990. International Maize and Wheat Im-provement Center (CIMMYT), Mexico, D.F.
Caldwell, J.C., 1982: Theory of Fertility Decline. Academic Press, London, En-gland.
Carpenter, S.R., N.F. Caraco, D.L. Correll, R.W. Howarth, A.N. Sharpley,and V.H. Smith, 1998: Nonpoint pollution of surface waters with nitrogenand phosphorus. Issues in Ecology.
Cassman, K.G. and P.L. Pingali, 1995: Intensification of irrigated rice systems:Learning from the past to meet future challenges. GeoJournal, 35, 299–305.
Cassman, K.G., A. Dobermann, and D.T. Walters, 2002: Agroecosystems,nitrogen-use efficiency, and nitrogen management. Ambio, 31(2), 132–140.
Cassman, K.G., A. Dobermann, D.T. Walters, and H.S. Yang, 2003: Meetingcereal demand while protecting natural resources and improving environ-mental quality. Annual Review of Environment and Resources, 28, 315–358.
Castells, M., 1996: The Rise of the Network Society. Vol. 1, The Information Age,Blackwell, Oxford.
Cater, C. and E. Cater, 2001: Marine Environments. In: The Encyclopedia ofEcotourism, D.B. Weaver (ed.), CABI Publishing, Oxon, 193–204.
Chenery, H., S. Robinson, and M. Syrquin (eds.), 1986: Industrialization andGrowth: A Comparative Study. Oxford University Press, Oxford.
Christianson, V., 1998: Fishery-induced changes in a marine ecosystem: insightfrom models of the Gulf of Thailand. Journal of Fish Biology, 53, 128–142.
Christianson, V., V. Guenette, S., J.J. Heymans, C.J. Walters, R. Watson, D.Zeller, and D. Pauly, 2003: Hundred-year decline of North Atlantic preda-tory fishes. Fish and Fisheries, 4, 1–24.
Cleland, J. and C. Wilson, 1987: Demand Theories of the Fertility Transition:An Iconoclastic View. Population Studies, 41(1), 5–30.
Cohen, B., 1998a: The Emerging Fertility Transition in Sub-Saharan Africa.World Development, 26(8), 1431–61.
Cohen, J.E., 1995: How Many People Can the Earth Support. W.W. Norton &Co., New York, 532.
Cohen, J.E., 1998b: Should Population Projections Consider ’Limiting Fac-tors’—and If So, How? In: Frontiers of Population Forecasting, Supplement to
PAGE 215
Population and Development Review, W. Lutz, J.W. Vaupel, and D.A. Ahlburg(eds.). 24, 118–38.
Cohen, J.E., 2003: Human population: The next half century. Science, 302,1172–1175.
Collings, A., 1999: Tourism Development and Natural Capital. Annals of Tour-ism Research, 26(1), 98–109.
Congleton, R.D. (ed.), 1996: The Political Economy of Environmental Protection:Analysis and Evidence. University of Michigan Press, Ann Arbor.
Convention on Biological Diversity, 2003: Biological Diversity and TourismIntroduction. Cited December 8 2003. Available at http://www.biodiv.org/programmes/socio-eco/tourism/.
Cramer, J.C., 1997: A Demographic Perspective on Air Quality: ConceptualIssues Surrounding Environmental Impacts of Population Growth. HumanEcology Review, 3, 191–196.
Cramer, J.C., 1998: Population Growth and Air Quality in California. Demog-raphy, 35, 45–56.
Crawley, M.J., 1986: The population biology of invaders. Philosophical Transac-tions of the Royal Society of London B, 314, 711–731.
Crawley, M.J., 1989: Invaders. Plants Today, 1, 152–158.Crawley, M.J. and R.M. May, 1987: Population dynamics and plant commu-
nity structure: competition between annuals and perennial. Journal of Theoreti-cal Biology, 125, 475–489.
Dahl, R.A. and E.R. Tufte, 1973: Size and Democracy. Stanford University Press,Stanford, California.
Daily, G.C. and P.R. Ehrlich, 1996: Global change and human susceptibility todisease. Annual Review of Energy and the Environment, 21, 125–144.
Daily, G.C. and P.R. Ehrlich, 1997: Population diversity: its extent and extinc-tion. Science, 278, 689–692.
Daly, H.E., 1991: Steady-State Economics. 2 ed. Island Press, Washington.Dasgupta, P., K.-G. Maler, and T, 1997: The Resource Basis of Production
and Consumption: An Economic Analysis. In: The Environment And EmergingDevelopment Issues, P. Dasgupta and K.-G. Maler (eds.). 1.
Daszak, P., A.A. Cunningham, and A.D. Hyatt, 2003: Infectious disease andamphibian population declines. Diversity and Distributions, 9, 141–150.
David, C. and K. Otsuka (eds.), 1994: Modern Rice Technology and Income Distri-bution in Asia. Lynne Rienner, Boulder.
David, P.A., 1990: The dynamo and the computer: A historical perspective onthe modern productivity paradox. American Economic Review, 80(2), 355- 361.
De Bruyn, S.M. and J.B. Opschoor, 1994: Is the Economy Ecologizing? De-or Re-linking Economic Development with Environmental Pressure. TRACE DiscussionPaper TI-94–65, Tinbergen Institute, Amsterdam.
De Bruyn, S.M., J. van den Bergh, and J.B. Opschoor, 1995: Empirical Investiga-tions in Environmental-Economic Relationships: Reconsidering the Empirical Basis ofEnvironmental Kuznets Curves and the De-linking of Pollution from EconomicGrowth. TRACE Discussion Paper TI-95–140, Tinbergen Institute, Am-sterdam.
de Moor, A., 2002: The perversity of government subsidies for energy andwater. In: Greening The Budget: Budgetary Policies for Environmental Improvement,J.P. Clinch, K. Schlegelmilch, R.-U. Sprenger, and U. Triebswetter (eds.),Edward Elgar, 368.
de Vries, B. and J. Goudsblom (eds.), 2002: Mappae Mundi: Humans and theirHabitats in a Long-term Socio-ecological Perspective. Amsterdam University Press,Amsterdam.
de Vries, H.J.M., M.A. Janssen, and A. Beusen, 1999: Perspectives on GlobalEnergy Futures—Simulations with the TIME Model. Energy Policy, 27, 477–494.
de Vries, H.J.M., J.G.J. Olivier, R.A. van den Wijngaart, G.J.J. Kreileman,and A.M.C. Toet, 1994: Model for calculating regional energy use, industrialproduction and greenhouse gas emissions for evaluating global climate sce-narios. Water, Air and Soil Pollution, 76, 79–131.
DeFries, R., R.A. Houghton, and H. M., 2002: Carbon emissions from tropi-cal deforestation and regrowth based on satellite observations from 1980s and90s. Proceedings of the National Academy of Sciences, USA, 99, 14256–14261.
Delgado, C.L., J. Hopkins, and V.A. Kelly, 1998: Agricultural Growth Linkagesin Sub-Saharan Africa. IFPRI Research Report 107, International Food PolicyResearch Institute (IFPRI), Washington, D.C.
Demeny, P., 1997: Replacement-Level Fertility: The Implausible Endpoint ofthe Demographic Transition. In: The Continuing Demographic Transition, G.W.Jones, R.M. Douglas, J.C. Caldwell, and R.M. D’Souza (eds.), ClarendonPress, Oxford, 94–110.
Dietz, T., 1996/1997: The Human Ecology of Population and Environment:From Utopia to Topia. Human Ecology Review, 3, 168–171.
Dietz, T. and P.C. Stern, 1998: Science, values and biodiversity. BioScience, 48,441–444.
................. 11411$ $CH7 10-27-05 08:43:28 PS

216 Ecosystems and Human Well-being: Scenarios
Dietz, T. and P.C. Stern (eds.), 2002: New Tools for Environmental Protection:Education, Information and Voluntary Measures. National Academy Press, Wash-ington, DC, 356 pp.
Dietz, T., E. Ostrom, and P.C. Stern, 2003: The Struggle to Govern the Com-mons. Science, 301, 1907–1912.
Dillon, P.J. and F.H. Rigler, 1974: The phosphorus-chlorophyll relationship inlakes. Limnology and Oceanography, 19(5), 767–772.
Dobermann, A. and K.G. Cassman, 2002: Plant nutrient management for en-hanced productivity in intensive grain production systems of the UnitedStates and Asia. Plant and Soil, 247, 153–175.
Dobermann, A., K.G. Cassman, C.P. Mamaril, and J.E. Sheehy, 1998: Man-agement of phosphorus, potassium and sulfur in intensive, irrigated lowlandrice. Field Crops Research, 56, 113–138.
Dobermann, A., C. Witt, D. Dawe, G.C. Gines, R. Nagarajan, S. Satawatha-nanont, T.T. Son, P.S. Tan, G.H. Wang, N.V. Chien, V.T.K. Thoa, C.V.Phung, P. Stalin, P. Muthukrishnan, V. Ravi, M. Babu, S. Chatuporn, M.Kongchum, Q. Sun, R.S. Fu, G.C., and M.A.A. Adviento, 2002: Site-spe-cific nutrient management for intensive rice cropping systems in Asia. FieldCrops Research, 74, 37–66.
Dobson, A.P. and P.J. Hudson, 1986: Parasites, disease and the structure ofecological communities. Trends in Ecology and Evolution, 1, 11–15.
Dobson, A.P. and M.J. Crawley, 1994: Pathogens and the structure of plantcommunities. Trends in Ecology and Evolution, 9, 393–398.
Dobson, A.P., P.J. Hudson, and A.M. Lyles, 1992: Macroparasites: worms andothers. In: Natural Enemies. The Population Biology of Predators, Parasites andDiseases, M.J. Crawley (ed.), Blackwell Scientific Publications., Oxford, 329–348.
Dollar, D. and P. Collier, 2001: Globalization, Growth, and Poverty: Building anInclusive World Economy. Oxford University Press, Oxford.
Dosi, G., K. Pavitt, and L. Soete, 1990: The Economics of Technical Change andInternational Trade. Harvester Wheatsheaf, London.
Dregne, H., 2002: Land degradation in the Drylands. Arid land research andmanagement, 13, 99–132.
Dregne, H.E. and N. Chou, 1992: Global desertification and costs. In: Degrada-tion and restoration of arid lands, H.E. Dregne (ed.), Texas Tech University,Lubbock, 249–282.
Dunlap, R.E. and A.G. Mertig, 1995: Global Concern for the Environment: IsAffluence a Prerequisite? Journal of Social Issues, 51(4), 121–137.
Dunlap, R.E. and A.G. Mertig, 1997: Global Environmental Concern: AnAnomoly for Postmaterialism. Social Science Quarterly, 78, 24–29.
Dunlap, R.E., J.K. Grieneeks, and M. Rokeach, 1983: Human Values and Pro-Environmental Behavior. In: Energy and Mineral Resources: Attitudes, Valuesand Public Policy, D.W. Conn (ed.), American Association for the Advance-ment of Science, Washington, D.C., 145–168.
Dunlap, R.E., G.H.J. Gallup, and A.M. Gallup, 1993: Global EnvironmentalConcern: Results from an International Public Opinion Survey. Environment,35(November), 7–15, 33–39.
Dunlap, R.E., K.D. Van Liere, A.D. Mertig, and R.E. Jones, 2002: MeasuringEndorsement of the New Ecological Paradigm: A Revised NEP Scale. SocialScience Quarterly, 56(3), 425–442.
Dupre, A.H., 1986: Science in the Federal Government: A History of Policies andActivities. Johns Hopkins University Press, Baltimore.
Duvick, D.N. and K.G. Cassman, 1999: Post-green revolution trends in yieldpotential of temperate maize in the North-Central United States. Crop Sci-ence, 39, 1622–1630.
Easterlin, R.A., 1969: Towards a Socio-Economic Theory of Fertility. In: Fer-tility and Family Planning: A World View, S.J. Behrman, L. Corsa, and R.Freedman (eds.), University of Michigan Press, Ann Arbor, MI, 127–56.
Easterlin, R.A., 1975: An Economic Framework for Fertility Analysis. Studiesin Family Planning, 6, 54–63.
Eckberg, D.L. and T.J. Blocker, 1989: Varieties of Religious Involvement andEnvironmental Concerns: Testing the Lynn White Thesis. Journal for the Scien-tific Study of Religion, 28, 509–517.
Eckberg, D.L. and T.J. Blocker, 1996: Christianity, Environmentalism, andthe Theoretical Problem of Fundamentalism. Journal for the Scientific Study ofReligion, 35, 343–355.
Edington, J.M. and M.A. Edington, 1986: Ecology and Environmental Planning.Chapman & Hall, London.
Ehrlich, P.R. and J. Holden, 1971: Impact of Population Growth. Science, 171,1212–1217.
Ehrlich, P.R. and G.C. Daily, 1993: Population extinction and saving biodiver-sity. Ambio, 22, 64–68.
Ehrlich, P.R. and A. Ehrlich, 2004: One with Nineveh: Politics, Consumption andthe Human Future. Island Press, Washington, D.C.
PAGE 216
Ehrlich, P.R., J. Harte, M.A. Harwell, P.H. Raven, C. Sagan, and G.M.Woodwell, 1983: Long-term biological consequences of nuclear war. Science,222, 1293–1300.
El-Hinnawi, E., 1985: Environmental Refugees. United Nations EnvironmentProgramme, Nairobi.
Evenson, R.E. and D. Gollin, 2003: Assessing the impact of the green revolu-tion: 1960–2000. Science, 300, 758–762.
Falcon, W. and C. Fowler, 2002: Carving up the commons—emergence of anew international regime for germplasm development and transfer. Food Pol-icy, 27, 197–222.
Fan, S., P. Hazell, and S. Thorat, 1998: Government Spending, Growth, and Pov-erty: An Analysis of Interlinkages in Rural India. EPTD Discussion Paper 33,International Food Policy Research Institute (IFPRI). Washington, D.C.
FAO (Food and Agriculture Organization of the United Nations), 2001a: TheGlobal Forest Resources Assessment 2000 (FRA 2000): Main Report. FAO for-estry paper 140, FAO, Rome, 479 pp.
FAO, 2001b: Global Forest Fire Assessment 1990–2000. Working Paper 55, For-est Resources Assessment Programme, FAO, Rome, 495 pp.
FAO, 2002: World agriculture: towards 2015/2030. Food and Agriculture Organi-zation of the United Nations, Rome, 97 pp.
FAO, 2004: FAOSTAT. Available at www.fao.org.Fischer, F., 2000: Citizens, Experts, and the Environment: The Politics of Local
Knowledge. Duke University Press, Durham.Freeman, C. and C. Perez, 1988: Structural crises of adjustment: business cycles
and investment behaviour. In: Technical Change and Economic Theory, G.e.a.Dosi (ed.), Pinter, London, 38–66.
Frejka, T. and G. Calot, 2001: Cohort Reproductive Patterns in Low-FertilityCountries. Population and Development Review, 27(1), 103–32.
Frey, R.S. and I. Al-Mansour, 1995: The Effects of Development, Dependenceand Population Pressure on Democracy: The Cross-National Evidence. Socio-logical Spectrum, 15, 181–208.
Frost, W., 2001: Rainforests. In: The Encyclopedia of Ecotourism, D.B. Weaver(ed.), CABI Publishing, Oxon, 193–204.
Galloway, J.N. and E.B. Cowling, 2002: Reactive nitrogen and the world: 200years of change. Ambio, 31, 64–71.
Galloway, J.N., E.B. Cowling, S.P. Seitzinger, and R.H. Socolow, 2002: Re-active nitrogen: Too much of a good thing? Ambio, 31, 60–63.
Galloway, J.N., W.H. Schlesinger, H. Levy, A. Michaels, and J.L. Schnoor,1995: Nitrogen fixation: atmospheric enhancement—environmental re-sponse. Global Biochemical Cycles, 9, 235–252.
Gardner, G.T. and P.C. Stern, 1995: Environmental Problems and Human Behav-ior. Allyn and Bacon, Needham Heights, MA.
Garenne, M. and V. Joseph, 2002: The Timing of the Fertility Transition inSub-Saharan Africa. World Development, 30(10), 1835–1843.
Geist, H.J. and E.F. Lambin, 2002: Proximate causes and underlying drivingforces of tropical deforestation. BioScience, 52(2), 143–150.
Geist, H.J. and E.F. Lambin, 2004: Dynamic Causal Patterns of Desertification.BioScience, 54(9), 817–829.
Giddens, A., 1990: The Consequences of Modernity. Stanford University Press,Stanford.
Gossling, S., 2002a: Global environmental consequences of tourism. Global En-vironmental Change, 12, 283–302.
Gossling, S., 2002b: Human-Environmental relations with tourism. Annals ofTourism Research, 29(2), 539–556.
Gray, B., 1997: Landmines: The Most Toxic and Widespread Pollution FacingMankind. In: A Colloquium, Towards Ottawa and Beyond- Demining the Region,The environmental impacts. International Campaign to Ban Landmines (Australia).http://members.xoom.com/dassur/icblcol1.doc or http://wwwfn2.freenet.edmonton.ab.ca/�puppydog/bgray.htm.
Grenfell, B.T. and A.P. Dobson, 1995: Ecology of Infectious Diseases in NaturalPopulations. Cambridge University Press, Cambridge.
Grossman, G., 1995: Pollution And Growth: What Do We Know? In: TheEconomics Of Sustainable Development, I. Goldin and L.A. Winters (eds.), Cam-bridge University Press, Cambridge.
Grossman, G. and A. Krueger, 1992: Environmental Impacts of the North AmericanFree Trade Agreement. CEPR Working Paper 644, Centre for Economic Pol-icy Research, London, April.
Grubler, A., 1994: Technology. In: Changes in Land Use and Land Cover: AGlobal Perspective, W.B. Meyer and B.L. Turner II (eds.), Cambridge Univer-sity Press, Cambridge, 287–328.
Grubler, A., 1998: Technology and Global Change. Cambridge University Press,Cambridge.
Guagnano, G.A., P.C. Stern, and T. Dietz, 1995: Influences on attitude-behav-ior relationships: A natural experiment with curbside recycling. Environmentand Behavior, 27, 699–718.
................. 11411$ $CH7 10-27-05 08:43:29 PS
217Drivers of Change in Ecosystem Condition and Services
Halpenny, E.E., 2001: Islands and Coasts. In: The Encyclopedia of Ecotourism,D.B. Weaver (ed.), CABI Publishing, Oxon, 193–204.
Hanada, A., 2003: ‘‘Culture and Environmental Values: A Comparison of Japanand Germany.’’ Environmental Science and Policy, George Mason University,Fairfax, Virginia.
Harbaugh, W.T., A. Levinson, and D.M. Wilson, 2000: Re-Examining TheEmpirical Evidence For An Environmental Kuznets Curve. 7711, National Bureauof Economic Research, Cambridge, May.
Hardin, G., 1968: The Tragedy of the Commons. Science, 162, 1243–1248.Harvell, C.D., K. Kim, J.M. Burkholder, R.R. Colwell, P.R. Epstein, D.J.
Grimes, E.E. Hofmann, E.K. Lipp, A.D.M.E. Osterhaus, R.M. Overstreet,J.W. Porter, G.W. Smith, and G.R. Vasta, 1999: Emerging Marine Dis-eases—Climate Links and Anthropogenic Factors. Science, 285(3 Septem-ber), 1505–1510.
Hawkins, D.E. and K. Lamoureux, 2001: Global Growth and Magnitude ofEcotourism. In: The Encyclopedia of Ecotourism, D.B. Weaver (ed.), CABIPublishing, Oxon, 63–83.
Hayami, Y. and R.W. Herdt, 1977: Market price effects of technologicalchange on income distribution in semi-subsistence agriculture. American Jour-nal of Agricultural Economics, 59(2), 245–256.
Hayami, Y. and V.W. Ruttan, 1985: Agricultural development: an internationalperspective. Johns Hopkins University Press, Baltimore, 506 pp.
Hayami, Y., M. Kikuchi, P.F. Moya, L.M. Bambo, and E.B. Marciano, 1978:Anatomy of a Peasant Economy: A Rice Village in the Philippines. InternationalRice Research Institute (IRRI), Los Banos.
Hazell, P. and S. Haggblade, 1993: Farm-nonfarm growth linkages and thewelfare of the poor. In: Including the Poor, M.L.a.J.v.d. Gaag (ed.), The WorldBank, Washington, D.C.
Herdt, R.W., 1987: A retrospective view of technological and other changes inPhilippine rice farming, 1965–1982. Economic Development and CulturalChange, 35(2), 329–49.
Hirschman, C., 1994: Why Fertility Changes. Annual Review of Sociology, 20,203–33.
Hoelscher, D., R.F. Mueller, M. Denich, and H. Fuelster, 1996: Nutrientinput-output budget of shifting agriculture in Eastern Amazonia. Nutrient Cy-cling in Agroecosystems, 47, 49–57.
Houghton, J.T., Y. Ding, D.J. Griggs, M. Noguer, P.J. van der Linden, X. Dai,K. Maskall, and C.A. Johnson (eds.), 2001: Climate Change 2001: The Scien-tific Basis. Contribution of Working Group I to the Third Assessment Report ofthe Intergovernmental Panel on Climate Change. Cambridge University Press,Cambridge.
Huffman, W.E. and R.E. Evenson, 1993: Science for Agriculture—A Long-termPerspective. Iowa State University Press, Ames.
Hughes, J.B., G.C. Daily, and P.R. Ehrlich, 1998: The loss of population diver-sity and why it matters. In: Nature and Human Society, P.H. Raven (ed.),National Academy Press, Washington, DC.
Hugo, G., 1996: Environmental Concerns and International Migration. Interna-tional Migration Review, 30(1), 105–131.
IFA (International Fertilizer Industry Association), 2002: Fertilizer use by crop. 5ed. IFA, IFDC, IPI, PPI, FAO, Rome.
IFA, 2003: IFADATA statistics. http://www.fertilizer.org/ifa/statistics.asp. Paris.IFA, 2004: IFADATA statistics. Available at http://www.fertilizer.org/ifa/
statistics.asp.Inglehart, R., 1995: Public Support for Environmental Protection: Objective
Problems and Subjective Values in 43 Societies. PS: Political Science and Poli-tics, 15, 57–71.
International Campaign to Ban Landmines, 2002: Landmine Monitor Report2002: Toward a Mine-Free World. Human Rights Watch, New York.
International Civil Aviation Organization, 1995: Civil Aviation Statistics ofthe World, 1994. Doc. 9180/20, International Civil Aviation Organization,Montreal, Canada.
IPCC (Intergovernmental Panel on Climate Change), 2002: Climate Change2001: Synthesis Report. Cambridge University Press, Cambridge.
Ironmonger, D.S., C.K. Aitken, and B. Erbas, 1995: Economies of scale inenergy use in adult-only households. Energy Economics, 17, 301–310.
Irwin, A., 1995: Citizen Science: A Study of People, Expertise and Sustainable Devel-opment. Routledge, London.
Jacobson, J.L., 1989: Environmental Refugees: Nature’s Warning System. Po-puli, 16(1), 29–41.
Jasanoff, S., 1990: The Fifth Branch: Science Advisors as Policy Makers. HarvardUniversity Press, Cambridge.
Jeltsch, F., S.J. Milton, W.R.J. Dean, and N. van Rooyen, 1997: Analysingshrub encroachment in the southern Kalahari: a grid-based modelling ap-proach. Journal of Applied Ecology, 34, 1497–1508.
PAGE 217
Jones, S., 2002: A Framework for Understanding On-farm Environmental Deg-radation and Constraints to the Adoption of Soil Conservation Measures:Case Studies from Highland Tanzania and Thailand. World Development,30(9), 1607–1620.
Kanagy, C.L. and F.K. Willits, 1993: A ‘Greening’ of Religion? Some Evidencefrom a Pennsylvania Sample. Social Science Quarterly, 74, 674–683.
Karp, D.G., 1996: Values and Their Effects on Pro-Environmental Behavior.Environment and Behavior, 28, 111–133.
Kasemir, B., J. Jager, C. Jaeger, and M.T. Gardner (eds.), 2003: Public Participa-tion in Sustainability Science. Cambridge University Press, Cambridge.
Kasperson, J.X., R.E. Kasperson, and B.L. Turner II, 1995: Regions at Risk:Comparisons of Threatened Environments. United Nations University Press,Tokyo.
Kates, R.W. and V. Haarmann, 1992: Where people live: Are the assumptionscorrect? Environment, 34, 4–18.
Kato, N., 1996: Analysis of structure of energy consumption and dynamics ofemission of atmospheric species related to global environmental change (SOx,
NOx, CO2) in Asia. Atmospheric Environment, 30(5), 757–785.Kaufmann, D., A. Kraay, and M. Mastruzzi, 2003: Governance Matters III: Gov-
ernance Indicators for 1996–2002. World Bank Policy Research Working Paper3106, World Bank, Washington, DC.
Keeling, C.D. and T.P. Whorf, 2005: Atmospheric CO2 records from sites inthe SIO sampling network. In: A Compendium of Data on Global Change.Carbon Dioxide Information Analysis Center Oak Ridge National Labora-tory, US Department of Energy, Oak Ridge, TN. (cdiac.esd.ornl.gov/trends/coz/sio-mlo.htm).
Kempton, W., J.S. Boster, and J.A. Hartley, 1995: Environmental Values in Amer-ican Culture. The MIT Press, Cambridge, Massachusetts.
Keyfitz, N., 1982: Can Knowledge Improve Forecasts? Population and Develop-ment Review, 8(4), 729–51.
Kluckholm, C., 1952: Values and Value-Orientation in the Theory of Action:An Exploration in Definition and Classification. In: Toward a General Theoryof Action, T. Parsons and E. Shils (eds.), Harvard University Press, Cambridge,Massachusetts, 395–418.
Knodel, J. and E.V.D. Walle, 1979: Lessons from the Past: Policy Implicationsof Historical Fertility Studies. Population and Development Review, 5(2),217–45.
Kohler, H.-P., F.C. Billari, and J.A. Ortega, 2002: The Emergence of Lowest-Low Fertility in Europe During the 1990s. Population and Development Review,28(4), 641–680.
Kropp, J., K.B.L. Matthias, and F. Reusswig, 2001: Global Analysis and Distri-bution of Unbalanced Urbanization Processes: The Favela Syndrome. GAIA,10(2), 109–120.
Krug, E.G. (ed.), 2002: World Report on Violence and Health. World Health Orga-nization, Geneva, 346 pp.
Kuznets, S., 1955: Economic Growth and Income Inequality. American Eco-nomic Review, 65, 1–28.
Lambin, E.F., H. Geist, and E. Lepers, 2003: Dynamics of land-use and land-cover change in tropical regions. Annual review of environment and resources, 28.
Lambin, E.F., B.L. Turner II, H.J. Geist, S.B. Agbola, A. Angelsen, J.W.Bruce, O. Coomes, R. Dirzo, G. Fischer, C. Folke, P.S. George, K. Home-wood, J. Imbernon, R. Leemans, X. Li, E.F. Moran, M. Mortimore, P.S.Ramakrishnan, M.B. Richards, H. Skanes, W.L. Steffen, G.D. Stone, U.Svedin, T.A. Veldkamp, C. Vogel, and J. Xu, 2001: The causes of land-use and land-cover change: Moving beyond the myths. Global EnvironmentalChange, 11(4), 261–269.
Landes, D.S., 1969: The Unbound Prometheus: Technological Change and IndustrialDevelopment in Western Europe from 1750 to the Present. Cambridge UniversityPress, Cambridge.
Lantican, M.A., P.L. Pingali, and S. Rajaram, 2003: Is research on marginallands catching up? The case of unfavourable wheat growing environments.Agricultural Economics, 29(3), 353–361.
Lanz, T.J., 1996: Environmental Degradation and Social Conflict in the North-ern Highlands of Ethiopia: The Case of Tigray and Wollo Provinces. AfricaToday, 43, 157–182.
Leaning, J., 2000: Environment and health: 5. Impact of war. CMAJ, 163(9),1157–1161.
Lee, R., 2003: The demographic transition: Three centuries of fundamentalchange. Journal of Economic Perspectives, 17, 167–190.
Leichenko, R.M. and K. O’Brien, 2002: The Dynamics of Rural Vulnerabilityto Global Change: The Case of Southern Africa. Mitigation and AdaptationStrategies for Global Change, 7(1), 1–18.
Lepers, E., E.F. Lambin, A.C. Janetos, R. DeFries, F. Achard, N. Ramankutty,and R.J. Scholes, in press: A synthesis of rapid land-cover change informationfor the 1981–2000 period. BioScience.
................. 11411$ $CH7 10-27-05 08:43:30 PS

218 Ecosystems and Human Well-being: Scenarios
Lesthaeghe, R., 1983: A Century of Demographic and Cultural Change inWestern Europe: An Exploration of Underlying Dimensions. Population andDevelopment Review, 9(3), 411–35.
Lesthaeghe, R. and P. Willems, 1999: Is Low Fertility a Temporary Phenome-non in the European Union? Population and Development Review, 25(2),211–28.
Leung, B., D.M. Lodge, D. Finnoff, J.F. Shogren, M.A. Lewis, and G. Lam-berti, 2002: An ounce of prevention or a pound of cure: bioeconomic riskanalysis of invasive species. Proc R Soc Lond B Biol Sci, 269, 2407–13.
Lindberg, K., 2001: Economic Impacts. In: The Encyclopedia of Ecotourism, D.B.Weaver (ed.), CABI Publishing, Oxon, 193–204.
Liu, J., G.C. Daily, P.R. Ehrlich, and G.W. Luck, 2003: Effects of householddynamics on resource consumption and biodiversity. Nature, 421, 530–533.
Lodge, D.M., C.A. Taylor, D.M. Holdich, and J. Skurdal, 2000: Nonindige-nous crayfishes threaten North American freshwater biodiversity: lessons fromEurope. Fisheries, 25, 7–20.
Lonsdale, W.M., 1999: Global patterns of plant invasions and the concept ofinvasibility. Ecology, 80, 1522–1536.
Lubell, M., 2000: Cognitive conflict and consensus building in the NationalEstuary Program. American Behavioral Scientist, 44, 629–648.
Lutz, W. and A. Goujon, 2001: The World’s Changing Human Capital Stock:Multi-State Population Projections by Educational Attainment. Populationand Development Review, 27(2), 323–339.
Lutz, W., W. Sanderson, and S. Scherbov, 2001: The End of World PopulationGrowth. Nature, 412, 54545.
Lutz, W., B.C. O’Neill, and S. Scherbov, 2003: Europe’s population at a turn-ing point. Science, 299, 1991–1992.
Mack, R.N., D. Simberloff, W.M. Lonsdale, H. Evans, M. Clout, and F.A.Bazzaz, 2000: Biotic invasions: Causes, epidemiology, global consequences,and control. Ecological Applications, 10, 689–710.
MacKellar, F.L., W. Lutz, A.J. McMichael, and A. Suhrke, 1998: Populationand Climate Change. In: Human Choice and Climate Change, S. Rayner andE.L. Malone (eds.). 1, Battelle Press, Columbus, Ohio, 89–193.
Maddison, A., 1991: Dynamic Forces in Capitalist Development. Oxford Univer-sity Press, Oxford.
Maddison, A., 1995: Monitoring the World Economy, 1820–1992. OECD Devel-opment Centre Studies, Organisation for Economic Co-operation and De-velopment, Paris.
Maddison, A., 2003: The World Economy: Historical Statistics. OECD, Paris, 273pp.
Marco, D.E., S. Paez, and S. Cannas, 2002: Modelling species invasiveness inbiological invasions. Biological Invasions, 4, 193–201.
Marshall, M.G., T.R. Gurr, J. Wilkenfeld, M.I. Lichbach, and D. Quinn, 2003:Peace and Conflict 2003- A Global Survey of Armed Conflicts, Self-DeterminationMovements, and Democracy. Center for International Development and Con-flict Management at the University of Maryland, College Park.
Martin, P. and J. Widgren, 1996: International Migration: A Global ChallengePopulation. Population Reference Bureau, Washington, DC.
Massey, D.S., J. Arango, G. Hugo, A. Kouaouci, A. Pellegrino, and J.E. Taylor,1998: Worlds in Motion: Understanding International Migration at the Endof the Millennium. Oxford University Press, Oxford, England.
Matson, P.A., R.L. Naylor, and I. Ortiz-Monasterio, 1998: Integration of envi-ronmental, agronomic, and economic aspects of fertilizer management. Sci-ence, 280, 112–115.
McIsaac, G.F., M.B. David, G.Z. Gertner, and D.A. Goolsby, 2001: Nitrateflux in the Mississippi river. Nature, 414, 166–167.
McNaughton, S.J., 1992: The Propagation of Disturbance in SavannasThrough Food Webs. J.Veg.Sci., 3, 301–314.
Meadows, D.H., D.L. Meadows, J. Randers, and W.W. Behrens, 1972: TheLimits To Growth. Earth Island Ltd., London.
Meisnesz, A., 1999: Killer algae. University of Chicago Press, Chicago.Merchant, C., 1992: Radical Ecology: The Search for a Livable World. Routledge,
New York.Michigan Department of Environmental Quality, 2004: Aquatic Invasive
Species. Available at http://www.michigan.gov/deq/0,1607,7–135–3313_3677_8314–83004—CI,00.html.
Middleton, N. and D. Thomas, 1997: World Atlas of Desertification. 2 ed. E.Arnold, London, 182 pp.
Millward, R., 1990: Productivity in the UK services sector: Historical trends1865–1985 and comparisons with the USA 1950–85. Oxford Bulletin Eco-nomic Stat., 52(4), 423–436.
Mishima, S., 2001: Recent trend of nitrogen flow associated with agriculturalproduction in Japan. Soil Science and Plant Nutrition, 47, 157–166.
PAGE 218
Mitchell, C.E. and A.G. Power, 2003: Release of invasive plants from fungaland viral pathogens. Nature, 421, 625–627.
Mol, A.P. and D.A. Sonnenfeld (eds.), 2000: Ecological Modernisation Around theWorld. Frank Cass Publishers, London.
Moll, H.C., 1989: Aanbod van en vraag naar metalen; ontwikkelingen, implicaties enrelaties; een methodische assesment omtrent subsitutie van materialen. 9, Institute forEnergy and Environment (IVEM), University of Groningen, Groningen, theNetherlands.
Mosier, A.R., M.A. Bleken, P. Chaiwanakupt, E.C. Ellis, J.R. Freney, R.B.Howarth, P.A. Matson, K. Minami, R. Naylor, K.N. Weeks, and Z.L. Zhu,2001: Policy implications of human-accelerated nitrogen cycling. Biogeoche-mistry, 52(3), 281–320.
Munroe, D.K., J. Southworth, and C.M. Tucker, 2002: The Dynamics ofLand-Cover Change in Western Honduras: Exploring Spatial and TemporalComplexity. Agricultural Economics, 27(3).
Myers, N., 2002: Environmental Refugees: A Growing Phenomenon of the21st Century. Philosophical Transactions Of The Royal Society Of London SeriesB-Biological Sciences., 357(1420), 609–613.
Myers, N. and J. Kent, 1995: Environmental Exodus: An Emergent Crisis inthe Global Arena. Climate Institute, Washington, DC.
Nachon, C.T., 2000: Environmental Aspects of the International Crisis of Anti-personnel Landmines and the Implementation of the 1997 Mine Ban Treaty:Thematic Report. In: Landmine Monitor Report 2000.
Nakicenovic, N., A. Grubler, and A. McDonald (eds.), 1998: Global EnergyPerspectives. Cambridge University Press, Cambridge.
Nakicenovic, N., J. Alcamo, G. Davis, B.d. Vries, J. Fenhann, S. Gaffin, K.Gregory, A. Grubler, T.Y. Jung, T. Kram, E.L.L. Rovere, L. Michaelis,S. Mori, T. Morita, W. Pepper, H. Pitcher, L. Price, K. Riahi, A. Roehrl,H.-H. Rogner, A. Sankovski, M. Schlesinger, P. Shukla, S. Smith, R. Swart,S.v. Rooijen, N. Victor, and Z. Dadi, 2000: Special report on emissions scenarios:a special report of Working Group III of the Intergovernmental Panel on ClimateChange. Cambridge University Press, Cambridge, 599 pp.
National Academy of Sciences, 2001: Growing Populations, Changing Land-scapes: Studies from India, China, and the United States. National Academy Press,Washington, DC.
National Research Council, 1992: Restoration of aquatic ecosystems: science, tech-nology, and public policy. National Academy Press, Washington, D. C., USA.
National Research Council, 2000: Beyond Six Billion: Forecasting theWorld’s Population. Panel on Projections. J. Bongaarts and R.A. Bulatao(eds.), National Academy Press, Committee on Population, Commission onBehavioral and Social Sciences and Education, Washington, DC.
Nelson, G.C. (ed.), 2001: Genetically modified organisms in agriculture: economicsand politics. Academic Press, San Diego, 344 pp.
Nelson, G.C. and J. Geoghegan, 2002: Modeling deforestation and land usechange: Sparse data environments. Agricultural Economics, 27, 201–216.
Norgaard, R.B., 2004: Learning and Knowing Collectively. Ecological Econom-ics, 49(2), 231–241.
Nriagu, J.O., 1996: A history of global metal pollution. Science, 272, 223–224.O’Neill, B.C., 2005: Population scenarios based on probablistic projections: An
application for the Millennium Ecosystem Assessment. Population & Environ-ment, 26(3), 229–254.
O’Neill, B.C. and B. Chen., 2002: Demographic determinants of householdenergy use in the United States. Methods of Population-Environment Analysis, ASupplement to Population and Development Review, 28, 53–88.
O’Neill, B.C., F.L. MacKellar, W. Lutz, and L. Wexler, 2001: Population andClimate Change. Cambridge University Press, Cambridge.
OECD (Organisation for Economic Co-operation and Development), 1997:Reforming Energy and Transport Subsidies. OECD, Paris.
OECD, 1998: Eco-Efficiency. OECD, Paris.OECD, 2004: OECD Agricultural Policies 2004 At A Glance. OECD.Oenema, O., H. Kros, and W. De Vries, 2003: Approaches and uncertainties
in nutrient budgets: implications for nutrient management and environmentalpolitics. European Journal of Agronomy, 20, 3–16.
Oeppen, J. and J.W. Vaupel, 2002: Broken Limits to Life Expectancy. Science,296, 1029–1030.
Oldeman, L.R. and G.W.J. van Lynden, 1997: Revisiting the GLASOD meth-odology. In: Methods for Assessment of Soil Degradation, R. Lal, W.H. Blum,C. Valentine, and B.A. Steward (eds.), CRC Press., New York, 423–439.
Oldeman, L.R., R.T.A. Hakkeling, and W.G. Sombroek, 1991: World map ofthe status of human-induced soil degradation: an explanatory note. second revisededition, International Soil Reference and Information Centre/United Na-tions Environment Programme, Wageningen/Nairobi, October 1991, 34 pp.
Olshansky, S.J., B.A. Carnes, and C. Cassel, 1990: In Search of Methuselah:Estimating the Upper Limits to Human Longevity. Science, 250, 634–40.
................. 11411$ $CH7 10-27-05 08:43:31 PS

219Drivers of Change in Ecosystem Condition and Services
Olshansky, S.J., B.A. Carnes, and A. Desesquelles, 2001: Prospects for HumanLongevity. Science, 291, 1491–1492.
Oppenheim-Mason, K., 1997: Explaining Fertility Transitions. Demography,34(4), 443–54.
Ostrom, E., J. Burger, C.B. Field, R.B. Norgaard, and D. Policansky, 1999:Revisiting the commons: Local lessons, global challenges. Science, 284, 278–282.
Ostrom, E., T. Dietz, N. Dolsak, P.C. Stern, S. Stonich, and E. Weber (eds.),2002: The Drama of the Commons. National Academy Press, Washington, D.C.
Panayotou, T., 1993: Empirical Tests and Policy Analysis of Environmental Degrada-tion at Different Stages of Development. Working Paper 238, Technology AndEmployment Programme. International Labour Office, Geneva.
Panayotou, T., 2000: Economic Growth and the Environment. Center ForInternational Development at Harvard University. Available at http://www.cid.harvard.edu/cidwp/056.htm.
Patterson, K.L., J.W. Porter, K.B. Ritchie, S.W. Polson, E. Mueller, E.C. Pe-ters, D.L. Santavy, and G.W. Smith, 2002: The etiology of white pox, alethal disease of the Caribbean elkhorn coral, Acropora palmata. PNAS, 99,8725–8730.
Pendersen, D., 2002: Political violence, ethnic conflicts, and contemporarywars: broad implications for health and social well-being. Social Science &Medicine, 55, 175–190.
Peng, S. and K.G. Cassman, 1998: Upper thresholds of nitrogen uptake ratesand associated N fertilizer efficiencies in irrigated rice. Agronomy Journal, 90,178–185.
Petschel-Held, G. and K.B.L. Matthias, 2001: Integrating Case Studies onGlobal Change by Means of Qualitative Differential Equations. Integrated As-sessment, 2(3), 123–138.
Petschel-Held, G., A. Block, M. Cassel-Gintz, J. Kropp, M. Ludeke, O. Mol-dehauer, F. Reusswig, and H.J. Schellnhuber, 1999: Syndromes of globalchange: A qualitative modeling approach to assist global environmental man-agement. Environmental Modelling and Assessment, 4, 295–314.
Pimentel, D., 2002: Economic costs of biological invasions: Biological Invasions: Eco-nomic and Environmental Costs of Alien Plant, Animal, and Microbe Species. CRCPress.
Pimentel, D., L. Lach, R. Zuniga, and D. Morrison, 1999: Environmental andeconomic costs of nonindigenous species in the United States. Bioscience, 50,53–65.
Pingali, P. and G. Traxler, 2002: Changing locus of agricultural research: willthe poor benefit from biotechnology and privatization trends. Food Policy, 27,223–238.
Pingali, P. and Y. Khwaja, forthcoming 2004: Globalization of Indian Dietsand the Transformation of Food Supply Systems. Indian Journal of AgriculturalMarketing.
Pingali, P.L. and S. Rajaram, 1999: Global wheat research in a changing world:Options for sustaining growth in wheat productivity. In: CIMMYT 1998–99World Wheat Facts and Trends. Global Wheat Research in a Changing World:Challenges and Achievements, P.L. Pingali (ed.), CIMMYT, Mexico, D.F.
Pingali, P.L. and P.W. Heisey, 2001: Cereal-Crop Productivity in DevelopingCountries: Past Trends and Future Prospects. In: Agricultural Science Policy,J.M. Alston, P.G. Pardey, and M. Taylor (eds.), Johns Hopkins UniversityPress for IFPRI, Baltimore.
Pinstrup-Andersen, P. and P.B.R. Hazell, 1985: The impact of the Greenrevolution and prospects for the future. Food Review International, 1(1), 1–25.
Pinstrup-Andersen, P., N. Ruiz de Londono, and E. Hoover, 1976: The im-pact of increasing food supply on human nutrition: Implications for com-modity priorities in agricultural research. American Journal of AgriculturalEconomics, 58(2), 131–42.
Pionke, H.B., W. J. Gburek, A.N. Sharpley, and J.A. Zollweg., 1997: Hydro-logic and chemical controls on phosphorus loss from catchments. In: Phospho-rus loss from soil to water, Tunney (ed.), CAB International, New York.
Plowright, W., 1982: The effects of rinderpest and rinderpest control on wild-life in Africa. Symposia of the Zoological Society of London., 50, 1–28.
Postel, S., 1997: Freshwater ecosystem services. In: Nature’s Services, G. Daily(ed.), Island Press, Washington, D. C., 195–213.
Power, M.E., D. Tilman, J.A. Estes, B.A. Menge, W.J. Bond, L.S. Mills, G.C.Daily, J.C. Castilla, J. Lubchenco, and R.T. Paine, 1996: Challenges in thequest for keystones. Bioscience, 46(8), 609–620.
Pretty, J., C. Brett, D. Gee, R.E. Hine, C.F. Mason, J.I.L. Morison, H. Raven,M.D. Rayment, and G. van der Bijl, 2000: An assessment of the total externalcosts of UK agriculture. Agricultural Systems, 65, 113–136.
Princen, T. and M. Finger, 1994: Environmental NGOs in World Politics: Linkingthe Local and the Global. Routledge, London.
PAGE 219
Prins, H.H.T. and F.J. Weyerhaeuser, 1987: Epidemics in populations of wildruminants: anthrax and impala, rinderpest and buffalo in Lake Manyara Na-tional Park, Tanzania. Oikos, 49, 28–38.
Putnam, R.D., R. Leonardi, and R.Y. Nanetti, 1993: Making Traditions in Mod-ern Italy. Princeton University Press, Princeton.
Rabalais, N.N., 2002: Nitrogen in aquatic ecosystems. Ambio, 31, 102–112.Ramankutty, N. and J.A. Foley, 1998: Characterizing patterns of global land
use: An analysis of global cropland data. Global Biogeochemical Cycles, 12, 667–685.
Read, D.J., D.H. Lewis, A.H. Fitter, and I.J. Alexander (eds.), 1992: Mycorrhi-zas in ecosystems. CAB International, Wallingford, Oxon.
Redman, C.L., 1999: Human Impact on Ancient Environments. The University ofArizona Press, Tucson, AZ.
Renkow, M., 1993: Differential technology adoption and income distributionin Pakistan: Implications for research resource allocation. American Journal ofAgricultural Economics, 75(1), 33–43.
Renn, O., T. Webler, and P. Wiedemann (eds.), 1995: Fairness and Competencein Citizen Participation: Evaluating Models for Environmental Discourse. KluwerAcademic Publishers., Dordrecht.
Richardson, D.M., P. Pysek, M. Rejmanek, M.G. Barbour, F.D. Panetta, andC.J. West, 2000: Naturalization and invasion of alien plants: concepts anddefinitions. Diversity and Distribution, 6, 93–107.
Richerson, P.J., R. Boyd, and B. Paciotti, 2002: An evolutionary theory ofcommons management. In: The Drama of the Commons, E. Ostrom, T. Dietz,N. Dolsak, P.C. Stern, S. Stonich, and E. Weber (eds.), National AcademyPress, Washington, D.C., 403–442.
Riley, W.J., I. Ortiz-Monasterio, and P.A. Matson, 2003: Nitrogen leachingand soil nitrate, nitrite, and ammonium levels under irrigated wheat inNorthern Mexico. Nutrient Cycling in Agroecosystems, 61, 223–236.
Robinson, W.C., 1997: The Economic Theory of Fertility Over Three Dec-ades. Population Studies, 51(1), 63–74.
Rokeach, M., 1968: Beliefs, Attitudes and Values: A Theory of Organization andChange. Jossey-Bass, San Francisco.
Rokeach, M., 1973: The Nature of Human Values. Free Press, New York.Rosa, E.A., N. Matsuda, and R.R. Kleinhesselink, 2000: The Cognitive Archi-
tecture of Risk: Pancultural Unity or Cultural Shaping? In: Comparative RiskPerception, O. Renn and B. Rohrmann (eds.), Kluwer, Dordrecth, The Neth-erlands, 185–210.
Rotmans, J. and H.J.M. de Vries (eds.), 1997: Perspectives on Global Futures: TheTARGETS approach. Cambridge University Press, Cambridge.
Roy, R.N., R.V. Misra, and A. Montanez, 2002: Decreasing reliance on min-eral nitrogen—yet more food. Ambio, 31, 177–183.
Ruiz, G.M., P.W. Fofonoff, J.T. Carlton, J. Marjorie, and A.H. Hines, 2000:Invasion of coastal marine communities in North America: Apparent Pat-terns, Processes, and Biases. Annual Review of Ecology and Systematics, 31, 481–531.
Ruttan, V.R., 2001: Technology, Growth and Development. Oxford UniversityPress, New York.
Ryder, N.B., 1983: Fertility and Family Structure. Population Bulletin of theUnited Nations, 15, 15–33.
Sakai, A., F.W. Allendorf, J.S. Holt, D.M. Lodge, J. Molofsky, K.A. With, S.Baughman, R.J. Cabin, J.E. Cohen, N.C. Ellstrand, D.E. McCauley, P.O’Neill, I.M. Parker, J.N. Thompson, and S.G. Weller, 2001: The popula-tion biology of invasive species. Ann. Rev. Ecol. Syst., 32, 305–32.
Sala-i-Martin, X., 2003: The World Distribution of Income, 1970–2000. Unpub-lished, Columbia University, NY.
Salzman, J. and D. Rejeski, 2002: Changes in pollution and implications forpolicy. In: New Tools for Environmental Protection: Education, Information andVoluntary Measures, P.C. Stern (ed.), National Academy Press, Washington,D.C., 17–42.
Scepan, J., 1999: Thematic validation of high resolution global land-cover datasets. Photgrammetric engineering & remote sensing, 65(9), 1051–1060.
Scherr, S.J., 1997: People and environment: what is the relationship betweenexploitation of natural resources and population growth in the South? Forumfor Development Studies, 1, 33–58.
Schindler, D.W., 1977: Evolution of phosphorus limitation in lakes. Science,195, 260–262.
Schindler, D.W., F.A.J. Armstrong, S.K. Holmgren, and G.J. Brunskill, 1971:Eutrophication of Lake 227, Experimental Lakes Area, northwestern On-tario, by addition of phosphate and nitrate. Journal of Fisheries Research Boardof Canada, 28, 2009–2036.
Schipper, L., 1996a: Lifestyles and the environment: The case of energy. Daeda-lus, 125, 113–138.
................. 11411$ $CH7 10-27-05 08:43:33 PS

220 Ecosystems and Human Well-being: Scenarios
Schipper, L.J., 1996b: Excel spreadsheets containing transport energy data,PASSUM.XLS and FRTSUM.XLS. Versions of 9 February 1996. N. Naki-cenovic (ed.), International Energy Agency, Paris/ France/Lawrence Berke-ley National Laboratory, Berkeley, CA.
Schmalensee, R., T. Stoker, and R. Judson, 1998: World carbon dioxide emis-sions: 1950–2050. The Review of Economics and Statistics, LXXX(1), 15–27.
Schnaiberg, A., 1980: The Environment: From Surplus to Scarcity. Oxford Uni-versity Press, New York.
Schultz, P.W. and L.C. Zelezny, 1998: Values and Proenvironmental Behavior:A Five-Country Study. Journal of Cross-Cultural Psychology, 29(4), 540–558.
Schultz, P.W. and L.C. Zelezny, 1999: Values as predictors of environmentalattitudes. Journal of Environmental Psychology, 19, 255–265.
Schwartz, S., 1996: Value Priorities and Behavior: Applying a Theory of Inte-grated Value Systems. In: The Psychology of Values, C. Seligman, J.M. Olson,and M.P. Zanna (eds.), Lawrence Erlbaum Associates, Mahwah, New Jersey,1–24.
Schwartz, S.H., 1987: Toward a Universal Psychological Structure of HumanValues. Journal of Personality and Social Psychology, 53, 550–562.
Schwartz, S.H., 1992: Universals in the Content and Structure of Values: The-oretical Advances and Empirical Tests in 20 Countries. Advances in Experimen-tal Social Psychology, 25, 1–65.
Schwartz, S.H. and W. Bilsky, 1990: Toward a Theory of the Universal Con-tent and Structure of Values: Extensions and Cross-Cultural Replications.Journal of Personality and Social Psychology, 58, 878–891.
Schwartz, S.H. and S. Huismans, 1995: Value Priorities and Religiosity in FourWestern Religions. Social Psychology Quarterly, 58, 88–107.
Schweigert, P. and R.R. van der Ploeg, 2000: Nitrogen use efficiency in Ger-man agriculture since 1950: facts and evaluation. Berichte ueber Landwirtschaft,80, 185–212.
Scobie, G.M. and R.T. Posada, 1978: The impact of technical change on in-come distribution: The case of rice in Colombia. American Journal of Agricul-tural Economics, 60(1), 85–92.
Secretariat of the Convention on Biological Diversity, 2003: Interlinkagesbetween biological diversity and climate change. Advice on the integration of biodiver-sity considerations into the implementation of the United Nations Framework Conven-tion on Climate Change and its Kyoto protocol. Technical Series 10, Secretariat ofthe Convention on Biological Diversity, Montreal, 154 pp.
Sekercioglu, C.H., 2002: Impacts of bird watching on human and avian com-munities. Environmental Conservation, 29(3), 282–289.
Semken, H.A., 1983: Holocene mammalian biogeography and climatic changein the Eastern and Central United States. In: Late Quaternary environments ofthe United States. Volume 2. The Holocene, H.E. Wright (ed.), University ofMinnesota Press, Minneapolis.
Senauer, B. and M. Sur, 2001: Ending global hunger in the 21st century: pro-jections of the number of food insecure people. Review of Agricultural Econom-ics, 23(1), 68–81.
Shafik, N., and S. Bandyopadhay, 1992: Economic Growth and EnvironmentalQuality: Time Series and Cross-Country Evidence. World Bank, WashingtonDC.
Sharpley, A.N., 1995: Identifying sites vulnerable to phosphorus loss in agricul-tural runoff. Journal of Environmental Quality, 24, 947–951.
Sharpley, A.N., T.C. Daniel, and D.R. Edwards, 1993: Phosphorus movementin the landscape. Journal of Production Agriculture, 6(4), 492–500.
Sharpley, A.N., S. C. Chapra, R. Wedepohl, J.T. Sims, T. C. Daniel, and K.R.Reddy, 1994: Managing agricultural phosphorus for protection of surface wa-ters: issues and option. Journal of Environmental Quality, 23, 437–451.
Sheldrick, W.F., J.K. Syers, and J. Lingard, 2003a: Soil nutrient audits forChina to estimate nutrient balances and output/input relationships. Agricul-ture, Ecosystems and Environment, 94, 341–354.
Sheldrick, W.F., J.K. Syers, and J. Lingard, 2003b: Contribution of livestockexcreta to nutrient balances. Nutrient Cycling in Agroecosystems, 66, 119–131.
Simon, N., 1962: Between the Sunlight and the Thunder. The Wildlife of Kenya.Collins., London.
Slimak, M.W., 2003: Values and Ecological Risk Perception: A Comparison of Ex-perts and the Public. Environmental Science and Policy, George Mason Uni-versity, Fairfax, Virginia.
Small, C., 2001: Global Analysis of Urban Population Distributions and the PhysicalEnvironment. Open Meeting of the Human Dimensions of Global Environ-mental Change Research, Rio de Janeiro, October, 11 pp.
Smil, V., 1997: Some unorthodox perspectives on agricultural biodiversity. Thecase of legume cultivation. Agriculture, Ecosystems and Environment, 62, 135–144.
Smil, V., 1999: Nitrogen in crop production: An account of global flows. GlobalBiochemical Cycles, 13, 647–662.
PAGE 220
Smil, V., 2001: Enriching the earth: Fritz Haber, Carl Bosch, and the transformationof world food production. The MIT Press, Cambridge, Mass., USA, 338 pp.
Smith, K.A., I.P. Mctaggart, and H. Tsuruta, 1997: Emissions of N2O and NOassociated with nitrogen fertilization in intensive agriculture, and the poten-tial for mitigation. Soil Use and Management, 13, 296–304.
Smith, K.R. and S. Mehta, 2003: The burden of disease from indoor air pollu-tion in developing countries: comparison of estimates. International Journal ofHygiene and Environmental Health, 206, 279—289.
Smith, V.H., 1998: Cultural eutrophication of inland, estuarine, and coastalwaters. In: Successes, Limitations, and Frontiers in Ecosystem Science, M.L. Paceand P.M. Groffman (eds.), Springer-Verlag, New York.
Solow, R., 1957: Technical change and the aggregate production function. Re-view of Economics and Statistics, 39, 312–320.
Spalding, R.F. and M.E. Exner, 1993: Occurrence of nitrate in groundwa-ter—a review. Journal of Environmental Quality, 22, 392–402.
Spinage, C.A., 1962: Rinderpest and faunal distribution patterns. African Wild-life, 16, 55–60.
Stark, O., 1991: The Migration of Labor. Basil Blackwell, Cambridge, England.Stern, D.I., 2004: The Rise and Fall of the Environmental Kuznets Curve.
World Development, 32(8), 1419–1439.Stern, P.C., 2000: Toward a Coherent Theory of Environmentally Significant
Behavior. Journal of Social Issues, 56(3), 407–242.Stern, P.C. and H. Fineberg, 1996: Understanding Risk: Informing Decisions in a
Democratic Society. National Academy Press, Washington, D.C.Stern, P.C., T. Dietz, and J.S. Black, 1986: Support for Environmental Protec-
tion: The Role of Moral Norms. Population and Environment, 8, 204–222.Stern, P.C., T. Dietz, and L. Kalof, 1993: Value Orientations, Gender and Envi-
ronmental Concern. Environment and Behavior, 25, 322–348.Stern, P.C., T. Dietz, and G.A. Guagnano, 1995: The New Environmental
Paradigm in Social Psychological Perspective. Environment and Behavior, 27,723–745.
Stern, P.C., T. Dietz, V.W. Ruttan, R.H. Socolow, and J. Sweeney (eds.),1997: Environmentally Significant Consumption: Research Directions. NationalAcademy Press, Washington, D.C.
Stern, P.C., T. Dietz, T. Abel, G.A. Guagnano, and L. Kalof, 1999: A SocialPsychological Theory of Support for Social Movements: The Case of Envi-ronmentalism. Human Ecology Review, 6, 81–97.
Stigliani, W.M., Peter Doelman, Wim Salomons, Rainer Schulin, Gera R. B.Smidt, and Sjoerd EATM Van der Zee, 1991: Chemical time bombs. Environ-ment, 33(4), 4–30.
Stoorvogel, J.J., E.M.A. Smaling, and B.H. Janssen, 1993: Calculating soilnutrient balances in Africa at different scales. 1.Supra-national scale. FertilizerResearch, 35, 227–235.
Suhrke, A., 1994: Environmental Degradation and Population Flows. Journal ofInternational Affairs, 47, 473–96.
Suri, V. and D. Chapman, 1996: Economic Growth, Trade and Environment: AnEconometric Evaluation of the Environmental Kuznets Curve. Working PaperWP-96–05, Cornell University, Ithaca.
Suzuki, A., 1998: Fertilization of rice in Japan. Japan FAO Association, Tokyo,111 pp.
Thogersen, J., 2002: Promoting ‘‘Green’’ Consumer Behavior with Eco-Labels. In: New Tools for Environmental Protection, T. Dietz and P.C. Stern(eds.), National Academy Press, Washington, D.C., 83–104.
Thomas, D.S.G. and N.J. Middleton, 1997: World atlas of desertification. Secondedition ed. Arnold, London, 180 pp.
Thucydides, 1989: The Peloponnesian War / Thucydides; the complete Hobbes trans-lation, with notes and a new introduction by David Grene. University of ChicagoPress, Chicago.
Tiessen, H., ed., 1995: Phosphorus in the Global Environment: Transfers, Cycles,and Management. Vol. 54, SCOPE, John Wiley & Sons, Chichester.
Tilman, D., K.G. Cassman, P.A. Matson, R.L. Naylor, and S. Polasky, 2002:Agricultural sustainability and intensive production practices. Nature, 418,671–677.
Tilton, J.E., 1990: World Metal Demand: Trends and Prospects. Resources for theFuture, Washington, DC.
Todaro, M., 1976: International Migration in Developing Countries. Interna-tional Labour Office, Geneva.
Torchin, M.E., K.D. Lafferty, A.P. Dobson, A.P. Mckenzie, and A.M. Kuris,2003: Introduced species and their missing parasites. Nature, 421, 628–630.
Townsend, A.R., R.B. Howarth, F.A. Bazzaz, M.S. Booth, C.C. Cleveland,S.K. Collinge, A.P. Dobson, P.R. Epstein, E.A. Holland, D.R. Keeney,M.A. Mallin, C.A. Rogers, P. Wayne, and A.H. Wolfe, 2003: Human healtheffects of a changing global nitrogen cycle, 1, 240–246.
................. 11411$ $CH7 10-27-05 08:43:34 PS

221Drivers of Change in Ecosystem Condition and Services
Traxler, G. and D. Byerlee, 1992: Economic returns to crop management re-search in post-green revolution setting. American Journal of Agricultural Econom-ics, 74(3), 573–582.
Tuler, S. and T. Webler, 1999: Voices from the Forest: What Participants Expectof a Public Participation Process. Society and Natural Resources, 12, 437–453.
Turner II, B.L., Y. Geoghegen, and D.R. Foster (eds.) Integrated Land ChangeScience and Tropical Deforestation in Southern Yucatan: Final Frontiers. ClarendonPress of Oxford University Press, Oxford, UK.
Tyrell, T., 1999: The relative influences of nitrogen and phosphorus on oceanicprimary production. Nature, 400, 525–531.
Uexkuell, H.R.V. and E. Mutert, 1995: Global extent, development and eco-nomic impact of acid soils. Plant and Soil, 171, 1–15.
UNCED (United Nations Conference on Environment and Development),1992: Agenda 21., United Nations, New York.
U.N. Environment Programme, 1999: UNEP Global Environment Out-look 2000. Cited May 30, 2004. Available at http://www1.unep.org/geo-text/0138.htm.
UNICEF, 1996: The State of the World’s Children. Oxford University Press, Ox-ford.
United Nations, 1998: World Population Monitoring 1997: International Migrationand Development. ST/ESA/SER.A/169, United Nations, New York.
United Nations, 2003a: World Population in 2300. ESA/P/WP.187, UnitedNations.
United Nations, 2003b: International Migration Report 2002. United Nations,New York.
United Nations, 2003c: Population, Education and Development: The Concise Re-port. ST/ESA/SER.A/226, United Nations, New York, 56 pp.
United Nations, 2003d: World Population Prospects: The 2002 Revision Pop-ulation Database. 2003. Available at http://esa.un.org/unpp/.
United Nations, 2003e: World Population Prospects: The 2002 Revision Highlights.ESA/P/WP.180, United Nations, New York, 22 pp.
United States Census Bureau, 2003: International Data Base, updated 17 July2003. Cited 16 December 2003. Available at http://www.census.gov/ipc/www/idbnew.html.
United States Geological Survey, 2003: Mineral commodity summaries 2003.U.S. Department of the Interior, U.S. Geological Survey, Washington, D.C.
USDA (U.S. Department of Agriculture), 2001: Oil Crops Situation and OutlookYearbook. Economic Research Service, U.S. Department of Agriculture,Washington DC.
U.S. Environmental Protection Agency, 1996: Environmental indicators ofwater quality in the United States. EPA 841-R-96–002, USEPA, Office ofWater Criteria and Standards Division (4503F), Washington, D.C., USA.
U.S. National Research Council: Panel on Public Participation in Environ-mental Assessment and Decision Making. Available at http://www7.nationalacademies.org/hdgc/Public_Participation.html.
van Auken, O.W., 2000: Shrub invasion of North American Semiarid Grass-lands. Ann. Rev. Ecol. Syst., 31, 197–215.
van de Kaa, D.J., 1996: Anchored Narratives: The Story and Findings of Halfa Century of Research Into the Determinants of Fertility. Population Studies,50(3), 389–432.
van der Duim, R. and J. Caalders, 2002: Biodiversity and Tourism. Annals ofTourism Research, 29(3), 743–761.
Van der Pol, R.A. and B. Traore, 1993: Soil nutrient depletion by agriculturalproduction in southern Mali. Fertilizer Research, 36, 79–90.
Van Liere, K.D. and R.E. Dunlap, 1978: Moral Norms and EnvironmentalBehavior: An Application of Schwartz’s Norm-Activation Model to YardBurning. Journal of Applied Social Psychology, 8, 174–188.
Van Vuuren, D.P., B. Strengers, and H.J.M. de Vries, 2000: Long-term per-spectives on world metal use—a systems dynamics model. Resources Policy,accepted for publication.
Vaupel, J.W., 1997: The Remarkable Improvements in Survival at Older Ages.Philosophical Transactions Of The Royal Society Of London Series B-Biological Sci-ences., B352(1363), 1799–804.
Viguier, L., 1999: Emissions of SO2,NOx, and CO2 in transition economies:Emission inventories and Divisa index analysis. Energy Economics, 20(2),59–75.
Vitousek, P.M., J.D. Aber, R.W. Howarth, G.E. Likens, P.A. Matson, D.W.Schindler, W.H. Schlesinger, and D.G. Tilman, 1997: Human alteration ofthe global nitrogen cycle: Sources and consequences. Ecological Applications,7, 737–750.
Vollenweider, R.A., 1968: The scientific basis of lake and stream eutrophica-tion with particular reference to phosphorus and nitrogen as eutrophicationfactors. Technical report OECD, DAS/C81/68, Paris, France, 1–182.
PAGE 221
Vringer, K. and K. Blok, 1995: The direct and indirect energy-requirements ofhouseholds in the Netherlands. Energy Policy, 23, 893–902.
Wackernagel, M. and W. Rees, 1996: Our Ecological Footprint. New SocietyPublishers, Gabriola Island, B.C.
Waggoner, P.E. and J.H. Asubel, 2002: A framework for sustainability science:A renovated IPAT identity. Proceedings of the National Academy of Sciences,99(12), 7860–7865.
Walker, L. and P. Vitousek, 1991: An invader alters germination and growth ofa native dominant tree in Hawaii. Ecology, 72, 1449–1455.
Watson, R., M.C. Zinyowera, and R. Moss (eds.), 1996: Climate Change 1995.Impacts, Adaptations and Mitigation of Climate Change: Scientific Analyses. Contri-bution of Working Group II to the Second Assessment Report of the IntergovernmentalPanel on Climate Change. Cambridge University Press, Cambridge, 861 pp.
Wearing, S., 2001: Exploring socio-cultural impacts on local communities. In:The Encyclopedia of Ecotourism, D.B. Weaver (ed.), CABI Publishing, Oxon,193–204.
Weaver, D.B. (ed.), 2001: The Encyclopedia of Ecotourism. CABI Publishing,Oxon, 193–204 pp.
Welch, R.M. and R.D. Graham, 1999: A new paradigm for world agriculture:meeting human needs. Productive, sustainable and nutritious. Field Crops Re-search, 60, 1–10.
Westing, A.H., 1988: Constraints on Military Disruption of the Biosphere: AnOverview. In: Cultural Norms, War and the Environment, A.H. Westing (ed.),Oxford University Press.
W. Ghiorghis, A., 1993: The Human and Ecological Consequences of War inEritrea. In: Conflicts in the Horn of Africa: Human and Ecological Consequences ofWarfare, T. Tvedt (ed.), Reprocentralen HSC, Uppsala. Research Programson Environmental Policy and Society, Department of Social and EconomicGeography, Uppsala University.
White, L.J., 1967: The Historical Roots of Our Ecological Crisis. Science, 155,1203–1207.
Whitfield, S., T. Dietz, and E.A. Rosa, 1999: Environmental Values, Risk Percep-tion and Support for Nuclear Technology. Human Ecology Research Group,George Mason University, Fairfax, Virginia.
Williamson, M. and A. Fitter, 1996: The varying success of invaders. Ecology,77, 1661–1666.
Wolfe, A.H. and J.A. Patz, 2002: Reactive nitrogen and human health: acuteand long-term implications. Ambio, 31, 120–125.
Wong, J., 2001: China’s sharply declining fertility: Implications for its popula-tion policy. Issues & Studies, 37(3), 68–86.
World Bank, 1992: World Development Report 1992: Development and the Envi-ronment. Oxford University Press, Oxford.
World Bank, 2002: World Development Indicators 2002. World Bank, Washing-ton, DC, 432 pp.
World Bank, 2003: World Development Indicators, 2003. World Bank, Washing-ton, DC, April.
World Bank, 2004: World Development Report 2004: Making Services Work forPoor People. World Bank, Washington, DC.
World Commission on Environment and Development, 1987: Our Com-mon Future. Oxford University Press, Oxford.
World Conservation Monitoring Center, 1991: Gulf War Impacts on MarineEnvironment and Species. Gulf War Environmental Information Service, Cam-bridge, England.
World Resources Institute, 1997: World Resources 1996–97. Oxford Univer-sity Press, New York.
World Resources Institute, United Nations Development Programme,United Nations Environment Programme, and World Bank, 2000: World Re-sources 2000–2001: People and Ecosystems, The Fraying Web of Life, Washing-ton, D.C.
World Resources Institute, United Nations Development Programme,United Nations Environment Programme, and World Bank, 2002: World Re-sources 2002–2004: Decisions for the Earth: Balance, Voice, and Power. Washing-ton, D.C.
World Tourism Organization, 1998: Ecotourism. WTO News, I.World Trade Organization, 2003: Understanding the WTO. World Trade Or-
ganization, Geneva, September.World Trade Organization, 2004: Why is the liberalization of services impor-
tant? Cited May 30, 2004. Available at http://www.wto.org/english/tratop_e/serv_e/gats_factfiction2_e.htm.
York, R. and E.A. Rosa, 2003: Key challenges to ecological modernizationtheory. Organization and Environment, 16, 273–288.
York, R., E.A. Rosa, and T. Dietz, 2003a: Footprints on the Earth: The Envi-ronmental Consequences of Modernity. American Sociological Review, 68(2),279–300.
................. 11411$ $CH7 10-27-05 08:43:36 PS

222 Ecosystems and Human Well-being: Scenarios
York, R., E. Rosa, and T. Dietz, 2003b: STIRPAT, IPAT and IMPACT: ana-lytic tools for unpacking the driving forces of environmental impact. EcologicalEconomics, 46, 351–365.
Young, O.R., 2002: The Institutional Dimensions of Environmental Change: Fit,Interplay and Scale. The MIT Press, Cambridge.
PAGE 222
Zambon, M.C., 2001: The pathogenesis of influenza in humans. Reviews inMedical Virology, 11, 227–241.
Zlotnik, H., 1998: International Migration 1965–96: An Overview. Populationand Development Review, 24(3), 429–6.
................. 11411$ $CH7 10-27-05 08:43:37 PS