Chapter 7
76
Chapter 7 CHAPTER SEVEN Capital Allocation Between The Risky And The Risk-Free Asset
-
Upload
gregory-vaughn -
Category
Documents
-
view
17 -
download
6
description
Chapter 7. CHAPTER SEVEN Capital Allocation Between The Risky And The Risk-Free Asset. CHAPTER OVERVIEW - PowerPoint PPT Presentation
Transcript of Chapter 7

Chapter 7
CHAPTER SEVEN
Capital Allocation Between The Risky And The Risk-Free Asset

• CHAPTER OVERVIEW• This chapter develops the concept of allocating i
nvestment funds between risk-free and riskless assets. Combining risk free assets (U. S. Treasury bills or money market mutual funds) with risky mutual fund portfolios operationalizes the concepts of producing portfolios of acceptable risk/return trade-offs for various investors.

• LEARNING OBJECTIVES
• The student should be able to construct portfolios of different risk levels, given information about risk free rates and returns on risky assets. The student should be able to calculate the expected return and standard deviation of these portfolios.

• 7.1 Capital allocation across risky and
risk-free portfolios

• It’s possible to split investment funds between safe and risky assets.
• Risk free asset: T-bills;money market instruments(CD,CP)
• Risky asset: stock (or a risky portfolio)
• Asset allocation is the most important part of portfolio construction.
Allocating Capital: Risky & Risk Free Assets

Capital allocation across risky and risk-free portfolios
• Example:assume that the total market value of an initial portfolio is $300,000,of which $90,000 is invested in T-bills,a risk-free asset for practice.The remaining $210,000 is invested in risky securities-$113,400 in Equity(E)and $96,600 in long-term bonds(B).The Equities and long-term bonds holdings comprise the risky portfolio,54% in E and 46% in B.

• Analyze example:
complete portfolio
• Equity(E):$113,400 T-bills:$90,000
• Bonds(B):$96,600
• $210,000
• E in risky-portfolio=113400/210000=54%
• B in risky-portfolio=96000/210000=46%
Risky portfolio Risk-free asset
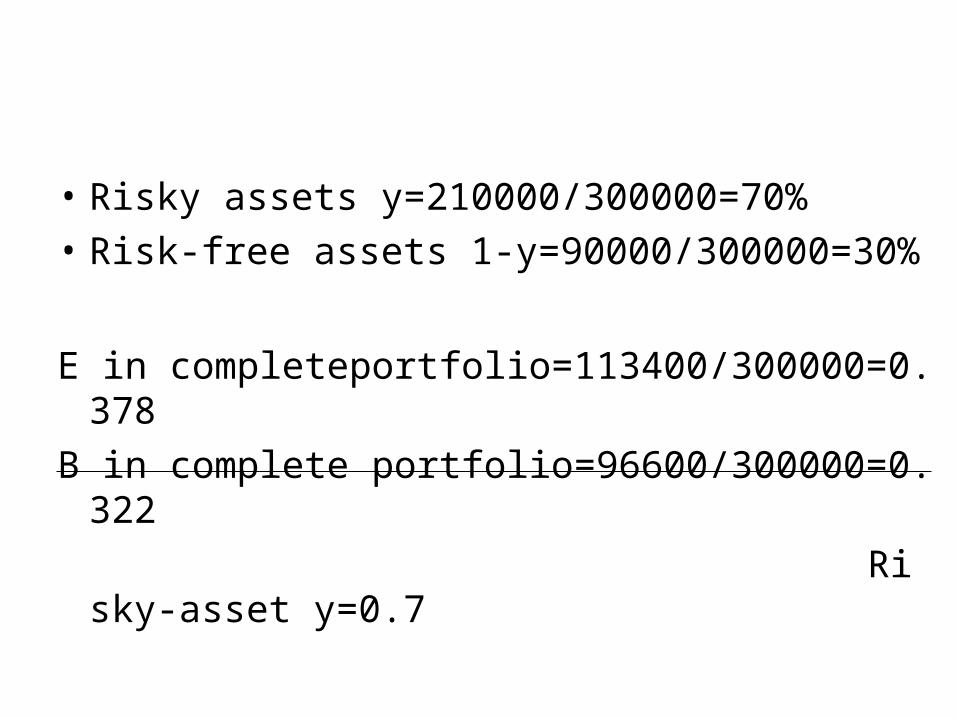
• Risky assets y=210000/300000=70%
• Risk-free assets 1-y=90000/300000=30%
E in completeportfolio=113400/300000=0.378
B in complete portfolio=96600/300000=0.322
Risky-asset y=0.7

• If reduce the allocation to the risky portfolio from y=0.7 to y=0.56.the risky portfolio would then total only 300000×0.56=168000.
• the proportions of each asset in risky-portfolio are unchanged:
• E=168000×54%=90720
• B=168000×46%=77280

Exercise
• 150000×54%=81000, E in complete portfolio=81000/300000=27%
50%risk-free
Bond(46%)
Equity(54%)
300000×50%
=150000

• 7.2 Portfolios of one risky asset and one risk-free asset

Issues
• Examine risk/return tradeoff.
• Demonstrate how different degrees of risk aversion will affect allocations between risky and risk free assets.
Allocating Capital: Risky & Risk Free Assets

rf = 7% rf = 0%
E(rp) = 15% p = 22%
y = % in p (1-y) = % in rf
Example Using Chapter 7.3 Numbers

E(rc) = yE(rp) + (1 - y)rf
rc = complete portfolio
For example, y = .75E(rc) = .75(.15) + .25(.07)
= .13 or 13%
Expected Returns for Combinations

• 由 y 份风险资产与 1-y 份无风险资产组成的整个资产组合,记为 C ,其收益率记为 rc, 有
• 对资产组合的收益率取期望,有
• 任意资产组合的基本收益率是无风险资产收益率。资产组合期望获得一个风险溢价。
(1 )c p fr yr y r
( ) ( ) (1 )[ ( ) ] [ ( ) ]c p p f f p fE r yE r y E r r r y E r r

Possible Combinations
E(r)
E(rp) = 15%
rf = 7%
22%0
P
F
c
E(rc) = 13%C

Investment Opportunity Set with a Risk-Free Investment
投资机会集( investment opportunity set ),即由不同投资于风险资产组合 P 的比例 y 值所产生的所有资产组合的可能期望收益与标准方差配对的集合。其图形是由 rf 点引出,穿过 P 点的直线,该条直线叫做资本配置线( capital allocation line,CAL ) , 它表示投资者的所有可行的风险收益组合。它的斜率 S ,可称为报酬与波动性比率( reward-to-variability ratio )

pc =
Since rf
y
= 0, then
* Rule 4 in Chapter 6
*
Variance For Possible Combined Portfolios

风险资产与无风险资产组合的风险( Portfolio Risk with Risk-Free Asset )
规则 4 :当一个风险资产与一个无风险资产相组合时,资产组合的标准差等于风险资产的标准差乘以该资产组合投资于这部分资产上的比例。
riskyassetriskyassetp w
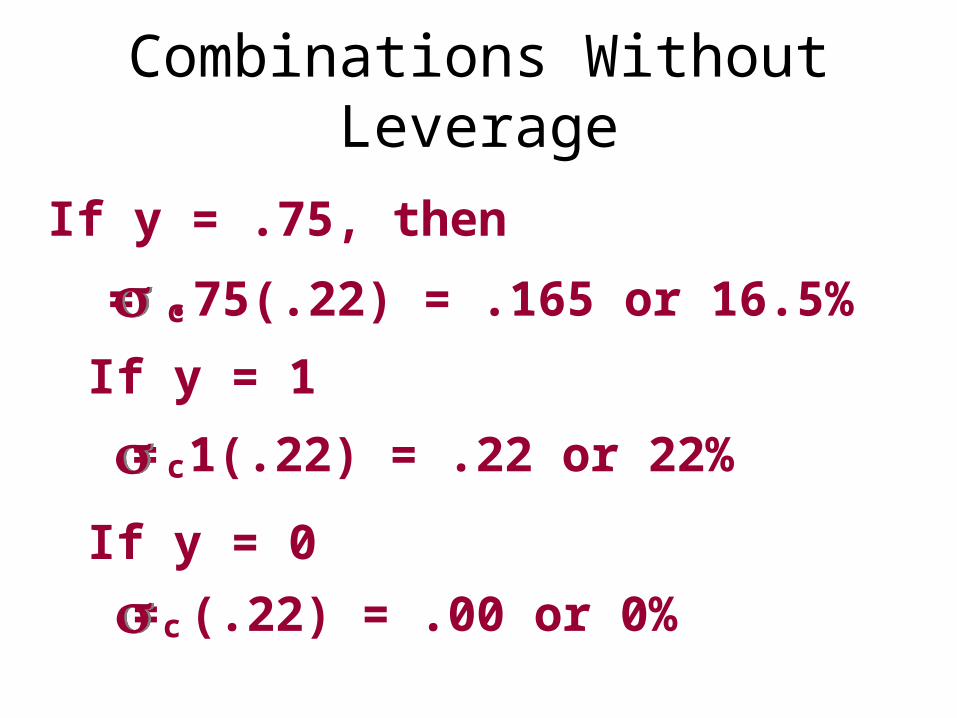
c = .75(.22) = .165 or 16.5%
If y = .75, then
c = 1(.22) = .22 or 22%
If y = 1
c = (.22) = .00 or 0%
If y = 0
Combinations Without Leverage

Borrow at the Risk-Free Rate and invest in stock.
Using 50% Leverage,
rc = (-.5) (.07) + (1.5) (.15) = .19
c = (1.5) (.22) = .33
Capital Allocation Line with Leverage

CAL (Capital Allocation Line)E(r)
E(rp) = 15%
rf = 7%
p = 22%0
P
F
) S = 8/22E(rp) - rf = 8%
CAL

• Borrowing rate 9%,lending rate 7%,if use
Leverage to construct portfolio.then
S0=0.36 SL=0.27
E(rp) = 15% σp=22%

CAL with Higher Borrowing Rate
E(r)
9%
7%) S = .36
) S = .27
P
p = 22%
S=(15%-9%)/22%=6/22=0.27
S=(15%-7%)/22%=8/22=0.36

• If you invest a proportion,y,in a risky fund with expected return E(rp)and standard deviation σp,and the remainder,1-y,in a risk-free asset with a sure rate rf,Then the
• Portfolio’s expected return and standard deviation are:
• E(rc)=rf+y[E(rp)-rf]
• σc,=y σp,
( ) [ ( ) ] ( )c f p f p fc
c p p
E r r y E r r E r rS
y

• Greater levels of risk aversion lead to larger proportions of the risk free rate.
• Lower levels of risk aversion lead to larger proportions of the portfolio of risky assets.
• Willingness to accept high levels of risk for high levels of returns would result in leveraged combinations.
7.3Risk Aversion and asset Allocation

Utility Function
U = E ( r ) - .005 A 2
WhereU = utilityE ( r ) = expected return on the asset or
portfolioA = coefficient of risk aversion = variance of returns

2 2
2
( ) 0.005 [ ( ) ] 0.005
( )*
0.01
c c f p f c
p f
p
MaxU E r A r y E r r A
E r ry
A

CAL with Risk Preferences
E(r)
7%
P
Lender
Borrower
p = 22%
The lender has a larger A when
compared to the borrower

• 校级策略( passive strategy )描述了这样一种资产组合决策,该决策不做任何或者间接的证券分析。
• We call the capital allocation line provided by 1-month T-bills and a broad index of commom stocks the capital market line(CML). 资本市场线代表了生成投资机会集的一个消极策略。
• A passive strategy generates an investment opportunity set that is represented by the CML.

Costs and Benefits of Passive Investing
• Active strategy entails costs
• Free-rider benefit
• Involves investment in two passive portfolios– Short-term T-bills– Fund of common stocks that mimics a broad
market index

• Chapter 8 Optimal Risky Portfolios

• CHAPTER OVERVIEW• In this chapter, the concept of portfolio formation moves
beyond the risky and risk-free asset combinations of the previous chapter to include combinations of two risky assets and of many risky assets. The concept of risk reduction by combining securities with different return patterns is introduced. By combining securities with differing return patterns, efficient portfolios (maximum return for a given level of risk) may be created. Finally, the risky portfolio is expanded to include all risky assets (i. e., the market); the investor may invest in the market (or in an indexed mutual fund) combined with the appropriate investment in risk-free instruments to create the portfolio of the desired risk level.

• Learning Objectives• Students should be able to calculate standard
deviation and return for two security portfolios and be able to find the minimum variance combinations of two securities. Upon completion of this chapter the student should have a full understanding of systematic and firm-specific risk, and of how one can reduce the amount of firm-specific risk in the portfolio by combining securities with differing patterns of returns. The student should be able to quantify this risk-reduction concept by being able to calculate and interpret covariance and correlation coefficients.

1 . DIVERSIFICATION AND PORTFOLIO RISK
Diversification and Portfolio Risk
• Market risk– Systematic or Nondiversifiable
• Firm-specific risk– Diversifiable or nonsystematic

Figure 6.1 Portfolio Risk as a Function of the Number of Stocks

Figure 6.2 Portfolio Risk as a Function of Number of Securities

2.ASSET ALLOCATION WITH TWO RISKY ASSETS

Covariance and Correlation
• Portfolio risk depends on the correlation between the returns of the assets in the portfolio
• Covariance and the correlation coefficient provide a measure of the returns on two assets to vary
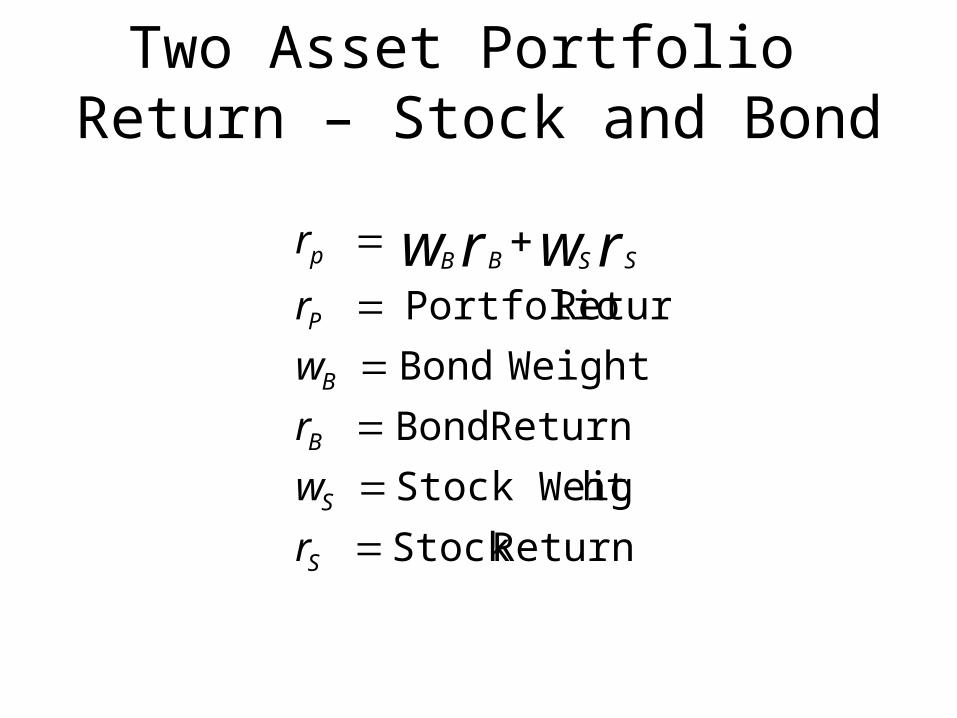
Two Asset Portfolio Return – Stock and Bond
ReturnStock
htStock Weig
Return Bond
WeightBond
Return Portfolio
S
S
B
B
P
SSBBp
r
w
r
w
r
r rwrw

Covariance and Correlation Coefficient
• Covariance:
• Correlation Coefficient:
1
( , ) ( ) ( ) ( )S
S B S S B Bi
Cov r r p i r i r r i r
( , )S BSB
S B
Cov r r
注:相关系数越低,分散化就越有效,资产组合风险就越低。

Correlation Coefficients: Possible Values
If If = 1.0, the securities would be = 1.0, the securities would be perfectly positively correlatedperfectly positively correlated
If If = - 1.0, the securities would be = - 1.0, the securities would be perfectly negatively correlatedperfectly negatively correlated
Range of values for 1,2
-1.0 < < 1.0

Two Asset Portfolio St Dev – Stock and Bond
Deviation Standard Portfolio
Variance Portfolio
2
2
,
22222 2
p
p
SBBSSBSSBBp wwww

rp = Weighted average of the n securitiesrp = Weighted average of the n securities
p2 = (Consider all pair-wise
covariance measures)p
2 = (Consider all pair-wise covariance measures)
In General, For an n-Security Portfolio:

Three Rules of Two-Risky-Asset Portfolios
• Rate of return on the portfolio:
• Expected rate of return on the portfolio:
P B B S Sr w r w r
( ) ( ) ( )P B B S SE r w E r w E r

Three Rules of Two-Risky-Asset Portfolios
• Variance of the rate of return on the portfolio:
2 2 2( ) ( ) 2( )( )P B B S S B B S S BSw w w w

Numerical Text Example: Bond and StockReturns
ReturnsBond = 6% Stock = 10%
Standard Deviation Bond = 12% Stock = 25%
WeightsBond = .5 Stock = .5
Correlation Coefficient (Bonds and Stock) = 0

Numerical Text Example: Bond and Stock
Return = 8%
.5(6) + .5 (10)
Standard Deviation = 13.87%
[(.5)2 (12)2 + (.5)2 (25)2 + …
2 (.5) (.5) (12) (25) (0)] ½
[192.25] ½ = 13.87

Figure 6.3 Investment Opportunity Set for Stocks and Bonds

Figure 6.4 Investment Opportunity Set for Stocks and Bonds with Various Correlations

• 资产组合机会集( portfolio opportunity set )显示了由两种有关资产构造的所有资产组合的期望收益与标准差。其他线段显示的是在其他相关系数值下资产组合的机会集。黑色实线连接两种基金,表示当两种资产的相关系数为 1时,分散化没有什么益处。 当 ρ=-1 时,资产组合的机会集是线性的,但它提供了一个完全对冲的机会,此时从分散化中可以获得最大的利益。
• 注:资产组合中的资产相关性越低,分散化的潜在收益就越大。在极端的完全负相关的情况下,可以有一个完全对冲掉风险的机会,构造了一个零方差的资产组合。

3. THE OPTIMAL RISKY PORTFOLIO WITH A RISK-FREE ASSET

• 大部分的投资专家认为“真正重要的决策是如何在股票、债券和安全性最好的国库券中分配你的资金比例”

Example:
• Debt Equity
• Expected return,E(r) 8% 13%
• Standard deviation,σ 12% 20%
• Covariance,cov(rD,rE) 72
• Correlation coefficient,ρDE 0.30
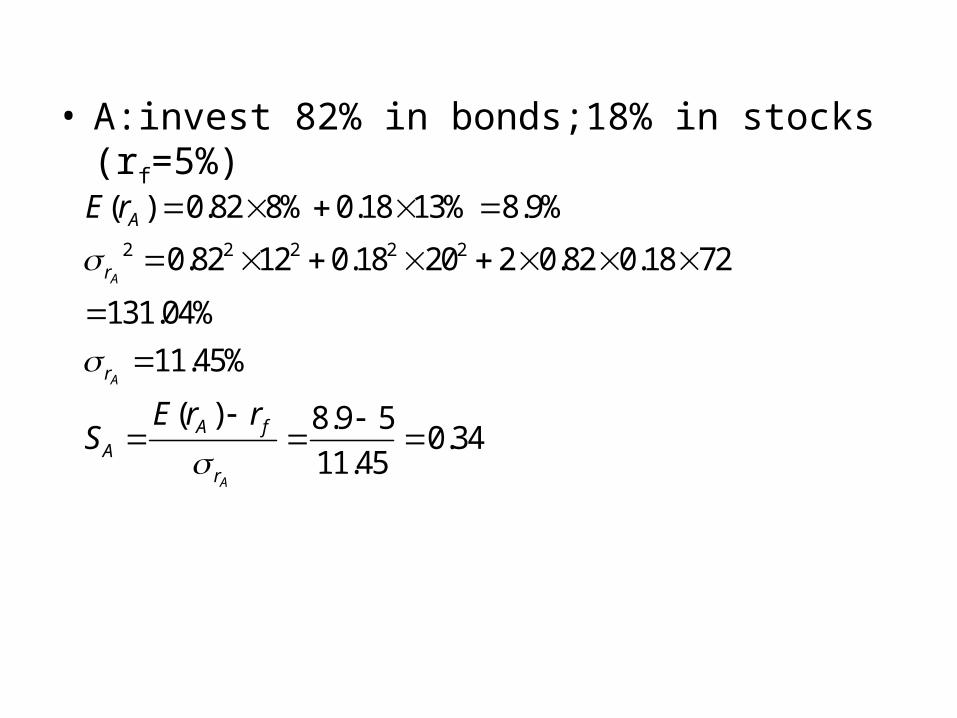
• A:invest 82% in bonds;18% in stocks(rf=5%)
2 2 2 2 2
( ) 0.82 8% 0.18 13% 8.9%
0.82 12 0.18 20 2 0.82 0.18 72
131.04%
11.45%
( ) 8.9 50.34
11.45
A
A
A
A
r
r
A fA
r
E r
E r rS

• B:invest 70% in bonds and 30% in stocks.
( ) 9.5%
11.7%
( ) 9.5 50.38
11.7
B
B
B
r
B fB
r
E r
E r rS

Figure 6.5 Opportunity Set Using Stocks and Bonds and Two Capital Allocation Lines

P
CALp

• In the case of two risky assets,the solution for the weights of the optimal risky portfolio,P,can be shown to be as follows:
( )p fp
p
E r rMaxS
2
2 2
[ ( ) ] [ ( ) ] ( , )
[ ( ) ] [ ( ) ] [ ( ) ( ) ] ( , )
1
D f E E f D ED
D f E E f D D f E f D E
E D
E r r E r r Cov r rW
E r r E r r E r r E r r Cov r r
W W

Example:
• Debt Equity
• Expected return,E(r) 8% 13%
• Standard deviation,σ 12% 20%
• Covariance,cov(rD,rE) 72
• Correlation coefficient,ρDE 0.30
• rf=5%

• Using above data,the solution for the optimal risky portfolio is:
2
2 2
2
2 2
[ ( ) ] [ ( ) ] ( , )
[ ( ) ] [ ( ) ] [ ( ) ( ) ] ( , )
(8 5)20 (13 5)720.4
(8 5)20 (13 5)12 (8 5 13 5)72
1 1 0.4 0.6
D f E E f D ED
D f E E f D D f E f D E
E D
E r r E r r Cov r rW
E r r E r r E r r E r r Cov r r
W W
( ) 0.4 8% 0.6 13% 11%
14.2%
p
p
E r

Optimal complete portfolio
• 以上构造了一个最优风险资产组合 P ,下面用一个个人的投资风险厌恶程度 A 来计算投资于完整资产组合的风险部分的最优比例。
• An investor with a coefficient of risk aversion A=4 would take a position in Portfolio P ? (假设一个风险厌恶相关系数 A=4 的投资者,他在资产组合 P 中的投资比例为?)
2 2
( ) 11 50.7439
0.01 0.01 4 14.2p f
p
E r ry
A

• Thus the investor will invest 74.39% of his or her wealth in Portfolio P and 25.61% in T-bills.In fact,the investment in stocks will be 0.7439×0.6=0.4463or44.63%, the investment in bonds will be 0.7439×0.4=0.2976or29.76%
• 因此,这个投资者将 74.39% 的财产投资于资产组合 P , 25.61% 的资产投资于国库券,资产组合 P 中包括 40% 的债券,因此债券所占的比例为 ywD=0.4×0.7439=0.2976, 即 29.76% 。同样,投资于股票的权重为ywE=0.6×0.7439=0.4463 ,即 44.63% 。

The proportions of the optimal overall portfolio
Portfolio PBonds 29.76%
Stock 44.63%
T-bills 25.61%

小结:完成一个完整的资产组合的步骤:
• 1 、确定所有各类证券的收益特征(如期望收益、方差、协方差)
• 2 、建造风险资产组合( 1 )根据以下公式计算最优风险资产组合 P
2
2 2
2
2 2
[ ( ) ] [ ( ) ] ( , )
[ ( ) ] [ ( ) ] [ ( ) ( ) ] ( , )
(8 5)20 (13 5)720.4
(8 5)20 (13 5)12 (8 5 13 5)72
1 1 0.4 0.6
D f E E f D ED
D f E E f D D f E f D E
E D
E r r E r r Cov r rW
E r r E r r E r r E r r Cov r r
W W

小结:完成一个完整的资产组合的步骤:
• ( 2 )根据( 1 )中计算出的权重,运用公式计算资产组合 P 的期望收益、方差
• 3 、把资金配置在风险资产组合和无风险资产上。• ( 1 )根据以下公式计算风险资产组合 P 和无风
险资产(如国库券)的权重:
2
( )
0.01p f
p
E r ry
A

• ( 2 )计算出完整的资产组合中投资于一种资产组合和无风险资产国库券的份额。

• 例 : 设有一证券组合包括了 A 、 B 两种股票和无风险国库券。基本情况如下表:
• 期望收益率 标准差• A 股票 10% 20%• B 股票 30% 60%• 国库券 5% 0• A 股票和 B 股票的相关系数为 -0.2.要求:( 1 )计算由 A 和 B 组成的最优风险资产组
合 P, 并求出该最优风险资产组合的期望收益率和标准差;
( 2 )如果投资者的风险厌恶指数 A=5, 投资者将投资于 A 股票、 B 股票和国库券的比例分别为多少?

• ( 1 )2
2 2
( , ) 0.2 20 60 240
(10 5)60 (30 5)( 240)0.6818
(10 5)60 (30 5)20 30( 240)
1 0.3182
A B AB A B
A
B A
Cov r r
w
w w
( ) 0.6818 10% 0.3128 30% 16.36%
21.13%
p
p
E r

• (2)
• 股票 A 投资比例 : 0.5089×68.18%=34.70%• 股票 B 投资比例 :0.5089×31.82%=16.19%• Total: 50.89%• 国库券投资比例: 1-50.89%=49.11%
2 2
( ) 16.36 50.5089
0.01 0.01 5 21.13p f
p
E r ry
A

Figure 6.10 The Efficient Frontier of Risky Assets and Individual Assets

• 最小方差资产组合的权重计算公式:
• 最优风险组合的权重与最小方差资产组合的权重的不同之处在于:在计算最优风险资产组合的权重时不仅要考虑风险因素,还要考虑报酬因素,同时考虑报酬与波动性的比率。而最小方差资产组合的权重计算只是考虑风险最小即可。
2
min 2 2
min
( , )( )
2 ( , )
( ) 1 ( )
E D E
D E D E
Cov r rw D
Cov r r
w E w D

• 落在全局最小方差以上的边界被称为风险资产的有效率边界。
• 1952 年, Harry Markowitz 发表了资产组合选择的正式模型,揭示了分散化的原则。因此他获得了 1990 年诺贝尔经济学奖。他的模型是资产组合管理的第一步:确认有效的资产组合集合,即风险资产的有效率边界。

本章小结• 掌握计算方法:资产组合的期望收益和标
准差的计算方法;资产组合中各资产之间的协方差的计算方法;最优风险资产组合的计算方法;最优资产组合和无风险资产组成的资产组合的最优比列的计算方法。
• 了解只要资产不是完全正相关的,分散化的资产组合就是有价值的。资本配置线、有效边界、最小方差组合的计算。

• 有效边界是利用图表来表示在某一特有风险水平上,有最大收益的一组资产组合。理性投资者将在有效率边界上选择资产组合。