CHAPTER 6 WASTEWATER TREATMENT AND …...Chapter 6: Wastewater Treatment and Discharge 2019...
72
Chapter 6: Wastewater Treatment and Discharge 2019 Refinement to the 2006 IPCC Guidelines for National Greenhouse Gas Inventories 6.1 CHAPTER 6 WASTEWATER TREATMENT AND DISCHARGE
Transcript of CHAPTER 6 WASTEWATER TREATMENT AND …...Chapter 6: Wastewater Treatment and Discharge 2019...

Chapter 6: Wastewater Treatment and Discharge
2019 Refinement to the 2006 IPCC Guidelines for National Greenhouse Gas Inventories 6.1
CH APTE R 6
WASTEWATER TREATMENT AND DISCHARGE

Volume 5: Waste
6.2 2019 Refinement to the 2006 IPCC Guidelines for National Greenhouse Gas Inventories
Authors Deborah Bartram (USA), Michael D. Short (Australia), Yoshitaka Ebie (Japan), Juraj Farkaš (Slovakia), Céline Gueguen (France), Gregory M. Peters (Sweden), Nuria Mariana Zanzottera (Argentina), M. Karthik (India)
Contributing Authors Shuhei Masuda (Japan)
Chapter 6: Wastewater Treatment and Discharge
2019 Refinement to the 2006 IPCC Guidelines for National Greenhouse Gas Inventories 6.3
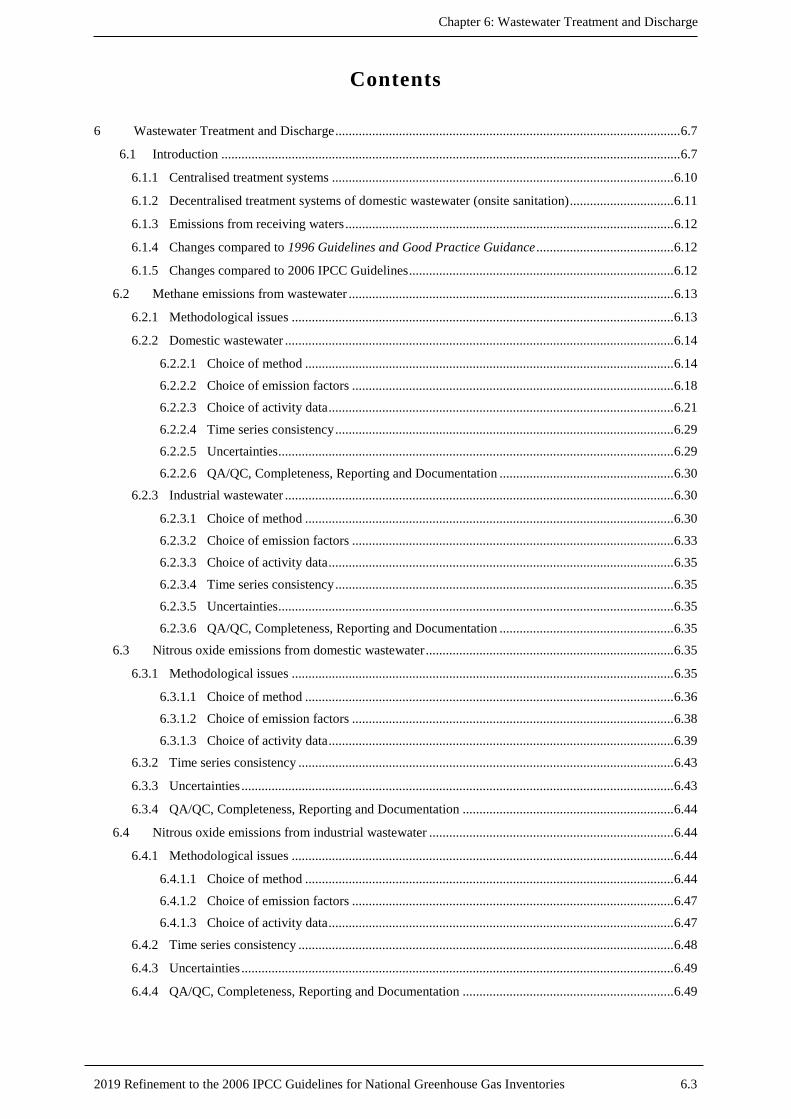
Contents
6 Wastewater Treatment and Discharge ....................................................................................................... 6.7
6.1 Introduction ......................................................................................................................................... 6.7
6.1.1 Centralised treatment systems ...................................................................................................... 6.10
6.1.2 Decentralised treatment systems of domestic wastewater (onsite sanitation) ............................... 6.11
6.1.3 Emissions from receiving waters .................................................................................................. 6.12
6.1.4 Changes compared to 1996 Guidelines and Good Practice Guidance ......................................... 6.12
6.1.5 Changes compared to 2006 IPCC Guidelines ............................................................................... 6.12
6.2 Methane emissions from wastewater ................................................................................................. 6.13
6.2.1 Methodological issues .................................................................................................................. 6.13
6.2.2 Domestic wastewater .................................................................................................................... 6.14
6.2.2.1 Choice of method .............................................................................................................. 6.14 6.2.2.2 Choice of emission factors ................................................................................................ 6.18 6.2.2.3 Choice of activity data ....................................................................................................... 6.21 6.2.2.4 Time series consistency ..................................................................................................... 6.29 6.2.2.5 Uncertainties ...................................................................................................................... 6.29 6.2.2.6 QA/QC, Completeness, Reporting and Documentation .................................................... 6.30
6.2.3 Industrial wastewater .................................................................................................................... 6.30
6.2.3.1 Choice of method .............................................................................................................. 6.30 6.2.3.2 Choice of emission factors ................................................................................................ 6.33 6.2.3.3 Choice of activity data ....................................................................................................... 6.35 6.2.3.4 Time series consistency ..................................................................................................... 6.35 6.2.3.5 Uncertainties ...................................................................................................................... 6.35 6.2.3.6 QA/QC, Completeness, Reporting and Documentation .................................................... 6.35
6.3 Nitrous oxide emissions from domestic wastewater .......................................................................... 6.35
6.3.1 Methodological issues .................................................................................................................. 6.35
6.3.1.1 Choice of method .............................................................................................................. 6.36 6.3.1.2 Choice of emission factors ................................................................................................ 6.38 6.3.1.3 Choice of activity data ....................................................................................................... 6.39
6.3.2 Time series consistency ................................................................................................................ 6.43
6.3.3 Uncertainties ................................................................................................................................. 6.43
6.3.4 QA/QC, Completeness, Reporting and Documentation ............................................................... 6.44
6.4 Nitrous oxide emissions from industrial wastewater ......................................................................... 6.44
6.4.1 Methodological issues .................................................................................................................. 6.44
6.4.1.1 Choice of method .............................................................................................................. 6.44 6.4.1.2 Choice of emission factors ................................................................................................ 6.47 6.4.1.3 Choice of activity data ....................................................................................................... 6.47
6.4.2 Time series consistency ................................................................................................................ 6.48
6.4.3 Uncertainties ................................................................................................................................. 6.49
6.4.4 QA/QC, Completeness, Reporting and Documentation ............................................................... 6.49

Volume 5: Waste
6.4 2019 Refinement to the 2006 IPCC Guidelines for National Greenhouse Gas Inventories
Appendix 6A.1 Non-biogenic (fossil) CO2 emissions from wastewater treatment and discharge: Basis for Future Methodological Development ...................................................................................... 6.51
Annex 6A.1 Summary data for pit latrine use, no sanitation facility, and groundwater use by country ..... 6.54
Annex 6A.2 Derivation of the maximum CH4 producing potential (Bo) for domestic wastewater ............. 6.57
Annex 6A.3 Estimation of default methane conversion factors for CH4 in centralised wastewater treatment plants treating domestic wastewater ........................................................................................ 6.58
Annex 6A.4 Calculation of MCF for methane emissions from sewage discharges ..................................... 6.59
Annex 6A.5 Estimation of default emission factors for N2O in domestic wastewater treatment plants ...... 6.61
Annex 6A.6 Estimation of default emission factors for N2O in effluent ..................................................... 6.63
Annex 6A.7 List of countries by region included in Table 6.10a ................................................................ 6.64
References ................................................................................................................................................ 6.65

Chapter 6: Wastewater Treatment and Discharge
2019 Refinement to the 2006 IPCC Guidelines for National Greenhouse Gas Inventories 6.5
Equations
Equation 6.1 (Updated) CH4 emissions from domestic wastewater for each treatment/discharge pathway or system, j ...................................................................................................................... 6.17
Equation 6.1a (New) Total CH4 emissions from domestic wastewater treatment and discharge .................. 6.17
Equation 6.2 CH4 emission factor for each domestic wastewater treatment/discharge pathway or system ......................................................................................................................... 6.18
Equation 6.3 (Updated) Total organically degradable material in domestic wastewater ................................... 6.21
Equation 6.3a (New) Total organics in domestic wastewater by treatment/discharge pathway or system ... 6.22
Equation 6.3b (New) Organic component removed as sludge from aerobic treatment plants ....................... 6.27
Equation 6.3c (New) Organic component removed as sludge from septic systems ...................................... 6.28
Equation 6.3d (New) Total organics in treated domestic wastewater effluent ............................................. 6.28
Equation 6.4 Total CH4 emissions from industrial wastewater ........................................................ 6.33
Equation 6.5 CH4 emission factor for industrial wastewater ............................................................ 6.33
Equation 6.9 (Updated) N2O emissions from domestic wastewater treatment plants ........................................ 6.37
Equation 6.7 (Updated) N2O emissions from domestic wastewater effluent ..................................................... 6.38
Equation 6.10 (New) Total nitrogen in domestic wastewater by treatment pathway .................................... 6.40
Equation 6.10a (New) Estimation of protein consumed .................................................................................. 6.41
Equation 6.8 (Updated) Total nitrogen in domestic wastewater effluent .......................................................... 6.42
Equation 6.11 (New) N2O emissions from industrial wastewater treatment plants ....................................... 6.44
Equation 6.12 (New) N2O emissions from industrial wastewater effluent .................................................... 6.47
Equation 6.13 (New) Total nitrogen in industrial wastewater ....................................................................... 6.47
Equation 6.14 (New) Total nitrogen in industrial wastewater effluent .......................................................... 6.48
Figures
Figure 6.1 (Updated) Wastewater treatment systems and discharge pathways ............................................... 6.8
Figure 6.1a (New) Percentage of low-income country populations using pit latrines as a primary sanitation facility ......................................................................................................................... 6.12
Figure 6.2 (Updated) Decision tree for CH4 emissions from domestic wastewater ....................................... 6.15
Figure 6.3 (Updated) Decision tree for CH4 emissions from industrial wastewater treatment ...................... 6.32
Figure 6.4 (New) Decision tree for N2O emissions from domestic wastewater ...................................... 6.37
Figure 6.5 (New) Nitrogen in domestic wastewater treatment ................................................................ 6.40
Figure 6.6 (New) Decision tree for N2O emissions from industrial wastewater ...................................... 6.46
Figure 6A.1 (New) Correlation between influent total nitrogen (TN) loading and N2O emissions ........... 6.61
Volume 5: Waste
6.6 2019 Refinement to the 2006 IPCC Guidelines for National Greenhouse Gas Inventories
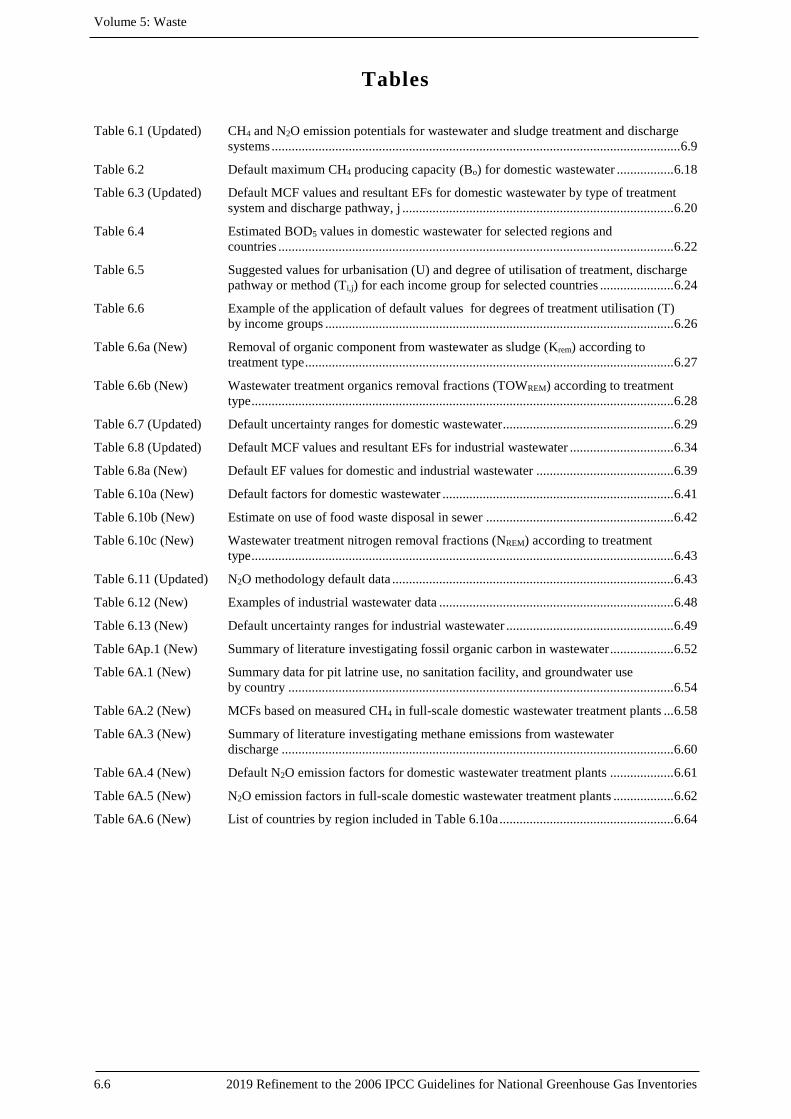
Tables
Table 6.1 (Updated) CH4 and N2O emission potentials for wastewater and sludge treatment and discharge systems .......................................................................................................................... 6.9
Table 6.2 Default maximum CH4 producing capacity (Bo) for domestic wastewater ................. 6.18
Table 6.3 (Updated) Default MCF values and resultant EFs for domestic wastewater by type of treatment system and discharge pathway, j ................................................................................. 6.20
Table 6.4 Estimated BOD5 values in domestic wastewater for selected regions and countries ...................................................................................................................... 6.22
Table 6.5 Suggested values for urbanisation (U) and degree of utilisation of treatment, discharge pathway or method (Ti,j) for each income group for selected countries ...................... 6.24
Table 6.6 Example of the application of default values for degrees of treatment utilisation (T) by income groups ........................................................................................................ 6.26
Table 6.6a (New) Removal of organic component from wastewater as sludge (Krem) according to treatment type .............................................................................................................. 6.27
Table 6.6b (New) Wastewater treatment organics removal fractions (TOWREM) according to treatment type .............................................................................................................................. 6.28
Table 6.7 (Updated) Default uncertainty ranges for domestic wastewater ................................................... 6.29
Table 6.8 (Updated) Default MCF values and resultant EFs for industrial wastewater ............................... 6.34
Table 6.8a (New) Default EF values for domestic and industrial wastewater ......................................... 6.39
Table 6.10a (New) Default factors for domestic wastewater ..................................................................... 6.41
Table 6.10b (New) Estimate on use of food waste disposal in sewer ........................................................ 6.42
Table 6.10c (New) Wastewater treatment nitrogen removal fractions (NREM) according to treatment type .............................................................................................................................. 6.43
Table 6.11 (Updated) N2O methodology default data .................................................................................... 6.43
Table 6.12 (New) Examples of industrial wastewater data ...................................................................... 6.48
Table 6.13 (New) Default uncertainty ranges for industrial wastewater .................................................. 6.49
Table 6Ap.1 (New) Summary of literature investigating fossil organic carbon in wastewater ................... 6.52
Table 6A.1 (New) Summary data for pit latrine use, no sanitation facility, and groundwater use by country ................................................................................................................... 6.54
Table 6A.2 (New) MCFs based on measured CH4 in full-scale domestic wastewater treatment plants ... 6.58
Table 6A.3 (New) Summary of literature investigating methane emissions from wastewater discharge ..................................................................................................................... 6.60
Table 6A.4 (New) Default N2O emission factors for domestic wastewater treatment plants ................... 6.61
Table 6A.5 (New) N2O emission factors in full-scale domestic wastewater treatment plants .................. 6.62
Table 6A.6 (New) List of countries by region included in Table 6.10a .................................................... 6.64
Chapter 6: Wastewater Treatment and Discharge
2019 Refinement to the 2006 IPCC Guidelines for National Greenhouse Gas Inventories 6.7
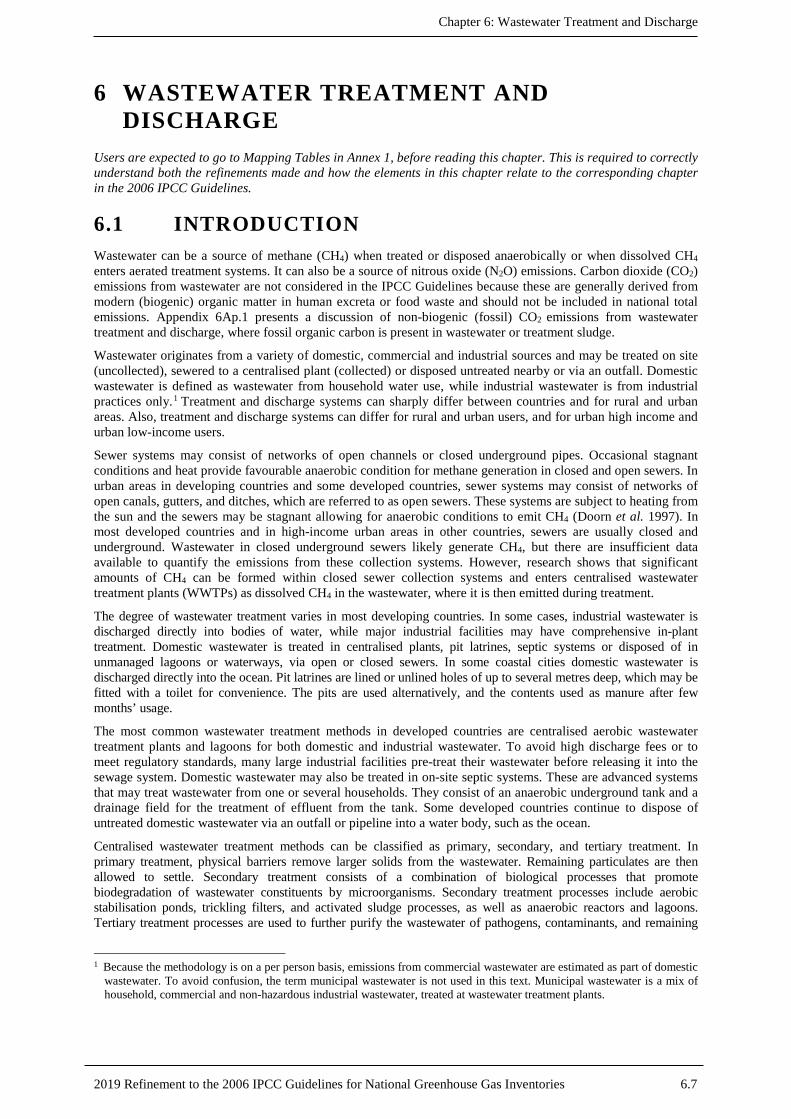
6 WASTEWATER TREATMENT AND DISCHARGE
Users are expected to go to Mapping Tables in Annex 1, before reading this chapter. This is required to correctly understand both the refinements made and how the elements in this chapter relate to the corresponding chapter in the 2006 IPCC Guidelines.
6.1 INTRODUCTION Wastewater can be a source of methane (CH4) when treated or disposed anaerobically or when dissolved CH4 enters aerated treatment systems. It can also be a source of nitrous oxide (N2O) emissions. Carbon dioxide (CO2) emissions from wastewater are not considered in the IPCC Guidelines because these are generally derived from modern (biogenic) organic matter in human excreta or food waste and should not be included in national total emissions. Appendix 6Ap.1 presents a discussion of non-biogenic (fossil) CO2 emissions from wastewater treatment and discharge, where fossil organic carbon is present in wastewater or treatment sludge. Wastewater originates from a variety of domestic, commercial and industrial sources and may be treated on site (uncollected), sewered to a centralised plant (collected) or disposed untreated nearby or via an outfall. Domestic wastewater is defined as wastewater from household water use, while industrial wastewater is from industrial practices only.1 Treatment and discharge systems can sharply differ between countries and for rural and urban areas. Also, treatment and discharge systems can differ for rural and urban users, and for urban high income and urban low-income users.
Sewer systems may consist of networks of open channels or closed underground pipes. Occasional stagnant conditions and heat provide favourable anaerobic condition for methane generation in closed and open sewers. In urban areas in developing countries and some developed countries, sewer systems may consist of networks of open canals, gutters, and ditches, which are referred to as open sewers. These systems are subject to heating from the sun and the sewers may be stagnant allowing for anaerobic conditions to emit CH4 (Doorn et al. 1997). In most developed countries and in high-income urban areas in other countries, sewers are usually closed and underground. Wastewater in closed underground sewers likely generate CH4, but there are insufficient data available to quantify the emissions from these collection systems. However, research shows that significant amounts of CH4 can be formed within closed sewer collection systems and enters centralised wastewater treatment plants (WWTPs) as dissolved CH4 in the wastewater, where it is then emitted during treatment.
The degree of wastewater treatment varies in most developing countries. In some cases, industrial wastewater is discharged directly into bodies of water, while major industrial facilities may have comprehensive in-plant treatment. Domestic wastewater is treated in centralised plants, pit latrines, septic systems or disposed of in unmanaged lagoons or waterways, via open or closed sewers. In some coastal cities domestic wastewater is discharged directly into the ocean. Pit latrines are lined or unlined holes of up to several metres deep, which may be fitted with a toilet for convenience. The pits are used alternatively, and the contents used as manure after few months’ usage.
The most common wastewater treatment methods in developed countries are centralised aerobic wastewater treatment plants and lagoons for both domestic and industrial wastewater. To avoid high discharge fees or to meet regulatory standards, many large industrial facilities pre-treat their wastewater before releasing it into the sewage system. Domestic wastewater may also be treated in on-site septic systems. These are advanced systems that may treat wastewater from one or several households. They consist of an anaerobic underground tank and a drainage field for the treatment of effluent from the tank. Some developed countries continue to dispose of untreated domestic wastewater via an outfall or pipeline into a water body, such as the ocean.
Centralised wastewater treatment methods can be classified as primary, secondary, and tertiary treatment. In primary treatment, physical barriers remove larger solids from the wastewater. Remaining particulates are then allowed to settle. Secondary treatment consists of a combination of biological processes that promote biodegradation of wastewater constituents by microorganisms. Secondary treatment processes include aerobic stabilisation ponds, trickling filters, and activated sludge processes, as well as anaerobic reactors and lagoons. Tertiary treatment processes are used to further purify the wastewater of pathogens, contaminants, and remaining
1 Because the methodology is on a per person basis, emissions from commercial wastewater are estimated as part of domestic
wastewater. To avoid confusion, the term municipal wastewater is not used in this text. Municipal wastewater is a mix of household, commercial and non-hazardous industrial wastewater, treated at wastewater treatment plants.
Volume 5: Waste
6.8 2019 Refinement to the 2006 IPCC Guidelines for National Greenhouse Gas Inventories
nutrients such as nitrogen and phosphorus compounds. This is achieved using one or a combination of processes that can include maturation/polishing ponds, biological processes, advanced filtration, carbon adsorption, ion exchange, and disinfection.
Sludge is produced in all of the primary, secondary and tertiary stages of treatment. Sludge that is produced in primary treatment consists of solids that are removed from the wastewater.
Sludge produced in secondary and tertiary treatment results from biological growth in the biomass, as well as the collection of small particles. This sludge must be treated further before it can be safely disposed of. Methods of sludge treatment include aerobic and anaerobic stabilisation (digestion), conditioning, centrifugation, composting, and drying. Some sludge is incinerated before land disposal. Emissions from anaerobic sludge digestion, where the digester’s primary use is for treatment of wastewater treatment solids, should be reported under Wastewater Treatment. Land disposal, composting, and incineration of sludge is considered in Volume 5, Section 2.3.2 in Chapter 2, Waste Generation, Composition, and Management Data, Section 3.2 in Chapter 3, Solid Waste Disposal, Section 4.1 in Chapter 4, Biological Treatment and Disposal, and Chapter 5, Incineration and Open Burning of Waste, respectively. N2O emissions from sludge and wastewater spread on agricultural land are considered in Section 11.2, N2O emissions from managed soils, in Chapter 11, N2O Emissions from Managed Soils, and CO2 Emissions from Lime and Urea Application, in Volume 4 of the Agriculture, Forestry, and Other Land Use (AFOLU) Sector.
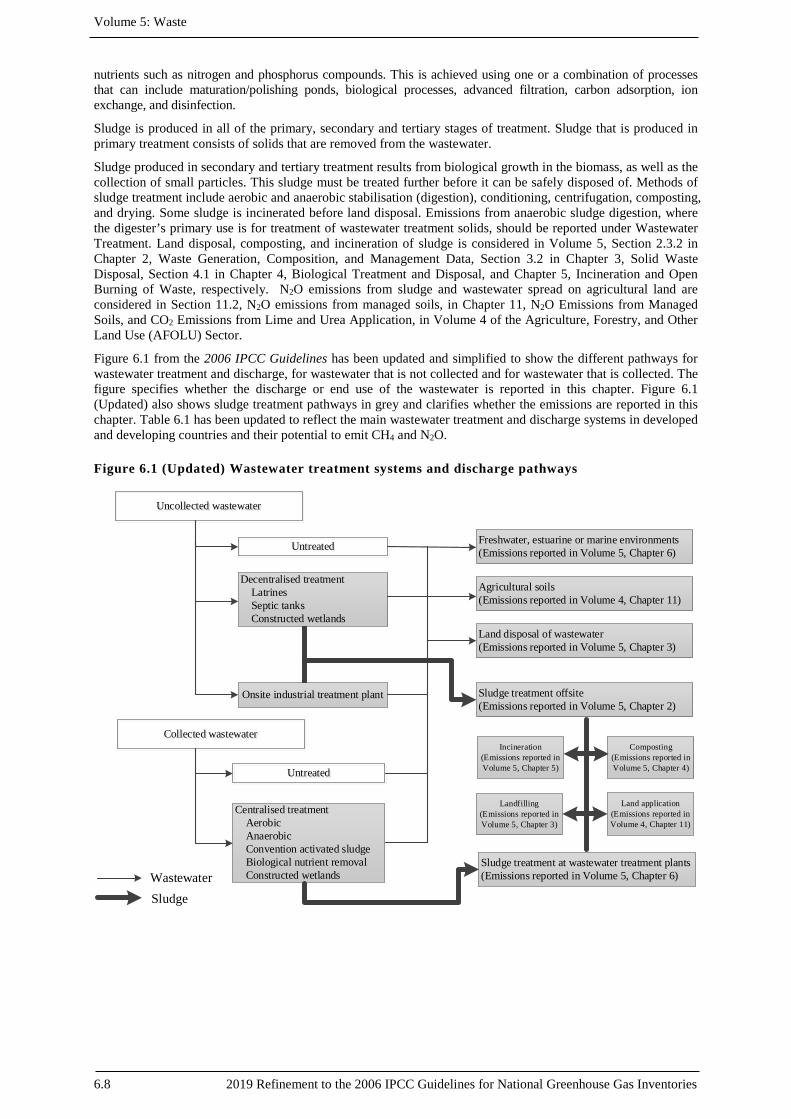
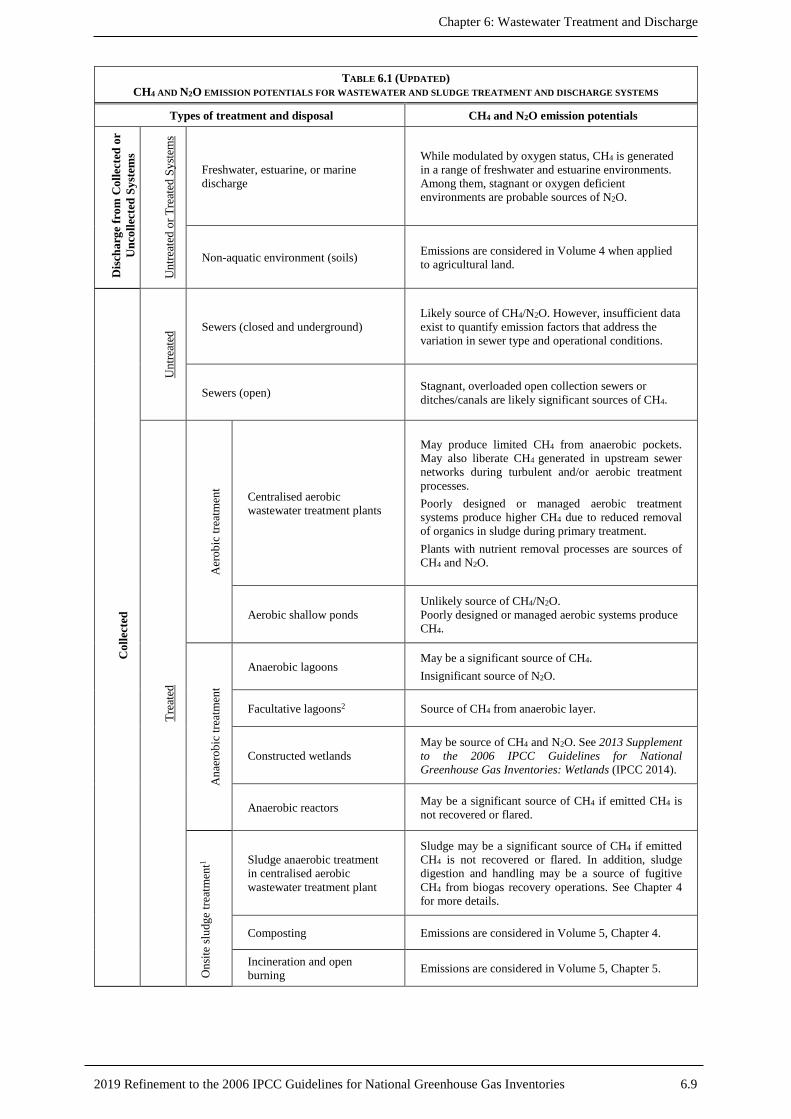
Figure 6.1 from the 2006 IPCC Guidelines has been updated and simplified to show the different pathways for wastewater treatment and discharge, for wastewater that is not collected and for wastewater that is collected. The figure specifies whether the discharge or end use of the wastewater is reported in this chapter. Figure 6.1 (Updated) also shows sludge treatment pathways in grey and clarifies whether the emissions are reported in this chapter. Table 6.1 has been updated to reflect the main wastewater treatment and discharge systems in developed and developing countries and their potential to emit CH4 and N2O.
Figure 6.1 (Updated) Wastewater treatment systems and discharge pathways
Decentralised treatment Latrines Septic tanks Constructed wetlands
Onsite industrial treatment plant
Uncollected wastewater
Collected wastewater
Centralised treatment Aerobic Anaerobic Convention activated sludge Biological nutrient removal Constructed wetlands
Untreated
Freshwater, estuarine or marine environments(Emissions reported in Volume 5, Chapter 6)
Agricultural soils(Emissions reported in Volume 4, Chapter 11)
Land disposal of wastewater(Emissions reported in Volume 5, Chapter 3)
Sludge treatment offsite(Emissions reported in Volume 5, Chapter 2)
Incineration(Emissions reported in Volume 5, Chapter 5)
Composting(Emissions reported in Volume 5, Chapter 4)
Landfilling(Emissions reported in Volume 5, Chapter 3)
Land application(Emissions reported in Volume 4, Chapter 11)
Sludge treatment at wastewater treatment plants(Emissions reported in Volume 5, Chapter 6)Wastewater
Sludge
Untreated
Chapter 6: Wastewater Treatment and Discharge
2019 Refinement to the 2006 IPCC Guidelines for National Greenhouse Gas Inventories 6.9
TABLE 6.1 (UPDATED) CH4 AND N2O EMISSION POTENTIALS FOR WASTEWATER AND SLUDGE TREATMENT AND DISCHARGE SYSTEMS
Types of treatment and disposal CH4 and N2O emission potentials D
isch
arge
from
Col
lect
ed o
r U
ncol
lect
ed S
yste
ms
Unt
reat
ed o
r Tre
ated
Sys
tem
s Freshwater, estuarine, or marine discharge
While modulated by oxygen status, CH4 is generated in a range of freshwater and estuarine environments. Among them, stagnant or oxygen deficient environments are probable sources of N2O.
Non-aquatic environment (soils) Emissions are considered in Volume 4 when applied to agricultural land.
Col
lect
ed
Unt
reat
ed Sewers (closed and underground)
Likely source of CH4/N2O. However, insufficient data exist to quantify emission factors that address the variation in sewer type and operational conditions.
Sewers (open) Stagnant, overloaded open collection sewers or ditches/canals are likely significant sources of CH4.
Trea
ted
Aer
obic
trea
tmen
t
Centralised aerobic wastewater treatment plants
May produce limited CH4 from anaerobic pockets. May also liberate CH4 generated in upstream sewer networks during turbulent and/or aerobic treatment processes. Poorly designed or managed aerobic treatment systems produce higher CH4 due to reduced removal of organics in sludge during primary treatment. Plants with nutrient removal processes are sources of CH4 and N2O.
Aerobic shallow ponds Unlikely source of CH4/N2O. Poorly designed or managed aerobic systems produce CH4.
Ana
erob
ic tr
eatm
ent
Anaerobic lagoons May be a significant source of CH4. Insignificant source of N2O.
Facultative lagoons2 Source of CH4 from anaerobic layer.
Constructed wetlands May be source of CH4 and N2O. See 2013 Supplement to the 2006 IPCC Guidelines for National Greenhouse Gas Inventories: Wetlands (IPCC 2014).
Anaerobic reactors May be a significant source of CH4 if emitted CH4 is not recovered or flared.
Ons
ite sl
udge
trea
tmen
t1 Sludge anaerobic treatment in centralised aerobic wastewater treatment plant
Sludge may be a significant source of CH4 if emitted CH4 is not recovered or flared. In addition, sludge digestion and handling may be a source of fugitive CH4 from biogas recovery operations. See Chapter 4 for more details.
Composting Emissions are considered in Volume 5, Chapter 4.
Incineration and open burning Emissions are considered in Volume 5, Chapter 5.

Volume 5: Waste
6.10 2019 Refinement to the 2006 IPCC Guidelines for National Greenhouse Gas Inventories
TABLE 6.1 (UPDATED) (CONTINUED) CH4 AND N2O EMISSION POTENTIALS FOR WASTEWATER AND SLUDGE TREATMENT AND DISCHARGE SYSTEMS
Types of treatment and disposal CH4 and N2O emission potentials U
ncol
lect
ed
Septic tanks (without dispersion field) Source of CH4.
Frequent solids removal reduces CH4 production.
Septic system (including a septic tank and a soil dispersal system)
Source of CH4 (tank) and N2O (soil dispersal system). Frequent solids removal reduces CH4 production.
Open pits/Latrines Pits/latrines are likely to produce CH4 when temperature and retention time are favourable.
1 For onsite sludge treatment, see Chapters 4 and 5 for emissions methodology, but note that emissions for onsite systems should be reported under the Wastewater Treatment and Discharge category. 2 Facultative organisms can function in the presence or absence of molecular oxygen. In a facultative lagoon, the layer of water near the surface contains dissolved oxygen due to atmospheric reaeration and algal respiration, a condition that supports aerobic and facultative organisms. The bottom layer of the lagoon includes sludge deposits and supports anaerobic organisms. The intermediate anoxic layer–the facultative zone–ranges from aerobic near the top to anaerobic at the bottom (US EPA 2002b).
6.1.1 Centralised treatment systems Centralised wastewater treatment systems may include a variety of treatment processes spanning the hierarchy of treatment levels. Primary treatment involves mechanical processes such as screening, grit removal and sedimentation. Secondary treatment involves biological processes in which microorganisms convert inorganic and organic nutrients into settleable solids which can be removed by sedimentation and degradation metabolites which are transferred to the atmosphere. Secondary biological treatment processes may be augmented with chemical disinfection. Commonly used secondary treatment processes include activated sludge, trickling filters and lagoons. In some countries simple disinfection process concludes tertiary treatment; however, elsewhere more advanced tertiary treatment involves the use of enhanced biological nutrient removal processes (nitrification–denitrification), and other advanced physical and chemical processes.
Wastewater treatment processes can range from simple technologies such as lagooning and wetlands, to more technologically advanced treatment technology designed for stringent nutrient removal. Wetlands can be constructed or semi-natural systems and may be used as the primary method of wastewater treatment, or as a polishing treatment step following settling and biological treatment. Constructed wetlands develop natural processes that involve vegetation, soil, and associated microbial assemblages to trap and treat incoming contaminants through a combination of biodegradation, volatilisation, sorption and sedimentation process (IPCC 2014).
Sewer collection systems provide an environment conducive to the formation of CH4, which can be substantial depending on the configuration and operation of the collection system (Guisasola et al. 2008). Recent research has shown that at least a portion of CH4 formed with the collection system enters the centralised system where it contributes to CH4 emissions from the treatment system (Foley et al. 2015). Although there are insufficient data to quantify emissions directly from the sewer collection system, the emission factors presented for centralised treatment plants account for dissolved methane entering the treatment systems.
Soluble organic matter is generally removed using biological processes in which microorganisms consume the organic matter for maintenance and growth. The resulting biomass (sludge) is removed from the effluent prior to discharge to receiving environments. Microorganisms can biodegrade soluble organic material in wastewater under aerobic and/or anaerobic conditions, where the latter condition produces CH4. During collection and treatment, wastewater may be accidentally or deliberately managed under anaerobic conditions. In addition, the sludge may be further biodegraded under aerobic or anaerobic conditions, such as with anaerobic digestion.
The generation of N2O may also result from the treatment of domestic wastewater during both nitrification and denitrification of the nitrogen (N) present, usually in the form of urea, proteins, and ammonia. Ammonia N is converted to nitrate (NO3
−) through the aerobic process of nitrification. Denitrification occurs under anoxic/anaerobic conditions, whereby aerobic or facultative organisms reduce oxidized forms of nitrogen (e.g., nitrite, nitrate) in the absence of free oxygen to produce nitrogen gas (N2). N2O is an intermediate product of both nitrification and denitrification processes. No matter where N2O is formed it is usually stripped to the air in aerated parts of the treatment process.
A common example of a centralised treatment system configuration is an activated sludge wastewater treatment system. Following grit removal and primary treatment for solids removal, wastewater is sent to an activated sludge reactor for carbonaceous biochemical oxygen demand removal, followed by secondary clarification where solids are allowed to settle from the wastewater. Clarified effluent may be disinfected prior to discharge.
Chapter 6: Wastewater Treatment and Discharge
2019 Refinement to the 2006 IPCC Guidelines for National Greenhouse Gas Inventories 6.11
Secondary clarifier sludge is pumped out from the bottom of the clarifier. Of this sludge, a portion is sent back to the activated sludge treatment process (return activated sludge) and the remainder (waste activated sludge) is combined with primary treatment sludge before being sent to sludge handling (such as gravity thickening). The thickened sludge may also be processed onsite in an anaerobic digester followed by further dewatering, such as by centrifuge. Recovered wastewater from thickening and dewatering operations, such as filtrate from the gravity thickener or centrate from the centrifuge) are returned to the influent stream at the headworks to the wastewater treatment system.
CH4 generated in the sewer system enters the treatment plant as dissolved methane and is emitted during turbulent/aerated treatment steps (Daelman et al. 2012). Although the CH4 emissions from centralised aerobic plants may be small, they are not zero and may be substantial for some plants receiving sewage from expansive sewer networks (Willis 2017). In addition, anaerobic conditions can form within the treatment system increasing the potential for CH4 generation from an otherwise aerobic system. These refinements introduce a new MCF associated with these systems, as well as a revised N2O emission factor for centralised wastewater treatment systems.
Occasionally wastewater treatment plants could be hydraulically or organically overloaded, resulting in degraded plant performance. In these cases, organic matter and nutrients that would normally be removed by the treatment system instead pass through untreated and are discharged to the aquatic environment. The 2006 IPCC Guidelines previously provided different emission factors for “well managed” centralised aerobic treatment systems versus “not well managed” centralised aerobic treatment systems. However, these refinements remove those factors and instead provide one factor for these types of systems. In the case of overloaded systems, the amount of organics removed by the system in sludge (S) should reflect the performance achieved by the system.
6.1.2 Decentralised treatment systems of domestic wastewater (onsite sanitation)
Depending on national circumstances, domestic wastewater not connected to a centralised wastewater treatment plant may be directly discharged in natural aquatic environments (rivers, lakes, oceans, etc.) or treated using onsite sanitation. The most common onsite treatment systems are holding tanks, septic systems and latrines.
A septic system is usually composed of a septic tank, generally buried in the ground, and a soil dispersal system. Solids and dense materials contained in the incoming wastewater (influent) settle in the septic tanks as sludge. Floatable material (scum) is also retained in the tank. The sludge settled on the bottom of the tank undergoes anaerobic digestion. Partially treated water is discharged in the dispersal system. The liquid fraction remains in the tank for only a short period, with the hydraulic retention time (HRT) varying from 24 to 72 hours depending on tank volume and hydraulic load. The solid fraction accumulates and remains in the tank for several years, during which time it degrades anaerobically. The solids retention time (SRT) depends on the sludge withdrawal frequency. The gas produced from anaerobic sludge digestion (mainly CH4 and largely biogenic CO2) rise to the liquid surface and are usually released through vents. Gases produced in the effluent dispersal system (mainly N2O and biogenic CO2) are released through the soil.
A latrine usually consists of a slab over a pit which may be two metres or more in depth. A wide range of configuration options exists for latrines (simple pit latrines, ventilated latrines, composting latrines, etc.) having in common that little (e.g., pour flush latrines) or no water is used to flush excreta into the pit. Pit latrines are utilised by more than 1.5 billion people throughout the world, especially in low-income countries (see new Figure 6.1a and new Annex 6A.1). Pit latrine gaseous emissions depend in part on local groundwater level. Anaerobic conditions favourable to CH4 emissions occur when the water table is high and the organic waste in the pit is submerged.
In the absence of latrines, people resort to open defecation. Open defecation is not considered as a source of CH4, as anaerobic conditions are considered unlikely.
In some high-income countries, onsite aerated wastewater treatment systems are used and enable a more advanced level of treatment than septic tanks in reducing the load of organics and nutrients in domestic effluent. The process usually involves a first step of sedimentation and anaerobic digestion, a second step of aerobic treatment and last step of clarification and disinfection. The treated effluent is discharged into the environment via surface irrigation or infiltration through an absorption trench.

Volume 5: Waste
6.12 2019 Refinement to the 2006 IPCC Guidelines for National Greenhouse Gas Inventories
Figure 6.1a (New) Percentage of low-income country populations using pit latrines as a primary sanitation facility (Graham & Polizzotto 2013)
6.1.3 Emissions from receiving waters Dissolved CH4 and N2O that is generated in sewers, or present in untreated or treated discharges, has the potential to be released (Short et al. 2014; Short et al. 2017). A strong correlation between the condition of the aquatic environment and the generation of CH4 and N2O has been observed (e.g., Smith et al. 2017). Therefore, where wastewater is then discharged to aquatic environments with nutrient-impacted/eutrophic conditions (i.e., water bodies which are rich in nutrients and very productive in terms of aquatic animal and plant life), the additional organic matter in the discharged wastewater is expected to increase emissions. Many waterways are naturally eutrophic, while others have been altered by human impacts and are subject to eutrophication as a result. Surface marine waters are typically supersaturated (Ward et al. 1987; Conrad & Seiler 1988) and freshwaters highly supersaturated (Stanley et al. 2016) with CH4 irrespective of their trophic state, so this refinement does not distinguish between eutrophic and oligotrophic receiving waters, but it does distinguish between default waters (rivers and streams) and lakes and reservoirs where CH4 emissions are higher.
6.1.4 Changes compared to 1996 Guidelines and Good Practice Guidance
No refinement.
6.1.5 Changes compared to 2006 IPCC Guidelines The 2006 IPCC Guidelines included combined equations to estimate CH4 emissions from wastewater and from sludge removed from the wastewater. However, in some cases, this combined equation caused confusion among inventory compilers when calculating CH4 emissions from aerobic systems with anaerobic sludge digestion. In these cases, some compilers estimated zero CH4 emissions from well operated wastewater treatment systems, and then subtracted emissions associated with sludge digestion operations without first estimating the CH4 emissions from sludge treatment, resulting in negative emissions. In this refinement, we discuss the proper way to use the equation in such situations, and we present an update to provide guidance on the calculation of the organic component removed in sludge. Countries must estimate the amount (mass) of sludge they generate from wastewater treatment and default data are provided for a number of countries. With this additional guidance, the use of a default value of zero for sludge removal from aerobic treatment systems and septic systems is no longer applicable.
In addition, certain emission factors for CH4 emissions from domestic and industrial wastewater treatment have been updated to reflect additional measurement data on emissions from septic systems and centralised WWTPs. Furthermore, the CH4 emission factors for wastewater discharged to aquatic environments have been updated and a new emission factor for discharge to reservoirs, lakes, and estuaries is introduced. The calculation of CH4 emissions from effluent discharged to aquatic systems has been updated to include the discharge of treated effluent and to reflect the removal of organics that occurs during treatment.
Chapter 6: Wastewater Treatment and Discharge
2019 Refinement to the 2006 IPCC Guidelines for National Greenhouse Gas Inventories 6.13
The 2019 Refinement also includes new guidance on how to estimate N2O emissions from domestic and industrial wastewater and presents updated guidance to estimate N2O emissions from centralised WWTPs. Furthermore, the N2O emission factors for wastewater discharged to aquatic environments have been updated and the calculation of N2O emissions from effluent discharged to aquatic systems has been updated to reflect the removal of nitrogen that occurs during treatment.
6.2 METHANE EMISSIONS FROM WASTEWATER
6.2.1 Methodological issues Emissions are a function of the amount of organic waste generated and an emission factor that characterises the extent to which this waste generates CH4.
Three tier methods for CH4 from this category are summarised below:
The Tier 1 method applies default values for the emission factor and activity parameters. This method is considered good practice for countries with limited data.
The Tier 2 method follows the same method as Tier 1 but allows for incorporation of a country specific emission factor and country specific activity data. For example, a specific emission factor for a prominent treatment system based on field measurements could be incorporated under this method. The amount of sludge removed for incineration, landfills, composting, and agricultural land should be taken into consideration. In addition, countries that are able to categorize wastewater discharge by the type of waterbody should use Tier 2 emission factors for estimating emissions from discharge.
For a country with good data and advanced methodologies, a country specific method could be applied as a Tier 3 method. For example, a more advanced country-specific method could be based on plant-specific data from large wastewater treatment facilities, using country-specific measurements of organics discharged to aquatic environments, or may draw on country-specific water quality data for aquatic environments receiving wastewater inputs.
Wastewater treatment facilities that receive wastewater from collection systems, particularly pressurized sewers and gravity-fed sewers that are closed, can liberate CH4 in aerobic systems from dissolved CH4 that enters the treatment system (Daelman et al. 2012; Short et al. 2017).
Wastewater treatment facilities can include anaerobic process steps. CH4 generated at such facilities can be recovered and combusted in a flare or energy device. The amount of CH4 that is flared or recovered for energy use should be subtracted from total emissions through the use of a separate CH4 recovery parameter. The amount of CH4 which is recovered or flared is expressed as R in updated Equation 6.1. R refers to CH4 recovered from wastewater treatment, such as methane captured on filters exhausted from covered (anaerobic) treatment ponds, as well as CH4 recovered from anaerobic sludge digestion. The approach to estimation of emissions from wastewater treatment in this chapter covers all emission sources and sinks (recovery) at a wastewater treatment plant.
Note that only a few countries may have sludge removal data and CH4 recovery data. The information on sludge generation has improved and statistical data on sludge can be found in databases of Eurostat and Organization for Economic Co-operation and Development (OECD). The lack of data for CH4 recovery was taken into account in this refinement by recommending the use of the methodology in Section 4.1, Chapter 4 of Volume 5, 2006 IPCC Guidelines which estimates emissions on the basis of total sludge anaerobically digested; thus, the information on R is not required in this calculation. Default sludge removal factors are provided in this refinement. The default for CH4 recovery is zero. If a country selects to report CH4 recovery, it is good practice to distinguish between flaring and CH4 recovery for energy generation, which should be reported in the Energy Sector taking into account the avoidance of double counting emissions from flaring and energy used.
Emissions from flaring are not significant, as the majority of CO2 emissions are of biogenic origin, and the CH4 and N2O emissions are very small so good practice in the Waste Sector does not require their estimation. However, if it is wished to do so these emissions should be reported under the Waste Sector. A discussion of emissions from flares and more detailed information are given in Volume 2, Energy, Chapter 4.2. Emission from flaring is not treated at Tier 1.
Volume 5: Waste
6.14 2019 Refinement to the 2006 IPCC Guidelines for National Greenhouse Gas Inventories
6.2.2 Domestic wastewater
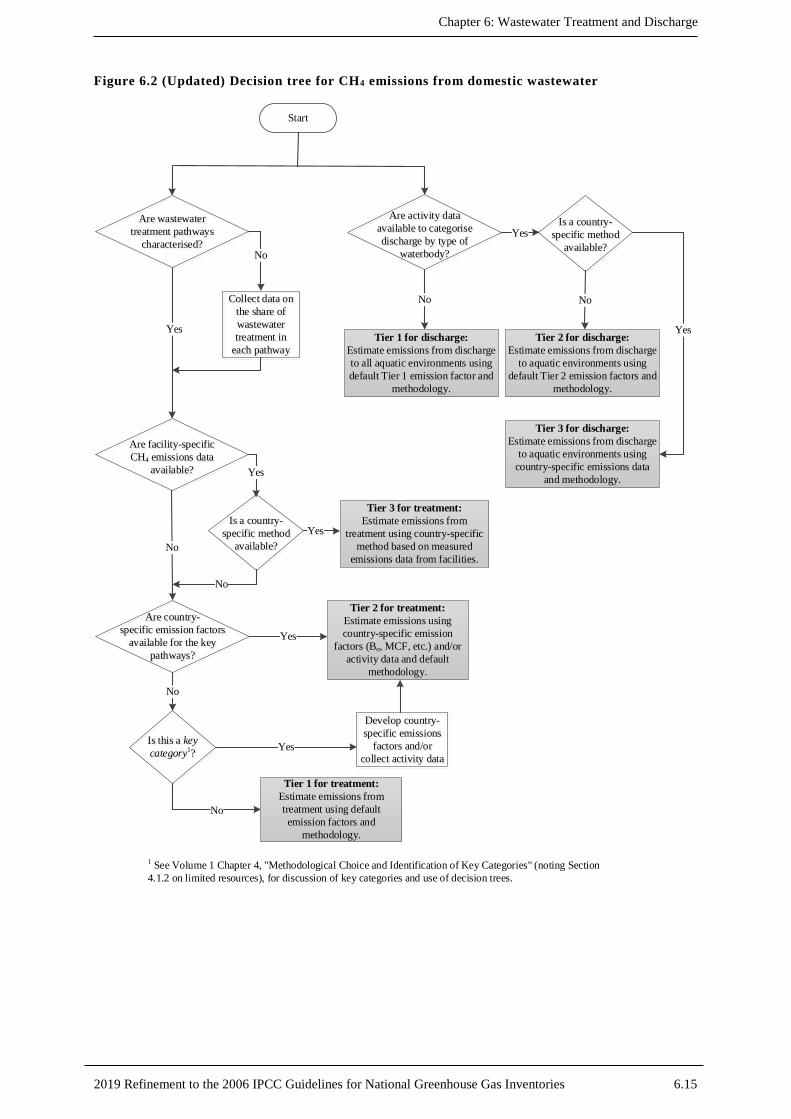
6.2.2.1 CHOICE OF METHOD An updated decision tree for domestic wastewater is included as updated Figure 6.2 and should be used to determine the tier approach that is applicable to the country.
This section is an update to the 2006 IPCC Guidelines. In general, the overall steps for good practice in inventory preparation for CH4 from domestic wastewater have been updated as follows:
Chapter 6: Wastewater Treatment and Discharge
2019 Refinement to the 2006 IPCC Guidelines for National Greenhouse Gas Inventories 6.15
Figure 6.2 (Updated) Decision tree for CH4 emissions from domestic wastewater
Collect data on the share of wastewater treatment in
each pathway
Tier 3 for treatment:Estimate emissions from
treatment using country-specific method based on measured
emissions data from facilities.
Tier 2 for treatment: Estimate emissions using country-specific emission
factors (Bo, MCF, etc.) and/or activity data and default
methodology.
Develop country-specific emissions
factors and/or collect activity data
Are wastewater treatment pathways
characterised?
Is a country- specific method
available?
Is this a key category1?
1 See Volume 1 Chapter 4, "Methodological Choice and Identification of Key Categories" (noting Section 4.1.2 on limited resources), for discussion of key categories and use of decision trees.
Start
Are facility-specific CH4 emissions data
available?
Are country-specific emission factors
available for the key pathways?
Are activity data available to categorise discharge by type of
waterbody?
Tier 1 for treatment: Estimate emissions from treatment using default emission factors and
methodology.
Tier 1 for discharge:Estimate emissions from discharge to all aquatic environments using default Tier 1 emission factor and
methodology.
Yes
Yes
Yes
Yes
No
No
No
YesIs a country-
specific method available?
No
No
No
No
Yes
YesTier 2 for discharge:
Estimate emissions from discharge to aquatic environments using
default Tier 2 emission factors and methodology.
Tier 3 for discharge:Estimate emissions from discharge
to aquatic environments using country-specific emissions data
and methodology.
Volume 5: Waste
6.16 2019 Refinement to the 2006 IPCC Guidelines for National Greenhouse Gas Inventories
Step 1: Use updated Equation 6.3 to estimate organically degradable material TOW in wastewater prior to treatment. Use new Equation 6.3a to estimate total organics in domestic wastewater for each wastewater treatment/discharge pathway or system, j (TOWj). Use new Equation 6.3d to estimate total organics in treated wastewater effluent discharged (TOWEFFtreat).
Step 2: Use new Equations 6.3b and 6.3c to estimate the amount of organic component removed in sludge, S, from aerobic treatment plants and septic systems.
Step 3: Select the pathway and systems (see updated Figure 6.1) according to country activity data. Use Equation 6.2 or the updated Table 6.3 to obtain the emission factor for each domestic wastewater treatment/discharge pathway or system.
Step 4: Use updated Equation 6.1 to estimate emissions and adjust for possible sludge removal and/or CH4 recovery of treatment/discharge pathway or system, j, in inventory year. Use new Equation 6.1a to sum the emissions across all treatment/discharge pathways or systems.
Step 5: Use Equation 4.1 and emission factors in Table 4.1 to estimate methane emissions from anaerobic digestion of sludge.
To determine the use of each type of treatment or discharge system, it is good practice to refer to national statistics (e.g., from regulatory authorities). If these data are not available, wastewater associations or international organisations such as the World Health Organization (WHO) may have data on the system usage.
Otherwise, consultation with sanitation experts can help, and expert judgment can also be applied (see Chapter 2, Approaches to Data Collection, in Volume 1). Urbanisation statistics may provide a useful tool, e.g., city sizes and income distribution.
These updates are presented because, in some cases, the original Equation 6.1 caused confusion among inventory compilers when calculating CH4 emissions across multiple wastewater treatment/discharge pathways or systems across multiple income groups. These updates allow for a more stepwise process in estimating emissions throughout the country.
It is good practice for countries to treat the wastewater treatment system and onsite sludge treatment system as separate pathways. As an example, for an activated sludge treatment process, calculate the emissions directly associated with the aerobic treatment system as one pathway, and calculate the emissions and report any CH4 recovery directly associated with the anaerobic sludge digestion system as a separate pathway using the emissions methodology provided in Table 4.1, Chapter 4 of Volume 5. Net emissions from both systems should be summed together and reported under wastewater treatment and discharge. In no circumstances should a country report negative emissions. As discussed in Chapter 4, the reporting of anaerobic digestion of sludge is under biological treatment only if transferred from the wastewater treatment plant to anaerobic facilities co-digesting sludge with MSW or other waste.
It is important that CH4 emissions from sludge that is managed using landfills, incineration, composting, biogas production, or used in agriculture are not included in the wastewater treatment and discharge category. The data should be consistent across the sectors, and categories, amount disposed at SWDS, applied to agricultural land, incinerated or used elsewhere should be equal to the amount organic component removed as sludge in updated Equation 6.1. Wastewater and sludge that is applied on agricultural land should be considered in Volume 4 for AFOLU Sector, Section 11.2, N2O emissions from managed soils, in Chapter 11, N2O Emissions from Managed Soils, and CO2 Emissions from Lime and Urea Application.
Wastewater treatment system/pathway usage often differs for rural and urban residents. Also, in developing countries, there are likely to be differences between urban high-income and urban low-income residents. Hence, emissions are calculated by each income group fraction. It is good practice to treat the three categories: rural population, urban high-income population, and urban low-income population separately. It is suggested to use a spreadsheet, as shown in Table 6.5.
Equation 6.1 should be used to estimate CH4 emissions from every treatment system and discharge pathway j (hereafter referred to as treatment/discharge pathway or system), presented in Table 6.3 (Updated) that are appropriate for the country, including the discharge of treated or untreated wastewater.
CH4 emissions from the following discharge pathways must be considered in the inventory for treated and untreated wastewaters (if occurring in the country):
• Discharge to reservoirs, lakes, and estuaries;
• Discharge to aquatic environments other than to reservoirs, lakes, and estuaries;
• Discharge to sewers (with a distinction between stagnant and flowing (open or closed) sewers).
Chapter 6: Wastewater Treatment and Discharge
2019 Refinement to the 2006 IPCC Guidelines for National Greenhouse Gas Inventories 6.17
For the discharge of treated wastewater, the TOW should reflect the organics in the wastewater as discharged (see Equation 6.3d (New). As noted in the table, discharges to soil should be reported in Volume 4.
CH4 emissions from the following wastewater treatment systems must be considered in the inventory (if occurring in the country):
• Centralised, aerobic treatment plant;
• Anaerobic reactor (e.g., upflow anaerobic sludge blanket digestion (UASB));
• Anaerobic lagoons (with a distinction between shallow and facultative lagoons and deep lagoons);
• Constructed wetlands;
• Septic systems (with a distinction between stand-alone septic tanks and septic tanks with land dispersal field);
• Latrines (depending of the climate).
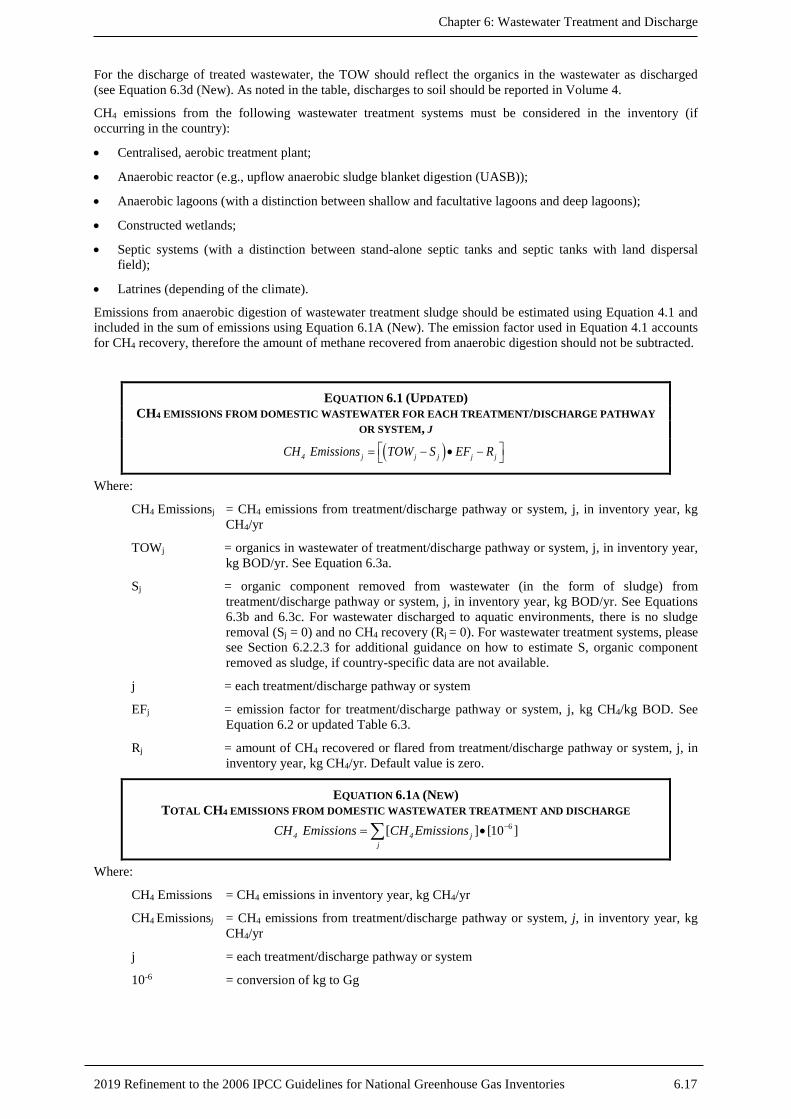
Emissions from anaerobic digestion of wastewater treatment sludge should be estimated using Equation 4.1 and included in the sum of emissions using Equation 6.1A (New). The emission factor used in Equation 4.1 accounts for CH4 recovery, therefore the amount of methane recovered from anaerobic digestion should not be subtracted.
EQUATION 6.1 (UPDATED) CH4 EMISSIONS FROM DOMESTIC WASTEWATER FOR EACH TREATMENT/DISCHARGE PATHWAY
OR SYSTEM, J
( )4 j j j j jCH Emissions TOW S EF R = − • −
Where:
CH4 Emissionsj = CH4 emissions from treatment/discharge pathway or system, j, in inventory year, kg CH4/yr
TOWj = organics in wastewater of treatment/discharge pathway or system, j, in inventory year, kg BOD/yr. See Equation 6.3a.
Sj = organic component removed from wastewater (in the form of sludge) from treatment/discharge pathway or system, j, in inventory year, kg BOD/yr. See Equations 6.3b and 6.3c. For wastewater discharged to aquatic environments, there is no sludge removal (Sj = 0) and no CH4 recovery (Rj = 0). For wastewater treatment systems, please see Section 6.2.2.3 for additional guidance on how to estimate S, organic component removed as sludge, if country-specific data are not available.
j = each treatment/discharge pathway or system
EFj = emission factor for treatment/discharge pathway or system, j, kg CH4/kg BOD. See Equation 6.2 or updated Table 6.3.
Rj = amount of CH4 recovered or flared from treatment/discharge pathway or system, j, in inventory year, kg CH4/yr. Default value is zero.
EQUATION 6.1A (NEW) TOTAL CH4 EMISSIONS FROM DOMESTIC WASTEWATER TREATMENT AND DISCHARGE
6[ ] [10 ]4 4 jj
CH Emissions CH Emissions −= •∑
Where:
CH4 Emissions = CH4 emissions in inventory year, kg CH4/yr
CH4 Emissionsj = CH4 emissions from treatment/discharge pathway or system, j, in inventory year, kg CH4/yr
j = each treatment/discharge pathway or system
10-6 = conversion of kg to Gg
Volume 5: Waste
6.18 2019 Refinement to the 2006 IPCC Guidelines for National Greenhouse Gas Inventories
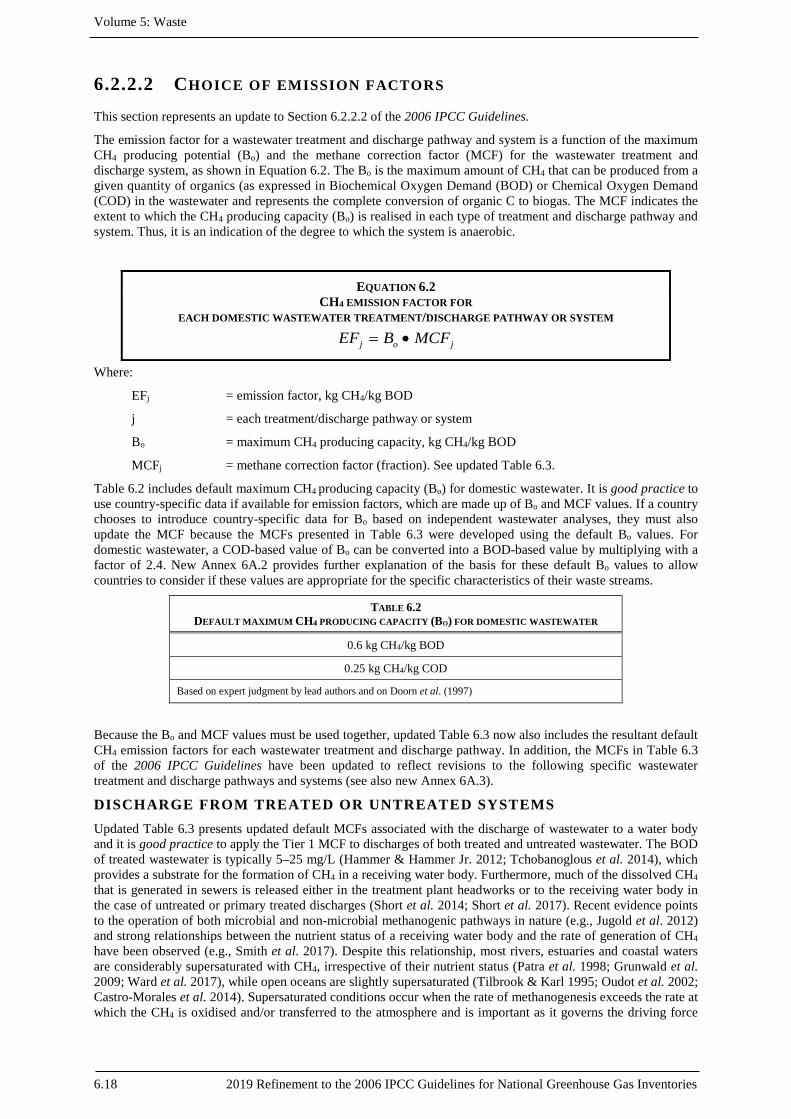
6.2.2.2 CHOICE OF EMISSION FACTORS This section represents an update to Section 6.2.2.2 of the 2006 IPCC Guidelines.
The emission factor for a wastewater treatment and discharge pathway and system is a function of the maximum CH4 producing potential (Bo) and the methane correction factor (MCF) for the wastewater treatment and discharge system, as shown in Equation 6.2. The Bo is the maximum amount of CH4 that can be produced from a given quantity of organics (as expressed in Biochemical Oxygen Demand (BOD) or Chemical Oxygen Demand (COD) in the wastewater and represents the complete conversion of organic C to biogas. The MCF indicates the extent to which the CH4 producing capacity (Bo) is realised in each type of treatment and discharge pathway and system. Thus, it is an indication of the degree to which the system is anaerobic.
EQUATION 6.2 CH4 EMISSION FACTOR FOR
EACH DOMESTIC WASTEWATER TREATMENT/DISCHARGE PATHWAY OR SYSTEM
j o jEF B MCF= •
Where:
EFj = emission factor, kg CH4/kg BOD
j = each treatment/discharge pathway or system
Bo = maximum CH4 producing capacity, kg CH4/kg BOD
MCFj = methane correction factor (fraction). See updated Table 6.3.
Table 6.2 includes default maximum CH4 producing capacity (Bo) for domestic wastewater. It is good practice to use country-specific data if available for emission factors, which are made up of Bo and MCF values. If a country chooses to introduce country-specific data for Bo based on independent wastewater analyses, they must also update the MCF because the MCFs presented in Table 6.3 were developed using the default Bo values. For domestic wastewater, a COD-based value of Bo can be converted into a BOD-based value by multiplying with a factor of 2.4. New Annex 6A.2 provides further explanation of the basis for these default Bo values to allow countries to consider if these values are appropriate for the specific characteristics of their waste streams.
TABLE 6.2 DEFAULT MAXIMUM CH4 PRODUCING CAPACITY (BO) FOR DOMESTIC WASTEWATER
0.6 kg CH4/kg BOD
0.25 kg CH4/kg COD
Based on expert judgment by lead authors and on Doorn et al. (1997)
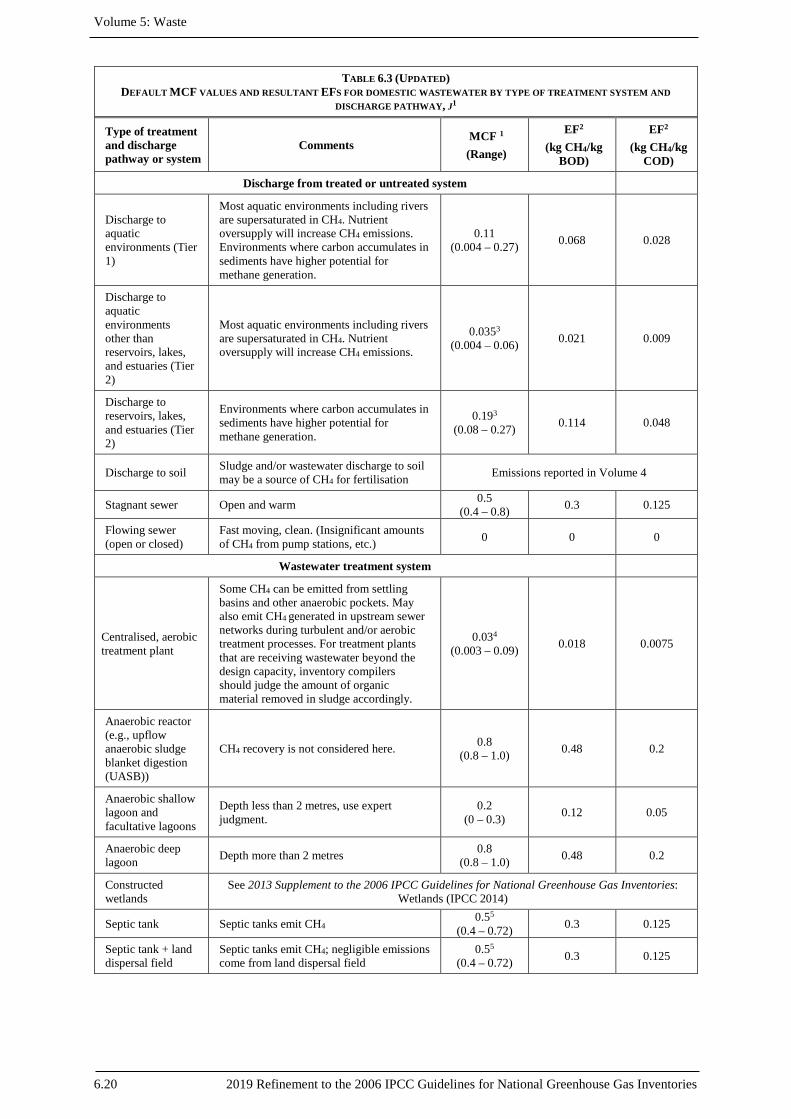
Because the Bo and MCF values must be used together, updated Table 6.3 now also includes the resultant default CH4 emission factors for each wastewater treatment and discharge pathway. In addition, the MCFs in Table 6.3 of the 2006 IPCC Guidelines have been updated to reflect revisions to the following specific wastewater treatment and discharge pathways and systems (see also new Annex 6A.3).
DISCHARGE FROM TREATED OR UNTREATED SYSTEMS Updated Table 6.3 presents updated default MCFs associated with the discharge of wastewater to a water body and it is good practice to apply the Tier 1 MCF to discharges of both treated and untreated wastewater. The BOD of treated wastewater is typically 5–25 mg/L (Hammer & Hammer Jr. 2012; Tchobanoglous et al. 2014), which provides a substrate for the formation of CH4 in a receiving water body. Furthermore, much of the dissolved CH4 that is generated in sewers is released either in the treatment plant headworks or to the receiving water body in the case of untreated or primary treated discharges (Short et al. 2014; Short et al. 2017). Recent evidence points to the operation of both microbial and non-microbial methanogenic pathways in nature (e.g., Jugold et al. 2012) and strong relationships between the nutrient status of a receiving water body and the rate of generation of CH4 have been observed (e.g., Smith et al. 2017). Despite this relationship, most rivers, estuaries and coastal waters are considerably supersaturated with CH4, irrespective of their nutrient status (Patra et al. 1998; Grunwald et al. 2009; Ward et al. 2017), while open oceans are slightly supersaturated (Tilbrook & Karl 1995; Oudot et al. 2002; Castro-Morales et al. 2014). Supersaturated conditions occur when the rate of methanogenesis exceeds the rate at which the CH4 is oxidised and/or transferred to the atmosphere and is important as it governs the driving force

Chapter 6: Wastewater Treatment and Discharge
2019 Refinement to the 2006 IPCC Guidelines for National Greenhouse Gas Inventories 6.19
(mass transfer coefficient) and likely water-to-air CH4 emission from a receiving environment. So, while the conditions of the receiving water body play a modulating role in relation to the rate of methanogenesis, the addition of organic matter from sewer discharges is generally expected to increase CH4 emissions in freshwater and coastal environments. Recent reviews of measurements of CH4 generation indicate that a significant proportion of the CH4 emitted from freshwater systems has its origins in carbon deposited on sediments (Deemer et al. 2016) which is one reason why methanogenesis is more intense in lakes and reservoirs than fast-flowing rivers.
Using the same stoichiometric relationship as was used to calculate the default Bo value (see new Annex 6A.2), a ratio of 0.938 kg C per kg COD is obtained. Deemer et al. (2016) performed an extensive review of measurements of CH4 and CO2 originating in aquatic systems, and independent measurements of both CH4 and CO2 emission fluxes around the world. Using these data in combination with information on the partitioning of global carbon flows in freshwater systems Tranvik et al. (2009) and a default Bo of 0.25 kg CH4/kg COD, a Tier 2 MCF of 0.035 is calculated for rivers. Where it is possible to separately identify discharges to slow-flowing systems such as lakes and reservoirs, a Tier 2 MCF of 0.19 is presented (see updated Table 6.3 and new Annex 6A.4).
If countries are not able to collect activity data regarding the distribution of discharge to reservoirs, lakes, and estuaries as compared to discharges to other aquatic environments, they should use the default Tier 1 factors. The default Tier 1 MCF for CH4 generation for discharges to all aquatic environments is presented as the mean of the two Tier 2 MCFs, or 0.11.
Concerning decentralised treatment systems for domestic wastewater, CH4 and N2O emissions from effluent infiltration into soil must be considered.
CENTRALISED, AEROBIC TREATMENT PLANTS The MCF for centralised aerobic treatment plants has been updated in Table 6.3 to reflect the potential for generation of CH4 from these systems. In addition, there are no longer separate MCFs for “well managed” and “not well managed” systems and it is good practice to estimate CH4 from all centralised, aerobic treatment plants. If country-specific data are available to differentiate whether systems are overloaded or not well managed, these situations should be reflected in the calculation of TOW (for inflow overload) or Smass (for systems that are not well managed and therefore not achieving the expected removal of sludge).
IMPACT OF TEMPERATURE ON DECENTRALISED TREATMENT SYSTEMS OF DOMESTIC WASTEWATER Temperature affects wastewater treatment processes, in particular decentralised systems where no external supplemental heat is provided (uncontrolled temperature) and anaerobic digestion for which the optimal temperature is 30–38°C. At lower temperatures, the rate of anaerobic digestion decreases and CH4 production becomes unlikely below 12°C. Inside septic tanks, the temperature is uncontrolled and is related to atmospheric temperature as well as volumes of household hot and cold water used and discharged. There may also be a gradient of temperature inside the septic tank, with warmer conditions at the bottom (sludge layer) and colder at the top (Leverenz et al. 2010). Therefore, in countries having seasonal temperature variability, when the temperature in septic tanks cools, the rate of digestion slows, the SRT increases, sludge accumulates, and CH4 emissions decrease. When the liquid temperature warms, the rate of digestion increases, sludge accumulated during the cold season decomposes, gas solubility in the liquid decreases and CH4 emissions increase. This situation can produce a ‘spring boil’ phenomenon, wherein warmer weather conditions give rise to increased anaerobic microbial activity, increased gas production, and decreased solids removal efficiency due to the resuspension of settled and incoming solids. Accordingly, there is a seasonal variability of CH4 emissions (Leverenz et al. 2010); however, at this time, insufficient data exist to establish a temperature-dependent emission factor associated with these systems. Countries that experience significant seasonal temperature variations may wish to consider the development of a country-specific emission factor.
Volume 5: Waste
6.20 2019 Refinement to the 2006 IPCC Guidelines for National Greenhouse Gas Inventories
TABLE 6.3 (UPDATED) DEFAULT MCF VALUES AND RESULTANT EFS FOR DOMESTIC WASTEWATER BY TYPE OF TREATMENT SYSTEM AND
DISCHARGE PATHWAY, J1
Type of treatment and discharge pathway or system
Comments MCF 1
(Range)
EF2
(kg CH4/kg BOD)
EF2
(kg CH4/kg COD)
Discharge from treated or untreated system
Discharge to aquatic environments (Tier 1)
Most aquatic environments including rivers are supersaturated in CH4. Nutrient oversupply will increase CH4 emissions. Environments where carbon accumulates in sediments have higher potential for methane generation.
0.11
(0.004 – 0.27) 0.068 0.028
Discharge to aquatic environments other than reservoirs, lakes, and estuaries (Tier 2)
Most aquatic environments including rivers are supersaturated in CH4. Nutrient oversupply will increase CH4 emissions.
0.0353
(0.004 – 0.06) 0.021 0.009
Discharge to reservoirs, lakes, and estuaries (Tier 2)
Environments where carbon accumulates in sediments have higher potential for methane generation.
0.193
(0.08 – 0.27) 0.114 0.048
Discharge to soil Sludge and/or wastewater discharge to soil may be a source of CH4 for fertilisation Emissions reported in Volume 4
Stagnant sewer Open and warm 0.5 (0.4 – 0.8) 0.3 0.125
Flowing sewer (open or closed)
Fast moving, clean. (Insignificant amounts of CH4 from pump stations, etc.) 0 0 0
Wastewater treatment system
Centralised, aerobic treatment plant
Some CH4 can be emitted from settling basins and other anaerobic pockets. May also emit CH4 generated in upstream sewer networks during turbulent and/or aerobic treatment processes. For treatment plants that are receiving wastewater beyond the design capacity, inventory compilers should judge the amount of organic material removed in sludge accordingly.
0.034
(0.003 – 0.09) 0.018 0.0075
Anaerobic reactor (e.g., upflow anaerobic sludge blanket digestion (UASB))
CH4 recovery is not considered here. 0.8 (0.8 – 1.0) 0.48 0.2
Anaerobic shallow lagoon and facultative lagoons
Depth less than 2 metres, use expert judgment.
0.2 (0 – 0.3) 0.12 0.05
Anaerobic deep lagoon Depth more than 2 metres 0.8
(0.8 – 1.0) 0.48 0.2
Constructed wetlands
See 2013 Supplement to the 2006 IPCC Guidelines for National Greenhouse Gas Inventories: Wetlands (IPCC 2014)
Septic tank Septic tanks emit CH4 0.55
(0.4 – 0.72) 0.3 0.125
Septic tank + land dispersal field
Septic tanks emit CH4; negligible emissions come from land dispersal field
0.55
(0.4 – 0.72) 0.3 0.125
Chapter 6: Wastewater Treatment and Discharge
2019 Refinement to the 2006 IPCC Guidelines for National Greenhouse Gas Inventories 6.21
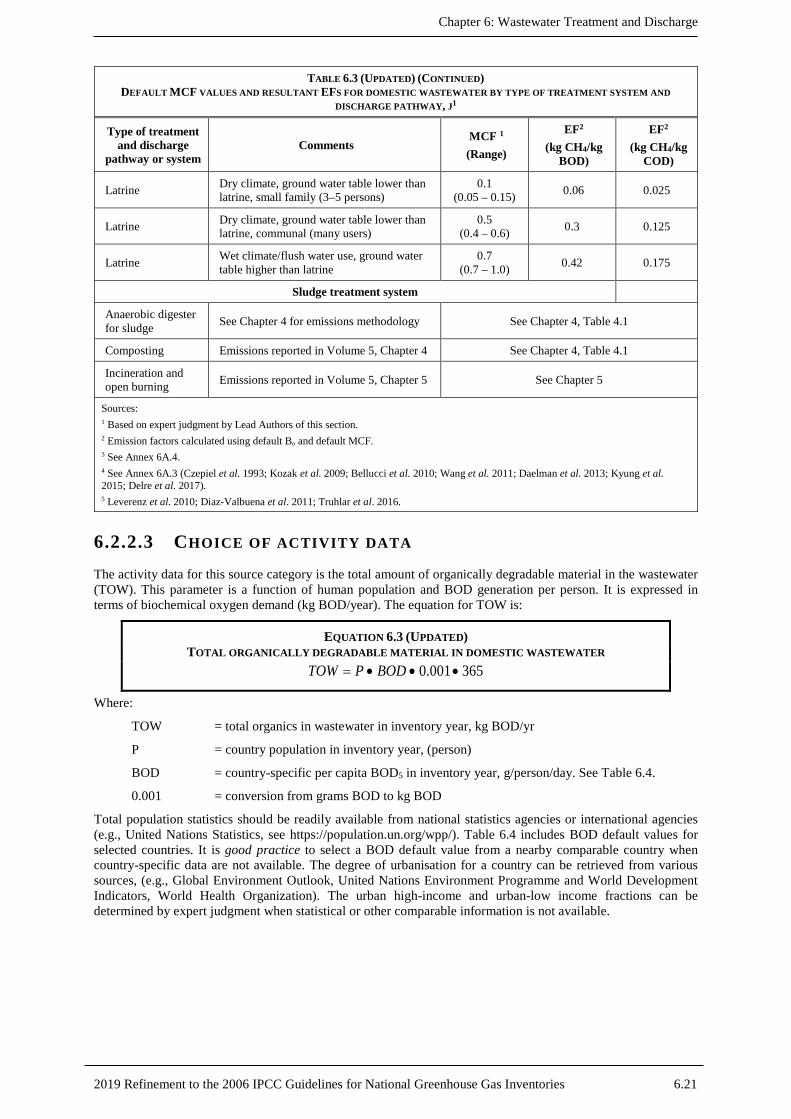
TABLE 6.3 (UPDATED) (CONTINUED) DEFAULT MCF VALUES AND RESULTANT EFS FOR DOMESTIC WASTEWATER BY TYPE OF TREATMENT SYSTEM AND
DISCHARGE PATHWAY, J1
Type of treatment and discharge
pathway or system Comments
MCF 1
(Range)
EF2
(kg CH4/kg BOD)
EF2
(kg CH4/kg COD)
Latrine Dry climate, ground water table lower than latrine, small family (3–5 persons)
0.1 (0.05 – 0.15) 0.06 0.025
Latrine Dry climate, ground water table lower than latrine, communal (many users)
0.5 (0.4 – 0.6) 0.3 0.125
Latrine Wet climate/flush water use, ground water table higher than latrine
0.7 (0.7 – 1.0) 0.42 0.175
Sludge treatment system
Anaerobic digester for sludge See Chapter 4 for emissions methodology See Chapter 4, Table 4.1
Composting Emissions reported in Volume 5, Chapter 4 See Chapter 4, Table 4.1
Incineration and open burning Emissions reported in Volume 5, Chapter 5 See Chapter 5
Sources: 1 Based on expert judgment by Lead Authors of this section. 2 Emission factors calculated using default Bo and default MCF. 3 See Annex 6A.4. 4 See Annex 6A.3 (Czepiel et al. 1993; Kozak et al. 2009; Bellucci et al. 2010; Wang et al. 2011; Daelman et al. 2013; Kyung et al. 2015; Delre et al. 2017). 5 Leverenz et al. 2010; Diaz-Valbuena et al. 2011; Truhlar et al. 2016.
6.2.2.3 CHOICE OF ACTIVITY DATA The activity data for this source category is the total amount of organically degradable material in the wastewater (TOW). This parameter is a function of human population and BOD generation per person. It is expressed in terms of biochemical oxygen demand (kg BOD/year). The equation for TOW is:
EQUATION 6.3 (UPDATED) TOTAL ORGANICALLY DEGRADABLE MATERIAL IN DOMESTIC WASTEWATER
0.001 365TOW P BOD= • • •
Where:
TOW = total organics in wastewater in inventory year, kg BOD/yr
P = country population in inventory year, (person)
BOD = country-specific per capita BOD5 in inventory year, g/person/day. See Table 6.4.
0.001 = conversion from grams BOD to kg BOD
Total population statistics should be readily available from national statistics agencies or international agencies (e.g., United Nations Statistics, see https://population.un.org/wpp/). Table 6.4 includes BOD default values for selected countries. It is good practice to select a BOD default value from a nearby comparable country when country-specific data are not available. The degree of urbanisation for a country can be retrieved from various sources, (e.g., Global Environment Outlook, United Nations Environment Programme and World Development Indicators, World Health Organization). The urban high-income and urban-low income fractions can be determined by expert judgment when statistical or other comparable information is not available.

Volume 5: Waste
6.22 2019 Refinement to the 2006 IPCC Guidelines for National Greenhouse Gas Inventories
TABLE 6.4 ESTIMATED BOD5 VALUES IN DOMESTIC WASTEWATER FOR SELECTED REGIONS AND COUNTRIES
Country/Region BOD5 (g/person/day) Range Reference
Africa 37 35 – 45 1
Egypt 34 27 – 41 1
Asia, Middle East, Latin America 40 35 – 45 1
India 34 27 – 41 1
West Bank and Gaza Strip (Palestine) 50 32 – 68 1
Japan 42 40 – 45 1
Brazil 50 45 – 55 2
Canada, Europe, Russia, Oceania 60 50 – 70 1
Denmark 62 55 – 68 1
Germany 62 55 – 68 1
Greece 57 55 – 60 1
Italy 60 49 – 60 3
Sweden 75 68 – 82 1
Turkey 38 27 – 50 1
United States 85 50 – 120 4
Note: These values are based on an assessment of the literature. Please use national values, if available. Reference: 1. Doorn and Liles (1999). 2. Feachem et al. (1983). 3. Masotti (1996). 4. Metcalf and Eddy (2003).
This section is updated to include a new equation for the calculation of total organics in wastewater (TOWj) by treatment/discharge pathway or system (see new Equation 6.3a).
EQUATION 6.3A (NEW) TOTAL ORGANICS IN DOMESTIC WASTEWATER BY TREATMENT/DISCHARGE PATHWAY OR
SYSTEM [ ]j i ij j
iTOW TOW U T I= • • •∑
Where:
TOWj = total organics in wastewater in inventory year, kg BOD/yr, for income group i and treatment/discharge pathway or system, j.
TOW = total organics in wastewater in inventory year, kg BOD/yr. See updated Equation 6.3 for TOW in wastewater prior to treatment or wastewater that is discharged without treatment and new Equation 6.3d for TOW in treated wastewater effluent.
Ui = fraction of population in income group i in inventory year. See Table 6.5.
Tij = degree of utilisation of treatment/discharge pathway or system, j, for each income group fraction
Ij = correction factor for additional industrial BOD discharged into treatment/discharge pathway or system j (for collected the default is 1.25, for uncollected the default is 1.00)
The factor I values in new Equation 6.3a are from the 2006 IPCC Guidelines. It expresses the BOD from industries and establishments (e.g., restaurants, butchers or grocery stores) that is co-discharged with

Chapter 6: Wastewater Treatment and Discharge
2019 Refinement to the 2006 IPCC Guidelines for National Greenhouse Gas Inventories 6.23
domestic wastewater. In some countries, information from industrial discharge permits may be available to improve I. Otherwise, expert judgment is recommended.
Table 6.5 includes default values of Ui and Ti,j for selected countries.

Volume 5: Waste
6.24 2019 Refinement to the 2006 IPCC Guidelines for National Greenhouse Gas Inventories
TABLE 6.5 SUGGESTED VALUES FOR URBANISATION (U) AND DEGREE OF UTILISATION OF TREATMENT, DISCHARGE PATHWAY OR METHOD (TI,J) FOR EACH INCOME GROUP FOR SELECTED COUNTRIES
Urbanisation(U) 1 Degree of utilisation of treatment or discharge pathway or method for each income group (Ti,j )3 Fraction of Population U=rural U= urban high income U=urban low income
Country Rural urban-high2 urban-low2 Septic Tank Latrine Other Sewer4 None Septic
Tank Latrine Other Sewer4 None Septic Tank Latrine Other Sewer4 None
Africa Nigeria 0.52 0.10 0.38 0.02 0.28 0.04 0.10 0.56 0.32 0.31 0.00 0.37 0.00 0.17 0.24 0.05 0.34 0.20 Egypt 0.57 0.09 0.34 0.02 0.28 0.04 0.10 0.56 0.15 0.05 0.10 0.70 0.00 0.17 0.24 0.05 0.34 0.20 Kenya 0.62 0.08 0.30 0.02 0.28 0.04 0.10 0.56 0.32 0.31 0.00 0.37 0.00 0.17 0.24 0.05 0.34 0.20 South Africa 0.39 0.12 0.49 0.10 0.28 0.04 0.10 0.48 0.15 0.15 0.00 0.70 0.00 0.17 0.24 0.05 0.34 0.20
Asia China 0.59 0.12 0.29 0.00 0.47 0.50 0.00 0.3 0.18 0.08 0.07 0.67 0.00 0.14 0.10 0.03 0.68 0.05 India 0.71 0.06 0.23 0.00 0.47 0.10 0.10 0.33 0.18 0.08 0.07 0.67 0.00 0.14 0.10 0.03 0.53 0.20 Indonesia 0.54 0.12 0.34 0.00 0.47 0.00 0.10 0.43 0.18 0.08 0.00 0.74 0.00 0.14 0.10 0.03 0.53 0.20 Pakistan 0.65 0.07 0.28 0.00 0.47 0.00 0.10 0.43 0.18 0.08 0.00 0.74 0.00 0.14 0.10 0.03 0.53 0.20 Bangladesh 0.72 0.06 0.22 0.00 0.47 0.00 0.10 0.43 0.18 0.08 0.00 0.74 0.00 0.14 0.10 0.03 0.53 0.20 Japan 0.20 0.80 0.00 0.20 0.00 0.50 0.30 0.00 0.00 0.00 0.10 0.90 0.00 0.10 0 0 0.90 0
Europe Russia 0.27 0.73 0.00 0.30 0.10 0.00 0.60 0.00 0.10 0.00 0.00 0.90 0.00 NA NA NA NA NA Germany5 0.06 0.94 0.00 0.20 0.00 0.00 0.80 0.00 0.05 0.00 0.00 0.95 0.00 NA NA NA NA NA United Kingdom 0.10 0.90 0.00 0.11 0.00 0.00 0.89 0.00 0.00 0.00 0.00 1.00 0.00 NA NA NA NA NA France 0.24 0.76 0.00 0.37 0.00 0.00 0.63 0.00 0.00 0.00 0.00 1.00 0.00 NA NA NA NA NA Italy 0.32 0.68 0.00 0.42 0.00 0.00 0.58 0.00 0.04 0.00 0.00 0.96 0.00 NA NA NA NA NA
North America United States 0.22 0.78 0.00 0.90 0.02 0.00 0.08 0.00 0.05 0.00 0.00 0.95 0.00 NA NA NA NA NA Canada 0.20 0.80 0.00 0.90 0.02 0.00 0.08 0.00 0.05 0.00 0.00 0.95 0.00 NA NA NA NA NA
Latin America and Caribbean
Brazil 0.16 0.25 0.59 0.00 0.45 0.00 0.10 0.45 0.00 0.20 0.00 0.80 0.00 0.00 0.40 0.00 0.40 0.20 Mexico 0.25 0.19 0.56 0.00 0.45 0.00 0.10 0.45 0.00 0.20 0.00 0.80 0.00 0.00 0.40 0.00 0.40 0.20
Oceania Australia and New Zealand 0.08 0.92 0.00 0.90 0.02 0.00 0.08 0.00 0.05 0.00 0.00 0.95 0.00 NA NA NA NA NA

Chapter 6: Wastewater Treatment and Discharge
2019 Refinement to the 2006 IPCC Guidelines for National Greenhouse Gas Inventories 6.25
TABLE 6.5 (CONTINUED) SUGGESTED VALUES FOR URBANISATION (U) AND DEGREE OF UTILISATION OF TREATMENT, DISCHARGE PATHWAY OR METHOD (TI,J) FOR EACH INCOME GROUP FOR SELECTED COUNTRIES
Notes: 1. Urbanization projections for 2005 (United Nations, 2002). 2. Suggested urban-high income and urban low income division. Countries are encouraged to use their own data or best judgment. 3. Ti.j values based on expert judgment, (Doorn and Liles, 1999). 4. Sewers may be open or closed, which will govern the choice of MCF, see Table 3.3 5. Destatis, 2001. Note: These values are from the literature or based on expert judgment. Please use national values, if available.

Volume 5: Waste
6.26 2019 Refinement to the 2006 IPCC Guidelines for National Greenhouse Gas Inventories
Example Table 6.6 includes an example. Categories with negligible contributions are not shown. Note that the table can easily be expanded with a column for MCF for each category. The degree of urbanization for this country is 65 percent.
TABLE 6.6
EXAMPLE OF THE APPLICATION OF DEFAULT VALUES FOR DEGREES OF TREATMENT UTILISATION (T) BY INCOME GROUPS
Treatment or discharge system or pathway T (%) Notes
Urban high-income To sea 10 No CH4
To aerobic plant1 20 Add industrial component
To septic systems 10 Uncollected
Urban low-income To sea 10 Collected
To pit latrines 15 Uncollected
Rural To rivers, lakes, sea 15
Uncollected To pit latrines 15
To septic tanks 5
Total 100% Must add up to 100% 1 The degree of treatment utilisation (T) does not take into account emissions associated with the discharge of treated effluent. Reference: Doorn and Liles (1999)
This section is updated to also include new equations for the calculation of organic components removed as sludge from aerobic treatment plants and from septic systems (see Equations 6.3b and 6.3c, respectively). Note that the estimate of TOWij in Equation 6.3a is specific to the wastewater treatment system or pathway. Inventory compilers should consider that sludge recovered from septic tanks may be transferred to centralised WWTPs. In these cases, it is good practice to include this additional organic load when estimating TOW in influent to the centralised WWTP.
The organic component removed from wastewater as sludge, S, in Equations 6.1 and 6.4, is not explained in detail in the 2006 IPCC Guidelines. This section provides an update through the introduction of new Equations 6.3b and 6.3c, which provide default calculations of S for aerobic treatment plants and septic systems, respectively. The default value of S for all other systems is zero. For aerobic treatment systems, some inventory compilers incorrectly defined the variable “S” in Equation 6.1 as the mass of sludge removed rather than the organic component removed from wastewater as sludge. It is important to note that the organic component removed from wastewater as sludge is not equivalent to the mass (tonnes) of sludge produced from wastewater treatment. Instead, the organic component removed as sludge is a function of sludge produced from wastewater treatment (Smass) and a sludge factor (Krem) which indicates how much organic matter is removed from the treatment process in sludge per kilogram of sludge produced.

Chapter 6: Wastewater Treatment and Discharge
2019 Refinement to the 2006 IPCC Guidelines for National Greenhouse Gas Inventories 6.27
EQUATION 6.3B (NEW) ORGANIC COMPONENT REMOVED AS SLUDGE FROM AEROBIC TREATMENT PLANTS
( )1000aerobic mass remS S K= • •
Where:
Saerobic = organic component removed from wastewater (in the form of sludge) in aerobic treatment plants, kg BOD/yr
Smass = amount of raw sludge removed from wastewater treatment as dry mass, tonnes/year
Krem = sludge factor, kg BOD/kg sludge. See Table 6.6a.
1000 = conversion factor for tonnes to kilograms
New Table 6.6a provides factors associated with the amount of organics in wastewater removed in sludge. Aerobic WWTPs with primary treatment only remove about 0.5 kg of influent BOD per kg of primary sludge by sedimentation. The aerobic stage of treatment removes 1.5 kg BOD per kg of secondary sludge. The sludge produced in aerobic WWTPs with primary sedimentation contains approximately 70 percent of primary sludge and 30percent of secondary sludge by weight. Aerobic WWTPs without primary treatment remove about 1.16 kg BOD per kg of sludge, depending on process type. Countries where data are available should estimate a country-specific Krem as a ratio between BOD removed and sludge generated for each process listed in Table 6.6a. Country-specific Krem should be estimated as a weighted average by individual processes.
TABLE 6.6A (NEW) REMOVAL OF ORGANIC COMPONENT FROM WASTEWATER AS SLUDGE (KREM) ACCORDING TO TREATMENT
TYPE1,2
Treatment Type Default Range
(kg BOD/kg dry mass sludge)
Mechanical treatment plants (primary sedimentation sludge) 0.5 0.4 – 0.6
Aerobic treatment plants with primary treatment (mixed primary and secondary sludge, untreated or treated aerobically) 0.8 0.65 – 0.95
Aerobic treatment plants with primary treatment and anaerobic sludge digestion (mixed primary and secondary sludge, treated anaerobically) 1.0 0.8 – 1.2
Aerobic wastewater treatment plants without separate primary treatment 1.16 1.0 – 1.5 Sources: 1 BOD, or biochemical oxygen demand, is a proxy indicator of the quality (or organic content) of the waste, but it is not a direct mass measurement of the organic content. Just as the mass of oxygen in carbon dioxide is greater than the mass of carbon, it is feasible for the BOD of a carbon-containing molecule to exceed 1 when the molecule is metabolised to carbon dioxide. 2 Based on expert judgment by Lead Authors of this section using the following references: Pescod (1992); Davies (2005); Foladori et al. (2010); WEF (2010); Wisconsin Department of Natural Resources (2010); Serón et al. (2011).
Concerning septic systems, emissions depend on the fraction of the population managing their septic tank in accordance with the sludge removal instructions of their septic tank/system (F in new Equation 6.3c). The default value for F is 0.5 and corresponds to the situation where 50percent of the population managing their septic system are complying with the sludge removal instructions. This default value is for countries where there is no effective regulation or administrative requirements for sludge removal in septic systems. In countries with such regulations or requirements, some evidence of maintenance controls should be provided (for instance the existence of a local public service responsible for onsite sanitation). It is good practice to assess the F value using available data on sludge removal practices among the population using septic systems.

Volume 5: Waste
6.28 2019 Refinement to the 2006 IPCC Guidelines for National Greenhouse Gas Inventories
EQUATION 6.3C (NEW) ORGANIC COMPONENT REMOVED AS SLUDGE FROM SEPTIC SYSTEMS
0.5septic septicS TOW F= • •
Where:
Sseptic = organic component removed from wastewater (in the form of sludge) in septic systems, kg BOD/yr
TOWseptic = total organics in wastewater in septic systems inventory year, kg BOD/yr
F = fraction of the population managing their septic tank in compliance with the sludge removal instruction of their septic system
0.5 = fraction of organics in wastewater removed in sludge when septic tank is managed in accordance with sludge removal instructions
For discharges of treated wastewater, inventory compilers should estimate the amount of TOW in effluent (TOWEFFLUENT) as shown in new Equation 6.3d.
EQUATION 6.3D (NEW) TOTAL ORGANICS IN TREATED DOMESTIC WASTEWATER EFFLUENT
( ),1EFFtreat j REM jj
TOW TOW T TOW = • • − ∑
Where:
TOWEFFtreat = total organics in the treated wastewater effluent discharged to aquatic environments in inventory year, kg BOD/yr
TOW = total organically degradable material in domestic wastewater in inventory year, kg BOD/yr. See Equation 6.3 (Updated).
TJ = degree of utilisation of treatment system j in inventory year (ij
iT∑ ). See Table 6.5.
j = each wastewater treatment type used in inventory year
TOWREM,j = fraction of total wastewater organics removed during wastewater treatment per treatment type j. See new Table 6.6b. Pathways for organics removal include loss to sludge and biological decomposition.
TABLE 6.6B (NEW) WASTEWATER TREATMENT ORGANICS REMOVAL FRACTIONS (TOWREM) ACCORDING TO
TREATMENT TYPE
Treatment Type Default Range
Untreated systems 0 0 – 0.1
Primary (mechanical treatment plants) 0.40 0.25 – 0.50
Primary + Secondary (biological treatment plants) 0.85 0.80 – 0.90
Primary + Secondary + Tertiary (advanced biological treatment plants) 0.90 0.80 – 0.95
Septic tank/septic system 0.625 0.50 – 0.60
Latrines – Dry climate, groundwater table lower than latrine, small family (3–5 persons) 0.1 0.05 – 0.15
Latrines – Dry climate, groundwater table lower than latrine, communal (many users) 0.5 0.4 – 0.6
Latrines – Wet climate/flush water use, groundwater table higher than latrine 0.7 0.7 – 1.0

Chapter 6: Wastewater Treatment and Discharge
2019 Refinement to the 2006 IPCC Guidelines for National Greenhouse Gas Inventories 6.29
TABLE 6.6B (NEW) (CONTINUED) WASTEWATER TREATMENT ORGANICS REMOVAL FRACTIONS (TOWREM) ACCORDING TO
TREATMENT TYPE
Sources: 1 Based on expert judgment by Lead Authors of this section using the following references: Pescod (1992); WEF (2009); Schaider et al. (2017) .
6.2.2.4 TIME SERIES CONSISTENCY No refinement.
6.2.2.5 UNCERTAINTIES Chapter 3, Uncertainties, in Volume 1 provides advice on quantifying uncertainties in practice. It includes guidance on eliciting and using expert judgments which in combination with empirical data can provide overall uncertainty estimates. This section provides an update to Table 6.7 to provide default uncertainty ranges for new or updated emission factor and activity data of domestic wastewater. The following parameters are believed to be very uncertain:
• The degrees to which wastewater in developing countries is treated in latrines, septic tanks, or removed by sewer, for urban high, urban low income groups and rural population (Ti,j).
• The fraction of sewers that are ‘open’, as well as the degree to which open sewers in developing countries are anaerobic and will emit CH4. This will depend on retention time and temperature, and on other factors including the presence of a facultative layer and possibly components that are toxic to anaerobic bacteria (e.g., certain industrial wastewater discharges).
• The amount of industrial TOW that is discharged into open or closed domestic sewers for each country is very difficult to quantify.
TABLE 6.7 (UPDATED)
DEFAULT UNCERTAINTY RANGES FOR DOMESTIC WASTEWATER Parameter Uncertainty Range
Emission Factor
Maximum CH4 producing capacity (Bo) ± 30%
Fraction treated anaerobically (MCF) The MCF is technology dependent. See Table 6.3. Thus, the uncertainty range is also technology dependent. The uncertainty range should be determined by expert judgment, bearing in mind that MCF is a fraction and must be between 0 and 1. Suggested ranges are provided below. Untreated systems, ± 50% Lagoons ± 30% Centralised plant, digester, reactor, ± 10%
Activity Data
Human population (P) ± 5%
Biochemical oxygen demand (BOD) ± 30%
Fraction of population income group (U) Good data on urbanisation are available, however, the distinction between urban high income and urban low income may have to be based on expert judgment. ± 15%
Degree of utilisation of treatment/ discharge pathway or system for each income group (Ti,j)
Can be as low as ± 3% for countries that have good records and only one or two systems. Can be ± 50% for an individual method/pathway. Verify that total Ti,j = 100%
Correction factor for additional industrial BOD discharged into sewers (I)
For uncollected, the uncertainty is zero %. For collected the uncertainty is ± 20%

Volume 5: Waste
6.30 2019 Refinement to the 2006 IPCC Guidelines for National Greenhouse Gas Inventories
TABLE 6.7 (UPDATED) (CONTINUED) DEFAULT UNCERTAINTY RANGES FOR DOMESTIC WASTEWATER
Parameter Uncertainty Range
Amount of sludge removed from wastewater treatment (Smass)
± 30%
Sludge factor (Krem) ± 25%
Fraction of the population managing their septic system complying with the sludge removal instruction (F)
Can be as low as ± 3% for countries that have good records on implementation. Can be ± 50% if based on expert judgment.
Amount of CH4 recovered or flared (R) For systems with measured data, the uncertainty is equal to the uncertainty of the measurement system.
Source: Based on expert judgment by Lead Authors of this section.
6.2.2.6 QA/QC, COMPLETENESS, REPORTING AND DOCUMENTATION
No refinement.
6.2.3 Industrial wastewater Industrial wastewater may be treated on site or released into domestic sewer systems. If it is released into the domestic sewer system, the emissions are to be included with the domestic wastewater emissions. This section deals with estimating CH4 emissions from on-site industrial wastewater treatment. Only industrial wastewater with significant carbon loading that is treated under intended or unintended anaerobic conditions will produce CH4. Organics in industrial wastewater are often expressed in terms of COD, which is used here.
6.2.3.1 CHOICE OF METHOD Assessment of CH4 production potential from industrial wastewater streams is based on the concentration of degradable organic matter in the wastewater, the volume of wastewater, and the propensity of the industrial sector to treat their wastewater in anaerobic systems. Using these criteria, major industrial wastewater sources with high CH4 gas production potential can be identified as follows:
• pulp and paper manufacture;
• meat and poultry processing (slaughterhouses);
• alcohol, beer, starch production;
• organic chemicals production;
• other food and drink processing (dairy products, vegetable oil, fruits and vegetables, canneries, juice making, etc.).
Both the pulp and paper industry and the meat and poultry processing industries produce large volumes of wastewater that contain high levels of degradable organics. The meat and poultry processing facilities typically employ anaerobic lagoons to treat their wastewater, while the paper and pulp industry also use lagoons and anaerobic reactors. The non-animal food and beverage industries produce considerable amounts of wastewater with significant organic carbon levels and are also known to use anaerobic processes such as lagoons and anaerobic reactors. Anaerobic reactors treating industrial effluents with biogas facilities are usually linked with recovery of the generated CH4 for energy. Emissions from the combustion process for energy should be reported in the Energy Sector.
The method for estimating emissions from industrial wastewater is similar to the one used for domestic wastewater. An updated decision tree for industrial wastewater is included as updated Figure 6.3 and should be used to determine the tier approach that is applicable to the country.
The development of emission factors and activity data is more complex because there are many types of wastewater, and many different industries to track. The most accurate estimates of emissions for this source category would be based on measured data from point sources. Due to the high costs of measurements and the
Chapter 6: Wastewater Treatment and Discharge
2019 Refinement to the 2006 IPCC Guidelines for National Greenhouse Gas Inventories 6.31
potentially large number of point sources, collecting comprehensive measurement data is very difficult. It is suggested that inventory compilers use a top-down approach that includes the following general steps:
Step 1: Use Equation 6.6 to estimate total organically degradable carbon in wastewater (TOW) for industrial sector i
Step 2: Select the pathway and systems (updated Figure 6.1) according to country activity data. Use Equation 6.5 to obtain emission factor. For each industrial sector estimate the emission factor using maximum methane producing capacity and the average industry-specific MCF.
Step 3: Use Equation 6.4 to estimate emissions, adjust for possible sludge removal and or CH4 recovery and sum the results.
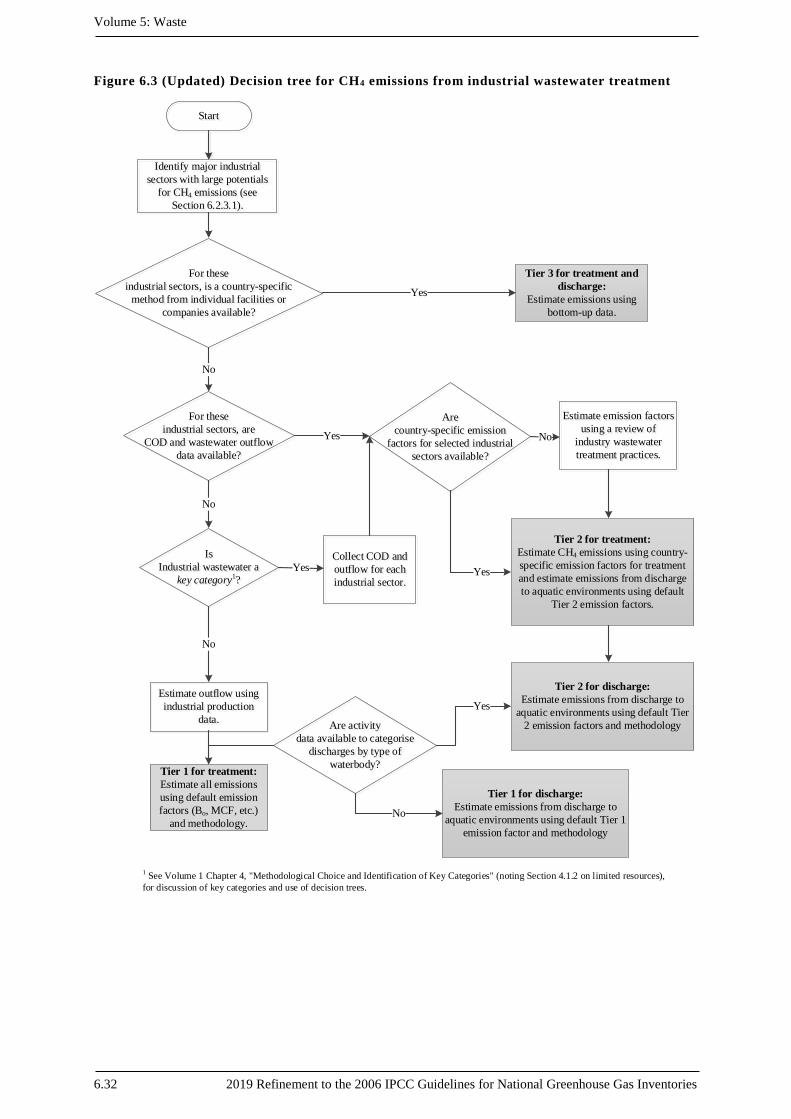
Volume 5: Waste
6.32 2019 Refinement to the 2006 IPCC Guidelines for National Greenhouse Gas Inventories
Figure 6.3 (Updated) Decision tree for CH4 emissions from industrial wastewater treatment
Tier 3 for treatment and discharge:
Estimate emissions using bottom-up data.
Tier 2 for treatment:Estimate CH4 emissions using country-specific emission factors for treatment and estimate emissions from discharge to aquatic environments using default
Tier 2 emission factors.
Estimate emission factors using a review of
industry wastewater treatment practices.
For these industrial sectors, is a country-specific
method from individual facilities or companies available?
For theseindustrial sectors, are
COD and wastewater outflow data available?
IsIndustrial wastewater a
key category1?
Identify major industrial sectors with large potentials
for CH4 emissions (see Section 6.2.3.1).
Are country-specific emission
factors for selected industrial sectors available?
Estimate outflow using industrial production
data.
Tier 2 for discharge: Estimate emissions from discharge to
aquatic environments using default Tier 2 emission factors and methodology
Collect COD and outflow for each industrial sector.
1 See Volume 1 Chapter 4, "Methodological Choice and Identification of Key Categories" (noting Section 4.1.2 on limited resources), for discussion of key categories and use of decision trees.
Are activity data available to categorise
discharges by type of waterbody?Tier 1 for treatment:
Estimate all emissions using default emission factors (Bo, MCF, etc.)
and methodology.
Start
Yes
No
No
No
Yes No
Yes Yes
No
Tier 1 for discharge: Estimate emissions from discharge to
aquatic environments using default Tier 1 emission factor and methodology
Yes

Chapter 6: Wastewater Treatment and Discharge
2019 Refinement to the 2006 IPCC Guidelines for National Greenhouse Gas Inventories 6.33
The general equation to estimate CH4 emissions from industrial wastewater is as follows:
EQUATION 6.4 TOTAL CH4 EMISSIONS FROM INDUSTRIAL WASTEWATER
( ) 6104 i i i ii
CH Emissions TOW S EF R −= − • − • ∑
Where:
CH4 Emissions = CH4 emissions in inventory year, Gg CH4/yr
TOWi = total organically degradable material in wastewater from industry i in inventory year, kg COD/yr
i = industrial sector
Si = organic component removed from wastewater (in the form of sludge) in inventory year, kg COD/yr
EFi = emission factor for industry i, kg CH4/kg COD for treatment/discharge pathway or system(s) used in inventory year
If more than one treatment practice is used in an industry this factor would need to be a weighted average.
Ri = amount of CH4 recovered or flared in inventory year, kg CH4/yr
10-6 = conversion of kg to Gg
The amount of CH4 which is recovered or flared is expressed as R in Equation 6.4.
6.2.3.2 CHOICE OF EMISSION FACTORS This section represents an update to Section 6.2.3.2 of the 2006 IPCC Guidelines.
As stated in the 2006 IPCC Guidelines, there are significant differences in the CH4 emitting potential of different types of industrial wastewater dependent on the type and form of constituents present in the wastewater. To the extent possible, data should be collected to determine the maximum CH4 producing capacity (Bo) in each industry.
As mentioned before, the MCF indicates the extent to which the CH4 producing potential (Bo) is realised in each type of treatment method. Thus, it is an indication of the degree to which the system is anaerobic. See Equation 6.5.
EQUATION 6.5 CH4 EMISSION FACTOR FOR INDUSTRIAL WASTEWATER
j o jEF B MCF= •
Where:
EFj = emission factor for each treatment/discharge pathway or system, kg CH4/kg COD, (See Table 6.8.)
j = each treatment/discharge pathway or system
Bo = maximum CH4 producing capacity, kg CH4/kg COD
MCFj = methane correction factor (fraction). See Table 6.8.
Good practice is to use country- and industry-sector specific data that may be available from government authorities, industrial organisations, or industrial experts. If country-specific data are available to determine the Bo for a particular industry, industry-specific MCFs must be developed for the calculation of CH4 emissions. However, if country-specific data are not available, it is good practice to use the IPCC default factors listed in Table 6.2.
In determining the MCF, which is the fraction of waste treated anaerobically, expert judgment is recommended. A peer-reviewed survey of industry wastewater treatment practices is one useful technique for estimating these data. Surveys should be conducted frequently enough to account for major trends in industry practices (i.e., every 3-5 years). Chapter 2, Approaches to Data Collection, in Volume 1, describes how to elicit expert judgment for

Volume 5: Waste
6.34 2019 Refinement to the 2006 IPCC Guidelines for National Greenhouse Gas Inventories
uncertainty ranges. Similar expert elicitation protocols can be used to obtain the necessary information for other types of data if published data and statistics are not available. Table 6.8 includes default MCF values, which are based on expert judgment.
In addition, the MCFs in Table 6.8 have been updated to reflect revisions to certain wastewater treatment and discharge pathways and systems, as described in Section 6.2.2.2.
TABLE 6.8 (UPDATED)
DEFAULT MCF VALUES AND RESULTANT EFS FOR INDUSTRIAL WASTEWATER
Type of treatment and discharge pathway or system
Comments MCF 1
(Range)
EF2
(kg CH4/kg BOD)
EF2
(kg CH4/kg COD)
Discharge from treated or untreated system
Discharge to aquatic environments (Tier 1)
Most aquatic environments including rivers are supersaturated in CH4. Nutrient oversupply will increase CH4 emissions. Environments where carbon accumulates in sediments have higher potential for methane generation.
0.11
(0.004 – 0.27) 0.068 0.028
Discharge to aquatic environments other than reservoirs, lakes, and estuaries (Tier 2)
Most aquatic environments including rivers are supersaturated in CH4. Nutrient oversupply will increase CH4 emissions.
0.0353
(0.004 – 0.06) 0.021 0.009
Discharge to reservoirs, lakes, and estuaries (Tier 2)
Environments where carbon accumulates in sediments have higher potential for methane generation.
0.193
(0.08 – 0.27) 0.114 0.048
Discharge to soil
Sludge and/or wastewater discharge to soil may be a source of CH4 for fertilisation Emissions reported in Volume 4
Wastewater treatment system
Centralised, aerobic treatment plant
Some CH4 can be emitted from settling basins and other anaerobic pockets. For treatment plants that are receiving wastewater beyond the design capacity, inventory compilers should judge the amount of organic material removed in sludge accordingly.
0
(0 – 0.1) 0 0
Anaerobic reactor (e.g., upflow anaerobic sludge blanket digestion (UASB))
CH4 recovery is not considered here. 0.8 (0.8 – 1.0) 0.48 0.2
Anaerobic shallow lagoon and facultative lagoons
Depth less than 2 metres, use expert judgment.
0.2 (0 – 0.3) 0.12 0.05
Anaerobic deep lagoon Depth more than 2 metres. 0.8
(0.8 – 1.0) 0.48 0.2
Constructed wetlands
See 2013 Supplement to the 2006 IPCC Guidelines for National Greenhouse Gas Inventories: Wetlands (IPCC 2014)

Chapter 6: Wastewater Treatment and Discharge
2019 Refinement to the 2006 IPCC Guidelines for National Greenhouse Gas Inventories 6.35
TABLE 6.8 (UPDATED) (CONTINUED) DEFAULT MCF VALUES AND RESULTANT EFS FOR INDUSTRIAL WASTEWATER
Type of treatment and discharge pathway or system
Comments MCF 1
(Range)
EF2
(kg CH4/kg BOD)
EF2
(kg CH4/kg COD)
Sludge treatment system
Anaerobic digester for sludge
See Chapter 4 for emissions methodology See Chapter 4, Table 4.1
Composting Emissions reported in Volume 5, Chapter 4 See Chapter 4, Table 4.1
Incineration and open burning
Emissions reported in Volume 5, Chapter 5 See Chapter 5
Sources: 1 Based on expert judgment by Lead Authors of this section. 2 Emission factors calculated using default Bo and default MCF. 3 See Annex 6A.4.
6.2.3.3 CHOICE OF ACTIVITY DATA No refinement.
6.2.3.4 TIME SERIES CONSISTENCY No refinement.
6.2.3.5 UNCERTAINTIES No refinement.
6.2.3.6 QA/QC, COMPLETENESS, REPORTING AND DOCUMENTATION
No refinement.
6.3 NITROUS OXIDE EMISSIONS FROM DOMESTIC WASTEWATER
This section refines Section 6.3 of the 2006 IPCC Guidelines by providing update and new guidance for estimating domestic N2O emissions from WWTPs and provides new guidance on the estimation of N2O emissions from wastewater after disposal of untreated wastewater or treated wastewater effluent into aquatic environments by accounting for losses of nitrogen prior to disposal.
6.3.1 Methodological issues Nitrous oxide emissions can occur as emissions from WWTPs or as emissions from receiving aquatic environments following the disposal of untreated or treated wastewater effluent. This section describes how to estimate the N2O produced during wastewater treatment, sludge treatment that occurs within the wastewater treatment system, and disposal of the wastewater. More recent research and field surveys have revealed that emissions in sewer networks and from nitrification or nitrification-denitrification processes at WWTPs, previously judged to be a minor source, may in fact result in more substantial emissions. N2O is generated as a by-product of nitrification, or as an intermediate product of denitrification. There are many factors affecting N2O

Volume 5: Waste
6.36 2019 Refinement to the 2006 IPCC Guidelines for National Greenhouse Gas Inventories
emissions from wastewater treatment systems such as the temperature and dissolved oxygen concentration of the wastewater, and the specific operational conditions.
Emissions also result from untreated wastewater or wastewater treatment effluent that is discharged into aquatic environments. It is important to note that emissions are dependent on the nutrient-impacted status and oxygenation level of the aquatic environment receiving the wastewater discharge. The current methodology in the 2006 IPCC Guidelines appropriately captures discharge to relatively clean and/or well-oxygenated environments. However, in the case of discharge to nutrient-impacted waters such as eutrophic lakes, estuaries and rivers, or locations where stagnant conditions occur, emissions can be significantly higher.
Three tiers of methods for estimating N2O emissions from this category are summarised below:
The Tier 1 method applies default values for the emission factor and activity parameters. This method is considered good practice for countries with limited data.
The Tier 2 method follows the same method as Tier 1 but allows for incorporation of a country-specific emission factor and country-specific activity data. For example, a specific emission factor for a prominent treatment system based on field measurements could be incorporated under this method. Use of country-specific emission factor in the same region or climate area is also good practice. The amount of sludge removed for incineration, landfills, and agricultural land should be taken into consideration.
For a country with good data and advanced methodologies, a country-specific method could be applied as a Tier 3 method. For example, a more advanced country-specific method could be based on plant-specific emissions data from large wastewater treatment facilities or using country-specific measurements of nitrogen discharged to aquatic environments of varying nutrient-impacted status. Direct measurement methods would provide a more accurate measurement of N2O production from each treatment plant.
6.3.1.1 CHOICE OF METHOD A decision tree for domestic wastewater is included in new Figure 6.4.
The steps for good practice in inventory preparation for N2O from domestic wastewater are as follows:
Step 1: Use new Equation 6.10 to estimate total nitrogen in wastewater and updated Equation 6.8 to estimate total nitrogen in wastewater effluent.
Step 2: Select the pathway and systems (see updated Figure 6.1) according to country activity data. Select the emission factor for each domestic wastewater treatment/discharge pathway or system.
Step 3: Use updated Equation 6.9 to estimate emissions from wastewater treatment and sum the results for each treatment pathway/system.
Step 4: Use updated Equation 6.7 to estimate emissions from effluent, accounting for losses of nitrogen that occur within the wastewater treatment process including sludge removal and sum the results for each pathway/system. Emissions should also be calculated for nitrogen discharged as untreated wastewater.
As described earlier, the wastewater characterisation will determine the fraction of wastewater treated or disposed of by a particular system. To determine the use of each type of treatment or discharge system, it is good practice to refer to national statistics (e.g., from regulatory authorities). If these data are not available, wastewater associations or international organisations such as the WHO may have data on the system usage.
Otherwise, consultation with sanitation experts can help, and expert judgment can also be applied (see Chapter 2, Approaches to Data Collection, in Volume 1). Urbanisation statistics may provide a useful tool, e.g., city sizes and income distribution.
If activity data are available to categorize discharges to nutrient-impacted environments, these refinements introduce a new Tier 3 emission factor for those discharges.
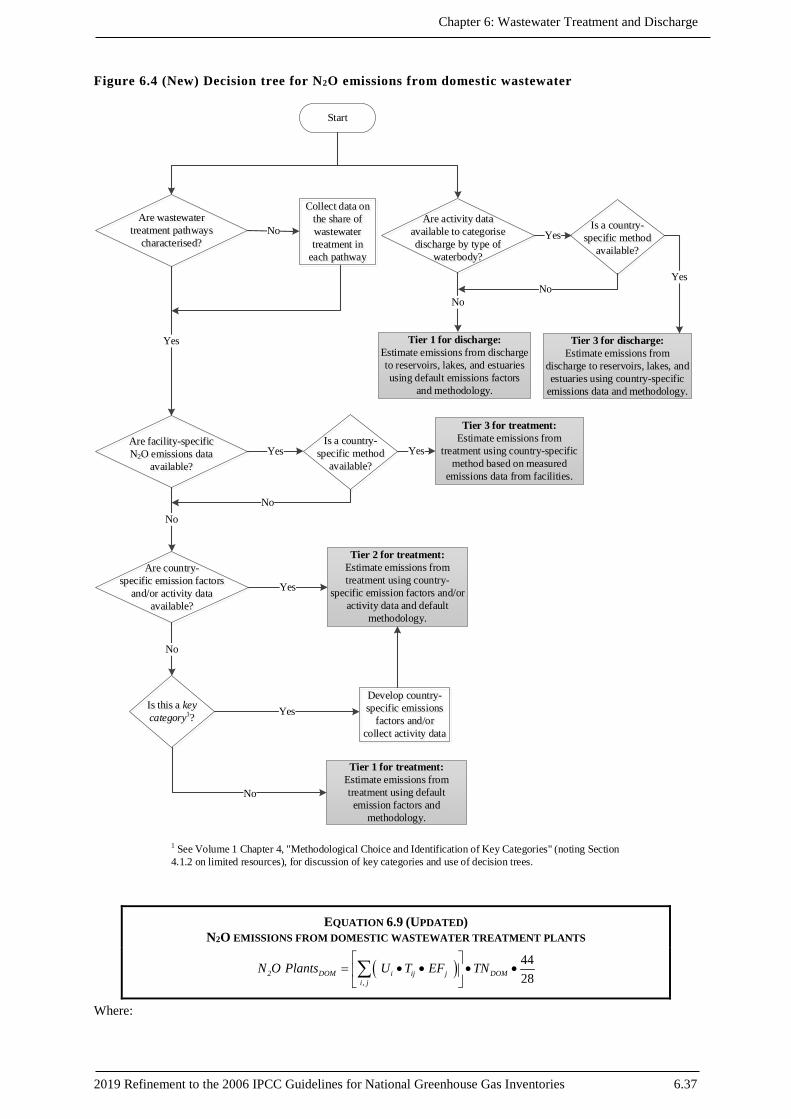
Chapter 6: Wastewater Treatment and Discharge
2019 Refinement to the 2006 IPCC Guidelines for National Greenhouse Gas Inventories 6.37
Figure 6.4 (New) Decision tree for N2O emissions from domestic wastewater
EQUATION 6.9 (UPDATED) N2O EMISSIONS FROM DOMESTIC WASTEWATER TREATMENT PLANTS
( ),
44 282 DOM i ij j DOM
i jN O Plants U T EF TN
= • • • • ∑
Where:
Collect data on the share of wastewater treatment in
each pathway
Tier 3 for treatment:Estimate emissions from
treatment using country-specific method based on measured
emissions data from facilities.
Tier 2 for treatment: Estimate emissions from treatment using country-
specific emission factors and/or activity data and default
methodology.
Develop country-specific emissions
factors and/or collect activity data
Are wastewater treatment pathways
characterised?
Is a country- specific method
available?
Is this a key category1?
1 See Volume 1 Chapter 4, "Methodological Choice and Identification of Key Categories" (noting Section 4.1.2 on limited resources), for discussion of key categories and use of decision trees.
Start
Are facility-specific N2O emissions data
available?
Are country-specific emission factors
and/or activity data available?
Tier 3 for discharge:Estimate emissions from
discharge to reservoirs, lakes, and estuaries using country-specific
emissions data and methodology.
Are activity data available to categorise discharge by type of
waterbody?
Tier 1 for treatment: Estimate emissions from treatment using default emission factors and
methodology.
Tier 1 for discharge:Estimate emissions from discharge to reservoirs, lakes, and estuaries using default emissions factors
and methodology.
No
Yes
Yes Yes
Yes
Yes
No
No
No
YesIs a country-
specific method available?
NoYes
No
No

Volume 5: Waste
6.38 2019 Refinement to the 2006 IPCC Guidelines for National Greenhouse Gas Inventories
N2O Plants DOM = N2O emissions from domestic wastewater treatment plants in inventory year, kg N2O/yr
TNDOM = total nitrogen in domestic wastewater in inventory year, kg N/yr. See new Equation 6.10.
Ui = fraction of population in income group i in inventory year. See Table 6.5.
Tij = degree of utilisation of treatment/discharge pathway or system j, for each income group fraction i in inventory year. See Table 6.5.
i = income group: rural, urban high income and urban low income
j = each treatment/discharge pathway or system
EFj = emission factor for treatment/discharge pathway or system j, kg N2O-N/kg N
The factor 44/28 is for the conversion of kg N2O-N into kg N2O.
It is also required to estimate direct N2O emissions arising from the discharge of wastewater (treated or untreated) into aquatic receiving environments. The methodology for emissions from effluent is similar to that of N2O emissions explained in Volume 4, Section 11.2.2 in Chapter 11 N2O Emissions from Managed Soils, and CO2 Emissions from Lime and Urea Application. The simplified general equation is as follows:
EQUATION 6.7 (UPDATED) N2O EMISSIONS FROM DOMESTIC WASTEWATER EFFLUENT
, ,44282 EFFLUENT DOM EFFLUENT DOM EFFLUENTN O N EF= • •
Where:
N2OEFFLUENT,DOM = N2O emissions from domestic wastewater effluent in inventory year, kg N2O/yr
NEFFLUENT,DOM = nitrogen in the effluent discharged to aquatic environments, kg N/yr. See updated Equation 6.8.
EFEFFLUENT = emission factor for N2O emissions from wastewater discharged to aquatic systems, kg N2O-N/kg N
The factor 44/28 is the conversion of kg N2O-N into kg N2O.
6.3.1.2 CHOICE OF EMISSION FACTORS New Table 6.8a includes default Tier 1 EF values for use in estimation of N2O emissions from waters receiving treated or untreated effluent (see Annex 6A.5). These refinements to the emission factors build on the current default value for EFEFFLUENT provided in Table 6.11 of the 2006 IPCC Guidelines. This existing emission factor is adequate for all discharges when using the Tier 1 methodology. However, it is expected to generate an underestimate of N2O emissions in the case of discharge to nutrient-impacted waters such as eutrophic lakes, estuaries and rivers, or locations where stagnant conditions occur. Research published between 1978 and 2017 provide data indicating that higher N2O emissions occur when wastewater is discharged to nutrient-impacted (eutrophic) or hypoxic aquatic receiving environments. Accordingly, Table 6.8a provides a new EFEFFLUENT of 0.019 g N2O-N/g N (95percent confidence limits 0.0041–0.091) for use with a Tier 3 method (see Annex 6A.6 for a discussion of information used to develop this new emission factor). The compiler can make use of many different indications of whether this higher EF value should be employed. Harmful algal blooms and hypoxia are the two most common symptoms of waterway nutrient over-enrichment (eutrophication). One possibility is to consider the dissolved oxygen status of the receiving waters. Waterway hypoxia is becoming increasingly common globally and definitions of hypoxia can vary depending on temperature, salinity, and the particular biota of interest. Dissolved oxygen concentrations of between 0.1–3.0 mg/L (or <30percent of the oxygen saturation concentration) are typically classified as hypoxic (Vaquer-Sunyer & Duarte 2008; Naqvi et al. 2010; Rabalais et al. 2010) and are likely to result in increased N2O yields from microbial metabolism of discharged wastewater nitrogen.
Oxygen status can be a highly dynamic indicator in practice, and compilers may have better access to information regarding the nutrient (trophic) status of receiving waters. Various thresholds for the boundary between mesotrophic and eutrophic conditions have been proposed, such as Secchi depth (suggestions range from 2 to 3.6 m), total phosphorus (20–75 μg/L), total nitrogen (0.3–5 mg/L), benthic chlorophyll (70 mg/m2) and suspended chlorophyll concentration (5–30 μg/L) (Dodds et al. 1998; Burns et al. 2009; Mateo-Sagasta & Burke 2010). Compilers may also consider whether there have been reports of algal blooms, sulphurous odours,

Chapter 6: Wastewater Treatment and Discharge
2019 Refinement to the 2006 IPCC Guidelines for National Greenhouse Gas Inventories 6.39
fish kills or other indications of eutrophic and/or hypoxic conditions in the discharge environment. Global datasets exist which may assist compilers in assessing the risk of nutrient impacts in different regions (Diaz et al. 2011; Xie & Ringler 2017). It is important to note that the context for application of this new Tier 3 EFEFFLUENT factor is not necessarily the same as for nitrogen runoff from agriculture, due to the combination of reducing conditions and high organic loading in many wastewaters which are unlikely to exist in agricultural runoff systems.
TABLE 6.8A (NEW) DEFAULT EF VALUES FOR DOMESTIC AND INDUSTRIAL WASTEWATER
Type of treatment and discharge pathway or system Comments EF1 (kg N2O-
N/kg N) Range
Discharge from treated or untreated system, EFEFFLUENT
Freshwater, estuarine, and marine discharge (Tier 1)
Based on limited field data and on specific assumptions regarding the occurrence of nitrification and denitrification in rivers and in estuaries
0.0052 0.0005 – 0.075
Nutrient-impacted and/or hypoxic freshwater, estuarine, and marine environments (Tier 3, if needed)
Higher emissions are associated with nutrient-impacted/hypoxic water such as eutrophic lakes, estuaries and rivers, or locations where stagnant conditions occur. See section 6.3.1.2 for more information.
0.0192 0.0041 – 0.091
Discharge to soil Emissions reported in Volume 4
Wastewater treatment system, EFplants
Centralised, aerobic treatment plant N2O is variable and can be significant 0.0161 0.00016 – 0.045
Anaerobic reactor N2O is not significant 0 0 – 0.001
Anaerobic lagoons N2O is not significant 0 0 – 0.001
Constructed wetlands See 2013 Supplement to the 2006 IPCC Guidelines for National Greenhouse Gas Inventories: Wetlands (IPCC 2014)
Septic tank N2O is not significant 0 0 – 0.001
Septic tank + land dispersal field N2O is emitted by the soil dispersal system 0.0045 0 – 0.001
Latrine N2O is not significant 0 0 – 0.001
Sludge treatment system
Anaerobic digester for sludge N2O is not significant 0 0
Composting See Chapter 4 for emissions methodology See Chapter 4, Table 4.1
Incineration and open burning See Chapter 5 for emissions methodology See Chapter 5 Sources: Based on scientific literature and expert judgment by Lead Authors of this section. 1 See Annex 6A.5. 2 See Annex 6A.6.
6.3.1.3 CHOICE OF ACTIVITY DATA The methodology to calculate the amount of N content in wastewater effluent (NEFFLUENT,DOM) presented in Equation 6.8 of the 2006 IPCC Guidelines currently does not account for the removal of ammonia-N via nitrification-denitrification processes in the sewer and the WWTP, or the removal of N in sludge, which can result in a significant overestimate of N discharged to aquatic receiving environments. Typical total N concentration in raw urban sewage is about 40 mg/L (range 20–70 mg/L) (Tchobanoglous et al. 2014), whereas effluent treated in conventional activated sludge facilities (with nitrification) has a total of about 25 mg/L. Plants with biological nutrient removal (with denitrification) regularly achieve an effluent total N of 5 mg/L or less. The difference is due both to N removed in sludge (see Table 2.4A (New), Chapter 2 of Volume 5 regarding the N content of sewage sludge) versus N loss to the atmosphere (see new Figure 6.5).

Volume 5: Waste
6.40 2019 Refinement to the 2006 IPCC Guidelines for National Greenhouse Gas Inventories
This section updates the methodology presented in the 2006 IPCC Guidelines to estimate the amount of N content in wastewater entering treatment (TNDOM), the loss or removal of N through the treatment process (either through biological conversion or removal with sludge) (NREM), and the N content in wastewater discharged to aquatic systems (NEFFLUENT,DOM).
Figure 6.5 (New) Nitrogen in domestic wastewater treatment
NITROGEN IN DOMESTIC WASTEWATER (TND O M) The activity data that are needed for estimating TNDOM in domestic wastewater include the population associated with the wastewater, the average annual per capita protein consumed (kg/person/yr), and factors to account for N in non-consumed protein entering the wastewater and other N from household, industrial, and commercial sources co-discharged into the sewer system. The total N in wastewater for each treatment pathway is estimated as follows:
EQUATION 6.10 (NEW) TOTAL NITROGEN IN DOMESTIC WASTEWATER BY TREATMENT PATHWAY
( )_ _ • • • • •DOM j treatment j NPR HH NON CON IND COMTN P Protein F N F F− −=
Where:
TNDOM_j = total annual amount of nitrogen in domestic wastewater for treatment pathway j, kg N/yr
Ptreatment_j = human population who are served by the treatment pathway j, person/yr
Protein = annual per capita protein consumption, kg protein/person/yr
FNPR = fraction of nitrogen in protein, default = 0.16 kg N/kg protein
FNON-CON = factor for nitrogen in non-consumed protein disposed in sewer system, kg N/kg N. See new Table 6.10a.
FIND-COM = factor for industrial and commercial co-discharged protein into the sewer system, kg N/kg N
NHH = additional nitrogen from household products added to the wastewater, default is 1.1 (some country data are in new Table 6.10a).
If national statistics on protein consumed or protein supply are not available, Food Balance Sheets of FAOSTAT can be used as activity data on per capita “protein supply quantity.” This information represents the total amount of protein available to the population but must be adjusted to reflect the fraction of protein consumed (FPC), according to the new Equation 6.10a.
Nitrogen in protein available (ProteinSUPPLY ●
FNPR)
Food waste disposed to sewer
(FNON-CON)
Nitrogen in protein consumed (Protein ● FNPR)
Nitrogen in household
products (NHH)
Wastewater treatment
N2O emissions
after discharge
Industrial and commercial protein disposed to sewer
(FIND-COM)
Nitrogen removed in
sludge
N2, N2O losses to atmosphere during
transport and treatment
Nitrogen in treated
wastewater

Chapter 6: Wastewater Treatment and Discharge
2019 Refinement to the 2006 IPCC Guidelines for National Greenhouse Gas Inventories 6.41
EQUATION 6.10A (NEW) ESTIMATION OF PROTEIN CONSUMED
•SUPPLYProtein = Protein FPC
Where:
ProteinSUPPLY = annual per capita protein supply, kg protein/person/yr
FPC = Fraction of protein consumed. Default regional values are listed in the new Table 6.10a
Food that is not consumed may be disposed to the sewer (e.g., as result of the use of food waste disposals in some countries) and a factor for non-consumed protein (FNON-CON) should be used to reflect this additional N entering wastewater (see new Table 6.10a). If food waste is disposed with solid waste, it is assumed that no additional N is entering wastewater and FNON-CON = 1.
Bath and laundry water may contain household chemicals (detergents, shampoos, softeners, dishwashing agents, WC fresheners, cosmetics, etc.) and a factor for N from household products (NHH) should be used. The default factor for NHH is 1.1 (Henze et al. 2008; Tjandraatmadja et al. 2008), but additional regional factors are provided in Table 6.10a.
TABLE 6.10A (NEW) DEFAULT FACTORS FOR DOMESTIC WASTEWATER
Region1
Protein consumed2 as fraction of protein supply
FNON-CON2 in case food waste is disposed in sewer
Additional N from households’ chemicals
Europe 0.85 1.09 1.08
North America and Oceania 0.80 1.13 1.17 (USA) 1.07 (Australia)
Industrialised Asia 0.86 1.08 No data
Sub-Saharan Africa 0.98 1.01 No data
North Africa, West and central Asia 0.90 1.06 No data
South and Southeast Asia 0.96 1.02 1.13 (India)
Latin America 0.92 1.04 No data 1 See Annex 6A.7 for a list of countries by region 2 Based on FAO (2011)

Volume 5: Waste
6.42 2019 Refinement to the 2006 IPCC Guidelines for National Greenhouse Gas Inventories
TABLE 6.10B (NEW) ESTIMATE ON USE OF FOOD WASTE DISPOSAL IN SEWER1
Country Share of households disposing food waste in sewer
USA 50%
Canada 10%
Australia 12%
New Zealand 30%
UK 5%
Ireland 1 – 2%
Italy Supported
Czech Republic <1% / not allowed
Denmark Rare
Belgium Restricted / not allowed
The Netherlands Not allowed
Germany Not allowed 1 Based on EPA (2008) and expert judgment by Lead Authors
Wastewater from industrial or commercial sources that is discharged into the sewer may contain protein (e.g., from grocery stores and butchers). The default for this fraction is 1.25 for centralised treatment and 0 for decentralised treatment systems (septic system, latrines, discharge).
NITROGEN IN WASTEWATER EFFLUENT (NE F F L U E N T , D O M) The total nitrogen in wastewater effluent is estimated as follows:
EQUATION 6.8 (UPDATED) TOTAL NITROGEN IN DOMESTIC WASTEWATER EFFLUENT
( ), ,( ) 1EFFLUENT DOM DOM j REM jj
N TN T N = • • − ∑
Where:
NEFFLUENT,DOM = total nitrogen in the wastewater effluent discharged to aquatic environments in inventory year, kg N/yr
TNDOM = total nitrogen in domestic wastewater in inventory year, kg N/yr. See new Equation 6.10.
Tj = degree of utilisation of treatment system j in inventory year (ij
iT∑ ). See Table 6.5
j = each wastewater treatment type used in inventory year
NREM = fraction of total wastewater nitrogen removed during wastewater treatment per treatment type j. See new Table 6.10c. Pathways for N removal include transfer to sludge and nitrification–denitrification with concomitant N loss to the atmosphere.

Chapter 6: Wastewater Treatment and Discharge
2019 Refinement to the 2006 IPCC Guidelines for National Greenhouse Gas Inventories 6.43
TABLE 6.10C (NEW) WASTEWATER TREATMENT NITROGEN REMOVAL FRACTIONS (NREM)
ACCORDING TO TREATMENT TYPE
Treatment Type Default Range
No treatment 01–3 01–3
Primary (mechanical) 0.101–3 0.05 – 0.201–3
Secondary (biological) 0.401–3 0.35 – 0.551–3
Tertiary (advanced biological) 0.801–4 0.45 – 0.851–4
Septic tank 0.151–3 0.10 – 0.251–3
Septic tank + land dispersal field 0.685 0.62 – 0.735
Latrine 0.126 0.07 – 0.216
Sources: 1 Kristensen et al. (2004) 2 Van Drecht et al. (2009) 3 Based on expert judgment by Lead Authors of this section. 4 Ekama and Wentzel (2008) 5 Andreoli et al. (1979) 6 EMEP/EAA (2016)
6.3.2 Time series consistency No refinement.
6.3.3 Uncertainties Large uncertainties are associated with the IPCC default factors for N2O. Updated Table 6.11 below includes uncertainty ranges based on expert judgment.
TABLE 6.11 (UPDATED) N2O METHODOLOGY DEFAULT DATA
Definition Default Value Range
Emission Factor EF N2O emission factor See Table 6.8a See Table 6.8a Activity Data P Number of people in country Country-specific ± 10 % Protein Annual per capita protein consumption Country-specific ± 10 %
FNPR Fraction of nitrogen in protein (kg N/kg protein) 0.16 0.15 – 0.17
Tplant Degree of utilisation of large WWT plants Country-specific ± 20 %
FNON-CON
Factor to adjust for non-consumed protein, based on available protein
1.0 for countries with no in-sink disposals,
1.1 for countries with in-sink disposals
0.9 – 1.2
Factor to adjust for non-consumed protein, based on consumed protein
1.1 for countries with no in-sink disposals,
1.25 for countries with in-sink disposals
1.0 – 1.4
FIND-COM
Factor to allow for co-discharge of industrial nitrogen into sewers. For countries with significant fish processing plants, this factor may be higher. Expert judgment is recommended.
1.25 1.0 – 1.5

Volume 5: Waste
6.44 2019 Refinement to the 2006 IPCC Guidelines for National Greenhouse Gas Inventories
TABLE 6.11 (UPDATED) (CONTINUED) N2O METHODOLOGY DEFAULT DATA
Definition Default Value Range
NREM Factor to account for losses of nitrogen prior to discharge See Table 6.10c See Table 6.10c
6.3.4 QA/QC, Completeness, Reporting and Documentation
No refinement.
6.4 NITROUS OXIDE EMISSIONS FROM INDUSTRIAL WASTEWATER
6.4.1 Methodological issues This section refines the 2006 IPCC Guidelines by adding new guidance for estimating N2O emissions from industrial WWTPs and refines the estimation of N2O emissions from wastewater after disposal of untreated wastewater or wastewater treatment effluent into aquatic environments by accounting for losses of nitrogen prior to disposal.
6.4.1.1 CHOICE OF METHOD A decision tree for industrial wastewater is included in new Figure 6.6.
The steps for good practice in inventory preparation for N2O from industrial wastewater are as follows:
Step 1: Use new Equation 6.13 to estimate total nitrogen in wastewater.
Step 2: Select the pathway and systems (see updated Figure 6.1) according to country activity data. Select the emission factor for each industrial wastewater treatment/discharge pathway or system.
Step 3: Use new Equation 6.11 to estimate emissions from wastewater treatment and sum the results for each pathway/system.
Step 4: Use new Equation 6.12 to estimate emissions from effluent, accounting for losses of nitrogen that occur within the wastewater treatment process, including sludge removal, and sum the results for each pathway/system.
As described earlier, the wastewater characterisation will determine the fraction of wastewater treated or disposed of by a particular system. To determine the use of each type of treatment or discharge system, it is good practice to refer to national statistics (e.g., from regulatory authorities). If these data are not available, industry associations may have data on the system usage. Otherwise, consultation with industry experts can help, and expert judgment can also be applied (see Chapter 2 Approaches to Data Collection, Volume 1).
EQUATION 6.11 (NEW) N2O EMISSIONS FROM INDUSTRIAL WASTEWATER TREATMENT PLANTS
.44 ( )28i2 IND i j j IND
iN O Plants T EF TN = • • •
∑
Where:
N2O PlantsIND = N2O emissions from industrial wastewater treatment plants in inventory year, kg N2O/yr
TNINDi = total nitrogen in wastewater from industry i in inventory year, kg N/yr. See new Equation 6.13.
Ti,j = degree of utilisation of treatment/discharge pathway or system j, for each industry i in inventory year
i = industry
Chapter 6: Wastewater Treatment and Discharge
2019 Refinement to the 2006 IPCC Guidelines for National Greenhouse Gas Inventories 6.45
j = each treatment/discharge pathway or system
EFj = emission factor for treatment/discharge pathway or system j, kg N2O-N/kg N. See Table 6.8a (New).
The factor 44/28 is for the conversion of kg N2O-N into kg N2O.

Volume 5: Waste
6.46 2019 Refinement to the 2006 IPCC Guidelines for National Greenhouse Gas Inventories
Figure 6.6 (New) Decision tree for N2O emissions from industrial wastewater
It is also required to estimate N2O emissions from wastewater treatment effluent that is discharged into aquatic environments. The methodology for emissions from effluent is like that of N2O emissions explained in Volume 4, Section 11.2.2, Chapter 11, N2O Emissions from Managed Soils, and CO2 Emissions from Lime and Urea Application. The simplified general equation is as follows:
Tier 3 for treatment: Estimate emissions
using bottom-up data.
Tier 2 for treatment: Estimate N2O emissions using country-specific
emission factors.
Estimate emission factors using a review of industry
wastewater treatment practices.
For these industrial sectors,
is a country-specific method from individual facilities
or companies available?
For theseindustrial sectors, are
N and wastewater outflow data available?
Is industrial wastewater a key
category1?
Identify major industrial sectors with large potentials
for N2O emissions(see Table 6.12).
Are country-specific emission factors for selected industrial sectors available?
Estimate outflow using industrial production data.
Tier 1 for treatment: Estimate emissions using
default data.
Collect N and outflow
for each industrial
sector.
Start
1 See Volume 1 Chapter 4, "Methodological Choice and Identification of Key Categories" (noting Section 4.1.2 on limited resources), for discussion of key categories and use of decision trees.
Yes
No
Yes No
No
Yes
No
Yes
Are activity data available to categorise discharge by type of
waterbody?
Tier 3 for discharge:Estimate emissions from
discharge to reservoirs, lakes, and estuaries using country-specific emissions data and
methodology.
No
YesIs a country-
specific method available?
NoYes
Tier 1 for discharge:Estimate emissions from discharge to reservoirs,
lakes, and estuaries using default emissions factors and
methodology.

Chapter 6: Wastewater Treatment and Discharge
2019 Refinement to the 2006 IPCC Guidelines for National Greenhouse Gas Inventories 6.47
EQUATION 6.12 (NEW) N2O EMISSIONS FROM INDUSTRIAL WASTEWATER EFFLUENT
,44282 IND EFFLUENT IND EFFLUENTN OEffluent N EF= • •
Where:
N2OEffluentIND = N2O emissions from industrial wastewater effluent in inventory year, kg N2O/yr
N EFFLUENT, IND = nitrogen in the industrial wastewater effluent discharged to aquatic environments, kg N/yr. See new Equation 6.14.
EFEFFLUENT = emission factor for N2O emissions from wastewater discharged to aquatic systems, kg N2O-N/kg N
The factor 44/28 is for the conversion of kg N2O-N into kg N2O.
6.4.1.2 CHOICE OF EMISSION FACTORS New Table 6.8a includes default EF values for N2O emissions.
6.4.1.3 CHOICE OF ACTIVITY DATA
TOTAL NITROGEN IN INDUSTRIAL WASTEWATER (TNI N D) The activity data for this source category is the amount of total nitrogen (TN) in the industrial wastewater entering treatment (TNIND). This parameter is a function of industrial output (product) P (tonnes/yr), wastewater generation W (m3/ton of product), and total N concentration in the untreated wastewater (kg TN/m3). See new Equation 6.13. The following steps are required for determination of TNIND:
(i) Identify the industrial sectors that generate wastewater with large quantities of N, by evaluating total industrial product, N in the wastewater, and wastewater produced.
(ii) Identify industrial sectors that use treatment systems with N2O emissions factors (see new Table 6.8a). Experience has shown that usually three or four industrial sectors are key.
For each selected sector estimate total N in the industrial wastewater (TNIND).
EQUATION 6.13 (NEW) TOTAL NITROGEN IN INDUSTRIAL WASTEWATER
INDi i i iTN P W TN= • •
Where:
TNINDi = total nitrogen in wastewater entering treatment for industry i, kg TN/yr
i = industrial sector
Pi = total industrial product for industrial sector i, t/yr
Wi = wastewater generated for industrial sector i, m3/t product
TNi = total nitrogen in untreated wastewater for industrial sector i, kg TN/m3
Industrial production data and wastewater generation rates may be obtained from national statistics, regulatory agencies, wastewater treatment associations or industry associations. In some cases, quantification of the N loading in the wastewater may require expert judgment. In some countries, N content and total water usage per sector data may be available directly from a regulatory agency. New Table 6.12 provides examples that could be used as default values for industries that may be considered key sources of N2O. These values should be used with caution, because they are industry-, process-, and country-specific.

Volume 5: Waste
6.48 2019 Refinement to the 2006 IPCC Guidelines for National Greenhouse Gas Inventories
TABLE 6.12 (NEW) EXAMPLES OF INDUSTRIAL WASTEWATER DATA
Industry Type Wastewater Generation W Range for W Total Nitrogen (TN) TN Range
(m3/tonne) (m3/tonne) (kg/m3) (kg/m3)
Alcohol refining 242 16 – 322 2.42 0.94 – 3.862
Beer & malt 6.32 5.0 – 9.02 0.0553 0.025 – 0.083
Fish processing 52 2 – 82 0.602 0.21 – 0.982
Iron and steel manufacturing 51 0.004 – 10.44 0.251 0.0004 – 0.5244
Meat & poultry 132 8 – 182 0.192 0.17 – 0.202
Nitrogen fertiliser 2.892 0.46 – 8.32 0.52 0.1 – 0.82
Plastics & resins 0.65 0.3 – 1.25 0.256 No range provided
Starch production 92 4 – 182 0.92 0.8 – 1.102 1 Based on expert judgment by Lead Authors of this section. 2 IPCC (2014) 3 Simate et al. (2011) 4 US EPA (2002a) 5 Doorn et al. (1997) 6 Li et al. (2016)
NITROGEN REMOVED FROM WASTEWATER (NR E M)
Nitrogen removal by different treatment facilities can range from 10–85 percent. Default values for the fraction of nitrogen removed by type of wastewater treatment system are presented in Table 6.10c.
NITROGEN IN WASTEWATER EFFLUENT (NE F F L U E N T , I N D) The total nitrogen in the industrial wastewater effluent is estimated as follows:
EQUATION 6.14 (NEW) TOTAL NITROGEN IN INDUSTRIAL WASTEWATER EFFLUENT
( ), ,1iEFFLUENT IND IND j REM j
jN TN T N = • • − ∑
Where:
NEFFLUENT, IND = total annual amount of nitrogen in the industrial wastewater effluent, kg N/yr
TNINDi = total nitrogen in wastewater entering treatment for industry i, kg TN/yr
Tj = degree of utilisation of treatment system j in inventory year (ij
iT∑ ). See Table 6.5.
j = each wastewater treatment type used in inventory year
NREM,j = fraction of total wastewater nitrogen removed during wastewater treatment per treatment type j. See new Table 6.10c.
6.4.2 Time series consistency Once an industrial sector is included in the inventory calculation, it should be included for each subsequent year. If the inventory compiler adds a new industrial sector to the calculation, then he or she should re-calculate the entire time series so that the method is consistent from year to year. General guidance on recalculation of estimates through time series is provided in Volume 1, Chapter 5, Time Series Consistency.
If a country decides to incorporate plant emissions into the estimate, this change must be made for the entire time series. Potential sludge removal should be treated consistently across years in the time series.

Chapter 6: Wastewater Treatment and Discharge
2019 Refinement to the 2006 IPCC Guidelines for National Greenhouse Gas Inventories 6.49
6.4.3 Uncertainties Uncertainty estimates for EF, P, W and TN are provided in new Table 6.13. The estimates are based on expert judgment.
TABLE 6.13 (NEW) DEFAULT UNCERTAINTY RANGES FOR INDUSTRIAL WASTEWATER
Parameter Uncertainty Range
Emission Factor
N2O emission factor ± 30%
Activity Data
Industrial production (P) ± 25% Use expert judgment regarding the quality of data source to assign more accurate uncertainty range.
Wastewater/unit production (W)
These data can be very uncertain as the same sector might use different waste handling procedures at different plants and in different countries. The product of the parameters (W•TN) is expected to have less uncertainty. An uncertainty value can be attributed directly to TN concentration. –50 %, +100% is suggested (i.e., a factor of 2).
TN/unit wastewater (TN)
Source: Expert Judgment by Lead Authors of this section.
6.4.4 QA/QC, Completeness, Reporting and Documentation
QUALITY ASSURANCE / QUALITY CONTROL (QA/QC) It is good practice to conduct quality control checks and quality assurance procedures as outlined in Chapter 6, QA/QC and Verification, of Volume 1. Below, some fundamental QA/QC procedures include:
• For industrial wastewater, inventory compilers may review the secondary data sets (e.g., from national statistics, regulatory agencies, wastewater treatment associations or industry associations) that are used to estimate and rank industrial TN waste output. Some countries may have regulatory control over industrial discharges, in which cases significant QA/QC protocols may already be in place for the development of the wastewater characteristics on an industry basis.
• For industrial wastewater, inventory compilers should cross-check values for EFs against those from other national inventories with similar wastewater characteristics.
• If sludge removal is reported in the wastewater inventory, check for consistency with the estimates for sludge applied to agriculture soils, sludge incinerated, and sludge deposited in solid waste disposal.
• For countries that use country-specific parameters or higher tier methods, inventory compilers should cross-check the national estimates with emissions using the IPCC default method and parameters.
COMPLETENESS Completeness for estimating emissions from industrial wastewater depends on an accurate characterisation of industrial sectors that produce nitrogen-laden wastewater. In most countries, approximately 3–4 industrial sectors will account for the majority of the nitrogenous wastewater volume, so the inventory compilers should ensure that these sectors are covered. Periodically, the inventory compilers should re-survey industrial sources, particularly if some industries are growing rapidly.
This category should only cover industrial wastewater treated onsite. Emissions from industrial wastewater released into domestic sewer systems should be addressed and included with domestic wastewater.
Some sludge from industrial wastewater treatment may be incinerated or deposited in landfills or on agricultural lands. This constitutes an amount of N that should be subtracted from effluent N. It is good practice to be consistent across sectors: the amount of N that is removed as sludge should be equal to the amount of sludge disposed at landfills, applied to agricultural soils, incinerated, or treated elsewhere.

Volume 5: Waste
6.50 2019 Refinement to the 2006 IPCC Guidelines for National Greenhouse Gas Inventories
REPORTING AND DOCUMENTATION It is good practice to document and report a summary of the methods used, activity data and emission factors. When country-specific methods and/or emission factors are used, the reasoning for the choices as well as references to how the country-specific data (measurements, literature, expert judgment, etc.) have been derived (measurements, literature, expert judgment, etc.) should be documented and included in the reporting.
If sludge is incinerated, landfilled, or spread on agricultural lands, the quantities of sludge and associated emissions should be reported in the waste incineration, solid waste disposal systems, or agricultural categories, respectively.
More information on reporting and documentation can be found in Volume 1, Chapter 6, Section 6.11 Documentation, archiving and reporting.

Chapter 6: Wastewater Treatment and Discharge
2019 Refinement to the 2006 IPCC Guidelines for National Greenhouse Gas Inventories 6.51
Appendix 6A.1 Non-biogenic (fossil) CO2 emissions from wastewater treatment and discharge: Basis for Future Methodological Development The 2006 IPCC Guidelines assume that organic carbon present in wastewater derives from modern (biogenic) organic matter in human excreta or food waste (Doorn et al. 2006). Consequently, CO2 emissions from wastewater treatment according to those Guidelines are also considered wholly biogenic and are discounted from international greenhouse gas accounting inventories, since they do not represent a transfer of carbon from the lithosphere to the atmosphere. In comparison, fossil organic carbon (that with turnover timescales exceeding 106 years) is considered to have a role in climate change and is accounted for in international greenhouse gas emissions inventories. In the 2006 IPCC Guidelines, it is assumed that emissions from biogas flaring are not significant because the CO2 emissions are of biogenic origin and the CH4 and N2O emissions are very small so good practice in the Waste Sector does not require their estimation. If countries wish to report such emissions, they should be reported under the Waste Sector. A discussion of emissions from flares and more detailed information are given in Volume 2, Energy, Chapter 4.2. However, the presence of fossil organic carbon in sewage also implies the emission of additional fossil CO2 from wastewater treatment facilities, sludge management, and environmental recipients of treated or untreated wastewater.
Data emerging since the 2006 IPCC Guidelines indicate that wastewater contains an appreciable amount of non-biogenic (fossil) organic carbon, with this fossil carbon thought to be derived from the use of petroleum-based products (domestically and commercially). These products include: cosmetics; pharmaceuticals; surfactants; detergents and food additives (Law et al. 2013). Additionally, direct dosing of synthetic, fossil-derived organic substrates (e.g., methanol) can occur at wastewater treatment plants to enhance denitrification performance (Schneider et al. 2015). Despite early indications of the potential for significant fossil organic carbon fractions in sewage sludge (Turekian & Benoit 1981), fossil carbon in wastewater was first detailed by Griffith et al. (2009) following the sampling of treated effluent from 12 predominantly domestic wastewater treatment plants within the Hudson and Connecticut River watersheds, USA. Since then, several studies have surveyed fossil organic carbon in wastewater from Japan (Nara et al. 2010; Toyoda et al. 2011), Australia (Law et al. 2013), Denmark (Yoshida et al. 2014) and North America (Schneider et al. 2015).
Research published since the 2006 IPCC Guidelines (Griffith et al. 2009; Law et al. 2013; Yoshida et al. 2014; Schneider et al. 2015; Tseng et al. 2016) gives an emerging consensus figure for the fossil wastewater organic carbon fraction at some 4–14percent; although more recent work suggests this can be as high as 28percent (Tseng et al., 2016) or 51percent (Nara et al. 2010; recalculated by Tseng et al. 2016) in some influents. Schneider et al. (2015) put the fossil content of activated sludge process off-gases at 10–15percent. Law et al. (2013) put the subsequent fossil carbon fraction in anaerobic digester biogas CO2 at 2.1±0.2percent due to greater recalcitrance of fossil carbon during anaerobic digestion, and total additional scope 1 wastewater treatment plant emission load from previously unaccounted fossil carbon somewhere between 2–12percent. Tseng et al. (2016) put this figure at some 13 to 24percent higher without and with energy recovery respectively.
Based on the above data, countries are encouraged to evaluate if such emissions should be reported, particularly those countries that have higher levels of fossil carbon in wastewater. In addition, future improvements to the IPCC Guidelines should include a method for estimating these non-biogenic emissions associated with wastewater treatment operations and wastewater discharges.

Volume 5: Waste
6.52 2019 Refinement to the 2006 IPCC Guidelines for National Greenhouse Gas Inventories
TABLE 6AP.1 (NEW) SUMMARY OF LITERATURE INVESTIGATING FOSSIL ORGANIC CARBON IN WASTEWATER
Wastewater treatment system Detection/measurement approach Fossil C fraction in various wastewater streams Reference Comments
Effluent from 12 WWTPs (using conventional activated sludge) sampled, USA
Effluent grab samples; 14C analysed via isotope ratio mass spectrometry
25% of treated wastewater dissolved organic carbon (DOC) and 14% of treated wastewater particulate organic carbon (POC)
Griffith et al. (2009) WWTPs handle predominantly domestic wastewater. Secondary treated effluent sampled only (i.e. not raw influent), so results may overestimate true fossil carbon fraction in raw sewage, since heterotrophic bacteria are known to preferentially utilize young (14C-enriched) carbon for assimilation (Raymond & Bauer 2001). Average reported effluent DOC concentration was 8.7 mg/L.
Four large activated sludge WWTPs in Brisbane, Australia (two receiving domestic sewage and two receiving 15% industrial load)
Range of sampling locations (influent, primary- and secondary-treated effluent, waste activated sludge (WAS), digested biosolids)
Fossil fraction of total organic carbon (TOC) in domestic WWTP influent 4–7% and 8–14% for WWTPs receiving 15% industrial load (5–14% overall range); ≈29–50% of this influent fossil C is transformed to CO2 during secondary activated sludge treatment (1.4–6.3% of influent TOC). Higher fossil C fraction in WAS from WWTPs receiving industrial load (8–14%) versus domestic WWTPs (6–7%). 2.1(±0.2)% of biogas CO2 is fossil in origin.
Law et al. (2013) Higher fossil C fractions in WWTPs receiving industrial wastewater load. Equivalent concentrations of fossil organic carbon in raw wastewater were between 6–35 mg/L. Majority of fossil organic carbon in raw wastewater is present in particulate form (>80%; 5 to 29 mg/L), whereas dissolved fossil carbon levels are relatively small (1–6 mg/L).
Influent to Avedøre WWTP, Denmark
Single 24-hour flow proportionate composite influent sample collected in February 2013. Radiocarbon isotope ratio method (ASTM-D6866-12).
14(±3)% in influent wastewater Yoshida et al. (2014) Avedøre WWTP receives 15% industrial load from adjacent pharmaceuticals industry. Figure of 14% is corrected for cellulosic biogenic carbon from toilet paper which may contain elevated levels of 14C due to historical atomic bomb detonations and underestimate fossil C fraction.
Modified Ludzack–Ettinger (MLE) activated sludge process with biological nitrification–denitrification, USA
14C content of emitted CO2 measured twice a day for five days in early spring using floating chambers
11.4–15.1% (mean 12.83%) based on measured CO2 emissions from secondary treatment reactor
Schneider et al. (2015)
Three municipal WWTPs and waste stabilisation ponds, two industrial WWTPs
Raw and partially treated wastewater, gas and sludge samples taken during 2010–2013
2–28% in the primary influent Tseng et al. (2016) Article provides a tabulation of results from 6 separate research papers.

Chapter 6: Wastewater Treatment and Discharge
2019 Refinement to the 2006 IPCC Guidelines for National Greenhouse Gas Inventories 6.53
TABLE 6AP.1 (NEW) (CONTINUED) SUMMARY OF LITERATURE INVESTIGATING FOSSIL ORGANIC CARBON IN WASTEWATER
Wastewater treatment system Detection/measurement approach Fossil C fraction in various wastewater streams Reference Comments
Assumed conventional activated sludge-based WWTP with primary gravity sedimentation, Japan
Fresh domestic sewage, primary-treated and secondary-treated wastewater sampled
∆14C values (‰) of sewage DOC was more negative (14C ages in the order of ≈1000–5000 years) than nearby lake and river water; no fossil C fraction given.
Nara et al. (2010) No information on relative fossil C fraction given.
A2O WWTP, Japan 13 wastewater samples collected along the treatment train during March, 2008
δ13C signature of −50.7‰ (depleted with respect to background air)
Toyoda et al. (2011) WWTP received municipal wastewater

Volume 5: Waste
6.54 2019 Refinement to the 2006 IPCC Guidelines for National Greenhouse Gas Inventories
Annex 6A.1 Summary data for pit latrine use, no sanitation facility, and groundwater use by country
TABLE 6A.1 (NEW) SUMMARY DATA FOR PIT LATRINE USE, NO SANITATION FACILITY, AND GROUNDWATER USE BY COUNTRY
Country Data Source1
Report Year
Pit Latrine Use for Sanitation
(%)
No Sanitation Facility (%)
Groundwater Use for
Drinking (%)
Afghanistan MICS 2010–2011 42.5 17.7 62.9
Albania DHS 2008–2009 24.0 0.0 20.8
Algeria MICS 2006 2.2 4.9 13.4
Angola MICS 2001 31.0 38.7 37.5
Armenia DHS 2010 30.4 0.0 2.5
Azerbaijan DHS 2006 58.8 0.3 25.7
Bangladesh DHS 2007 60.1 7.5 90.8
Belarus MICS 2005 27.5 0.0 12.5
Belize MICS 2006 40.7 2.1 7.5
Benin DHS 2006 11.7 69.5 38.6
Bhutan MICS 2010 52.7 3.4 1.5
Bolivia DHS 2008 25.7 28.4 7.9
Bosnia and Herzegovina MICS 2006 2.5 0.1 15.7
Botswana MICS 2000 57.2 16.2 2.9
Brazil DHS 1996 42.2 21.3
Burkina Faso MICS 2006 1.0 62.6 68.9
Burundi MICS 2005 92.7 3.0 69.0
Cambodia DHS 2010 5.7 55.3 50.0
Cameroon MICS 2006 82.6 7.5 49.9
Central African Republic MICS 2006 75.4 22.3 69.1
Chad DHS 2004 24.3 74.1 77.2
China CHS04 2004 49.9 2.3 20.1
Colombia DHS 2010 0.7 4.8 3.2
Comoros MICS 2000 95.0 0.7 7.9
Congo DHS 2005 84.4 10.2 30.6
Côte d'Ivoire MICS 2006 42.7 34.0 51.8
Cuba MICS 2010–2011 25.7 1.0 18.2
Democratic People's Republic of Korea MICS 2009 37.4 0.0 10.8
Democratic Republic of the Congo MICS 2010 80.0 14.5 59.1
Djibouti MICS 2006 73.4 3.9 2.7
Dominican Republic DHS 2007 47.6 36.0 9.7
Egypt DHS 2008 0.4 4.0
Eritrea DHS 2002 9.0 74.3 45.2

Chapter 6: Wastewater Treatment and Discharge
2019 Refinement to the 2006 IPCC Guidelines for National Greenhouse Gas Inventories 6.55
TABLE 6A.1 (NEW) (CONTINUED) SUMMARY DATA FOR PIT LATRINE USE, NO SANITATION FACILITY, AND GROUNDWATER USE BY COUNTRY
Country Data Source1
Report Year
Pit Latrine Use for Sanitation
(%)
No Sanitation Facility (%)
Groundwater Use for
Drinking (%)
Ethiopia DHS 2011 56.0 38.2 50.6
Gabon DHS 2000 92.8 3.0 40.0
Gambia MICS 2005–2006 80.6 4.4 41.0
Georgia MICS 2005 57.8 0.0 25.7
Ghana MICS 2010–2011 56.6 0.5 0.1
Guatemala DHS 1998–1999 40.9 13.2 14.9
Guinea DHS 2005 67.2 30.3 60.7
Guinea-Bissau MICS 2006 4.0 31.1 79.1
Guyana DHS 2009 43.3 1.0 3.5
Haiti DHS 2005–2006 32.0 0.0 45.0
Honduras DHS 2005–2006 39.8 16.7 15.8
India DHS 2005–2006 12.9 56.2 58.6
Indonesia DHS 2007 3.8 8.1 52.3
Iraq MICS 2006 28.9 2.5 3.4
Jamaica MICS 2005 77.2 0.6 3.3
Jordan DHS 2009 43.5 0.0 0.0
Kazakhstan MICS 2006 62.3 0.0 22.5
Kenya DHS 2008–2009 67.3 14.5 41.4
Kyrgyzstan MICS 2005–2006 82.0 0.1 10.1
Lao People's Democratic Republic MICS 2006 31.7 50.1 48.7
Lesotho DHS 2009 66.8 35.6 36.2
Liberia DHS 2007 20.1 54.7 76.2
Madagascar DHS 2008–2009 35.1 43.7 53.3
Malawi DHS 2010 84.9 9.9 75.3
Maldives DHS 2009 27.8 1.0 1.3
Mali DHS 2006 60.2 19.6 69.9
Mauritania MICS 2007 35.1 45.5 37.7
Mongolia MICS 2005 67.1 13.4 60.7
Montenegro MICS 2005–2006 7.7 0.3 9.2
Morocco DHS 2003–2004 1.7 15.9 16.3
Mozambique MICS 2008 52.7 41.8 55.9
Myanmar MICS 2009–2010 74.9 7.0 73.6
Namibia DHS 2006–2007 11.7 53.4 16.6
Nepal DHS 2011 21.0 38.4 46.9
Nicaragua DHS 2001 59.1 13.9 25.3
Niger DHS 2006 21.5 78.0 74.3
Nigeria MICS 2007 58.9 27.7 47.6
Pakistan DHS 2006–2007 13.7 28.4 55.6

Volume 5: Waste
6.56 2019 Refinement to the 2006 IPCC Guidelines for National Greenhouse Gas Inventories
TABLE 6A.1 (NEW) (CONTINUED) SUMMARY DATA FOR PIT LATRINE USE, NO SANITATION FACILITY, AND GROUNDWATER USE BY COUNTRY
Country Data Source1
Report Year
Pit Latrine Use for Sanitation
(%)
No Sanitation Facility (%)
Groundwater Use for
Drinking (%)
Peru DHS 2011 1.9 12.0 6.6
Philippines DHS 2008 11.7 9.6 39.0
Republic of Moldova DHS 2005 62.5 0.0 56.0
Rwanda DHS 2010 96.6 1.1 59.0
Samoa DHS 2009 10.0 0.1 3.8
Sao Tome and Principe DHS 2008–2009 23.1 57.7 5.9
Senegal DHS 2010–2011 57.1 16.5 27.6
Serbia MICS 2010 4.5 0.0 8.5
Sierra Leone MICS 2010 63.4 28.9 54.1
Somalia MICS 2006 37.2 53.8 25.6
South Africa DHS 2003 36.7 8.1 3.8
Sudan MICS 2000 55.2 32.4 40.7
Suriname MICS 2006 19.6 6.3 3.1
Swaziland MICS 2010 69.7 15.4 19.3
Syrian Arab Republic MICS 2006 18.2 1.0 7.7
Tajikistan MICS 2005 85.5 0.4 14.2
TFYR Macedonia MICS 2005 6.9 3.1 7.0
Thailand MICS 2005–2006 1.4 0.8 12.3
Timor-Leste DHS 2009–2010 28.0 35.8 48.7
Togo MICS 2010 31.5 55.7 55.2
Trinidad and Tobago MICS 2006 15.0 0.1 1.2
Turkey DHS 2003 22.8 0.5 7.3
Turkmenistan DHS 2000 71.3 0.6 22.9
Uganda DHS 2006 66.4 11.8 73.5
Ukraine DHS 2007 47.2 0.0 28.0
United Republic of Tanzania DHS 2010 78.8 15.9 48.3
Uzbekistan MICS 2006 87.4 0.0 20.1
Vanuatu MICS 2007 77.3 3.2 22.7
Venezuela MICS 2000 6.7 4.4 2.1
Viet Nam MICS 2010–2011 18.2 6.4 43.7
Yemen MICS 2006 42.1 21.4 35.9
Zambia DHS 2007 57.1 23.5 47.1
Zimbabwe DHS 2010–2011 42.6 28.3 64.0 Sources: 1MICS: Multiple Indicator Cluster Surveys, UNICEF (http://www.childinfo.org/mics.html); DHS: Demographic and Health Surveys, USAID (http://www.measuredhs.com); CHS04: Economic, Population, Nutrition, and Health Survey, data accessed from WHO/UNICEF Joint Monitoring Programme reports (http://wssinfo.org)

Chapter 6: Wastewater Treatment and Discharge
2019 Refinement to the 2006 IPCC Guidelines for National Greenhouse Gas Inventories 6.57
Annex 6A.2 Derivation of the maximum CH4 producing potential (Bo) for domestic wastewater The maximum CH4 producing potential (Bo) for domestic wastewater is calculated theoretically by the anaerobic decomposition of glucose considering the total degradation of organic matter:
6 12 6 2 43 3C H O CO CH→ +
One mole of glucose weighs 180 g and produces 3 moles of methane which weighs 3 × 16 = 48 g. Therefore, the methane production rate per gram of glucose is 48 g /180 g = 0.27 g methane / g glucose.
The complete oxidation of one mole of glucose (180 g) requires six moles of oxygen (6 × 32 g = 192 g)
6 12 6 2 2 26 6 6C H O O CO H O+ → +
Then, the oxygen demand rate per gram of glucose is 192 g / 180 g = 1.067 g oxygen / g glucose
Finally, the maximum CH4 producing potential (Bo) for domestic wastewater based of COD content is 48 g CH4 / 192 g oxygen = 0.25 kg CH4 / kg COD.
The COD/BOD ratio of a specific wastewater indicates the amount of organic matter difficult to degrade. For domestic wastewater, a typical COD/BOD ratio is 2.4 based on empirical tests. However, the ratio between the components in any given domestic wastewater stream may vary due to contributions from other sources, particularly wastewater contributions from commercial or industrial sources. The expected range of COD/BOD ratios is between 1.5 and 3.5 (Henze et al. 2008).
Inventory compilers should compare country-specific data on COD/BOD ratio in domestic wastewater to IPCC default values of 2.4. If inventory compilers use country-specific COD/BOD ratio, they should provide documented justification why their country-specific values are more appropriate for their national circumstances.
It should be noted that the emission factors are made up of a) the maximum CH4 producing capacity (Bo) and b) MCF which indicates the extent to which the Bo is released in each wastewater treatment/discharge pathways or systems. If a country chooses to introduce country-specific data for Bo based on measured composition of wastewater, they must also update the MCF because the MCFs were developed using the default Bo values.
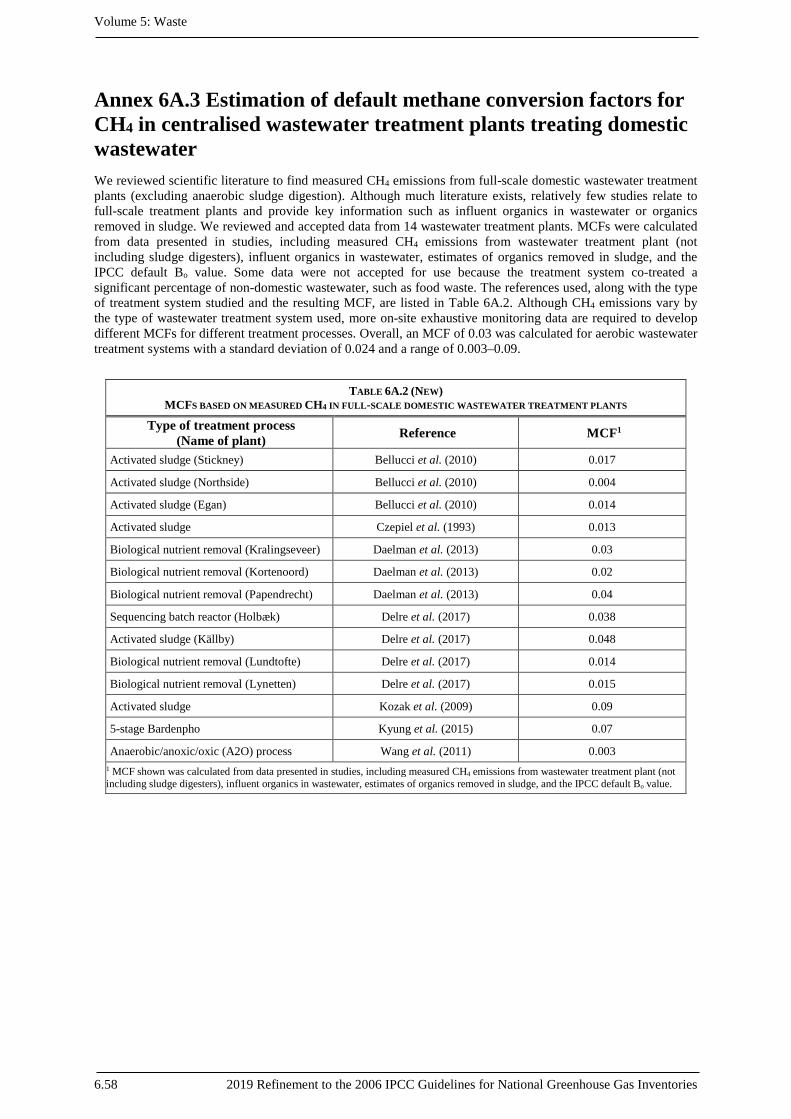
Volume 5: Waste
6.58 2019 Refinement to the 2006 IPCC Guidelines for National Greenhouse Gas Inventories
Annex 6A.3 Estimation of default methane conversion factors for CH4 in centralised wastewater treatment plants treating domestic wastewater We reviewed scientific literature to find measured CH4 emissions from full-scale domestic wastewater treatment plants (excluding anaerobic sludge digestion). Although much literature exists, relatively few studies relate to full-scale treatment plants and provide key information such as influent organics in wastewater or organics removed in sludge. We reviewed and accepted data from 14 wastewater treatment plants. MCFs were calculated from data presented in studies, including measured CH4 emissions from wastewater treatment plant (not including sludge digesters), influent organics in wastewater, estimates of organics removed in sludge, and the IPCC default Bo value. Some data were not accepted for use because the treatment system co-treated a significant percentage of non-domestic wastewater, such as food waste. The references used, along with the type of treatment system studied and the resulting MCF, are listed in Table 6A.2. Although CH4 emissions vary by the type of wastewater treatment system used, more on-site exhaustive monitoring data are required to develop different MCFs for different treatment processes. Overall, an MCF of 0.03 was calculated for aerobic wastewater treatment systems with a standard deviation of 0.024 and a range of 0.003–0.09.
TABLE 6A.2 (NEW) MCFS BASED ON MEASURED CH4 IN FULL-SCALE DOMESTIC WASTEWATER TREATMENT PLANTS
Type of treatment process (Name of plant) Reference MCF1
Activated sludge (Stickney) Bellucci et al. (2010) 0.017
Activated sludge (Northside) Bellucci et al. (2010) 0.004
Activated sludge (Egan) Bellucci et al. (2010) 0.014
Activated sludge Czepiel et al. (1993) 0.013
Biological nutrient removal (Kralingseveer) Daelman et al. (2013) 0.03
Biological nutrient removal (Kortenoord) Daelman et al. (2013) 0.02
Biological nutrient removal (Papendrecht) Daelman et al. (2013) 0.04
Sequencing batch reactor (Holbæk) Delre et al. (2017) 0.038
Activated sludge (Källby) Delre et al. (2017) 0.048
Biological nutrient removal (Lundtofte) Delre et al. (2017) 0.014
Biological nutrient removal (Lynetten) Delre et al. (2017) 0.015
Activated sludge Kozak et al. (2009) 0.09
5-stage Bardenpho Kyung et al. (2015) 0.07
Anaerobic/anoxic/oxic (A2O) process Wang et al. (2011) 0.003 1 MCF shown was calculated from data presented in studies, including measured CH4 emissions from wastewater treatment plant (not including sludge digesters), influent organics in wastewater, estimates of organics removed in sludge, and the IPCC default Bo value.

Chapter 6: Wastewater Treatment and Discharge
2019 Refinement to the 2006 IPCC Guidelines for National Greenhouse Gas Inventories 6.59
Annex 6A.4 Calculation of MCF for methane emissions from sewage discharges Data were obtained from a recent global review article by Deemer et al. (2016) for CO2 and CH4 emissions from different environments. At equilibrium with current atmospheric conditions, CO2 is relatively soluble (over 500 μg/L) compared with CH4 (about 40 ng/L) at 25 degrees Celsius. Therefore, a reliance on studies that only measure diffusive flux will underestimate the relative emission of CH4. Deemer et al. (2016) raised previous estimates of CH4 emissions by excluding data from sources that did not include assessment of ebullition. Regarding emissions from all kinds of reservoirs, this exclusion had the effect of increasing the relative CH4 flux (CH4-C/(CH4-C + CO2-C)) to 27 percent (first data row in Table 6A.3) which is higher than previously thought. For an estimate of this effect on the other data, it is noted that about 52 percent of the data listed by Deemer and colleagues included ebullition, and for this about 40–60 percent of the total ebullitive and diffusive flux was due to ebullition. To illustrate the potential effect of adding ebullition to the reservoir studies a scaling factor of 1.48 = 0.52/1 + 0.48/0.5 is applied for reservoirs and hydroelectric reservoirs in the table. Deemer et al. (2016) used (Bastviken et al. 2011) for an estimate of methane emissions from lakes and the original data (Table 1 in Bastviken and colleauges) suggests a smaller correction factor for that lake data of 1.23. For rivers, Stanley et al. (2016) reports a relationship similar to Deemer et al’s observation – that of total flux, 46 percent is ebullitive among those studies reporting both kinds of fluxes (see Table 1 in Stanley et al. 2016). Correcting the average of the larger dataset in Stanley et al. (2016) with this figure, suggests a range of riverine yields of 0.4–6 percent. Note that the riverine CO2 figure in Deemer et al. (2016) of 7,954 mg C/m2/day was based on original 1,800 Tg C/y datum in Raymond et al. (2013), which has been reduced using the Lauerwald et al. (2015) updated estimate of 659 Tg C/y figure and is thus 2,872 mg C/m2/day.
Considering the data in Table 6A.3, the average yield for reservoirs and lakes is 19percent (8–27 percent) while the average for rivers is much lower at 3.5 percent (0.4–6 percent). Data ranges rather than standard deviations are given owing to the potential for overlap between the underlying datasets. These CH4 yield data are used to estimate the MCF. On the same basis as the Bo calculation, 1.067 kg of O2 are required to oxidise one kg of glucose. Considering that 40 percent of glucose is carbon, this implies the COD of glucose on a carbon basis is 2.67 kg COD/kg C. So 0.19 kg CH4-C/kg (CH4-C + CO2-C) corresponds to 0.071 kg CH4-C/kg COD. Taking a global perspective, Tranvik et al. (2009) state that approximately 1.4 Pg of carbon is emitted from inland waters at CO2 and a further 0.1 Pg as CH4, the remainder being sequestered in sediments or lost to the ocean. Thus of 3.0 Pg of carbon inputs, 50 percent is emitted to the atmosphere. Correcting the previous figure for this yield and converting to kg CH4 suggests 0.071 [kg CH4-C/kg COD] × (12.01 + 1.00797×4)/12.01 [kg CH4/kg CH4-C] × 0.5 = 0.048 kg CH4/kg COD. For use in conjunction with Bo then MCF = 0.048/0.25 = 0.19 (0.08–0.27) for lakes and reservoirs. In the same way, MCF = 0.035 (0.004–0.06) for rivers and streams.

Volume 5: Waste
6.60 2019 Refinement to the 2006 IPCC Guidelines for National Greenhouse Gas Inventories
TABLE 6A.3 (NEW) SUMMARY OF LITERATURE INVESTIGATING METHANE EMISSIONS FROM WASTEWATER DISCHARGE
Type of Waterbody
CH4 flux (mg C/m2/day)
n (reservoirs, lakes or rivers)
CH4 flux corrected for ebullition
(mg C/m2/day)
CO2 flux (mg C/m2/day) Yield Approx.
revised yield Reference
Reservoirs 120 75 120 330 27% 27% Deemer et al. (2016)
Reservoirs 82–96 161 121–142 498 14–16% 20–22%
CH4: Bastviken et al. (2011), St. Louis et al. (2000); CO2: St Louis et al. (2000)
Hydroelectric reservoirs 24–112 85, 104 48–224 386–660 6–15% 8–20% Barros et al. (2011); Li and Zhang
(2014)
Lakes 40 66 80 216 16% 19% CH4: Bastviken et al. (2011); CO2 Raymond et al. (2013)
Rivers 6–98 21, 26 11–183 2872 0.21–3.3% 0.39–6.0%
CH4: Bastviken et al. (2011), Stanley et al. 2016; CO2: Lauerwald et al. (2015)

Chapter 6: Wastewater Treatment and Discharge
2019 Refinement to the 2006 IPCC Guidelines for National Greenhouse Gas Inventories 6.61
Annex 6A.5 Estimation of default emission factors for N2O in domestic wastewater treatment plants We reviewed scientific literature to find emission factors from full-scale domestic wastewater treatment plants. Although much literature exists regarding N2O emission from wastewater treatment processes, relatively few studies relate to full-scale treatment plants and provide key information such as influent nitrogen load. We collected 30 data and found that N2O emission correlated with influent nitrogen load (Figure 6A.1). Emission factors and references are listed in Table 6A.4 and Table 6A.5. Specific and relatively new/uncommon treatment processes such as membrane bioreactors were intentionally excluded from this list in order to develop emission factors for the most typical and widely used treatment processes globally. Although N2O emissions vary by the type of nitrogen removal process used, more on-site exhaustive monitoring data are required to develop different N2O emission factors for different treatment processes.
Figure 6A.1 (New) Correlation between influent total nitrogen (TN) loading and N2O emissions
TABLE 6A.4 (NEW) DEFAULT N2O EMISSION FACTORS FOR DOMESTIC WASTEWATER TREATMENT PLANTS
N2O emission factor (kg N2O-N/kg N) SD Maximum Minimum 0.016 0.012 0.045 0.00016
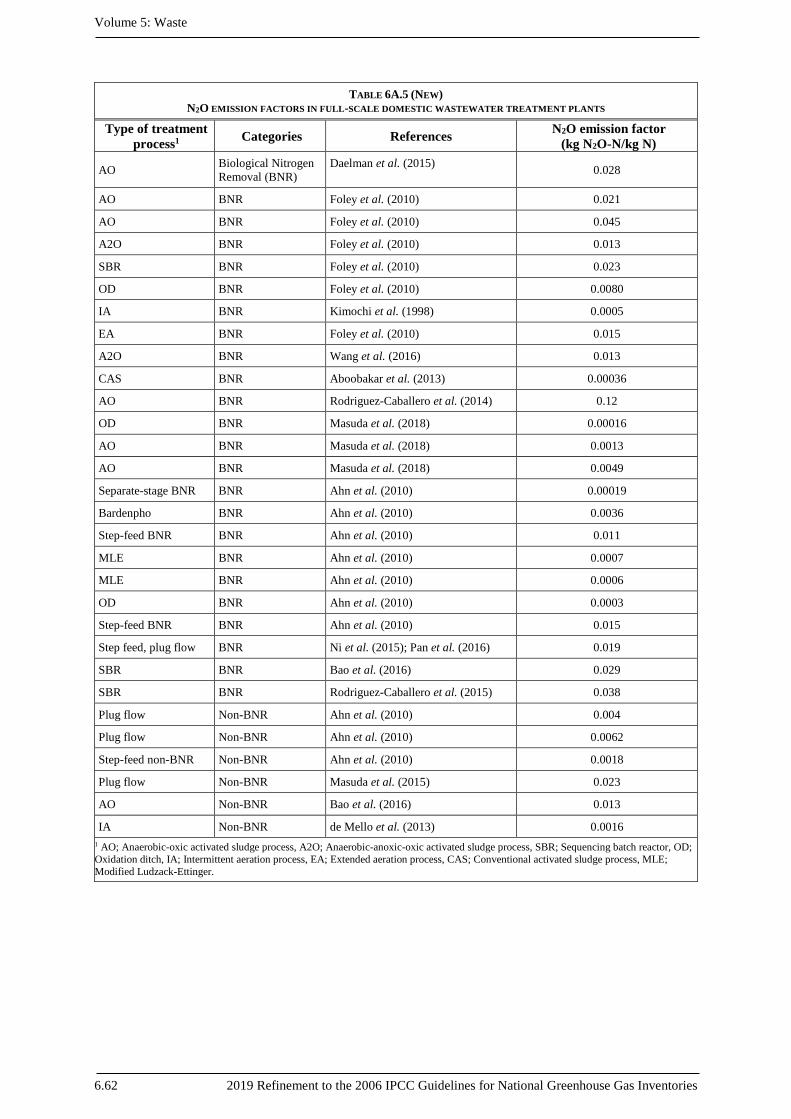
Volume 5: Waste
6.62 2019 Refinement to the 2006 IPCC Guidelines for National Greenhouse Gas Inventories
TABLE 6A.5 (NEW) N2O EMISSION FACTORS IN FULL-SCALE DOMESTIC WASTEWATER TREATMENT PLANTS
Type of treatment process1 Categories References N2O emission factor
(kg N2O-N/kg N)
AO Biological Nitrogen Removal (BNR)
Daelman et al. (2015) 0.028
AO BNR Foley et al. (2010) 0.021
AO BNR Foley et al. (2010) 0.045
A2O BNR Foley et al. (2010) 0.013
SBR BNR Foley et al. (2010) 0.023
OD BNR Foley et al. (2010) 0.0080
IA BNR Kimochi et al. (1998) 0.0005
EA BNR Foley et al. (2010) 0.015
A2O BNR Wang et al. (2016) 0.013
CAS BNR Aboobakar et al. (2013) 0.00036
AO BNR Rodriguez-Caballero et al. (2014) 0.12
OD BNR Masuda et al. (2018) 0.00016
AO BNR Masuda et al. (2018) 0.0013
AO BNR Masuda et al. (2018) 0.0049
Separate-stage BNR BNR Ahn et al. (2010) 0.00019
Bardenpho BNR Ahn et al. (2010) 0.0036
Step-feed BNR BNR Ahn et al. (2010) 0.011
MLE BNR Ahn et al. (2010) 0.0007
MLE BNR Ahn et al. (2010) 0.0006
OD BNR Ahn et al. (2010) 0.0003
Step-feed BNR BNR Ahn et al. (2010) 0.015
Step feed, plug flow BNR Ni et al. (2015); Pan et al. (2016) 0.019
SBR BNR Bao et al. (2016) 0.029
SBR BNR Rodriguez-Caballero et al. (2015) 0.038
Plug flow Non-BNR Ahn et al. (2010) 0.004
Plug flow Non-BNR Ahn et al. (2010) 0.0062
Step-feed non-BNR Non-BNR Ahn et al. (2010) 0.0018
Plug flow Non-BNR Masuda et al. (2015) 0.023
AO Non-BNR Bao et al. (2016) 0.013
IA Non-BNR de Mello et al. (2013) 0.0016 1 AO; Anaerobic-oxic activated sludge process, A2O; Anaerobic-anoxic-oxic activated sludge process, SBR; Sequencing batch reactor, OD; Oxidation ditch, IA; Intermittent aeration process, EA; Extended aeration process, CAS; Conventional activated sludge process, MLE; Modified Ludzack-Ettinger.
Chapter 6: Wastewater Treatment and Discharge
2019 Refinement to the 2006 IPCC Guidelines for National Greenhouse Gas Inventories 6.63
Annex 6A.6 Estimation of default emission factors for N2O in effluent Table 6.11 in the 2006 IPCC Guidelines was based on expert judgment. For the refinement of these guidelines, literature was reviewed for reported yields of N2O from environments with known oxygen saturation conditions. A total of 62 data points for well-oxygenated environments and 59 for low-oxygen environments were obtained from the following literature: Kaplan et al. (1978); McElroy et al. (1978); Goreau et al. (1980); McCarthy et al. (1984); Seitzinger et al. (1984); Kaplan and Wofsy (1985); Seitzinger (1988); Yoshida (1988); Mantoura et al. (1993); Kester et al. (1997); Seitzinger and Kroeze (1998); Punshon and Moore (2004); Frame and Casciotti (2010); Beaulieu et al. (2011); Yan et al. (2012); Zhu et al. (2013); Ji et al. (2015); Wang et al. (2015); He et al. (2017).
These data suggested a mean yield of 0.019 kg N2O-N/kg-N for low oxygen environments (for use in Tier 3 methodologies, if needed) and 0.005 kg N2O-N/kg-N for well-oxygenated environments (default Tier 1 factor). Calculation of a simple standard deviation is inappropriate for this data, since it is a proportion. Therefore, confidence intervals for these averages were calculated using the adjusted Wald method for small proportions (Bonett & Price 2012). The resulting 95percent (two tailed) limits are 0.0041–0.0912 and 0.0–0.0753 respectively.

Volume 5: Waste
6.64 2019 Refinement to the 2006 IPCC Guidelines for National Greenhouse Gas Inventories
Annex 6A.7 List of countries by region included in Table 6.10a Table 6.10a in Section 6.3.1.3 presents default factors for protein consumed as a fraction of protein supplied, fraction of food not consumed and disposed in sewer, and a fraction to represent additional nitrogen introduced to the sewer from household chemicals. The information is provided be geographic region. The list of countries by region can be found in Table 6A.6.
TABLE 6A.6 (NEW) LIST OF COUNTRIES BY REGION INCLUDED IN TABLE 6.10A
Region Country
Europe
Albania, Armenia, Austria, Azerbaijan, Belarus, Belgium, Bosnia and Herzegovina, Bulgaria, Croatia, Cyprus, Czech Republic, Denmark, Estonia, Finland, France, Georgia, Germany, Greece, Hungary, Iceland, Ireland, Italy, Latvia, Lithuania, Luxemburg, Macedonia, Moldova, Montenegro, Netherlands, Norway, Poland, Portugal, Romania, Russian Federation, Serbia, Slovakia, Slovenia, Spain, Sweden, Switzerland, Ukraine, United Kingdom
North America and Oceania Australia, Canada, New Zealand, United States of America
Industrialized Asia Japan, China, South Korea
Sub-Saharan Africa
Angola, Benin, Botswana, Burkina Faso, Burundi, Cameroon, Central African Rep., Chad, Congo-Brazzaville, Congo-Kinshasa, Cote d’Ivoire, Equatorial Guinea, Eritrea, Ethiopia, Gabon, Gambia, Ghana, Guinea, Guinea-Bissau, Kenya, Lesotho, Liberia, Malawi, Mali, Mauritania, Mozambique, Namibia, Niger, Nigeria, Rwanda, Senegal, Sierra Leone, Somalia, South Africa, Sudan, Swaziland, Tanzania, Togo, Uganda, Zambia, Zimbabwe
North Africa, West and Central Asia
Algeria, Egypt, Iraq, Israel, Jordan, Kazakhstan, Kuwait, Kyrgyzstan, Lebanon, Libya, Mongolia, Morocco, Oman, Saudi Arabia, Syria, Tajikistan, Tunisia, Turkey, Turkmenistan, Utd Arab Emirates, Uzbekistan, Yemen
South and Southeast Asia Afghanistan, Bangladesh, Bhutan, Cambodia, India, Indonesia, Iran, Laos, Malaysia, Myanmar, Nepal, Pakistan, Philippines, Sri Lanka, Thailand, Vietnam
Latin America
Argentina, Belize, Bolivia, Brazil, Chile, Colombia, Costa Rica, Cuba, Dominican Rep., Ecuador, El Salvador, Guatemala, Guyana, Haiti, Honduras, Jamaica, Mexico, Nicaragua, Panama, Paraguay, Peru, Suriname, Uruguay, Venezuela

Chapter 6: Wastewater Treatment and Discharge
2019 Refinement to the 2006 IPCC Guidelines for National Greenhouse Gas Inventories 6.65
References References newly cited in the 2019 Refinement
Aboobakar, A., Cartmell, E., Stephenson, T., Jones, M., Vale, P. & Dotro, G. (2013) Nitrous oxide Emissions and Dissolved Oxygen Profiling in a Full-Scale Nitrifying Activated Sludge Treatment Plant. Water Research 47(2): 524-534.
Ahn, J.H., Kim, S., Park, H., Rahm, B., Pagilla, K. & Chandran, K. (2010) N2O Emissions from Activated Sludge Processes, 2008-2009: Results of a National Monitoring Survey in the United States. Environ Sci Technol 44(12): 4505-4511.
Andreoli, A., Bartilucci, N., Forgione, R. & Reynolds, R. (1979) Nitrogen Removal in a Subsurface Disposal System. Journal (Water Pollution Control Federation) 51(4): 841-854.
Bao, Z., Sun, S. & Sun, D. (2016) Assessment of Greenhouse Gas Emission from A/O and SBR Wastewater Treatment Plants in Beijing, China. International Biodeterioration & Biodegradation 108: 108-114.
Barros, N., Cole, J.J., Tranvik, L.J., Prairie, Y.T., Bastviken, D., Huszar, V.L.M., del Giorgio, P. & Roland, F. (2011) Carbon emission from hydroelectric reservoirs linked to reservoir age and latitude. Nature Geoscience 4: 593.
Bastviken, D., Tranvik, L.J., Downing, J.A., Crill, P.M. & Enrich-Prast, A. (2011) Freshwater Methane Emissions Offset the Continental Carbon Sink. Science 331(6013): 50.
Beaulieu, J.J., Tank, J.L., Hamilton, S.K., Wollheim, W.M., Hall, R.O., Mulholland, P.J., Peterson, B.J., Ashkenas, L.R., Cooper, L.W., Dahm, C.N., Dodds, W.K., Grimm, N.B., Johnson, S.L., McDowell, W.H., Poole, G.C., Valett, H.M., Arango, C.P., Bernot, M.J., Burgin, A.J., Crenshaw, C.L., Helton, A.M., Johnson, L.T., O'Brien, J.M., Potter, J.D., Sheibley, R.W., Sobota, D.J. & Thomas, S.M. (2011) Nitrous oxide emission from denitrification in stream and river networks. Proc. Natl. Acad. Sci. USA 108(1): 214-219.
Bellucci, F., Kozak, J.A., Heraty, L., Carbone, J., Sturchio, N.C., Connor, C., Kollias, L. & Lanyon, R. (2010) Greenhouse Gas Emissions from Three Chicago Wastewater Treatment Plants. In: Proceedings of the Water Environment Federation, WEFTEC 2010, pp. 4179-4199. Proceedings of the Water Environment Federation, WEFTEC 2010.
Bonett, D.G. & Price, R.M. (2012) Adjusted Wald Confidence Interval for a Difference of Binomial Proportions Based on Paired Data. Journal of Educational and Behavioral Statistics 37(4): 479-488.
Burns, N., McIntosh, J. & Scholes, P. (2009) Strategies for Managing the lakes of the Rotorua District, New Zealand. Lake and Reservoir Management 25(3): 284-296.
Castro-Morales, K., Macías-Zamora, J.V., Canino-Herrera, S.R. & Burke, R.A. (2014) Dissolved Methane Concentration and Flux in the Coastal Zone of the Southern California Bight-Mexican Sector: Possible Influence of Wastewater. Estuarine, Coastal and Shelf Science 144: 65-74.
Conrad, R. & Seiler, W. (1988) Methane and hydrogen in seawater (Atlantic Ocean). Deep Sea Research Part A. Oceanographic Research Papers 35(12): 1903-1917.
Czepiel, P.M., Crill, P.M. & Harriss, R.C. (1993) Methane emissions from municipal wastewater treatment processes. Environmental Science & Technology 27(12): 2472-2477.
Daelman, M.R., van Voorthuizen, E.M., van Dongen, U.G., Volcke, E.I. & van Loosdrecht, M.C. (2012) Methane Emission During Municipal Wastewater Treatment. Water Research 46(11): 3657-3670.
Daelman, M.R., van Voorthuizen, E.M., van Dongen, U.G., Volcke, E.I. & van Loosdrecht, M.C. (2015) Seasonal and Diurnal Variability of N2O Emissions from a Full-Scale Municipal Wastewater Treatment Plant. Sci Total Environ 536: 1-11.
Daelman, M.R.J., Voorthuizen, E.M.v., Dongen, L.G.J.M.v., Volcke, E.I.P. & Loosdrecht, M.C.M.v. (2013) Methane and Nitrous Oxide Emissions from Municipal Wastewater Treatment – Results from a Long-Term Study. Water Science and Technology 67(10): 2350-2355.
Volume 5: Waste
6.66 2019 Refinement to the 2006 IPCC Guidelines for National Greenhouse Gas Inventories
Davies, P.S. (2005) The Biological Basis of Wastewater Treatment. In: Strathkelvin Instruments Ltd, Glasgow UK. Available at <http://www.s-can.nl/media/1000154/thebiologicalbasisofwastewatertreatment.pdf>.
de Mello, W.Z., Ribeiro, R.P., Brotto, A.C., Kligerman, D.C., Piccoli, A.d.S. & Oliveira, J.L.M. (2013) Nitrous oxide emissions from an intermittent aeration activated sludge system of an urban wastewater treatment plant. Química Nova 36: 16-20.
Deemer, B.R., Harrison, J.A., Li, S.Y., Beaulieu, J.J., Delsontro, T., Barros, N., Bezerra-Neto, J.F., Powers, S.M., dos Santos, M.A. & Vonk, J.A. (2016) Greenhouse Gas Emissions from Reservoir Water Surfaces: A New Global Synthesis. Bioscience 66(11): 949-964.
Delre, A., Mønster, J. & Scheutz, C. (2017) Greenhouse gas emission quantification from wastewater treatment plants, using a tracer gas dispersion method. Science of The Total Environment 605-606: 258-268.
Diaz, R., Selman, M. & Chique, C. (2011) Global Eutrophic and Hypoxic Coastal Systems. World Resources Institute. Eutrophication and Hypoxia: Nutrient Pollution in Coastal Waters. In: World Resources Institute, <https://www.wri.org/resources/data-sets/eutrophication-hypoxia-map-data-set>.
Diaz-Valbuena, L.R., Leverenz, H.L., Cappa, C.D., Tchobanoglous, G., Horwath, W.R. & Darby, J.L. (2011) Methane, Carbondioxide, and Nitrous Oxide Emissions from Septic Tank Systems. Environ Sci Technol 45(7): 2741-2747.
Dodds, W.K., Jones, J.R. & Welch, E.B. (1998) Suggested classification of stream trophic state: distributions of temperate stream types by chlorophyll, total nitrogen, and phosphorus. Water Research 32(5): 1455-1462.
Doorn, M.R.J., Strait, R.P., Barnard, W. & Eklund, B. (1997) Estimate of Global Greenhouse Gas Emissions from Industrial and Domestic Wastewater Treatment. In: U.S. EPA Office of Research and Development, Air Pollution Prevention and Control Division, Research Triangle Park, NC. EPA-600/R-97-091, September 1997.
Doorn, M.R.J., Towprayoon, S., Vieira, S.M.M., Irving, W., Palmer, C., Pipatti, R. & Wang, C. (2006) Chapter 6: Wastewater Treatment and Discharge. In: 2006 IPCC Guidelines for National Greenhouse Gas Inventories: Volume 5 - Waste, eds. H. S. Eggleston, L. Buendia, K. Miwa, T. Ngara & K. Tanabe, The National Greenhouse Gas Inventories Programme, The Intergovernmental Panel on Climate Change, Hayama, Kanagawa, Japan.
Ekama, G.A. & Wentzel, M.C. (2008) Organic Matter Removal. In: Biological Wastewater Treatment: Principles, Modelling and Design. Henze, M., van Loosdrecht, M.C.M., Ekama, G.A. and Brdjanovic, D. (Eds), pp. 53-86,. IWA Publishing.
EMEP/EAA. (2016) 2016 EMEP/EEA air pollutant emission inventory guidebook: 5.D Wastewater handling. In: European Environment Agency, Publications Office of the European Union, Luxembourg. Available at <https://www.eea.europa.eu/publications/emep-eea-guidebook-2016/part-b-sectoral-guidance-chapters/5-waste/5-d-wastewater-handling-2016/view>.
EPA. (2008) Examining the Use of Food Waste Disposers. In: Environmental Protection Agency (EPA), Ireland.
FAO. (2011) Global food losses and food waste – Extent, causes and prevention. In: Food and Agriculture Organization of the United Nations, Rome.
Foladori, P., Andreottola, G. & Ziglio, G. (2010) Sludge composition and production in full-plants. In: Sludge Reduction Technologies in Wastewater Treatment Plants, pp. 6-19. IWA Publishing, London, UK.
Foley, J., de Haas, D., Yuan, Z. & Lant, P. (2010) Nitrous Oxide Generation in Full-Scale Biological Nutrient Removal Wastewater Treatment Plants. Water Research 44(3): 831-844.
Foley, J., Yuan, Z., Keller, J., Senante, E., Chandran, K., Willis, J., Shah, A., Loosdrecht, M.v. & Voorthuizen, E.v., eds. (2015) N2O and CH4 Emission from Wastewater Collection and Treatment Systems: State of the Science Report and Technical Report. GWRC Report Series. IWA Publishing, London, UK.

Chapter 6: Wastewater Treatment and Discharge
2019 Refinement to the 2006 IPCC Guidelines for National Greenhouse Gas Inventories 6.67
Frame, C.H. & Casciotti, K.L. (2010) Biogeochemical Controls and Isotopic Signatures of Nitrous Oxide Production by a Marine Ammonia-Oxidizing Bacterium. Biogeosciences 7(9): 2695-2709.
Goreau, T.J., Kaplan, W.A., Wofsy, S.C., McElroy, M.B., Valois, F.W. & Watson, S.W. (1980) Production of NO2
– and N2O by nitrifying bacteria at reduced concentrations of oxygen. Applied and Environmental Microbiology 40(3): 526-532.
Graham, J.P. & Polizzotto, M.L. (2013) Pit Latrines and their Impacts on Groundwater Quality: A Systematic Review. Environ Health Perspect 121(5): 521-530.
Griffith, D.R., Barnes, R.T. & Raymond, P.A. (2009) Inputs of Fossil Carbon from Wastewater Treatment Plants to U.S. Rivers and Oceans. Environmental Science & Technology 43(15): 5647-5651.
Grunwald, M., Dellwig, O., Beck, M., Dippner, J.W., Freund, J.A., Kohlmeier, C., Schnetger, B. & Brumsack, H.J. (2009) Methane in the Southern North Sea: Sources, Spatial Distribution and Budgets. Estuarine Coastal and Shelf Science 81(4): 445-456.
Guisasola, A., de Haas, D., Keller, J. & Yuan, Z. (2008) Methane formation in sewer systems. Water Research 42(6–7): 1421-1430.
Hammer, M.J. & Hammer Jr., M.J. (2012) Water and wastewater technology Pearson Prentice Hall, Upper Saddle River, N.J.
He, Y., Wang, X., Chen, H., Yuan, X., Wu, N., Zhang, Y., Yue, J., Zhang, Q., Diao, Y. & Zhou, L. (2017) Effect of Watershed Urbanization on N2O Emissions from the Chongqing Metropolitan River Network, China. Atmospheric Environment 171: 70-81.
Henze, M., Loosdrecht, M.C.M.v., Ekama, G.A. & Brdjanovic, D. (2008) Biological Wastewater Treatment: Principles Modelling and Design. London, UK: IWA Publishing.
IPCC. (2014) 2013 Supplement to the 2006 IPCC Guidelines for National Greenhouse Gas Inventories: Wetlands. In: eds. T. Hiraishi, T. Krug, K. Tanabe, N. Srivastava, B. Jamsranjav, M. Fukuda & T. Troxler, p. 354. The Intergovernmental Panel on Climate Change (IPCC), Switzerland.
Ji, Q., Babbin, A.R., Jayakumar, A., Oleynik, S. & Ward, B.B. (2015) Nitrous Oxide Production by Nitrification and Denitrification in the Eastern Tropical South Pacific Oxygen Minimum Zone. Geophysical Research Letters 42(24): 10,755-710,764.
Jugold, A., Althoff, F., Hurkuck, M., Greule, M., Lenhart, K., Lelieveld, J. & Keppler, F. (2012) Non-microbial methane formation in oxic soils. Biogeosciences 9(12): 5291-5301.
Kaplan, W.A., Elkins, J.W., Kolb, C.E., McElroy, M.B., Wofsy, S.C. & Durán, A.P. (1978) Nitrous oxide in fresh water systems: An estimate for the yield of atmospheric N2O associated with disposal of human waste. Pure and Applied Geophysics 116(2): 423-438.
Kaplan, W.A. & Wofsy, S.C. (1985) The Biogeochemistry of Nitrous Oxide: a Review. Advances in Aquatic Microbiology 3: 181-202.
Kester, R.A., de Boer, W. & Laanbroek, H.J. (1997) Production of NO and N2O by pure cultures of nitrifying and denitrifying bacteria during changes in aeration. Applied and Environmental Microbiology 63(10): 3872–3877.
Kimochi, Y., Inamori, Y., Mizuochi, M., Xu, K.-Q. & Matsumura, M. (1998) Nitrogen Removal and N2O Emission in a Full-Scale Domestic Wastewater Treatment Plant with Intermittent Aeration. Journal of Fermentation and Bioengineering 86(2): 202-206.
Kozak, J.A., O’Connor, C., Granato, T., Kollias, L., Belluci, F. & Sturchio, N. (2009) Methane and Nitrous Oxide Emissions from Wastewater Treatment Plant Processes. In: Proceedings of the Water Environment Federation, WEFTEC 2009, pp. 5347-5361.

Volume 5: Waste
6.68 2019 Refinement to the 2006 IPCC Guidelines for National Greenhouse Gas Inventories
Kristensen, P., Fribourg-Blanc & Nixon, S. (2004) Outlooks on Nutrient Discharges in Europe from Urban Waste Water Treatment Plants (final draft). In: European Environment Agency. EEA European Topic Centre on Water, Copenhagen, 33 p.
Kyung, D., Kim, M., Chang, J. & Lee, W. (2015) Estimation of Greenhouse Gas Emissions from a Hybrid Wastewater Treatment Plant. Journal of Cleaner Production 95: 117-123.
Lauerwald, R., Laruelle, G.G., Hartmann, J., Ciais, P. & Regnier, P.A.G. (2015) Spatial patterns in CO2 evasion from the global river network. Global Biogeochemical Cycles 29(5): 534-554.
Law, Y., Jacobsen, G.E., Smith, A.M., Yuan, Z. & Lant, P. (2013) Fossil organic carbon in wastewater and its fate in treatment plants. Water Research 47(14): 5270-5281.
Leverenz, H.L., Tchobanoglous., G. & Darby, J.L. (2010) Evaluation of Greenhouse Gas Emissions from Septic Systems, Water Environment Research Foundation Final Report. . In: Co-published by IWA Publishing, London, UK.
Li, E., Chao, P. & Chow, B. (2016) British Petroleum/Shanghai SECCO Acrylonitrile Plant Wastewater Reuse Project. Proceedings of the Water Environment Federation 2016(7): 3119-3128.
Li, S. & Zhang, Q. (2014) Carbon emission from global hydroelectric reservoirs revisited. Environmental Science and Pollution Research 21(23): 13636-13641.
Mantoura, R.F.C., Law, C.S., Owens, N.J.P., Peter, Burkill, H., Woodward, E.M.S., Howland, R.J.M. & Llewellyn, C.A. (1993) Nitrogen Biogeochemical Cycling in the Northwestern Indian Ocean. Deep-Sea Research II 40: 651-671.
Masuda, S., Sano, I., Hojo, T., Li, Y.Y. & Nishimura, O. (2018) The Comparison of Greenhouse Gas Emissions in Sewage Treatment Plants with Different Treatment Processes. Chemosphere 193: 581-590.
Masuda, S., Suzuki, S., Sano, I., Li, Y.Y. & Nishimura, O. (2015) The Seasonal Variation of Emission of Greenhouse Gases from a Full-Scale Sewage Treatment Plant. Chemosphere 140: 167-173.
Mateo-Sagasta, J. & Burke, J. (2010) Agriculture and Water Quality Interactions: A Global Review. In: SOLAW Background Thematic Report - TR08. Food and Agriculture Organisation of the United Nations. Available at <http://www.fao.org/3/a-bl092e.pdf>.
McCarthy, J.J., Kaplan, W. & Nevins, J.L. (1984) Chesapeake Bay Nutrient and Plankton Dynamics. 2. Sources and Sinks of Nitrite. Limnology and Oceanography 29: 84-98.
McElroy, M.B., Elkins, J.W., Wofsy, S.C., Kolb, C.E., Dura’n, A.P. & Kaplan, W.A. (1978) Production and Release of N2O from the Potomac Estuary. Limnology and Oceanography 23(6): 1168-1182.
Naqvi, S.W.A., Bange, H.W., Farias, L., Monteiro, P.M.S., Scranton, M.I. & Zhang, J. (2010) Marine hypoxia/anoxia as a source of CH4 and N2O. Biogeosciences 7(7): 2159-2190.
Nara, F.W., Imai, A., Matsushige, K., Komatsu, K., Kawasaki, N. & Shibata, Y. (2010) Radiocarbon measurements of dissolved organic carbon in sewage-treatment-plant effluent and domestic sewage. Nuclear Instruments and Methods in Physics Research Section B: Beam Interactions with Materials and Atoms 268(7): 1142-1145.
Ni, B.J., Pan, Y., van den Akker, B., Ye, L. & Yuan, Z. (2015) Full-Scale Modeling Explaining Large Spatial Variations of Nitrous Oxide Fluxes in a Step-Feed Plug-Flow Wastewater Treatment Reactor. Environ Sci Technol 49(15): 9176-9184.
Oudot, C., Jean-Baptiste, P., Fourré, E., Mormiche, C., Guevel, M., Ternon, J.-F.-c. & Corre, P.L. (2002) Transatlantic Equatorial Distribution of Nitrous Oxide and Methane. Deep-Sea Research Part I: Oceanographic Research Papers 49(7): 1175-1193.
Chapter 6: Wastewater Treatment and Discharge
2019 Refinement to the 2006 IPCC Guidelines for National Greenhouse Gas Inventories 6.69
Pan, Y., van den Akker, B., Ye, L., Ni, B.J., Watts, S., Reid, K. & Yuan, Z. (2016) Unravelling the Spatial Variation of Nitrous Oxide Emissions from a Step-Feed Plug-Flow Full Scale Wastewater Treatment Plant. Scientific Report 6: 20792.
Patra, P.K., Lal, S., Venkataramani, S., Gauns, M. & Sarma, V.V.S.S. (1998) Seasonal Variability in Distribution and Fluxes of Methane in the Arabian Sea. Journal of Geophysical Research-Oceans 103(C1): 1167-1176.
Pescod, M.B. (1992) Wastewater treatment and use in agriculture - FAO irrigation and drainage paper 47. Rome, Italy: Food and Agriculture Organization of the United Nations, Viale delle Terme di Caracalla.
Punshon, S. & Moore, R.M. (2004) Nitrous oxide production and consumption in a eutrophic coastal embayment. Marine Chemistry 91(1-4): 37-51.
Rabalais, N.N., Díaz, R.J., Levin, L.A., Turner, R.E., Gilbert, D. & Zhang, J. (2010) Dynamics and distribution of natural and human-caused hypoxia. Biogeosciences 7(2): 585-619.
Raymond, P.A. & Bauer, J.E. (2001) Use of 14C and 13C Natural Abundances for Evaluating Riverine, Estuarine, and Coastal DOC and POC Sources and Cycling: A Review and Synthesis. Organic Geochemistry 32: 469-485.
Raymond, P.A., Hartmann, J., Lauerwald, R., Sobek, S., McDonald, C., Hoover, M., Butman, D., Striegl, R., Mayorga, E., Humborg, C., Kortelainen, P., Dürr, H., Meybeck, M., Ciais, P. & Guth, P. (2013) Global carbon dioxide emissions from inland waters. Nature 503: 355.
Rodriguez-Caballero, A., Aymerich, I., Marques, R., Poch, M. & Pijuan, M. (2015) Minimizing N2O Emissions and Carbon Footprint on a Full-Scale Activated Sludge Sequencing Batch Reactor. Water Res 71: 1-10.
Rodriguez-Caballero, A., Aymerich, I., Poch, M. & Pijuan, M. (2014) Evaluation of process conditions triggering emissions of green-house gases from a biological wastewater treatment system. Sci Total Environ 493: 384-391.
Schaider, L.A., Rodgers, K.M. & Rudel, R.A. (2017) Review of Organic Wastewater Compound Concentrations and Removal in Onsite Wastewater Treatment Systems. Environ Sci Technol 51(13): 7304-7317.
Schneider, A.G., Townsend-Small, A. & Rosso, D. (2015) Impact of direct greenhouse gas emissions on the carbon footprint of water reclamation processes employing nitrification–denitrification. Science of the Total Environment 505: 1166-1173.
Seitzinger, S.P. (1988) Denitrification in Freshwater and Coastal Marine Ecosystems: Ecological and Geochemical Significance. Limnol. Oceanogr. 33(4, part 2): 702-724.
Seitzinger, S.P. & Kroeze, C. (1998) Global Distribution of Nitrous Oxide Production and N Inputs in Freshwater and Coastal Marine Ecosystems. Global Biochemical Cycles 12(1): 911-917.
Seitzinger, S.P., Nixon, S.W. & Pilson, M.E.Q. (1984) Denitrification and Nitrous Oxide Production in a Coastal Marine Ecosystem. Limnology and Oceanography 29(l): 73-83
Serón, N., Puig, S., Meijer, S.C.F., Balaguer, M.D. & Colprim, J. (2011) Sludge production based on organic matter and nitrogen removal performances. Water Practice and Technology 6(2): wpt2011029.
Short, M.D., Daikeler, A., Peters, G.M., Mann, K., Ashbolt, N.J., Stuetz, R.M. & Peirson, W.L. (2014) Municipal Gravity Sewers: an Unrecognised Source of Nitrous Oxide. Sci Total Environ 468-469: 211-218.
Short, M.D., Daikeler, A., Wallis, K., Peirson, W.L. & Peters, G.M. (2017) Dissolved Methane in the Influent of Three Australian Wastewater Treatment Plants Fed by Gravity Sewers. Sci Total Environ 599-600: 85-93.
Simate, G.S., Cluett, J., Iyuke, S.E., Musapatika, E.T., Ndlovu, S., Walubita, L.F. & Alvarez, A.E. (2011) The treatment of brewery wastewater for reuse: State of the art. Desalination 273(2): 235-247.
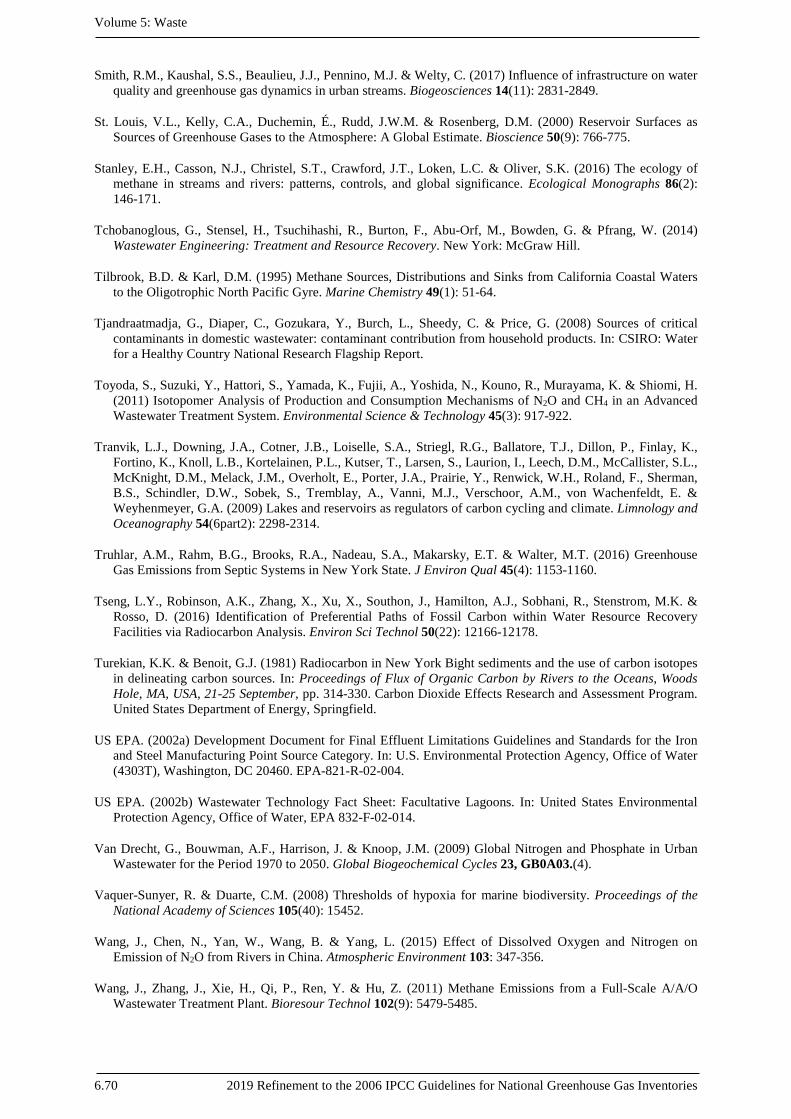
Volume 5: Waste
6.70 2019 Refinement to the 2006 IPCC Guidelines for National Greenhouse Gas Inventories
Smith, R.M., Kaushal, S.S., Beaulieu, J.J., Pennino, M.J. & Welty, C. (2017) Influence of infrastructure on water quality and greenhouse gas dynamics in urban streams. Biogeosciences 14(11): 2831-2849.
St. Louis, V.L., Kelly, C.A., Duchemin, É., Rudd, J.W.M. & Rosenberg, D.M. (2000) Reservoir Surfaces as Sources of Greenhouse Gases to the Atmosphere: A Global Estimate. Bioscience 50(9): 766-775.
Stanley, E.H., Casson, N.J., Christel, S.T., Crawford, J.T., Loken, L.C. & Oliver, S.K. (2016) The ecology of methane in streams and rivers: patterns, controls, and global significance. Ecological Monographs 86(2): 146-171.
Tchobanoglous, G., Stensel, H., Tsuchihashi, R., Burton, F., Abu-Orf, M., Bowden, G. & Pfrang, W. (2014) Wastewater Engineering: Treatment and Resource Recovery. New York: McGraw Hill.
Tilbrook, B.D. & Karl, D.M. (1995) Methane Sources, Distributions and Sinks from California Coastal Waters to the Oligotrophic North Pacific Gyre. Marine Chemistry 49(1): 51-64.
Tjandraatmadja, G., Diaper, C., Gozukara, Y., Burch, L., Sheedy, C. & Price, G. (2008) Sources of critical contaminants in domestic wastewater: contaminant contribution from household products. In: CSIRO: Water for a Healthy Country National Research Flagship Report.
Toyoda, S., Suzuki, Y., Hattori, S., Yamada, K., Fujii, A., Yoshida, N., Kouno, R., Murayama, K. & Shiomi, H. (2011) Isotopomer Analysis of Production and Consumption Mechanisms of N2O and CH4 in an Advanced Wastewater Treatment System. Environmental Science & Technology 45(3): 917-922.
Tranvik, L.J., Downing, J.A., Cotner, J.B., Loiselle, S.A., Striegl, R.G., Ballatore, T.J., Dillon, P., Finlay, K., Fortino, K., Knoll, L.B., Kortelainen, P.L., Kutser, T., Larsen, S., Laurion, I., Leech, D.M., McCallister, S.L., McKnight, D.M., Melack, J.M., Overholt, E., Porter, J.A., Prairie, Y., Renwick, W.H., Roland, F., Sherman, B.S., Schindler, D.W., Sobek, S., Tremblay, A., Vanni, M.J., Verschoor, A.M., von Wachenfeldt, E. & Weyhenmeyer, G.A. (2009) Lakes and reservoirs as regulators of carbon cycling and climate. Limnology and Oceanography 54(6part2): 2298-2314.
Truhlar, A.M., Rahm, B.G., Brooks, R.A., Nadeau, S.A., Makarsky, E.T. & Walter, M.T. (2016) Greenhouse Gas Emissions from Septic Systems in New York State. J Environ Qual 45(4): 1153-1160.
Tseng, L.Y., Robinson, A.K., Zhang, X., Xu, X., Southon, J., Hamilton, A.J., Sobhani, R., Stenstrom, M.K. & Rosso, D. (2016) Identification of Preferential Paths of Fossil Carbon within Water Resource Recovery Facilities via Radiocarbon Analysis. Environ Sci Technol 50(22): 12166-12178.
Turekian, K.K. & Benoit, G.J. (1981) Radiocarbon in New York Bight sediments and the use of carbon isotopes in delineating carbon sources. In: Proceedings of Flux of Organic Carbon by Rivers to the Oceans, Woods Hole, MA, USA, 21-25 September, pp. 314-330. Carbon Dioxide Effects Research and Assessment Program. United States Department of Energy, Springfield.
US EPA. (2002a) Development Document for Final Effluent Limitations Guidelines and Standards for the Iron and Steel Manufacturing Point Source Category. In: U.S. Environmental Protection Agency, Office of Water (4303T), Washington, DC 20460. EPA-821-R-02-004.
US EPA. (2002b) Wastewater Technology Fact Sheet: Facultative Lagoons. In: United States Environmental Protection Agency, Office of Water, EPA 832-F-02-014.
Van Drecht, G., Bouwman, A.F., Harrison, J. & Knoop, J.M. (2009) Global Nitrogen and Phosphate in Urban Wastewater for the Period 1970 to 2050. Global Biogeochemical Cycles 23, GB0A03.(4).
Vaquer-Sunyer, R. & Duarte, C.M. (2008) Thresholds of hypoxia for marine biodiversity. Proceedings of the National Academy of Sciences 105(40): 15452.
Wang, J., Chen, N., Yan, W., Wang, B. & Yang, L. (2015) Effect of Dissolved Oxygen and Nitrogen on Emission of N2O from Rivers in China. Atmospheric Environment 103: 347-356.
Wang, J., Zhang, J., Xie, H., Qi, P., Ren, Y. & Hu, Z. (2011) Methane Emissions from a Full-Scale A/A/O Wastewater Treatment Plant. Bioresour Technol 102(9): 5479-5485.
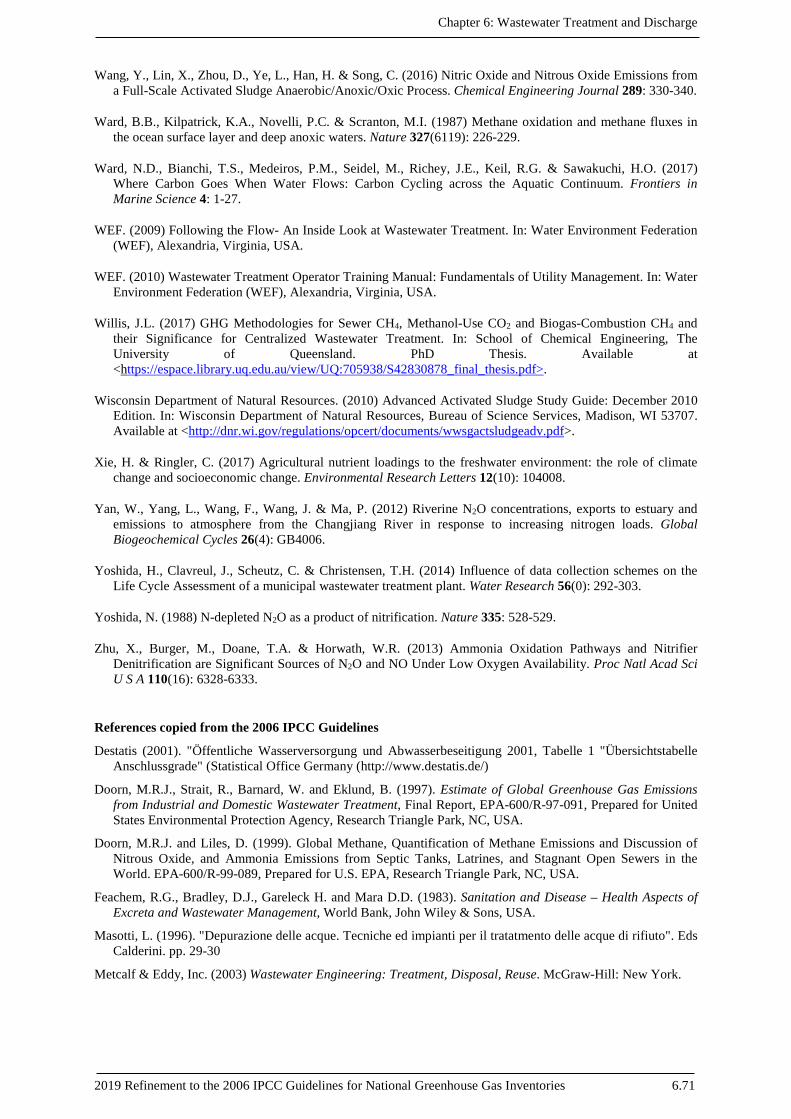
Chapter 6: Wastewater Treatment and Discharge
2019 Refinement to the 2006 IPCC Guidelines for National Greenhouse Gas Inventories 6.71
Wang, Y., Lin, X., Zhou, D., Ye, L., Han, H. & Song, C. (2016) Nitric Oxide and Nitrous Oxide Emissions from a Full-Scale Activated Sludge Anaerobic/Anoxic/Oxic Process. Chemical Engineering Journal 289: 330-340.
Ward, B.B., Kilpatrick, K.A., Novelli, P.C. & Scranton, M.I. (1987) Methane oxidation and methane fluxes in the ocean surface layer and deep anoxic waters. Nature 327(6119): 226-229.
Ward, N.D., Bianchi, T.S., Medeiros, P.M., Seidel, M., Richey, J.E., Keil, R.G. & Sawakuchi, H.O. (2017) Where Carbon Goes When Water Flows: Carbon Cycling across the Aquatic Continuum. Frontiers in Marine Science 4: 1-27.
WEF. (2009) Following the Flow- An Inside Look at Wastewater Treatment. In: Water Environment Federation (WEF), Alexandria, Virginia, USA.
WEF. (2010) Wastewater Treatment Operator Training Manual: Fundamentals of Utility Management. In: Water Environment Federation (WEF), Alexandria, Virginia, USA.
Willis, J.L. (2017) GHG Methodologies for Sewer CH4, Methanol-Use CO2 and Biogas-Combustion CH4 and their Significance for Centralized Wastewater Treatment. In: School of Chemical Engineering, The University of Queensland. PhD Thesis. Available at <https://espace.library.uq.edu.au/view/UQ:705938/S42830878_final_thesis.pdf>.
Wisconsin Department of Natural Resources. (2010) Advanced Activated Sludge Study Guide: December 2010 Edition. In: Wisconsin Department of Natural Resources, Bureau of Science Services, Madison, WI 53707. Available at <http://dnr.wi.gov/regulations/opcert/documents/wwsgactsludgeadv.pdf>.
Xie, H. & Ringler, C. (2017) Agricultural nutrient loadings to the freshwater environment: the role of climate change and socioeconomic change. Environmental Research Letters 12(10): 104008.
Yan, W., Yang, L., Wang, F., Wang, J. & Ma, P. (2012) Riverine N2O concentrations, exports to estuary and emissions to atmosphere from the Changjiang River in response to increasing nitrogen loads. Global Biogeochemical Cycles 26(4): GB4006.
Yoshida, H., Clavreul, J., Scheutz, C. & Christensen, T.H. (2014) Influence of data collection schemes on the Life Cycle Assessment of a municipal wastewater treatment plant. Water Research 56(0): 292-303.
Yoshida, N. (1988) N-depleted N2O as a product of nitrification. Nature 335: 528-529.
Zhu, X., Burger, M., Doane, T.A. & Horwath, W.R. (2013) Ammonia Oxidation Pathways and Nitrifier Denitrification are Significant Sources of N2O and NO Under Low Oxygen Availability. Proc Natl Acad Sci U S A 110(16): 6328-6333.
References copied from the 2006 IPCC Guidelines
Destatis (2001). "Öffentliche Wasserversorgung und Abwasserbeseitigung 2001, Tabelle 1 "Übersichtstabelle Anschlussgrade" (Statistical Office Germany (http://www.destatis.de/)
Doorn, M.R.J., Strait, R., Barnard, W. and Eklund, B. (1997). Estimate of Global Greenhouse Gas Emissions from Industrial and Domestic Wastewater Treatment, Final Report, EPA-600/R-97-091, Prepared for United States Environmental Protection Agency, Research Triangle Park, NC, USA.
Doorn, M.R.J. and Liles, D. (1999). Global Methane, Quantification of Methane Emissions and Discussion of Nitrous Oxide, and Ammonia Emissions from Septic Tanks, Latrines, and Stagnant Open Sewers in the World. EPA-600/R-99-089, Prepared for U.S. EPA, Research Triangle Park, NC, USA.
Feachem, R.G., Bradley, D.J., Gareleck H. and Mara D.D. (1983). Sanitation and Disease – Health Aspects of Excreta and Wastewater Management, World Bank, John Wiley & Sons, USA.
Masotti, L. (1996). "Depurazione delle acque. Tecniche ed impianti per il tratatmento delle acque di rifiuto". Eds Calderini. pp. 29-30
Metcalf & Eddy, Inc. (2003) Wastewater Engineering: Treatment, Disposal, Reuse. McGraw-Hill: New York.

Volume 5: Waste
6.72 2019 Refinement to the 2006 IPCC Guidelines for National Greenhouse Gas Inventories
United Nations (2002). World Urbanization Prospects, The 2001 Revision Data Tables and Highlights. Population Division, Department of Economic and Social Affairs, United Nations Secretariat. ESA/P/WP.173. March 2002.