CHAPTER 6 Random VariablesThe Practice of Statistics, 5th Edition Starnes, Tabor, Yates, Moore...
19
The Practice of Statistics, 5th Edition Starnes, Tabor, Yates, Moore Bedford Freeman Worth Publishers CHAPTER 6 Random Variables 6.3 Binomial and Geometric Random Variables
Transcript of CHAPTER 6 Random VariablesThe Practice of Statistics, 5th Edition Starnes, Tabor, Yates, Moore...

The Practice of Statistics, 5th Edition
Starnes, Tabor, Yates, Moore
Bedford Freeman Worth Publishers
CHAPTER 6Random Variables
6.3
Binomial and Geometric Random Variables

Learning Objectives
After this section, you should be able to:
The Practice of Statistics, 5th Edition 2
DETERMINE whether the conditions for using a binomial random
variable are met.
COMPUTE and INTERPRET probabilities involving binomial
distributions.
CALCULATE the mean and standard deviation of a binomial
random variable. INTERPRET these values in context.
FIND probabilities involving geometric random variables.
When appropriate, USE the Normal approximation to the binomial
distribution to CALCULATE probabilities. (*Not required for the AP® Statistics
Exam)
Binomial and Geometric Random Variables

The Practice of Statistics, 5th Edition 3
Binomial Settings
When the same chance process is repeated several times, we are
often interested in whether a particular outcome does or doesn’t
happen on each repetition. Some random variables count the number
of times the outcome of interest occurs in a fixed number of repetitions.
They are called binomial random variables.
A binomial setting arises when we perform several independent trials of
the same chance process and record the number of times that a
particular outcome occurs. The four conditions for a binomial setting are:
• Binary? The possible outcomes of each trial can be classified as
“success” or “failure.”
• Independent? Trials must be independent; that is, knowing the result of
one trial must not tell us anything about the result of any other trial.
• Number? The number of trials n of the chance process must be fixed in
advance.
• Success? There is the same probability p of success on each trial.
B
I
N
S
The Practice of Statistics, 5th Edition 4
Binomial Random Variables
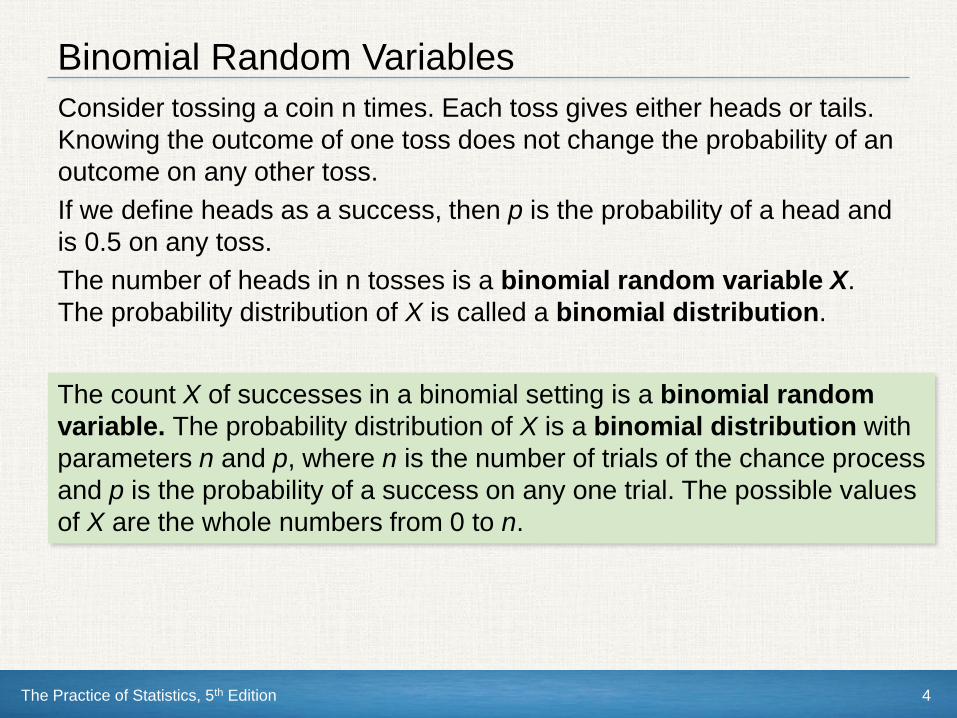
Consider tossing a coin n times. Each toss gives either heads or tails.
Knowing the outcome of one toss does not change the probability of an
outcome on any other toss.
If we define heads as a success, then p is the probability of a head and
is 0.5 on any toss.
The number of heads in n tosses is a binomial random variable X.
The probability distribution of X is called a binomial distribution.
The count X of successes in a binomial setting is a binomial random
variable. The probability distribution of X is a binomial distribution with
parameters n and p, where n is the number of trials of the chance process
and p is the probability of a success on any one trial. The possible values
of X are the whole numbers from 0 to n.

The Practice of Statistics, 5th Edition 5
Binomial Probabilities
In a binomial setting, we can define a random variable (say, X) as the
number of successes in n independent trials. We are interested in
finding the probability distribution of X.
Each child of a particular pair of parents has probability 0.25 of having type O blood.
Genetics says that children receive genes from each of their parents independently. If
these parents have 5 children, the count X of children with type O blood is a binomial
random variable with n = 5 trials and probability p = 0.25 of a success on each trial. In
this setting, a child with type O blood is a “success” (S) and a child with another blood
type is a “failure” (F). What’s P(X = 2)?
P(SSFFF) = (0.25)(0.25)(0.75)(0.75)(0.75) = (0.25)2(0.75)3 = 0.02637
However, there are a number of different arrangements in which 2 out
of the 5 children have type O blood:
SFSFF SFFSF SFFFS FSSFF
FSFSF FSFFS FFSSF FFSFS FFFSS
SSFFF
Verify that in each arrangement, P(X = 2) = (0.25)2(0.75)3 = 0.02637
Therefore, P(X = 2) = 10(0.25)2(0.75)3 = 0.2637
The Practice of Statistics, 5th Edition 6
Binomial Coefficient
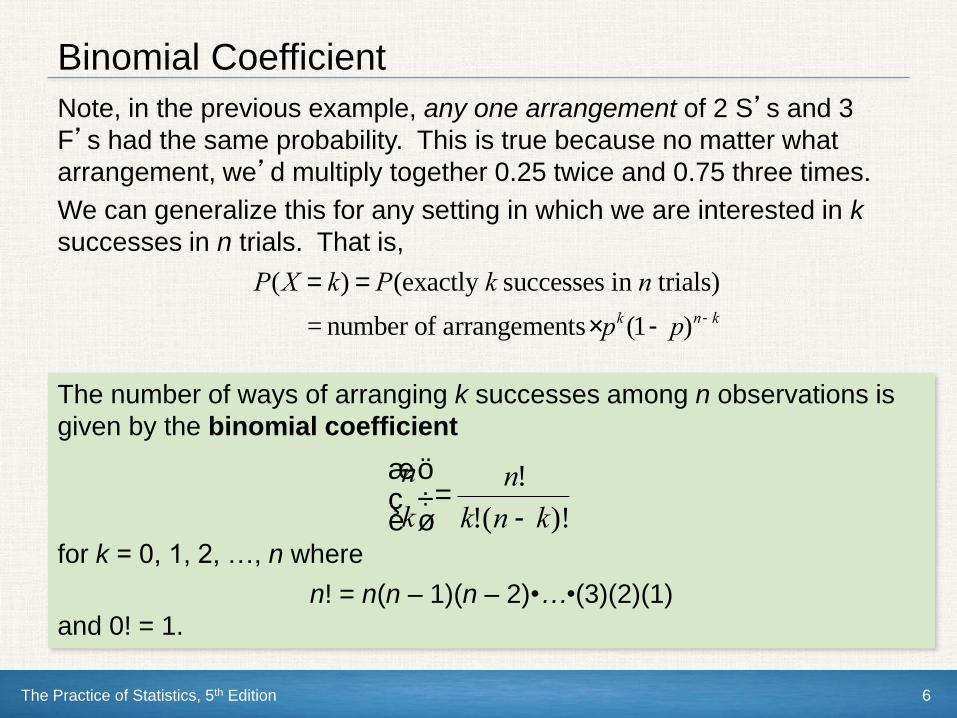
Note, in the previous example, any one arrangement of 2 S’s and 3
F’s had the same probability. This is true because no matter what
arrangement, we’d multiply together 0.25 twice and 0.75 three times.
We can generalize this for any setting in which we are interested in k
successes in n trials. That is,
P(X = k) = P(exactly k successes in n trials)
= number of arrangements × pk(1- p)n-k
The number of ways of arranging k successes among n observations is
given by the binomial coefficient
for k = 0, 1, 2, …, n where
n! = n(n – 1)(n – 2)•…•(3)(2)(1)
and 0! = 1.
n
k
æ
è ç
ö
ø ÷ =
n!
k!(n - k)!

The Practice of Statistics, 5th Edition 7
Binomial Probability Formula
If X has the binomial distribution with n trials and probability p of success
on each trial, the possible values of X are 0, 1, 2, …, n. If k is any one of
these values,
Binomial Probability
The binomial coefficient counts the number of different ways in which k
successes can be arranged among n trials. The binomial probability
P(X = k) is this count multiplied by the probability of any one specific
arrangement of the k successes.
P(X = k) =n
k
æ
è ç
ö
ø ÷ p
k (1- p)n-k
Probability of n-k failures
Number of arrangements of
k successesProbability of k successes

The Practice of Statistics, 5th Edition 8
How to Find Binomial Probabilities
Step 1: State the distribution and the values of interest. Specify a
binomial distribution with the number of trials n, success probability p, and
the values of the variable clearly identified.
Step 2: Perform calculations—show your work!
Do one of the following:
(i) Use the binomial probability formula to find the desired probability; or
(ii) Use binompdf or binomcdf command and label each of the inputs.
Step 3: Answer the question.
How to Find Binomial Probabilities
The Practice of Statistics, 5th Edition 9
Example: How to Find Binomial Probabilities
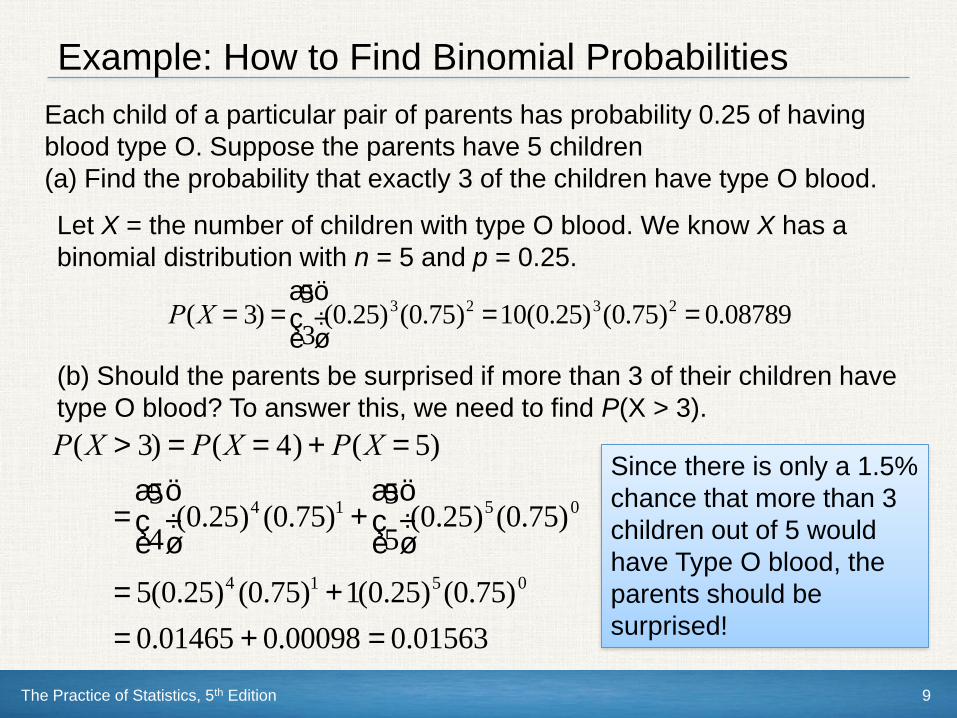
Each child of a particular pair of parents has probability 0.25 of having
blood type O. Suppose the parents have 5 children
(a) Find the probability that exactly 3 of the children have type O blood.
P(X = 3) =5
3
æ
è ç
ö
ø ÷ (0.25)3(0.75)2 =10(0.25)3(0.75)2 = 0.08789
(b) Should the parents be surprised if more than 3 of their children have
type O blood? To answer this, we need to find P(X > 3).
Let X = the number of children with type O blood. We know X has a
binomial distribution with n = 5 and p = 0.25.
P(X > 3) = P(X = 4) + P(X = 5)
=5
4
æ
è ç
ö
ø ÷ (0.25)4 (0.75)1 +
5
5
æ
è ç
ö
ø ÷ (0.25)5(0.75)0
= 5(0.25)4 (0.75)1 +1(0.25)5(0.75)0
= 0.01465 + 0.00098 = 0.01563
Since there is only a 1.5%
chance that more than 3
children out of 5 would
have Type O blood, the
parents should be
surprised!

The Practice of Statistics, 5th Edition 10
Mean and Standard Deviation of a Binomial Distribution
Shape: The probability distribution of X is skewed to
the right. It is more likely to have 0, 1, or 2 children
with type O blood than a larger value.
Center: The median number of children with
type O blood is 1. Based on our formula for the
mean:
mX = xipi = (0)(0.2373) +1(0.39551) + ...+ (5)(0.00098)å=1.25
Spread: The variance of X is
sX
2 = (x i -mX )2 pi = (0 -1.25)2(0.2373) + (1-1.25)2(0.3955)å + ...+
(5 -1.25)2(0.00098) = 0.9375
The standard deviation of X is
sX = 0.9375 = 0.968
xi 0 1 2 3 4 5
pi 0.2373 0.3955 0.2637 0.0879 0.0147 0.00098
We describe the probability distribution of a binomial random variable
just like any other distribution – by looking at the shape, center, and
spread. Consider the probability distribution of X = number of children
with type O blood in a family with 5 children.
The Practice of Statistics, 5th Edition 11
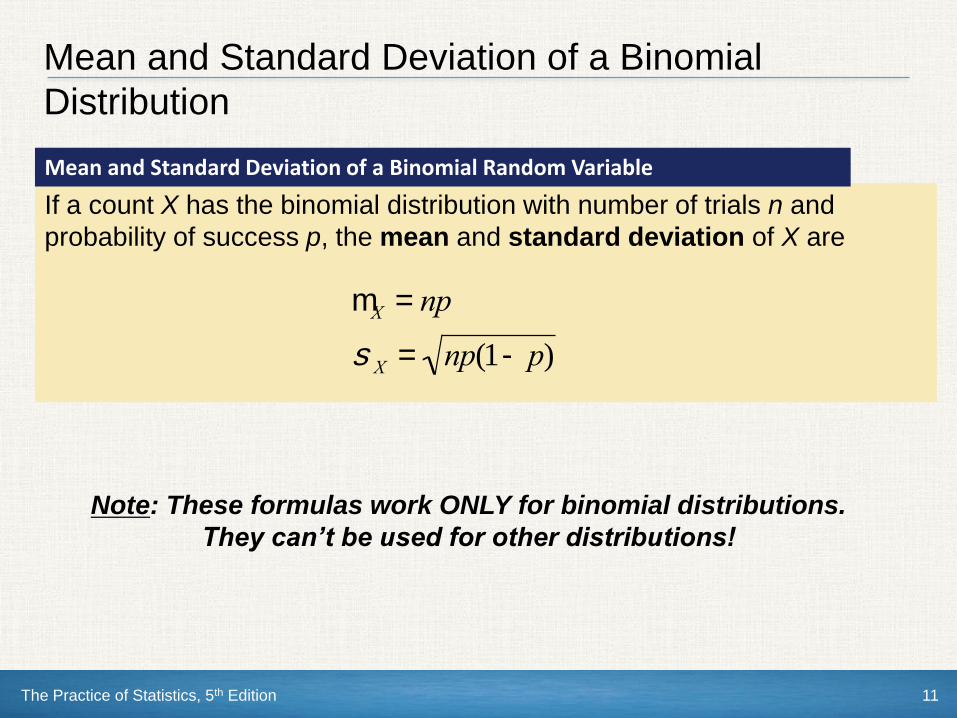
If a count X has the binomial distribution with number of trials n and
probability of success p, the mean and standard deviation of X are
Mean and Standard Deviation of a Binomial Random Variable
Mean and Standard Deviation of a Binomial
Distribution
mX = np
sX = np(1- p)
Note: These formulas work ONLY for binomial distributions.
They can’t be used for other distributions!

The Practice of Statistics, 5th Edition 12
Example: Mean and Standard Deviation
Mr. Bullard’s 21 AP Statistics students did the Activity on page 340. If
we assume the students in his class cannot tell tap water from bottled
water, then each has a 1/3 chance of correctly identifying the different
type of water by guessing. Let X = the number of students who
correctly identify the cup containing the different type of water.
Find the mean and standard deviation of X.
Since X is a binomial random variable with parameters n = 21 and p = 1/3, we can
use the formulas for the mean and standard deviation of a binomial random
variable.
mX = np
= 21(1/3) = 7
sX = np(1- p)
= 21(1/3)(2 /3) = 2.16
We’d expect about one-third of his
21 students, about 7, to guess
correctly.
If the activity were repeated many
times with groups of 21 students who
were just guessing, the number of
correct identifications would differ from
7 by an average of 2.16.
The Practice of Statistics, 5th Edition 13
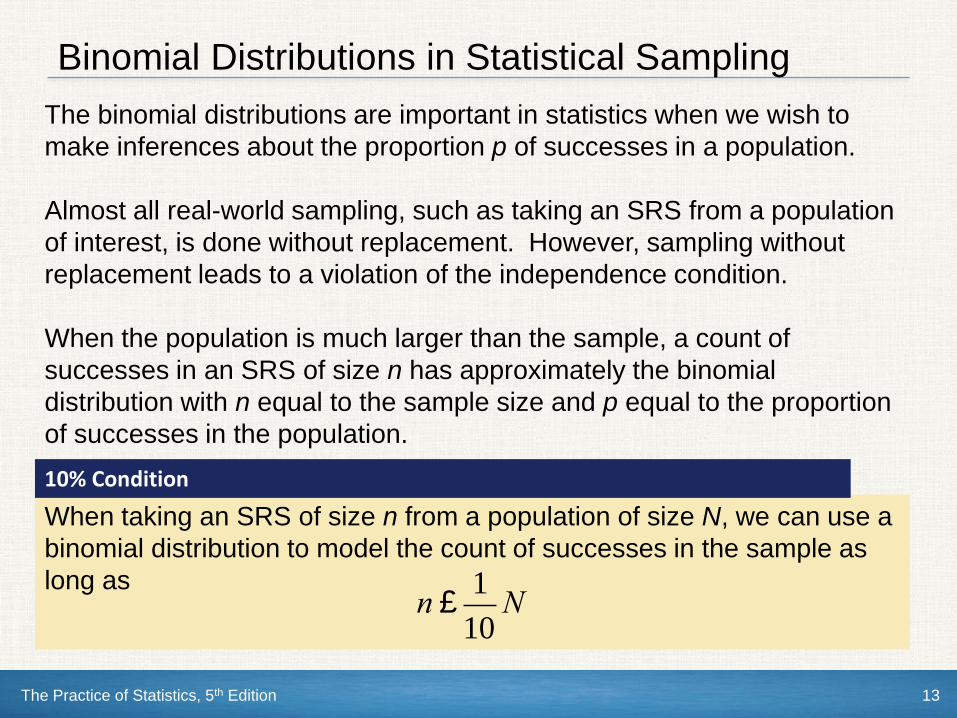
Binomial Distributions in Statistical Sampling
The binomial distributions are important in statistics when we wish to
make inferences about the proportion p of successes in a population.
Almost all real-world sampling, such as taking an SRS from a population
of interest, is done without replacement. However, sampling without
replacement leads to a violation of the independence condition.
When the population is much larger than the sample, a count of
successes in an SRS of size n has approximately the binomial
distribution with n equal to the sample size and p equal to the proportion
of successes in the population.
When taking an SRS of size n from a population of size N, we can use a
binomial distribution to model the count of successes in the sample as
long as
10% Condition
n £1
10N
The Practice of Statistics, 5th Edition 14
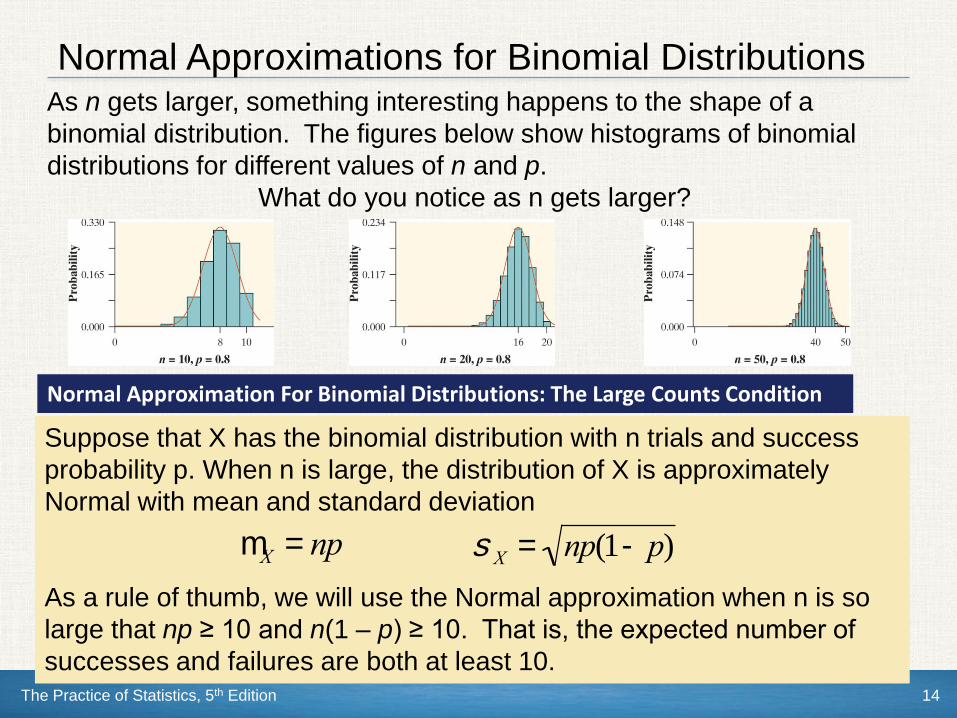
Normal Approximations for Binomial DistributionsAs n gets larger, something interesting happens to the shape of a
binomial distribution. The figures below show histograms of binomial
distributions for different values of n and p.
What do you notice as n gets larger?
Suppose that X has the binomial distribution with n trials and success
probability p. When n is large, the distribution of X is approximately
Normal with mean and standard deviation
As a rule of thumb, we will use the Normal approximation when n is so
large that np ≥ 10 and n(1 – p) ≥ 10. That is, the expected number of
successes and failures are both at least 10.
Normal Approximation For Binomial Distributions: The Large Counts Condition
mX = np
sX = np(1- p)
The Practice of Statistics, 5th Edition 15
Geometric Settings
In a binomial setting, the number of trials n is fixed and the binomial
random variable X counts the number of successes.
In other situations, the goal is to repeat a chance behavior until a
success occurs. These situations are called geometric settings.
A geometric setting arises when we perform independent trials of the
same chance process and record the number of trials it takes to get one
success. On each trial, the probability p of success must be the same.

The Practice of Statistics, 5th Edition 16
Geometric Settings
In a geometric setting, if we define the random variable Y to be the
number of trials needed to get the first success, then Y is called a
geometric random variable. The probability distribution of Y is called
a geometric distribution.
The number of trials Y that it takes to get a success in a geometric setting
is a geometric random variable. The probability distribution of Y is a
geometric distribution with parameter p, the probability of a success on
any trial. The possible values of Y are 1, 2, 3, . . . .
Like binomial random variables, it is important to be able to
distinguish situations in which the geometric distribution does and
doesn’t apply!

The Practice of Statistics, 5th Edition 17
Geometric Probability Formula
The Lucky Day Game. The random variable of interest in this game is Y
= the number of guesses it takes to correctly match the lucky day. What
is the probability the first student guesses correctly? The second?
Third? What is the probability the kth student guesses correctly?
If Y has the geometric distribution with probability p of success on each
trial, the possible values of Y are 1, 2, 3, … . If k is any one of these
values,
Geometric Probability Formula
P(Y = k) = (1- p)k-1p
P(Y =1) =1/7
P(Y = 2) = (6/7)(1/7) = 0.1224
P(Y = 3) = (6/7)(6/7)(1/7) = 0.1050

The Practice of Statistics, 5th Edition 18
Mean of a Geometric Random Variable
The table below shows part of the probability distribution of Y. We can’t
show the entire distribution because the number of trials it takes to get
the first success could be an incredibly large number.
If Y is a geometric random variable with probability p of success on each
trial, then its mean (expected value) is E(Y) = µY = 1/p.
Mean (Expected Value) Of A Geometric Random Variable
Shape: The heavily right-skewed shape is characteristic
of any geometric distribution. That’s because the most
likely value is 1.
Center: The mean of Y is µY = 7. We’d expect it to take
7 guesses to get our first success.
Spread: The standard deviation of Y is σY = 6.48. If the class played the Lucky Day game
many times, the number of homework problems the students receive would differ from 7
by an average of 6.48.
yi 1 2 3 4 5 6 …
pi 0.143 0.122 0.105 0.090 0.077 0.066
Section Summary
In this section, we learned how to…
The Practice of Statistics, 5th Edition 19
DETERMINE whether the conditions for using a binomial random
variable are met.
COMPUTE and INTERPRET probabilities involving binomial
distributions.
CALCULATE the mean and standard deviation of a binomial random
variable. INTERPRET these values in context.
FIND probabilities involving geometric random variables.
When appropriate, USE the Normal approximation to the binomial
distribution to CALCULATE probabilities. (*Not required for the AP® Statistics
Exam)
Binomial and Geometric Random Variables