Chapter 6: Performance Reports - Cisco · 6-6 Reports Management with Cisco Prime LAN Management...
184
CHAPTER 6-1 Reports Management with Cisco Prime LAN Management Solution 4.2 OL-25942-01 6 Performance Reports This chapter explains: • Generating Device and Interface Reports • Generating Device Performance Report • Generating IPSLA Detailed Reports and Graphs • Creating Summarized Reports • Generating Poller Reports • Generating Custom Report • Generating and Understanding IPSLA System Summary Reports • Consolidation of Statistical Data • Formulae Used in LMS 4.2 Reports and Graphs Generating Device and Interface Reports LMS 4.2 contains a set of predefined system generated reports called Device Reports and Interface Reports. These reports run periodically and are stored in the server. These Reports provide detailed information about the devices polled. The Reports page provides information only on the Top-10 and Bottom-10 devices. The Top-10 and Bottom-10 devices are devices that have the highest or lowest utilization or availability value. The information for the last 24 hours is generated as a report. This information is updated every one hour, by default. You can change this frequency in the Admin page. Only the recently generated 24-hour report is stored in the server as a Quick Report. By default, only the CSV and HTML version of the report is generated. You can also configure to archive all the generated reports in a PDF, HTML, and CSV format to a directory location. You need to set a default directory location to which these archived reports are published. For more information, see Set Report Publish Location under Administration of Cisco Prime Lan Management Solution 4.2. Table 6-1 describes the list of predefined Device and Interface Reports available in Cisco Prime LMS 4.2. A report is generated for each System-defined templates.
Transcript of Chapter 6: Performance Reports - Cisco · 6-6 Reports Management with Cisco Prime LAN Management...

Reports ManagemeOL-25942-01
C H A P T E R 6
Performance ReportsThis chapter explains:
• Generating Device and Interface Reports
• Generating Device Performance Report
• Generating IPSLA Detailed Reports and Graphs
• Creating Summarized Reports
• Generating Poller Reports
• Generating Custom Report
• Generating and Understanding IPSLA System Summary Reports
• Consolidation of Statistical Data
• Formulae Used in LMS 4.2 Reports and Graphs
Generating Device and Interface ReportsLMS 4.2 contains a set of predefined system generated reports called Device Reports and Interface Reports. These reports run periodically and are stored in the server.
These Reports provide detailed information about the devices polled. The Reports page provides information only on the Top-10 and Bottom-10 devices. The Top-10 and Bottom-10 devices are devices that have the highest or lowest utilization or availability value.
The information for the last 24 hours is generated as a report. This information is updated every one hour, by default. You can change this frequency in the Admin page.
Only the recently generated 24-hour report is stored in the server as a Quick Report. By default, only the CSV and HTML version of the report is generated. You can also configure to archive all the generated reports in a PDF, HTML, and CSV format to a directory location. You need to set a default directory location to which these archived reports are published. For more information, see Set Report Publish Location under Administration of Cisco Prime Lan Management Solution 4.2.
Table 6-1 describes the list of predefined Device and Interface Reports available in Cisco Prime LMS 4.2. A report is generated for each System-defined templates.
6-1nt with Cisco Prime LAN Management Solution 4.2

Chapter 6 Performance Reports Generating Device and Interface Reports
You can perform the following operations in the Quick Reports panel:
• Creating and Viewing a Device and Interface Report
• Understanding Device and Interface Reports
Creating and Viewing a Device and Interface ReportYou can view the report by clicking the report name. If data for a report is not available, a message appears, Report Not Available. This message appears because information is not available for the specified duration or the report job has failed.
To create the report:
Step 1 Select Reports > Performance.
Step 2 Select Device or Interface.
Step 3 Select the required report.
See Table 6-1 for the list of reports.
The Reports page appears.
Step 4 Select one of the following radio buttons
• Device Selector—All the devices, device type groups, user defined groups, and subnet groups that are being polled currently, in a tree format.
• Device Groups—All device groups being polled currently, in a tree structure.
• Port Groups—All port groups being polled currently, in a tree structure.
Step 5 Select the Date Range.
Table 6-1 Predefined Quick Reports
Report Name Description
Device Reports
CPU Utilization CPU utilization information for a device during the last 24 hours.
Device Availability Device availability information during the last 24 hours.
Memory Utilization Memory utilization information for a device during the last 24 hours.
Interface Reports
Interface Availability Interface availability information of a device during the last 24 hours.
Interface Utilization Interface utilization for a device during the last 24 hours.
Interface Error Rate Error rate information for a device interface during the last 24 hours.
Threshold Violation Report
Threshold Violation Threshold violation information for a MIB variable during the last 24 hours.
POE Reports
PoE PORT Utilization Power over Ethernet (PoE) Port utilization for a MIB variable during last 24 hours.
PoE PSE Consumption Power over Ethernet PSE consumption for a MIB variable during last 24 hours.
6-2Reports Management with Cisco Prime LAN Management Solution 4.2
OL-25942-01

Chapter 6 Performance Reports Generating Device and Interface Reports
Step 6 Select the Schedule Type.
Step 7 Enter the report name, e-mail id (multiple e-mail id can be entered separated by comma or semicolon), and report publish path.
Note Cisco Prime LMS does not support Japanese characters and special characters such as, \ / : * ? “ < > . ! % in the file or folder name.
Step 8 Click Create.
The report is created as a job.
A message is displayed:
Job ID created successfully.
The Job ID is listed in the Job Browser at the bottom of the page.
Click View to launch the report in a separate page.
For more information, see Understanding Device and Interface Reports
Understanding Device and Interface ReportsDevice and Interface Reports are system generated reports that run periodically and are stored in the server. These reports display information only on the data processed during the last 24-hours.
The following report types are available as Quick Reports:
• CPU Utilization
• Device Availability Report
• Memory Utilization
• Interface Utilization
• Interface Availability
• Interface Error Rate
• Threshold Violation
CPU Utilization
This report displays the CPU utilization data for each device polled for the CPU Utilization template. The information is presented using tables and graphs. Figure 6-1 shows an example of CPU utilization graph.
You can only export the report to a CSV file.
Table 6-2 describes the fields in the CPU Utilization report.
Table 6-2 CPU Utilization Report Fields
Field Description
Report Details
Report Name Name of the report. For example, CPU Utilization
6-3Reports Management with Cisco Prime LAN Management Solution 4.2
OL-25942-01

Chapter 6 Performance Reports Generating Device and Interface Reports
Generation Time Time at which the report was generated.For example, Mon, Apr 21 2009, 12:44:08
No. of Devices Number of devices included while generating the report.
No. of CPUs Number of CPUs monitored for utilization levels.
Start Date Start date of the report data. For example, Sun, Apr 20 2009, 12:44:03
End Date End date of the report data. For example, Mon, Apr 21 2009, 12:44:03
CPU Utilization Summary
Utilization in % Distribution of CPU utilization percentage range.
The CPU utilization percentage distribution range is categorized as 0-10, 10-30, 30-80, 80-100.
No. of CPUs Number of CPUs that fall into the corresponding utilization percentage category.
For example, 10 CPUs having 10-30% utilization and 20 CPUs having 30-80% CPU utilization.
The CPU Utilization summary is also presented as a pie chart, which shows the number of CPUs that fall into the corresponding distribution percentage range.
Device Details
Device Name Displays the device name. For example, 3500XL.
Click on the device name to view the CPU utilization percentage as a line graph. For more information on the graph, see CPU Utilization Graph.
CPU CPU monitored in the device.
Min % Minimum utilization percentage for the corresponding CPU.
Max % Maximum utilization percentage for the corresponding CPU.
Avg % Average utilization percentage for the corresponding CPU.
CPU Utilization Graph as shown in Figure 6-1.
X-axis Represents the time period of the report.
The time period refers to the start and end time of the report data.
Y-axis Represents the CPU utilization percentage.
Standard Deviation Standard deviation of utilization percentage for the corresponding CPU.
95th Percentile 95th Percentile of utilization percentage for the corresponding CPU.
Table 6-2 CPU Utilization Report Fields (continued)
Field Description
6-4Reports Management with Cisco Prime LAN Management Solution 4.2
OL-25942-01

Chapter 6 Performance Reports Generating Device and Interface Reports
Figure 6-1 CPU Utilization Graph
Each data point in the line graph has a tooltip that displays the value for the time period.
Device Availability Report
This report displays the device availability data for each device polled for the Device Availability template. The information is presented using tables and graphs. Figure 6-2 shows an example of Device availability graph.
You can only export the report to a CSV file.
Table 6-3 describes the fields in the Device Availability report.
Table 6-3 Device Availability Report Fields
Field Description
Report Details
Report Name Name of the report.
For example, Device Availability
Generation Time Date and time at which the report was generated.
For example, Mon, Apr 21 2009, 12:44:08
No. of Devices Number of devices included while generating the report.
Start Date Start date and time of the report data.
For example, Sun, Apr 20 2009, 12:44:03
End Date End date and time of the report data. For example, Mon, Apr 21 2009, 12:44:03
6-5Reports Management with Cisco Prime LAN Management Solution 4.2
OL-25942-01

Chapter 6 Performance Reports Generating Device and Interface Reports
Figure 6-2 Device Availability Graph
Each data point in the line graph has a tooltip that displays the value for the time period.
Summary
Availability in % Distribution of device availability percentage range.
The device availability percentage distribution range is categorized as 0-10, 10-50, 50-90, 90-100.
No. of Devices Number of devices that fall into the corresponding availability percentage category.
For example, 10 devices having 50-90% availability, 20 devices having 90-100% availability and so on.
The device availability summary is also presented as a pie chart, which shows the number of devices that fall into the corresponding distribution percentage range.
Device Details
Device Name Device name. For example, 3500XL.
Click on the device name to view the respective graph. For more information on the graph, see Device Availability Graph.
Availability % Availability percentage for the corresponding device.
Device Availability Graph as shown in Figure 6-2.
X-axis Represents the time period of the report.
The time period refers to the start and end time of the report data.
Y-axis Represents the device availability percentage.
Table 6-3 Device Availability Report Fields (continued)
Field Description
6-6Reports Management with Cisco Prime LAN Management Solution 4.2
OL-25942-01

Chapter 6 Performance Reports Generating Device and Interface Reports
Memory Utilization
This report displays the memory utilization data for each device polled for the Memory Utilization template. The information is presented using tables and graphs. Figure 6-3 shows an example of Memory Utilization graph.
You can only export the report to a CSV file.
Table 6-4 describes the fields in the Memory Utilization report.
Table 6-4 Memory Utilization Report Fields
Field Description
Report Details
Report Name Name of the report. For example, Memory Utilization
Generation Time Date and time at which the report was generated. For example, Mon, Apr 21 2009, 12:44:08
No. of Devices Number of devices included while generating the report.
No. of Memory Modules
Number of memory modules monitored for utilization levels.
Start Date Start date and time of the report data. For example, Sun, Apr 20 2009, 12:44:03
End Date End date and times of the report data. For example, Mon, Apr 21 2009, 12:44:03
Memory Utilization Summary
Utilization in % Distribution of memory utilization percentage range.
The memory utilization percentage distribution range is categorized as 0-50, 50-70, 70-90 and 90-100.
No. of Instances Number of instances that fall into the corresponding utilization percentage category.
For example, 10 instances having 50-70% utilization, 20 instances having 70-90% utilization and so on.
The memory utilization summary is also presented as a pie chart, which shows the number of instances that fall into the corresponding distribution percentage range.
Device Details
Device Name Device name. For example, 3500XL
Click on the device name to view the respective graph. For more information on the graph, see Memory Utilization Graph.
Instance Name Instance monitored for the device. For example, FLASH
Min % Minimum utilization percentage for the corresponding instance.
Max % Maximum utilization percentage for the corresponding instance.
Avg % Average utilization percentage for the corresponding instance.
6-7Reports Management with Cisco Prime LAN Management Solution 4.2
OL-25942-01

Chapter 6 Performance Reports Generating Device and Interface Reports
Figure 6-3 Memory Utilization Graph
Each data point in the line graph has a tooltip that displays the value for the time period.
Interface Utilization
This report displays the interface utilization data for each device polled for the Interface Utilization template. The information is presented using tables and graphs. Figure 6-4 shows an example of Interface Utilization graph.
You can only export the report to a CSV file.
Table 6-5 describes the fields in the Interface Utilization report.
Memory Utilization Graph as shown in Figure 6-3.
X-axis Represents the time period of the report.
The time period refers to the start and end time of the report data.
Y-axis Represents the memory utilization percentage.
Standard Deviation Standard deviation of utilization percentage for the corresponding instance.
95th Percentile 95th Percentile of utilization percentage for the corresponding instance.
Table 6-4 Memory Utilization Report Fields (continued)
Field Description
Table 6-5 Interface Utilization Report Fields
Field Description
Report Details
Report Name Name of the report. For example, Interface Utilization
Generation Time Date and time at which the report was generated.For example, Mon, Apr 21 2009, 12:44:08
No. of Devices Number of devices included while generating the report.
No. of Interfaces Number of interfaces monitored for utilization levels.
6-8Reports Management with Cisco Prime LAN Management Solution 4.2
OL-25942-01

Chapter 6 Performance Reports Generating Device and Interface Reports
Start Date Start date and time of the report data. For example, Sun, Apr 20 2009, 12:44:03
End Date End date and time of the report data. For example, Mon, Apr 21 2009, 12:44:03
Interface Utilization Summary
Utilization in % Distribution of interface utilization percentage range.
The interface utilization percentage distribution range is categorized as 0-50, 50-70, 70-90 and 90-100.
No. of Interfaces Number of device interfaces that fall into the corresponding utilization percentage category.
For example, 10 interfaces with 50-70% utilization, 20 interfaces with 70-90% utilization and so on.
The device interface utilization summary is also presented as a pie chart, which shows the number of interfaces that fall into the corresponding distribution percentage range.
Interface Utilization Device Details
Device Name Device name. For example, 3500XL
Click on the device name to view the respective graph. For more information on the graph, see Interface Utilization Graph.
Interface Interface monitored in the device. For example, VLAN-77.
Rx Max% Maximum Rx (received) percentage value.
Rx Avg% Average Rx (received) percentage value.
Rx Min% Minimum Rx (received) percentage value.
Tx Max% Maximum Tx (transmitted) percentage value.
Tx Avg% Average Tx (transmitted) percentage value.
Tx Min% Minimum Tx (transmitted) percentage value.
Interface Utilization Graph as shown in Figure 6-4
X-axis Represents the time period of the report.
The time period refers to the start and end time of the report.
Y-axis Represents the utilization percentage value.
Table 6-5 Interface Utilization Report Fields (continued)
Field Description
6-9Reports Management with Cisco Prime LAN Management Solution 4.2
OL-25942-01

Chapter 6 Performance Reports Generating Device and Interface Reports
Figure 6-4 Interface Utilization Graph
Each data point in the line graph has a tooltip that displays the value for the time period.
Interface Availability
This report displays the interface availability data for each device polled for the Interface Availability template. The information is presented using tables and graphs. Figure 6-5 shows an example of Interface Availability graph.
You can only export the report to a CSV file.
Table 6-6 describes the fields in the Interface Availability report.
Table 6-6 Interface Availability Report Fields
Field/Icon Description
Report Details
Report Name Name of the report. For example, Interface Availability
Generation Time Time at which the report was generated.For example, Mon, Apr 21 2009, 12:44:08
No. of Devices Number of devices included while generating the report.
No. of Interfaces Number of interfaces monitored for availability levels.
Start Date Start date and time of the report data. For example, Sun, Apr 20 2009, 12:44:03
End Date End date and time of the report data. For example, Mon, Apr 21 2009, 12:44:03
6-10Reports Management with Cisco Prime LAN Management Solution 4.2
OL-25942-01

Chapter 6 Performance Reports Generating Device and Interface Reports
Figure 6-5 Interface Availability Graph
Each data point in the line graph has a tooltip that displays the value for the time period.
Summary
Availability in % Distribution of interface availability percentage range.
The interface availability percentage distribution range is categorized as 0-10, 10-50, 50-90 and 90-100.
No. of Interfaces Number of interfaces that fall into the corresponding availability percentage category.
For example, 10 interfaces having 50-90% availability, 20 interfaces having 10-50% availability and so on.
The interface availability summary is also presented as a pie chart, which shows the number of interfaces that fall into the corresponding distribution percentage range.
Device Details
Device Name Device name. For example, 3500XL.
Click on the device name to view the respective graph. For more information on the graph, see Interface Availability Graph.
Instance Name Instance monitored for the corresponding device. For example, VLAN-42.
Availability % Instance availability percentage for the corresponding device. For example, 90%.
Interface Availability Graph shown in Figure 6-5.
X-axis Represents the time period of the report.
The time period refers to the start and end time of the report data.
Y-axis Represents the availability percentage value.
Table 6-6 Interface Availability Report Fields (continued)
Field/Icon Description
6-11Reports Management with Cisco Prime LAN Management Solution 4.2
OL-25942-01

Chapter 6 Performance Reports Generating Device and Interface Reports
Interface Error Rate
This report displays the interface error and discard data for each device polled for the Interface Errors template. The information is presented using tables and graphs. Figure 6-6 shows an example of an Interface Error Rate graph.
You can only export the report to a CSV file.
Table 6-7 describes the fields in the Interface Error Rate report.
Table 6-7 Interface Error Rate Report Fields
Field Description
Report Details
Report Name Name of the report. For example, Interface Error Rate
Generation Time Date and time at which the report was generated. For example, Mon, Apr 21 2009, 12:44:08
No. of Devices Number of devices included while generating the report.
No. of Interfaces Number of interfaces monitored for interface error rate levels.
Start Date Start date and time of the report data. For example, Sun, Apr 20 2009, 12:44:03
End Date End date and time of the report data. For example, Mon, Apr 21 2009, 12:44:03
ifInErrors Device Details
Device Name Device name. For example, 3500XL.
Click on the device name to view the respective graph. The graph displays the following details:
• X-axis (Time)—Represents the time period of the report. The time period refers to the start and end time of the report data.
• Y-axis (Packets/Sec)—Represents the number of ifInErrors packets.
Interface Interface monitored for the corresponding interface. For example, VLAN-42.
Error (packets) Number of ifInErrors packets for the corresponding interface.
ifOutErrors Device Details
Device Name Device name. For example, 3500XL.
Click on the device name to view the respective graph. The graph displays the following details:
• X-axis (Time)—Represents the time period of the report. The time period refers to the start and end time of the report data.
• Y-axis (Packets/Sec)—Represents the number of ifOutErrors packets.
Interface Interface monitored for the corresponding interface. For example, VLAN-42.
Error (packets) Number of ifOutErrors packets for the corresponding interface.
6-12Reports Management with Cisco Prime LAN Management Solution 4.2
OL-25942-01

Chapter 6 Performance Reports Generating Device and Interface Reports
Figure 6-6 Interface Error Rate Graph
Each data point in the line graph has a tooltip that displays the value for the time period.
ifInDiscards Device Details
Device Name Device name. For example, 3500XL.
Click on the device name to view the respective graph. The graph displays the following details:
• X-axis (Time)—Represents the time period of the report. The time period refers to the start and end time of the report data.
• Y-axis (Packets/Sec)—Represents the number of ifInDiscards packets.
Interface Interface monitored for the corresponding interface. For example, VLAN-42.
Error (packets) Number of ifInDiscards packets for the corresponding interface.
ifOutDiscards Device Details
Device Name Device name. For example, 3500XL.
Click on the device name to view the respective graph. The graph displays the following details:
• X-axis (Time)—Represents the time period of the report. The time period refers to the start and end time of the report data.
• Y-axis (Packets/Sec)—Represents the number of ifOutDiscards packets.
Interface Interface monitored for the corresponding interface. For example, VLAN-42.
Error (packets) Number of ifOutDiscards packets for the corresponding interface.
Table 6-7 Interface Error Rate Report Fields (continued)
Field Description
6-13Reports Management with Cisco Prime LAN Management Solution 4.2
OL-25942-01

Chapter 6 Performance Reports Generating Device and Interface Reports
Threshold Violation
This report displays the Threshold Violations details for each device based on the polled data. The information is presented using tables.
You can only export the report to a CSV file.
This report displays only the latest 1000 Threshold violations. Generate the PDF report to view all violations.
Table 6-8 describes the fields in the Threshold Violations report.
Table 6-8 Threshold Violations Report Fields
Field Description
Threshold Violation Report Details
Report Name Name of the report. For example, Threshold Violations.
Generation Time Date and time at which the report was generated. For example, Mon, Apr 21 2009, 12:44:08
Start Date Start date and time of the report data. For example, Sun, Apr 20 2009, 12:44:03
End Date End date and time of the report data. For example, Mon, Apr 21 2009, 12:44:03
Threshold Violation Summary
No. of Devices Number of devices that participated in generating the report.
No. of Thresholds Number of thresholds configured for the device.
No. of Alarms Total number of alarms generated for the device.
Severity Severity level of the violation (such as Critical, Medium or Low).
Count Total number of violations in each severity level. For example,
• Critical: 50
• Low: 12
• Medium: 12
Low Violation Details
Threshold Name Name of the threshold. For example, CPU Threshold.
Rule Condition applied for monitoring threshold violation. For example, cpmCPUTotal5minRev >= 60%.
Device Name Displays the device name monitored for threshold violation. For example, 3500XL.
Instance Name Instance selected for monitoring threshold violation. For example, CPU of supervisor.
Time Stamp Time when the threshold violation occurred. For example, Mon, Apr 21 2008, 10:30:10
6-14Reports Management with Cisco Prime LAN Management Solution 4.2
OL-25942-01
Chapter 6 Performance Reports Generating Device Performance Report
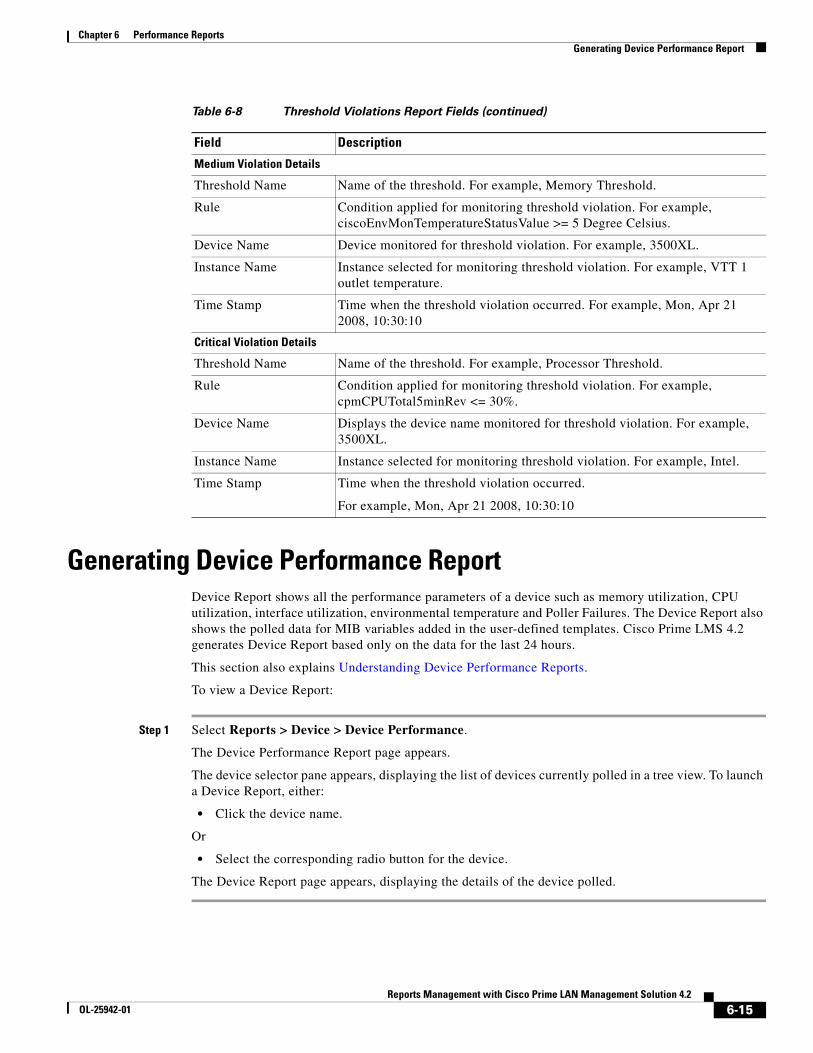
Generating Device Performance ReportDevice Report shows all the performance parameters of a device such as memory utilization, CPU utilization, interface utilization, environmental temperature and Poller Failures. The Device Report also shows the polled data for MIB variables added in the user-defined templates. Cisco Prime LMS 4.2 generates Device Report based only on the data for the last 24 hours.
This section also explains Understanding Device Performance Reports.
To view a Device Report:
Step 1 Select Reports > Device > Device Performance.
The Device Performance Report page appears.
The device selector pane appears, displaying the list of devices currently polled in a tree view. To launch a Device Report, either:
• Click the device name.
Or
• Select the corresponding radio button for the device.
The Device Report page appears, displaying the details of the device polled.
Medium Violation Details
Threshold Name Name of the threshold. For example, Memory Threshold.
Rule Condition applied for monitoring threshold violation. For example, ciscoEnvMonTemperatureStatusValue >= 5 Degree Celsius.
Device Name Device monitored for threshold violation. For example, 3500XL.
Instance Name Instance selected for monitoring threshold violation. For example, VTT 1 outlet temperature.
Time Stamp Time when the threshold violation occurred. For example, Mon, Apr 21 2008, 10:30:10
Critical Violation Details
Threshold Name Name of the threshold. For example, Processor Threshold.
Rule Condition applied for monitoring threshold violation. For example, cpmCPUTotal5minRev <= 30%.
Device Name Displays the device name monitored for threshold violation. For example, 3500XL.
Instance Name Instance selected for monitoring threshold violation. For example, Intel.
Time Stamp Time when the threshold violation occurred.
For example, Mon, Apr 21 2008, 10:30:10
Table 6-8 Threshold Violations Report Fields (continued)
Field Description
6-15Reports Management with Cisco Prime LAN Management Solution 4.2
OL-25942-01

Chapter 6 Performance Reports Generating Device Performance Report
Understanding Device Performance ReportsThis report provides complete details of the data collected by polling a device. The information is presented using tables and graphs.
Table 6-9 describes the fields in the Device Report.
Table 6-9 Device Performance Report Fields
Field Description
Device Details
Device Name Device name. For example, 3500XL.
Click the device name to launch Device Center.
Device Description Device information such as Model, Software Version, Copyright and so on. For example,
Cisco Systems WS-C6009 Cisco Catalyst Operating System Software, Version 8.6(2) Copyright (c) 1995-2007 by Cisco Systems
Device Status Status of the device in the network. The following status information are displayed:
• Reachable—Device is available in the network.
• Not Reachable—Device is may be down or not reachable.
6-16Reports Management with Cisco Prime LAN Management Solution 4.2
OL-25942-01

Chapter 6 Performance Reports Generating Device Performance Report
Device Availability Summary
24 Hours Click to launch a line graph showing device availability details for the last 24 hours.
For more information on the line graph, see Device Availability Line Graph.
One Week Click to launch a line graph showing device availability details for the last one week.
For more information on the line graph, see Device Availability Line Graph.
One Month Click to launch a line graph showing device availability details for the last one month.
For more information on the line graph, see Device Availability Line Graph.
Device Availability Line Graph Displays the Device Availability percentage as a line graph.
The line graph provides the following information:
• Device—Device name
• Variable—MIB variable name
• Instance—MIB variable instance monitored
• Start Time—Start date and time of monitoring the availability of the MIB variable instance
• End Time—End date and time of monitoring the availability of the MIB variable instance
• Average—Average availability of the MIB variable instance
Device Threshold Details
No. of Thresholds Configured Total number of thresholds configured in the device.
No. of Violations in Last 24 hours Total number of threshold violations occurred in the last 24 hours categorized based on the severity levels (such as Critical, Medium or Low).
For example, Low: 10, Medium: 15, Critical: 170
Threshold Name Threshold configured in the device.
Variable Name MIB variable name. For example, cpmCPUTotal5minRev.
Instance Name MIB variable instance for which the threshold is configured. For example, CPU of supervisor.
Severity Severity level of the threshold (such as Critical, Medium or Low).
Time Stamp Time of threshold violation.
More(link)
By default, only the latest 10 MIB instances are displayed for the device in the Device Threshold Details panel.
If you click More, a pop-up window appears displaying details on all the MIB instances in the device.
Table 6-9 Device Performance Report Fields
Field Description
6-17Reports Management with Cisco Prime LAN Management Solution 4.2
OL-25942-01

Chapter 6 Performance Reports Generating Device Performance Report
Poll Failure Details
Total Poll Failures Total number of poll failures for the device during the last 24 hours.
MIB Variable MIB variable failed during polling. For example, ifInErrors.
Instance MIB variable instance failed during polling. For example, VLAN-1.
Failure Reason Reason for the failure. For example, Request Timed-Out. Device may be down.
Last Failed Time of last failure. For example, Mon, Apr 21 2008, 17:30:15.
More(link)
By default, only the latest 10 MIB failure instances are displayed for the device in the Poll Failure Details panel.
If you click More, a pop-up window appears displaying details on all the MIB failure instances in the device.
Environmental Temperature Summary Provides environmental temperature details on the device polled using the Environmental Temperature template.
Instance Name MIB variable instance.
Min Minimum temperature value for the MIB variable instance in Celsius or Fahrenheit.
Max Maximum temperature value for the MIB variable instance in Celsius or Fahrenheit.
Avg Average temperature value for the MIB variable instance in Celsius or Fahrenheit.
CPU Utilization Details Provides CPU utilization details on the device polled using the CPU Utilization template.
Instance Name MIB variable instance.
Min % Minimum CPU utilization percentage value of the MIB variable instance.
Avg % Average CPU utilization percentage value of the MIB variable instance.
Max % Maximum CPU utilization percentage value of the MIB variable instance.
Graph Click to launch a line graph. For more information on the line graph, see CPU Utilization Line Graph.
Table 6-9 Device Performance Report Fields
Field Description
6-18Reports Management with Cisco Prime LAN Management Solution 4.2
OL-25942-01

Chapter 6 Performance Reports Generating Device Performance Report
CPU Utilization Line Graph Displays the last 24 hours CPU utilization percentage summary as a line graph.
The line graph provides the following information:
• Device—Device name
• Variable—MIB variable name
• Instance—MIB variable instance monitored
• Start Time—Start date and time of monitoring the CPU utilization of the MIB variable instance
• End Time—End date and time of monitoring the CPU utilization of the MIB variable instance
• Average—Average CPU utilization percentage value for the last 24 hours
• Latest—Latest CPU utilization percentage value.
Memory Utilization Details Provides memory utilization details on the device polled using the Memory Utilization template.
Instance Name MIB variable instance. For example, DRAM
Min % Minimum memory utilization percentage value of the MIB variable instance.
Avg % Average memory utilization percentage value of the MIB variable instance.
Max % Maximum memory utilization percentage value of the MIB variable instance.
Graph Click to launch a line graph. For more information on the line graph, see Memory Utilization Line Graph.
Memory Utilization Line Graph Displays the last 24 hours memory utilization percentage summary as a line graph.
The line graph provides the following information:
• Device—Device name
• Variable—MIB variable name
• Instance—MIB variable instance monitored
• Start Time—Start date and time of monitoring the memory utilization value
• End Time—End date and time of monitoring the memory utilization value
• Average—Average PoE port utilization percentage value for the last 24 hours
• Latest—Latest PoE port utilization percentage value
Table 6-9 Device Performance Report Fields
Field Description
6-19Reports Management with Cisco Prime LAN Management Solution 4.2
OL-25942-01

Chapter 6 Performance Reports Generating Device Performance Report
Interface Details Provides interface details on the device polled using the Interface templates.
Interface Name Interface monitored in the device.
Interface Availability Average interface availability percentage value.
Detailed(link)
By default, only the Interface Name and Interface Availability details are displayed for the device in the Interface Summary panel.
If you click Detailed, a pop-up window appears displaying the following details for the device:
• Interface Name—Interface monitored in the device.
• RxUtilization (%)—Average Rx (received) percentage value
• TxUtilization (%)—Average Tx (transmitted) percentage value
• inInErrors (packets/sec)—Average number of ifInErrors for the interface
• ifOutErrors (packets/sec)—Average number of ifOutErrors for the interface
• ifInDiscards (packets/sec)—Average number of ifInDiscards for the interface
• ifOutDiscards (packets/sec)—Average number of ifOutDiscards for the interface
Custom Variable Details Provides data for MIB variables polled using a user-defined template.
Variable Name Name of the MIB variable. For example, sysServices.
Instance Name MIB variable instance name.
Min Minimum value for the monitored MIB variable.
Max Maximum value for the monitored MIB variable.
Avg Average value for the monitored MIB variable.
Units Displays unit information for the monitored MIB variable. The following units are displayed:
• Units in %—Monitored for utilization values.
• Units in csec—Monitored for the interface availability values.
• Units in bytes/second—Monitored for packet transfer and error values.
• Units in packets/second—Monitored for packet transfer and error values.
• Units in Celsius—Monitored for temperature values.
• Units in milliwatts/watts—Monitored for PoE port utilization.
Table 6-9 Device Performance Report Fields
Field Description
6-20Reports Management with Cisco Prime LAN Management Solution 4.2
OL-25942-01

Chapter 6 Performance Reports Generating Device Performance Report
PoE Port Utilization Details Provides data for MIB variables polled using a user-defined template.
Instance Name MIB variable instance name.
Min Minimum value for the monitored MIB variable.
Max Maximum value for the monitored MIB variable.
Avg Average value for the monitored MIB variable.
Graph Click to launch a line graph. For more information on the line graph, see PoE Utiization Line Graph.
PoE Port Utilization Line Graph Displays the last 24 hours PoE Port utilization percentage summary as a line graph.
The line graph displays the following information:
• Device—Device name
• Variable—MIB variable name
• Instance—MIB variable instance monitored
• Start Time—Start date and time of monitoring the PoE Port utilization of the MIB variable instance
• End Time—End date and time of monitoring the PoE Port utilization of the MIB variable instance
• Average—Average PoE Port utilization percentage value for the last 24 hours
• Latest—Latest PoE Port utilization percentage value.
PoE PSE Consumption Details Provides data for MIB variables polled using a user-defined template.
Instance Name MIB variable instance name.
Min Minimum value for the monitored MIB variable.
Max Maximum value for the monitored MIB variable.
Avg Average value for the monitored MIB variable.
Graph Click to launch a line graph. For more information on the line graph, see PoE PSE Consumption Line Graph
Table 6-9 Device Performance Report Fields
Field Description
6-21Reports Management with Cisco Prime LAN Management Solution 4.2
OL-25942-01

Chapter 6 Performance Reports Generating Device Performance Report
PoE PSE Consumption Line Graph Displays the last 24 hours PoE PSE consumption percentage summary as a line graph.
The line graph displays the following information:
• Device—Device name
• Variable—MIB variable name
• Instance—MIB variable instance monitored
• Start Time—Start date and time of monitoring the PoE PSE consumption of the MIB variable instance
• End Time—End date and time of monitoring the PoE PSE consumption of the MIB variable instance
• Average—Average PoE PSE consumption percentage value for the last 24 hours
• Latest—Latest PoE PSE consumption percentage value.
Device TrendWatch Details
No. of TrendWatch Configured Total number of TrendWatches configured in the device.
No. of Violations in Last 24 hours Total number of TrendWatch violations occurred in the last 24 hours, categorized based on the severity levels (such as Critical, Medium or Low).
For example, Low: 10, Medium: 15, Critical: 170
TrendWatch Name TrendWatch configured in the device.
Variable Name MIB variable name. For example, cpmCPUTotal5minRev.
Instance Name MIB variable instance for which the threshold is configured. For example, CPU of supervisor.
Severity Severity level of the TrendWatch (such as Critical, Medium or Low).
Time Stamp Time of TrendWatch violation.
More(link) By default, only the latest 10 MIB instances are displayed for the device in the Device TrendWatch Details panel.
If you click More, a pop-up window appears displaying details on all the MIB instances in the device.
EnergyWise Port Power Usage Details
Instance Name MIB variable instance name.
Min Minimum value for the monitored MIB variable.
Avg Average value for the monitored MIB variable.
Max Maximum value for the monitored MIB variable.
Graph Click to launch a line graph. For more information on the line graph, see EnergyWise Port Power Usage Line Graph
Table 6-9 Device Performance Report Fields
Field Description
6-22Reports Management with Cisco Prime LAN Management Solution 4.2
OL-25942-01

Chapter 6 Performance Reports Generating Device Performance Report
EnergyWise Port Power Usage Line Graph
Displays the last 24 hours EnergyWise Port Power Usage as a line graph.
The line graph displays the following information:
• Device—Device name
• Instance—MIB variable instance monitored
• Start Time—Start date and time of monitoring the EnergyWise Port Power Usage of the MIB variable instance
• End Time—End date and time of monitoring the EnergyWise Port Power Usage of the MIB variable instance
• Average—Average EnergyWise Port Power Usage percentage value for the last 24 hours
• Latest—Latest EnergyWise Port Power Usage percentage value.
EnergyWise Device Power Usage Details
Device Name Name of the device.
Min Minimum value for the monitored MIB variable.
Avg Average value for the monitored MIB variable.
Max Maximum value for the monitored MIB variable.
Graph Click to launch a line graph. For more information on the line graph, see EnergyWiseDevice Power Usage Graph
EnergyWiseDevice Power Usage Graph
Displays the last 24 hours EnergyWise Device Power Usage as a line graph.
The line graph displays the following information:
• Device—Device name
• Instance—MIB variable instance monitored
• Start Time—Start date and time of monitoring the PoE PSE consumption of the MIB variable instance
• End Time—End date and time of monitoring the PoE PSE consumption of the MIB variable instance
• Average—Average EnergyWise Device Power Usage value for the last 24 hours
• Latest—Latest EnergyWise Device Power Usage value.
Table 6-9 Device Performance Report Fields
Field Description
6-23Reports Management with Cisco Prime LAN Management Solution 4.2
OL-25942-01

Chapter 6 Performance Reports Generating IPSLA Detailed Reports and Graphs
Generating IPSLA Detailed Reports and GraphsCiscoworls LMS 4.2 allows you to generate the following statistical reports and graphs based on the granularity (such as Minute, Hourly, Daily, Weekly, Monthly):
• Availability Reports and Graphs
• Ethernet Jitter Reports and Graphs
• HTTP Reports and Graphs
• ICMP Jitter Reports and Graphs
• Latency (Round-Trip Time) Reports and Graphs
• Path Echo Reports and Graphs
• RTP Reports and Graphs
• UDP Jitter Reports and Graphs
• Video Jitter Reports and Graphs
• Creating Summarized Reports
Based on the granularity specified, you can generate either Minute or Historical reports for each report types.
You can generate the Minute or Historical reports either immediately or schedule them to run at a specified time.
For more information, see Immediate Reports or Scheduled Reports.
Immediate Reports
The Immediate reports and graphs are generated instantly and are not stored in the Report Archives. You can set this option while creating the report jobs.
Note Some report jobs have the same Report Name. You can distinguish such report jobs based on the Create Time and Description that you specify while creating these report jobs.
To generate immediate reports and graphs:
Step 1 Select Reports > Performance > IPSLA Detailed.
Step 2 Select the report you want to generate form the list of reports.
The Reports Generator window appears.
For more information on specifying the report details, see Table 6-10.
Step 3 Click Generate Report.
The report is generated.
You can click Reset to clear the values you entered.
6-24Reports Management with Cisco Prime LAN Management Solution 4.2
OL-25942-01

Chapter 6 Performance Reports Generating IPSLA Detailed Reports and Graphs
Scheduled Reports
The Scheduled reports and graphs are scheduled to run at the time specified while creating the report jobs.
Using the Publish option, you can store the Scheduled reports in the file system at /opt/CSCOpx for future reference.
To generate scheduled reports and graphs:
Step 1 Select Reports > Performance > IPSLA Detailed.
Step 2 Select the report you want to generate form the list of reports.
The Reports Generator window appears.
Step 3 Specify the details as required. See Table 6-10 for more information.
Step 4 Click Generate Report.
The report is scheduled. The scheduled report runs at the specified date and time. You can view the status of the scheduled report on the Report Job Browser at the bottom of the page.
You can click Reset to clear the values you entered.
Table 6-10 Generating Statistical Reports and Graphs
Field Name Description
Report Details
Name Enter the name of the report you want to customize.
Description Enter the description of the report.
Schedule
Schedule Type Select the schedule type from the drop-down lis t. There are five schedule types:
• Immediate— Schedules the report immediately. This report contains data based on the report period.
• Once—Schedules the report only once. This report contains data based on the report period.
• Daily—Schedules the report every day. This report contains the data for the last 24 hours. The data is based on the Granularity. If you select Daily schedule type, both Minute and Hourly granularities are enabled.
• Weekly—Schedules the report every week. This report contains the data for the last seven days. If you select Weekly, the Hourly and Daily granularity is enabled.
• Monthly—Schedules the report every month. This report contains the data for the last 30 days. If you select Monthlyschedule type, both the Daily and Weekly granularity is enabled.
Job Scheduled Date Specify the date and time at which the job is scheduled at. The Job Schedule Date should be greater than the To date specified in the Report Period section.
This field is disabled if you have selected Immediate as the Schedule Type.
6-25Reports Management with Cisco Prime LAN Management Solution 4.2
OL-25942-01

Chapter 6 Performance Reports Generating IPSLA Detailed Reports and Graphs
Granularity
Granularity Select the granularity for the report. The granularities available are:
• Minute—Displays statistical information collected every minute from the source.
• Hourly—Displays statistical information collected every hour from the source.
• Daily—Displays statistical information collected every day from the source.
• Weekly—Displays statistical information collected every week from the source.
• Monthly—Displays statistical information collected every month from the source.
Report Period
From Specify the start date and time of your report.
Select the date from the calendar icon and time from the drop-down list.
To Specify the end date and time of your report.
Select the date from the calendar icon and time from the drop-down list.
Report Publish Location
Report Publish Path Use the Browse button to locate the place where you want to save the report for future reference.
The stored report is in the tabular format.
This field is disabled if you have selected Immediate as the Schedule Type.
The report should be published either in pdf or csv format , based on the e-mail attachment option, if it is enabled with either pdf or csv format.
The default report published format is pdf, if the e-mail attachment option is not enabled.
Note Cisco Prime LMS does not support Japanese characters and special characters such as, \ / : * ? “ < > . ! % in the file or folder name.
Outage Settings
Exclude Planned Outage Period check box
de-select the Exclude Planned Outage Period check box if you want to add the outage time period. By default this is checked.
Table 6-10 Generating Statistical Reports and Graphs (continued)
Field Name Description
6-26Reports Management with Cisco Prime LAN Management Solution 4.2
OL-25942-01

Chapter 6 Performance Reports Generating IPSLA Detailed Reports and Graphs
Step 5 Go to Download section.
Step 6 Select the Enable radio button from the Automatic prompting for file download option.
Email Notification
Email Address This e-mail notification includes an attachment that gives details on:
• Job ID
• Main Report Name
• Report Type
• Job Name
• Schedule Type
• Schedule Date and Time
• Granularity
• Report Period
• Attachment option (If the attachment option is enabled)
Enter e-mail addresses to which the job sends messages at the beginning and at the end of the job. You can enter multiple e-mail addresses, separated by commas.
Configure the SMTP server to send e-mails in the View / Edit System Preferences dialog box (Admin > System > System Preferences).
We recommend that you configure the Cisco Prime e-mail ID in the View / Edit System Preferences dialog box (Admin > System > System Preferences).
When the job starts or completes, an e-mail is sent with the Cisco Prime e-mail ID as the sender's address.
This field is disabled if you have selected Immediate as the Schedule Type.
Attachment Option You can now send e-mail notifications that include graphs and reports as attachment s. You can sent these attachments as either in a PDF or a CSV format. The default is a PDF file.
If the attachment size exceeds the configured limit, a mail will be sent to the user with the message:
Attachment size exceeded.
Table 6-10 Generating Statistical Reports and Graphs (continued)
Field Name Description
6-27Reports Management with Cisco Prime LAN Management Solution 4.2
OL-25942-01

Chapter 6 Performance Reports Generating IPSLA Detailed Reports and Graphs
Availability Reports and GraphsThis report displays the availability of all the operations such as Echo, Path Echo, ICMP Jitter, UDP Jitter, FTP, DHCP, HTTP, TCP Connect, RTP, DNS, UDP Echo, Gatekeeper Registration Delay, Call Setup Post Dial Delay, DSLw and EthernetJitter, Ethernet Ping, EthernetPingAutoIPSLA, and EthernetJitterAutoIPSLA on the target device.
You can view the availability data gathered by LMS 4.2 from its collectors. You can generate Availability reports and graphs for the granularities such as hourly, daily, weekly, or monthly.
Note You cannot generate use the every n minutes option for generating Availability reports and graphs.
You can generate the following Availability reports and graphs:
• Historical Availability Report
• Historical Availability Graph
Historical Availability Report
This report provides information on the reachability of the target devices. You can also view this report in graphical format by clicking the Graph link on the Availability Report page.
See Table 6-11 for more information on the report.
Table 6-11 Historical Availability Reports
Field Description
Summary
Total Number of Collectors Number of collectors selected to generate the report.
Collectors with Report Data Number of collectors with statistical data in the database for the specified period.
Collectors without Report Data
Lists the collectors without any statistical data in the database for the specified period.
Report Details
Start Time Displays the time when the statistics were collected and stored in the database.
Availability% Displays the availability percentage of the target device.
See Table 6-54 for more information on the formula.
Error% Displays the error percentage.
See Table 6-54 for more information on the formula.
6-28Reports Management with Cisco Prime LAN Management Solution 4.2
OL-25942-01

Chapter 6 Performance Reports Generating IPSLA Detailed Reports and Graphs
Historical Availability Graph
To view the Historical Availability Report in the graphical format, click the Graph link on the Availability Report page. The Availability Graph page appears.
Figure 6-7 shows a sample Historical Availability Graph.
Figure 6-7 Availability Graph
Errors Disconnects Number of times the target was disconnected from the source.
Timeouts Number of RTT operations timed out.
Busies Number of times an RTT operation was not initiated because of earlier incomplete RTT operations.
NoConnections Number of times an RTT operation was not initiated. This occurs if the target connection is not established.
Drops Number of times an RTT operation was not initiated because:
• The necessary internal resource was not available
Or
• Some unrecognized operations were carried out
SeqErrors Number of RTT operations that were completed, and received with an unexpected sequence identifier.
VerifyErrors Number of RTT operation that were completed, and for which the data received did not match the expected data.
Table 6-11 Historical Availability Reports (continued)
Field Description
6-29Reports Management with Cisco Prime LAN Management Solution 4.2
OL-25942-01

Chapter 6 Performance Reports Generating IPSLA Detailed Reports and Graphs
See Table 6-12 for more information on the graph.
Ethernet Jitter Reports and GraphsYou can view the Ethernet jitter data gathered from Ethernet Jitter collectors. It displays the delay between any two data frames or the inter-arrival delay between the source and the target device. The target device must have Responder capability.
You can generate Ethernet Jitter reports and graphs for the granularity period such as by the minute hourly, daily, weekly, and monthly.
You can generate the following Ethernet Jitter reports and graphs:
• Minute Ethernet Jitter Report
• Minute Ethernet Jitter Graphs
• Historical Ethernet Jitter Report
• Historical Ethernet Jitter Graphs
Minute Ethernet Jitter Report
This report provides information on jitter, round-trip time latency, unprocessed packets, frames loss, out-of-sequence, tail-dropped and late packets.
You can also view this report in graphical format by clicking the Graph link on the Minute Ethernet Jitter Report page.
See Table 6-13 for more information on the report.
Table 6-12 Historical Availability Graph
Table/Graph Description
Collector Information Collector Name Displays the collector name.
Source Name Displays the source name.
Target Name Displays the target name.
Operation Displays the operation type.
Report Period Start Date Displays the start date of the report.
End Date Displays the end date of the report.
Granularity Displays the granularity specified while creating the report job.
Availability Summary You can view the availability of the target device for the various time period.
X-axis Represents the time period of the report.
The time period refers to the start and end time of the report, specified while creating the report job.
Y-axis Represents the availability percentage.
See Table 6-54 for more information on the formula.
6-30Reports Management with Cisco Prime LAN Management Solution 4.2
OL-25942-01

Chapter 6 Performance Reports Generating IPSLA Detailed Reports and Graphs
Table 6-13 Minute Ethernet Jitter Report
Field Description
Summary
Total Number of Collectors Number of collectors selected to generate the report.
Collectors with Report Data Number of collectors with statistical data in the database for the specified period.
Collectors without Report Data Lists the collectors without any statistical data in the database for the specified period.
Report Details
Start Time Displays the time when the statistics were collected and stored in the database.
Round Trip Latency Min (ms) Minimum round-trip time taken to perform an Ethernet Jitter operation.
This value is represented in milli seconds (msecs).
Avg (ms) Average round-trip time.
See Table 6-54 for more information on the formula.
This value is represented in milli seconds (msecs).
Max (ms) Maximum round-trip time taken to perform an Ethernet Jitter operation.
This value is represented in milli seconds (msecs).
Std Dev Standard deviation of the round-trip time.
See Table 6-54 for more information on the formula.
Positive Source - Dest Jitter Min (ms) Minimum positive jitter at the destination.
This value is represented in milli seconds (msecs).
Avg (ms) Average positive jitter at the destination.
See Table 6-54 for more information on the formula.
This value is represented in milli seconds (msecs).
Max (ms) Maximum positive jitter at the destination.
This value is represented in milli seconds (msecs).
Std Dev Standard deviation of the positive jitter from source to destination.
See Table 6-54 for more information on the formula.
6-31Reports Management with Cisco Prime LAN Management Solution 4.2
OL-25942-01

Chapter 6 Performance Reports Generating IPSLA Detailed Reports and Graphs
Negative Source - Dest Jitter Min (ms) Minimum negative jitter at the destination.
This value is represented in milli seconds (msecs).
Avg (ms) Average negative jitter at the destination.
See Table 6-54 for more information on the formula.
This value is represented in milli seconds (msecs).
Max (ms) Maximum negative jitter at the destination.
This value is represented in milli seconds (msecs).
Std Dev Standard deviation of the negative jitter from source to destination.
See Table 6-54 for more information on the formula.
Positive Dest - Source Jitter Min (ms) Minimum positive jitter at the source.
This value is represented in milli seconds (msecs).
Avg (ms) Average of minimum and maximum positive jitter at the source.
See Table 6-54 for more information on the formula.
This value is represented in milli seconds (msecs).
Max (ms) Maximum positive jitter at the source.
This value is represented in milli seconds (msecs).
Std Dev Standard deviation of the positive jitter from destination to source.
See Table 6-54 for more information on the formula.
Table 6-13 Minute Ethernet Jitter Report (continued)
Field Description
6-32Reports Management with Cisco Prime LAN Management Solution 4.2
OL-25942-01

Chapter 6 Performance Reports Generating IPSLA Detailed Reports and Graphs
Minute Ethernet Jitter Graphs
To view the Minute Ethernet Jitter Graphs, click the Graph link on the Minute Ethernet Jitter Report page. The following graphs appear:
• Source-Destination Jitter
• Destination-Source Jitter
Negative Dest - Source Jitter Min (ms) Minimum negative jitter at the source.
This value is represented in milli seconds (msecs).
Avg (ms) Average negative jitter at the source.
See Table 6-54 for more information on the formula.
This value is represented in milli seconds (msecs).
Max (ms) Maximum negative jitter at the source.
This value is represented in milli seconds (msecs).
Std Dev Standard deviation of the negative jitter from destination to source.
See Table 6-54 for more information on the formula.
Inter-Arrival Jitter Inter-Arrival IN Inter-arrival jitter (RFC 1889) at source.
Inter-Arrival OUT Inter-arrival jitter (RFC 1889) at responder.
Frame Loss/Errors Loss SD Number of frames lost when sent from source to destination.
Loss DS Number of frames lost when sent from destination to source.
Minimum Successive Loss Minimum number of frames that are dropped successively.
Maximum Successive Loss Maximum number of frames that are dropped successively.
Out of Sequence Number of frames arrived out of sequence.
Skips Number of frames that are skipped for each operation because the router could not send the packet out.
Unpro Number of frames that arrived but could not be processed because of an internal error.
Late Number of frames arrived after the timeout.
MIA Number of the frames lost whose direction is unknown.
Table 6-13 Minute Ethernet Jitter Report (continued)
Field Description
6-33Reports Management with Cisco Prime LAN Management Solution 4.2
OL-25942-01

Chapter 6 Performance Reports Generating IPSLA Detailed Reports and Graphs
• Round-Trip Latency
• Errors
• Inter-Arrival Jitter
See Table 6-14 for more information on the graphs.
Table 6-14 Minute Ethernet Jitter Graphs
Table/Graph Name Description
Collector Information Source Name Displays the source name.
Target Name Displays the target name.
Operation Displays the operation type.
Report Period Start Date Displays the start date of the report.
End Date Displays the end date of the report.
Granularity Displays the granularity specified while creating the report job.
Round-Trip Latency You can view the round-trip time values for:
• Minimum
• Maximum
• Average
These values are represented in milli seconds (msecs).
X-axis Represents the time period of the report.
The time period refers to the start and end time of the report, specified while creating the report job.
Y-axis Represents the latency.
It displays the values for minimum, maximum, and average latency.
Source-Destination Jitter You can view the following positive and negative jitter values from source to destination:
• Pos Min
• Pos Avg
• Pos Max
• Neg Min
• Neg Avg
• Neg Max
These values are represented in milli seconds (msecs).
X-axis Represents the time period of the report.
The time period refers to the start and end time of the report, specified while creating the report job.
Y-axis Represents the jitter from source to destination.
It displays the source to destination jitter values for positive minimum, positive average, positive maximum, negative minimum, negative average, and negative maximum.
6-34Reports Management with Cisco Prime LAN Management Solution 4.2
OL-25942-01

Chapter 6 Performance Reports Generating IPSLA Detailed Reports and Graphs
Destination-Source Jitter You can view the following positive and negative jitter values from destination to source:
• Pos Min
• Pos Avg
• Pos Max
• Neg Min
• Neg Avg
• Neg Max
These values are represented in milli seconds (msecs).
X-axis Represents the time period of the report.
The time period refers to the start and end time of the report, specified while creating the report job.
Y-axis Represents the jitter from destination to source.
It displays the destination to source jitter values for positive minimum, positive average, positive maximum, negative minimum, negative average, and negative maximum.
Errors You can view the error occurrences for the following:
• SD Frame Loss
• DS Frame Loss
• Out of Sequence
• MIA
• Late
• Skips
• Unpro
X-axis Represents the time period of the report.
The time period refers to the start and end time of the report, specified while creating the report job.
Y-axis Represents the error occurrences.
It displays the values for source-to-destination frame loss, destination-to-source frame loss, Out of Sequence, MIA, Late, Skips and Unpro.
Table 6-14 Minute Ethernet Jitter Graphs (continued)
Table/Graph Name Description
6-35Reports Management with Cisco Prime LAN Management Solution 4.2
OL-25942-01

Chapter 6 Performance Reports Generating IPSLA Detailed Reports and Graphs
Note There may be instances where the different parameters of a collector may overlap each other. So to view a particular graph curve, you can click on the legends available. This allows you to view only a particular graph corresponding to that selected legend.
Historical Ethernet Jitter Report
This report provides information on Round-Trip Latency, Positive SD Jitter, Negative SD Jitter, Positive DS Jitter, Negative DS Jitter, Completion Summary, End-to-End Errors, and Frame Loss and Errors. You can also view this report in graphical format by clicking the Graph link on the Jitter Report page.
See Table 6-15 for more information on the report.
Inter-Arrival Jitter You can view the following Inter-Arrival Jitter values:
• IN
• OUT
X-axis Represents the time period of the report.
The time period refers to the start and end time of the report, specified while creating the report job.
Y-axis Represents the jitter values.
It displays the values for IN and OUT.
Table 6-14 Minute Ethernet Jitter Graphs (continued)
Table/Graph Name Description
Table 6-15 Historical Ethernet Jitter Report
Field Description
Summary
Total Number of Collectors Number of collectors selected for generating the report.
Collectors with Report Data Number of collectors with statistical data in the database for the specified period.
Collectors without Report Data
Lists the collectors without any statistical data in the database for the specified period.
Report Details
Start Time Displays the time when the statistics were collected and stored in the database.
6-36Reports Management with Cisco Prime LAN Management Solution 4.2
OL-25942-01

Chapter 6 Performance Reports Generating IPSLA Detailed Reports and Graphs
Round Trip Latency Min (ms) Minimum round-trip time taken to perform an UDP Jitter operation.
These values are represented in milli seconds (msecs).
Avg (ms) Average round-trip time taken to perform an Ethernet Jitter operation.
See Table 6-54 for more information on the formula.
These values are represented in milli seconds (msecs).
Max (ms) Maximum round-trip time taken to perform an Ethernet Jitter operation.
These values are represented in milli seconds (msecs).
Std Dev Standard deviation of the round-trip time.
See Table 6-54 for more information on the formula.
Positive Source - Dest Jitter Min (ms) Minimum positive jitter at the destination.
This value is represented in milli seconds (msecs).
Avg (ms) Average positive jitter at the destination.
See Table 6-54 for more information on the formula.
This value is represented in milli seconds (msecs).
Max (ms) Maximum positive jitter at the destination.
This value is represented in milli seconds (msecs).
Std Dev Standard deviation of positive jitter from source to destination.
See Table 6-54 for more information on the formula.
Negative Source - Dest Jitter Min (ms) Minimum negative jitter at the destination.
This value is represented in milli seconds (msecs).
Avg (ms) Average negative jitter at the destination.
See Table 6-54 for more information on the formula.
This value is represented in milli seconds (msecs).
Max (ms) Maximum negative jitter at the destination.
This value is represented in milli seconds (msecs).
Std Dev Standard deviation of negative jitter from source to destination.
See Table 6-54 for more information on the formula.
Table 6-15 Historical Ethernet Jitter Report (continued)
Field Description
6-37Reports Management with Cisco Prime LAN Management Solution 4.2
OL-25942-01

Chapter 6 Performance Reports Generating IPSLA Detailed Reports and Graphs
Positive Dest - Source Jitter Min (ms) Minimum positive jitter at the source.
This value is represented in milli seconds (msecs).
Avg (ms) Average positive jitter at the source.
See Table 6-54 for more information on the formula.
This value is represented in milli seconds (msecs).
Max (ms) Maximum positive jitter at the source.
This value is represented in milli seconds (msecs).
Std Dev Standard deviation of positive jitter at the source.
See Table 6-54 for more information on the formula.
Negative Dest - Source Jitter Min (ms) Minimum negative jitter at the source.
This value is represented in milli seconds (msecs).
Avg (ms) Average negative jitter at the source.
See Table 6-54 for more information on the formula.
This value is represented in milli seconds (msecs).
Max (ms) Maximum negative jitter at the source.
This value is represented in milli seconds (msecs).
Std Dev Standard deviation of negative jitter at the source.
See Table 6-54 for information on the formula.
Inter-Arrival Jitter Inter-arrival Jitter IN Inter-arrival Jitter (RFC 1889) at source.
Inter-arrival Jitter OUT Inter-arrival Jitter (RFC 1889) at responder.
End-to-End Errors Internal Errors Errors caused by internal problems in the router.
Busies Number of times an RTT operation was not initiated because of earlier incomplete RTT operations.
Completion Summary Tries Sum of all errors and numCompletions.
Over Threshold% Number of jitter operations that violate threshold.
Error% Displays the error percentage.
See Table 6-54 for more information on the formula.
Completions% Displays the completions percentage.
Table 6-15 Historical Ethernet Jitter Report (continued)
Field Description
6-38Reports Management with Cisco Prime LAN Management Solution 4.2
OL-25942-01
Chapter 6 Performance Reports Generating IPSLA Detailed Reports and Graphs
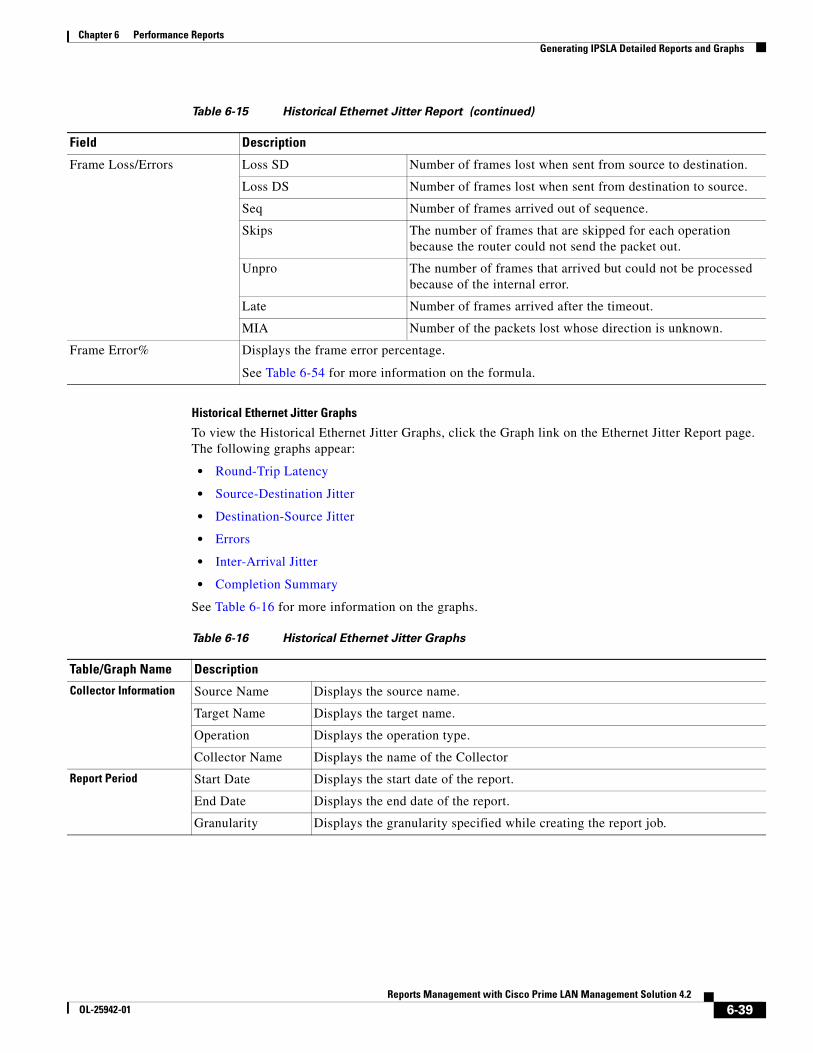
Historical Ethernet Jitter Graphs
To view the Historical Ethernet Jitter Graphs, click the Graph link on the Ethernet Jitter Report page. The following graphs appear:
• Round-Trip Latency
• Source-Destination Jitter
• Destination-Source Jitter
• Errors
• Inter-Arrival Jitter
• Completion Summary
See Table 6-16 for more information on the graphs.
Frame Loss/Errors Loss SD Number of frames lost when sent from source to destination.
Loss DS Number of frames lost when sent from destination to source.
Seq Number of frames arrived out of sequence.
Skips The number of frames that are skipped for each operation because the router could not send the packet out.
Unpro The number of frames that arrived but could not be processed because of the internal error.
Late Number of frames arrived after the timeout.
MIA Number of the packets lost whose direction is unknown.
Frame Error% Displays the frame error percentage.
See Table 6-54 for more information on the formula.
Table 6-15 Historical Ethernet Jitter Report (continued)
Field Description
Table 6-16 Historical Ethernet Jitter Graphs
Table/Graph Name Description
Collector Information Source Name Displays the source name.
Target Name Displays the target name.
Operation Displays the operation type.
Collector Name Displays the name of the Collector
Report Period Start Date Displays the start date of the report.
End Date Displays the end date of the report.
Granularity Displays the granularity specified while creating the report job.
6-39Reports Management with Cisco Prime LAN Management Solution 4.2
OL-25942-01

Chapter 6 Performance Reports Generating IPSLA Detailed Reports and Graphs
Round-Trip Latency You can view the round-trip time values for:
• Average Maximum
• Average
• Average Minimum
• Minimum Latency
• Maximum Latency
These values are represented in milli seconds (msecs).
X-axis Represents the time period of the report.
The time period refers to the start and end time of the report, specified while creating the report job.
Y-axis Represents the latency.
It displays the values for minimum, maximum, and average latency.
Source-Destination Jitter
You can view the following positive and negative jitter values from source to destination:
• Positive Maximum
• Positive Average Maximum
• Positive Average
• Positive Average Minimum
• Negative Maximum
• Negative Average Maximum
• Negative Average
• Negative Average Minimum
These values are represented in milli seconds (msecs).
X-axis Represents the time period of the report.
The time period refers to the start and end time of the report, specified while creating the report job.
Y-axis Represents the jitter from source to destination.
It displays the source to destination jitter values for positive minimum, positive average, positive maximum, negative minimum, negative average, and negative maximum.
Table 6-16 Historical Ethernet Jitter Graphs (continued)
Table/Graph Name Description
6-40Reports Management with Cisco Prime LAN Management Solution 4.2
OL-25942-01

Chapter 6 Performance Reports Generating IPSLA Detailed Reports and Graphs
Destination-Source Jitter
You can view the following positive and negative jitter values from destination to source:
• Positive Maximum
• Positive Average Maximum
• Positive Average
• Positive Average Minimum
• Negative Maximum
• Negative Average Maximum
• Negative Average
• Negative Average Minimum
These values are represented in milli seconds (msecs).
X-axis Represents the time period of the report.
The time period refers to the start and end time of the report, specified while creating the report job.
Y-axis Represents the jitter from destination to source.
It displays the destination to source jitter values for positive minimum, positive average, positive maximum, negative minimum, negative average, and negative maximum.
Inter-Arrival Jitter You can view the following Inter-Arrival Jitter values:
• Maximum IAJitter In
• Maximum IAJitter Out
• Minimum IAJitter In
• Minimum IAJiiter Out
These values are represented in milli seconds (msecs).
X-axis Represents the time period of the report.
The time period refers to the start and end time of the report, specified while creating the report job.
Y-axis Represents the Inter-arrival jitter.
It displays the Inter-arrival jitter values for IN and OUT.
Table 6-16 Historical Ethernet Jitter Graphs (continued)
Table/Graph Name Description
6-41Reports Management with Cisco Prime LAN Management Solution 4.2
OL-25942-01

Chapter 6 Performance Reports Generating IPSLA Detailed Reports and Graphs
Note There may be instances where the different parameters of a collector may overlap one another. In such cases, to view a particular graph curve, you can click on the legends available. This allows you to view only the graph corresponding to that selected legend.
HTTP Reports and GraphsYou can view the HTTP data gathered from HTTP collectors. The report displays the round-trip latency time required to connect to and access data from an HTTP server. HTTP server response time is measured for DNS Lookup, TCP Connect, and HTTP transaction time.
You can generate HTTP reports and graphs for the granularity period such as by the minute hourly, daily, weekly, and monthly.
Errors You can view the error occurrences for the following:
• Total Busies
• Total Internal Errors
• Total Frame Loss Src-Dest
• Total Frame Loss Dest-Src
• Total Sequence Errors
• Total Frame MIA
• Total Frame Late
• Total Frame Errors
• Total Frame Skips
• Total Frame Unpro
X-axis Represents the time period of the report.
The time period refers to the start and end time of the report, specified while creating the report job.
Y-axis Represents the error occurrences.
It displays the error occurrence values for SD Frame loss, DS Frame loss, Out of Sequence, MIA, Late, Skips, Unpro, Busies, and Internal Errors.
Completion Summary You can view the completion summary for:
• Total Attempts
• Total Completions
• Total Over Threshold
• Total Errors
Table 6-16 Historical Ethernet Jitter Graphs (continued)
Table/Graph Name Description
6-42Reports Management with Cisco Prime LAN Management Solution 4.2
OL-25942-01

Chapter 6 Performance Reports Generating IPSLA Detailed Reports and Graphs
You can generate the following HTTP reports and graphs:
• Minute HTTP Report
• Minute HTTP Graphs
• Historical HTTP Report
• Historical HTTP Graphs
Minute HTTP Report
This report provides information on RTT, DNS RTT, TCP Connect RTT, Transaction RTT, and Message Body Octets. You can also view the report in graphical format by clicking the Graph link on the Minute HTTP Report page.
See Table 6-17 for more information on the report.
Minute HTTP Graphs
To view the Minute HTTP Report in graphical format, click the Graph link on the Minute HTTP Report page. The Latency Summary graph appears.
Figure 6-8 displays a sample Minute HTTP Latency Summary Graph
Table 6-17 Minute HTTP Report
Field Description
Summary
Total Number of Collectors Number of collectors selected to generate the report.
Collectors with Report Data Number of collectors with statistical data in the database for the specified period.
Collectors without Report Data Lists the collectors without any statistical data in the database for the specified period.
Report Details
Start Time Displays the time when the statistics were collected and stored in the database.
RTT Round-trip time taken to perform a HTTP operation. The value of round-trip time is a sum of DNSRTT, TCPConnectRTT, and TransactionRTT.
This value is represented in milli seconds (msecs).
DNS RTT Round-trip time to query the DNS for HTTP server.
This value is represented in milli seconds (msecs).
TCP Connect RTT Round-trip time taken to connect to the HTTP server.
This value is represented in milli seconds (msecs).
Transaction RTT Round-trip time taken to download the specified object by the URL.
This value is represented in milli seconds (msecs).
Message Body Octets Size of the message body received in response to HTTP request.
6-43Reports Management with Cisco Prime LAN Management Solution 4.2
OL-25942-01

Chapter 6 Performance Reports Generating IPSLA Detailed Reports and Graphs
Figure 6-8 HTTP Latency Summary (Minute)
See Table 6-18 for more information on the graph.
Note There may be instances where the different parameters of a collector may overlap each other. So to view a particular graph curve, you can click on the legends available. This allows you to view only a particular graph corresponding to that selected legend.
Table 6-18 Minute HTTP Graph
Field/Graph Name Description
Collector Information
Collector Name Displays the name of the Collector
Source Name Displays the source name.
Target Name Displays the target name.
Operation Displays the operation type.
Report Period Start Date Displays the start date of the report.
End Date Displays the end date of the report.
Granularity Displays the granularity specified while creating the report job.
Latency Summary You can view the latency summary for:
• DNS Lookup Time
• TCP Connect Time
• Page Load Time
• Total Time
These values are represented in milli seconds (msecs)
X-axis Represents the time period of the report.
The time period refers to the start and end time of the report, specified while creating the report job.
This value is represented in milli seconds (msecs)
Y-axis Represents the latency.
It displays the latency values for DNS Lookup Time, TCP Connect Time, Page Load Time, and Total Time.
This value is represented in milli seconds (msecs)
6-44Reports Management with Cisco Prime LAN Management Solution 4.2
OL-25942-01

Chapter 6 Performance Reports Generating IPSLA Detailed Reports and Graphs
Historical HTTP Report
This report provides information on RTT, Standard Deviation, Average DNS RTT, Average TCP Connect RTT, Average Transaction RTT, Average Message Body Octets, and Errors. You can also view the Historical HTTP Report in graphical format by clicking the Graph link on the HTTP Report page.
See Table 6-19 for more information on the report.
Table 6-19 Historical HTTP Report
Field Description
Summary
Total Number of Collectors Number of collectors selected to generate the report.
Collectors with Report Data Number of collectors with statistical data in the database for the specified period.
Collectors without Report Data Lists the collectors without any statistical data in the database for the specified period.
Report Details
Start Time Displays the time when the statistics were collected and stored in the database.
RTT Min RTT Minimum round-trip time taken to perform a HTTP operation.
This value is represented in milli seconds (msecs).
Max RTT Maximum round-trip time taken to perform a HTTP operation.
This value is represented in milli seconds (msecs).
Avg RTT Average round-trip time.
This value is represented in milli seconds (msecs).
See Table 6-54 for more information on the formula.
Standard Deviation Standard deviation for latency.
See Table 6-54 for more information on the formula.
Avg DNS RTT Displays the average DNS round-trip time.
See Table 6-54 for more information on the formula.
This value is represented in milli seconds (msecs).
Avg TCP Connect RTT Displays the average TCP Connect round-trip time.
See Table 6-54 for more information on the formula.
This value is represented in milli seconds (msecs).
Avg Transaction RTT Displays the average transaction round-trip time.
See Table 6-54 for more information on the formula.
This value is represented in milli seconds (msecs).
Avg Message Body Octets Displays the average message body octets.
See Table 6-54 for information on the formula.
Tries Total number of HTTP operations tried from source to target.
Completion Number of HTTP operations completed successfully.
Over Threshold% Number of HTTP operations that violate threshold.
6-45Reports Management with Cisco Prime LAN Management Solution 4.2
OL-25942-01

Chapter 6 Performance Reports Generating IPSLA Detailed Reports and Graphs
Historical HTTP Graphs
To view the Historical HTTP Graphs, click the Graph link on the HTTP Report page. The following graphs appear:
• Latency Summary
• Error Summary
• Completion Summary
See Table 6-20 for more information on the graphs.
Errors% Displays the error percentage.
See Table 6-54 for more information on the formula.
Errors DNS Server Timeout Number of requests that could not connect to DNS server.
TCP Connect Timeout Number of requests that could not connect to HTTP server.
Transaction Timeout Number of requests that timed out during HTTP transaction.
DNS Query Error Number of requests with DNS Query errors.
HTTP Error Number of requests with HTTP errors while downloading the base page.
Drops Number of times a HTTP operation could not initiate because of an internal error.
Busies Number of times an HTTP operation was not initiated because of an earlier incomplete HTTP operation.
Table 6-19 Historical HTTP Report (continued)
Field Description
Table 6-20 Historical HTTP Graphs
Table/Graph Name Description
Collector Information
Collector Name Displays the name of the Collector
Source Name Displays the source name.
Target Name Displays the target name.
Operation Displays the operation type.
Report Period Start Date Displays the start date of the report.
End Date Displays the end date of the report.
Granularity Displays the granularity specified while creating the report job.
6-46Reports Management with Cisco Prime LAN Management Solution 4.2
OL-25942-01

Chapter 6 Performance Reports Generating IPSLA Detailed Reports and Graphs
Latency Summary
Figure 6-8 displays a sample graph.
You can view the latency summary for:
• Average Total Time
• Average Page Time
• Average TCP Time
• Average DNS Time
These values are represented in milli seconds (msecs)
X-axis Represents the time period of the report.
The time period refers to the start and end time of the report, specified while creating the report job.
This value is represented in milli seconds (msecs)
Y-axis Represents the latency.
It displays the latency values for DNS Lookup Time, TCP Connect Time, Page Load Time, and Total Time.
This value is represented in milli seconds (msecs)
Error Summary
Figure 6-10 displays a sample graph.
You can view the error occurrences for:
• DNS Timeouts
• TCP Timeouts
• Page Timeouts
• DNS Query Errors
• HTTP Errors
• Total Busies
• Total Drops
X-axis Represents the time period of the report.
The time period refers to the start and end time of the report, specified while creating the report job.
Y-axis Represents the error occurrences.
It displays the error occurrence values for DNS Timeouts, TCP Timeouts, Page Timeouts, DNS Query Errors, HTTP Errors, Drops, and Busies.
Table 6-20 Historical HTTP Graphs (continued)
Table/Graph Name Description
6-47Reports Management with Cisco Prime LAN Management Solution 4.2
OL-25942-01

Chapter 6 Performance Reports Generating IPSLA Detailed Reports and Graphs
Figure 6-9 displays a Historical HTTP Latency Summary Graph
Figure 6-9 HTTP Latency Summary (Historical)
Completion Summary
Figure 6-11 displays a sample Completion Summary graph.
You can view the completion summary for:
• Total Attempts
• Total Completions
• Total Over Threshold
• Total Errors
X-axis Represents the time period of the report.
The time period refers to the start and end time of the report, specified while creating the report job.
Y-axis Represents the percentage of completion.
It displays the completion summary for Completion, Over Threshold, and Errors.
Table 6-20 Historical HTTP Graphs (continued)
Table/Graph Name Description
6-48Reports Management with Cisco Prime LAN Management Solution 4.2
OL-25942-01

Chapter 6 Performance Reports Generating IPSLA Detailed Reports and Graphs
Figure 6-10 displays a Historical HTTP Error Summary Graph
Figure 6-10 HTTP Error Summary (Historical)
6-49Reports Management with Cisco Prime LAN Management Solution 4.2
OL-25942-01

Chapter 6 Performance Reports Generating IPSLA Detailed Reports and Graphs
Figure 6-11 displays a Historical HTTP Completion Summary Graph
Figure 6-11 HTTP - Completion Summary (Historical)
Note There may be instances where the different parameters of a collector may overlap each other. So to view a particular graph curve, you can click on the legends available. This allows you to view only a particular graph corresponding to that selected legend.
ICMP Jitter Reports and GraphsYou can view the ICMP Jitter data gathered from ICMP Jitter collectors. It displays network performance-related statistics between a Cisco IOS device (source) and any other IP device (destination).
The destination device can be any network device that supports ICMP operation such as a server or workstation. ICMP collector does not require IP SLA responders to be configured on the destination devices.
You can generate ICMP Jitter reports and graphs for the granularity period such as by the minute hourly, daily, weekly, and monthly.
6-50Reports Management with Cisco Prime LAN Management Solution 4.2
OL-25942-01

Chapter 6 Performance Reports Generating IPSLA Detailed Reports and Graphs
You can generate the following ICMP reports and graphs:
• Minute ICMP Jitter Report
• Minute ICMP Jitter Graphs
• Historical ICMP Jitter Report
• Historical ICMP Jitter Graphs
Minute ICMP Jitter Report
This report provides information on Round Trip Latency, Positive SD Jitter, Negative SD Jitter, Positive DS Jitter, Negative DS Jitter, and Packet Loss/Errors. You can also the ICMP Jitter Minute Report in graphical format by clicking the Graph link on the Minute ICMP Jitter Report page.
See Table 6-21 for more information on the report.
Table 6-21 Minute ICMP Jitter Report
Field Description
Summary
Total Number of Collectors
Number of collectors selected to generate the report.
Collectors with Report Data
Number of collectors with statistical data in the database for the specified period.
Collectors without Report Data
Lists the collectors without any statistical data in the database for the specified period.
Report Details
Start Time Displays the time when the statistics were collected and stored in the database.
Round Trip Latency Measures the round-trip time taken to perform an ICMP operation.
Min (ms) Minimum round-trip time taken for an ICMP operation.
This value is represented in milli seconds (msecs).
Avg (ms) Average round-trip time.
See Table 6-54 for more information on the formula.
This value is represented in milli seconds (msecs).
Max (ms) Maximum round-trip time taken for an ICMP operation.
This value is represented in milli seconds (msecs).
Std Dev Standard deviation for latency.
See Table 6-54 for more information on the formula.
6-51Reports Management with Cisco Prime LAN Management Solution 4.2
OL-25942-01

Chapter 6 Performance Reports Generating IPSLA Detailed Reports and Graphs
One Way Latency Min (ms) Minimum one way time taken to perform an ICMP Jitter operation.
This value is represented in milli seconds (msecs).
Avg (ms) Average one way time.
See Table 6-54 for more information on the formula.
This value is represented in milli seconds (msecs).
Max (ms) Maximum one way time taken to perform an ICMP Jitter operation.
This value is represented in milli seconds (msecs).
Std Dev Standard deviation of the one-way time.
See Table 6-54 for more information on the formula.
Positive Source - Dest Jitter
Min (ms) Minimum positive jitter at the destination.
This value is represented in milli seconds (msecs).
Avg (ms) Average positive jitter at the destination.
See Table 6-54 for more information on the formula.
This value is represented in milli seconds (msecs).
Max (ms) Maximum positive jitter at the destination.
This value is represented in milli seconds (msecs).
Std Dev Standard deviation of the positive jitter from source to destination.
See Table 6-54 for more information on the formula.
This value is represented in milli seconds (msecs).
Negative Source - Dest Jitter
Min (ms) Minimum negative jitter at the destination.
This value is represented in milli seconds (msecs).
Avg (ms) Average negative jitter at the destination.
See Table 6-54 for more information on the formula.
This value is represented in milli seconds (msecs).
Max (ms) Maximum negative jitter at the destination.
This value is represented in milli seconds (msecs).
Std Dev Standard deviation of the negative jitter from source to destination.
See Table 6-54 for more information on the formula.
Table 6-21 Minute ICMP Jitter Report (continued)
Field Description
6-52Reports Management with Cisco Prime LAN Management Solution 4.2
OL-25942-01
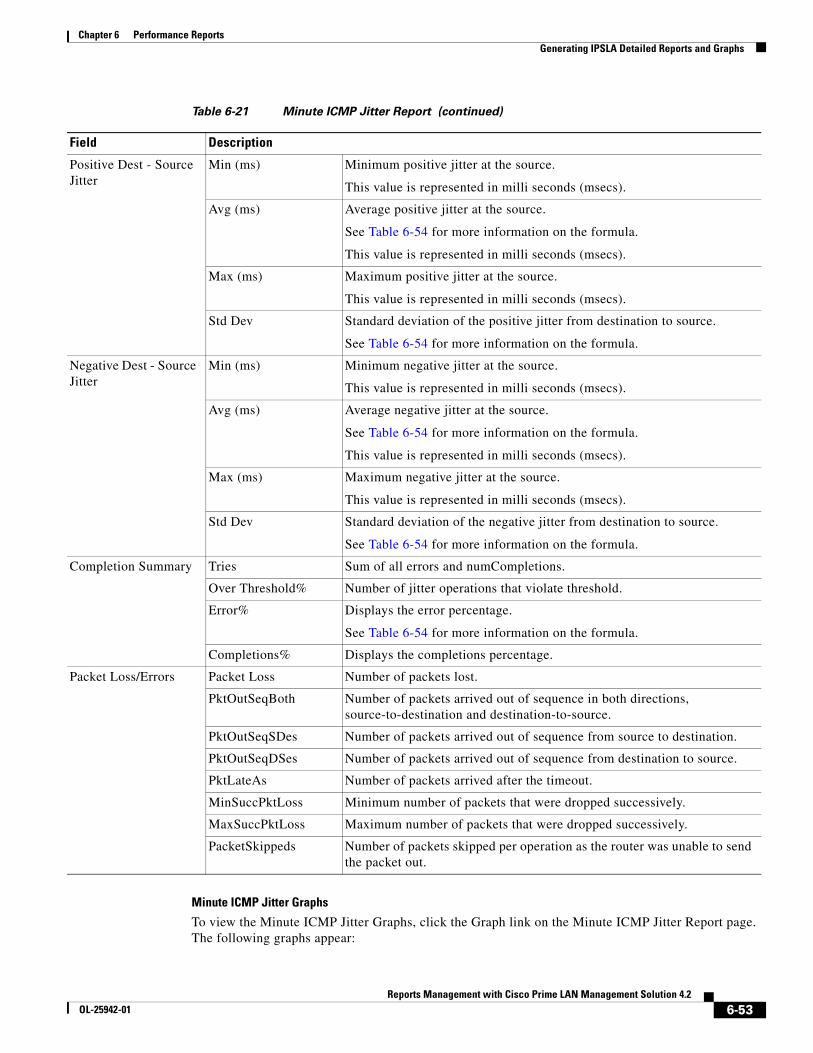
Chapter 6 Performance Reports Generating IPSLA Detailed Reports and Graphs
Minute ICMP Jitter Graphs
To view the Minute ICMP Jitter Graphs, click the Graph link on the Minute ICMP Jitter Report page. The following graphs appear:
Positive Dest - Source Jitter
Min (ms) Minimum positive jitter at the source.
This value is represented in milli seconds (msecs).
Avg (ms) Average positive jitter at the source.
See Table 6-54 for more information on the formula.
This value is represented in milli seconds (msecs).
Max (ms) Maximum positive jitter at the source.
This value is represented in milli seconds (msecs).
Std Dev Standard deviation of the positive jitter from destination to source.
See Table 6-54 for more information on the formula.
Negative Dest - Source Jitter
Min (ms) Minimum negative jitter at the source.
This value is represented in milli seconds (msecs).
Avg (ms) Average negative jitter at the source.
See Table 6-54 for more information on the formula.
This value is represented in milli seconds (msecs).
Max (ms) Maximum negative jitter at the source.
This value is represented in milli seconds (msecs).
Std Dev Standard deviation of the negative jitter from destination to source.
See Table 6-54 for more information on the formula.
Completion Summary Tries Sum of all errors and numCompletions.
Over Threshold% Number of jitter operations that violate threshold.
Error% Displays the error percentage.
See Table 6-54 for more information on the formula.
Completions% Displays the completions percentage.
Packet Loss/Errors Packet Loss Number of packets lost.
PktOutSeqBoth Number of packets arrived out of sequence in both directions, source-to-destination and destination-to-source.
PktOutSeqSDes Number of packets arrived out of sequence from source to destination.
PktOutSeqDSes Number of packets arrived out of sequence from destination to source.
PktLateAs Number of packets arrived after the timeout.
MinSuccPktLoss Minimum number of packets that were dropped successively.
MaxSuccPktLoss Maximum number of packets that were dropped successively.
PacketSkippeds Number of packets skipped per operation as the router was unable to send the packet out.
Table 6-21 Minute ICMP Jitter Report (continued)
Field Description
6-53Reports Management with Cisco Prime LAN Management Solution 4.2
OL-25942-01

Chapter 6 Performance Reports Generating IPSLA Detailed Reports and Graphs
• Source-Destination Jitter
• Destination-Source Jitter
• Round-Trip Latency
• Errors
See Table 6-22 for more information on the graphs.
Table 6-22 Minute ICMP Jitter Graphs
Table/Graph Name Description
Collector Information
Collector Name Displays the name of the Collector
Source Name Displays the source name.
Target Name Displays the target name.
Operation Displays the operation type.
Report Period Start Date Displays the start date of the report.
End Date Displays the end date of the report.
Granularity Displays the granularity specified while creating the report job.
Source-Destination Jitter
Figure 6-12 displays a sample graph
You can view the source to destination jitter details for:
• Positive Minimum
• Positive Average
• Positive Maximum
• Negative Minimum
• Negative Average
• Negative Maximum
These values are represented in milli seconds (msecs).
X-axis Represents the time period of the report.
The time period refers to the start and end time of the report, specified while creating the report job.
Y-axis Represents the positive and negative jitter values from source to destination.
It displays the jitter values for positive minimum, positive average, positive maximum, negative minimum, negative average, and negative maximum.
6-54Reports Management with Cisco Prime LAN Management Solution 4.2
OL-25942-01

Chapter 6 Performance Reports Generating IPSLA Detailed Reports and Graphs
Destination-Source Jitter
Figure 6-13 displays a sample graph
You can view the destination to source jitter details for:
• Positive Minimum
• Positive Average
• Positive Maximum
• Negative Minimum
• Negative Average
• Negative Maximum
These values are represented in milli seconds (msecs).
X-axis Represents the time period of the report.
The time period refers to the start and end time of the report, specified while creating the report job.
Y-axis Represents the positive and negative jitter values from destination to source.
It displays the jitter values for positive minimum, positive average, positive maximum, negative minimum, negative average, and negative maximum.
Round-Trip Latency
Figure 6-14 displays a sample graph
You can view the round-trip time details for:
• Minimum
• Maximum
• Average
These values are represented in milli seconds (msecs).
X-axis Represents the time period of the report.
The time period refers to the start and end time of the report, specified while creating the report job.
Y-axis Represents the latency.
It displays the values for minimum, maximum, and average latency.
One way Latency You can view the one-way latency time values for:
• Minimum
• Maximum
• Average
These values are represented in milli seconds (msecs).
X-axis Represents the time period of the report.
The time period refers to the start and end time of the report, specified while creating the report job.
Y-axis Represents the latency.
It displays the values for minimum, maximum, and average latency.
Table 6-22 Minute ICMP Jitter Graphs (continued)
Table/Graph Name Description
6-55Reports Management with Cisco Prime LAN Management Solution 4.2
OL-25942-01

Chapter 6 Performance Reports Generating IPSLA Detailed Reports and Graphs
Figure 6-12 displays a sample Minute Source-Destination ICMP Jitter Graph
Figure 6-12 Source-Destination ICMP Jitter (Minute)
Figure 6-13 displays a sample Minute Destination-Source ICMP Jitter Graph
Errors
Figure 6-15 displays a sample graph
You can view the error occurrences for:
• Packet Loss
• Packet Out Sequence Both
• Packet OutSequence Source-Destination
• Packet Out Sequence Destination-Source
• Packet Late As
• Packet Skipped
• Minimum Successive Packet Loss
• Maximum Successive Packet Loss
X-axis Represents the time period of the report.
The time period refers to the start and end time of the report, specified while creating the report job.
Y-axis Represents the error occurrences.
It displays the error occurrence values for Packet Loss, PacketOutSeqBoth, PktOutSeqDes, PktOutSeqDSes, PktLateAs, PktSkippeds, MinSuccPktLoss, and MaxSuccPktLoss.
Table 6-22 Minute ICMP Jitter Graphs (continued)
Table/Graph Name Description
6-56Reports Management with Cisco Prime LAN Management Solution 4.2
OL-25942-01

Chapter 6 Performance Reports Generating IPSLA Detailed Reports and Graphs
Figure 6-13 Destination-Source ICMP Jitter (Minute)
Figure 6-14 displays a sample Minute ICMP Jitter Round-Trip Time Graph
Figure 6-14 ICMP Jitter Round-Trip Time (Minute)
6-57Reports Management with Cisco Prime LAN Management Solution 4.2
OL-25942-01

Chapter 6 Performance Reports Generating IPSLA Detailed Reports and Graphs
Figure 6-15 displays a sample Minute ICMP Jitter Errors Graph
Figure 6-15 ICMP Jitter Errors (Minute)
Note There may be instances where the different parameters of a collector may overlap each other. So to view a particular graph curve, you can click on the legends available. This allows you to view only a particular graph corresponding to that selected legend.
Historical ICMP Jitter Report
This report provides information on:
• Round Trip Latency
• Positive SD Jitter
• Negative SD Jitter
• Positive DS Jitter
• Negative DS Jitter
• Completion Summary
• End-to-End Errors
• Packet Loss/Errors.
You can also view the Historical ICMP Jitter Report in graphical format by clicking the Graph link on ICMP Jitter Report page.
6-58Reports Management with Cisco Prime LAN Management Solution 4.2
OL-25942-01

Chapter 6 Performance Reports Generating IPSLA Detailed Reports and Graphs
See Table 6-23 for more information on the report.
Table 6-23 Historical ICMP Jitter Report
Field Description
Summary
Total Number of Collectors
Number of collectors selected to generate the report.
Collectors with Report Data
Number of collectors with statistical data in the database for the specified period.
Collectors without Report Data
Lists the collectors without any statistical data in the database for the specified period.
Report Details
Start Time Displays the time when the statistics were collected and stored in database.
Round Trip Latency Measures the round-trip time taken to perform an ICMP Jitter operation.
Min (ms) Minimum round-trip time for an ICMP Jitter operation.
This value is represented in milli seconds (msecs).
Avg (ms) Average round-trip time.
See Table 6-54 for more information on the formula.
This value is represented in milli seconds (msecs).
Max (ms) Maximum round-trip time for an ICMP Jitter operation.
This value is represented in milli seconds (msecs).
Std Dev Standard deviation of the latency.
See Table 6-54 for more information on the formula.
One Way Latency Min (ms) Minimum one way time taken to perform an ICMP Jitter operation.
This value is represented in milli seconds (msecs).
Avg (ms) Average one way time.
See Table 6-54 for more information on the formula.
This value is represented in milli seconds (msecs).
Max (ms) Maximum one way time taken to perform an ICMP Jitter operation.
This value is represented in milli seconds (msecs).
Std Dev Standard deviation of the one-way time.
See Table 6-54 for more information on the formula.
6-59Reports Management with Cisco Prime LAN Management Solution 4.2
OL-25942-01

Chapter 6 Performance Reports Generating IPSLA Detailed Reports and Graphs
Positive Source - Dest Jitter
Min (ms) Minimum positive jitter at the destination.
This value is represented in milli seconds (msecs).
Avg (ms) Average positive jitter at the destination.
See Table 6-54 for more information on the formula.
This value is represented in milli seconds (msecs).
Max (ms) Maximum positive jitter at the destination.
This value is represented in milli seconds (msecs).
Std Dev Standard deviation of the positive jitter from source to destination.
See Table 6-54 for more information on the formula.
Negative Source - Dest Jitter
Min (ms) Minimum negative jitter at the destination.
This value is represented in milli seconds (msecs).
Avg (ms) Average negative jitter at the destination.
See Table 6-54 for more information on the formula.
This value is represented in milli seconds (msecs).
Max (ms) Maximum negative jitter at the destination.
This value is represented in milli seconds (msecs).
Std Dev Standard deviation of the negative jitter from source to destination.
See Table 6-54 for more information on the formula.
Positive Dest - Source Jitter
Min (ms) Minimum positive jitter at the source.
This value is represented in milli seconds (msecs).
Avg (ms) Average positive jitter at the source.
See Table 6-54 for more information on the formula.
This value is represented in milli seconds (msecs).
Max (ms) Maximum positive jitter at the source.
This value is represented in milli seconds (msecs).
Std Dev Standard deviation of the positive jitter from destination to source.
See Table 6-54 for more information on the formula.
Table 6-23 Historical ICMP Jitter Report (continued)
Field Description
6-60Reports Management with Cisco Prime LAN Management Solution 4.2
OL-25942-01

Chapter 6 Performance Reports Generating IPSLA Detailed Reports and Graphs
Historical ICMP Jitter Graphs
To view the Historical ICMP Jitter Graphs, click the Graph link on the ICMP Jitter Report page. The following graphs appear.
• Source-Destination Jitter
• Destination-Source Jitter
• Round-Trip Latency
• Errors
Negative Dest - Source Jitter
Min (ms) Minimum negative jitter at the source.
This value is represented in milli seconds (msecs).
Avg (ms) Average negative jitter at the source.
See Table 6-54 for more information on the formula.
This value is represented in milli seconds (msecs).
Max (ms) Maximum negative jitter at the source.
This value is represented in milli seconds (msecs).
Std Dev Standard deviation of the negative jitter from destination to source.
See Table 6-54 for more information on the formula.
Completion Summary Tries Number of RTT operations initiated.
See Table 6-54 for more information on the formula.
Over Threshold% Number of jitter operations that violate threshold.
See Table 6-54 for more information on the formula.
Error% See Table 6-54 for information on the Error% formula.
Completions% Displays the completions percentage.
End-to-End Errors Errors Number of times an ICMP jitter operation could not initiate because of an internal error.
Busies Number of times an ICMP jitter operation could not initiate because of an earlier incomplete ICMP jitter operation.
Packet Loss/Errors Packet Loss Number of packets lost.
PktOutSeqBoth Number of packets arrived out of sequence in both source-to-destination and destination-to-source directions.
PktOutSeqSDes Number of packets arrived out of sequence from source to destination.
PktOutSeqDSes Number of packets arrived out of sequence from destination to source.
PktLateAs Number of packets arrived after timeout.
MinSuccPktLoss Minimum number of packets that are dropped successively.
MaxSuccPktLoss Maximum number of packets that are dropped successively.
Packet Error% See Table 6-54 for more information on the Packet Error% formula.
PacketSkippeds Number of packets skipped per operation as the router could not send the packet out.
Table 6-23 Historical ICMP Jitter Report (continued)
Field Description
6-61Reports Management with Cisco Prime LAN Management Solution 4.2
OL-25942-01

Chapter 6 Performance Reports Generating IPSLA Detailed Reports and Graphs
• Completion Summary
See Table 6-24 for more information on the graphs.
Table 6-24 Historical ICMP Jitter Graphs
Table/Graph Name Description
Collector Information
Collector Name Displays the name of the Collector
Source Name Displays the source name.
Target Name Displays the target name.
Operation Displays the operation type.
Report Period Start Date Displays the start date of the report.
End Date Displays the end date of the report.
Granularity Displays the granularity specified while creating the report job.
Source-Destination Jitter
You can view the source to destination jitter details for:
• Positive Maximum
• Positive Average Maximum
• Positive Average
• Positive Average Minimum
• Negative Maximum
• Negative Average Maximum
• Negative Average
• Negative Average Minimum
These values are represented in milli seconds (msecs).
X-axis Represents the time period of the report.
The time period refers to the start and end time of the report, specified while creating the report job.
Y-axis Represents the positive and negative jitter values from source to destination.
It displays jitter values for positive minimum, positive average, positive maximum, negative minimum, negative average, and negative maximum.
6-62Reports Management with Cisco Prime LAN Management Solution 4.2
OL-25942-01

Chapter 6 Performance Reports Generating IPSLA Detailed Reports and Graphs
Destination-Source Jitter
You can view the destination to source jitter details for:
• Positive Maximum
• Positive Average Maximum
• Positive Average
• Positive Average Minimum
• Negative Maximum
• Negative Average Maximum
• Negative Average
• Negative Average Minimum
These values are represented in milli seconds (msecs).
X-axis Represents the time period of the report.
The time period refers to the start and end time of the report, specified while creating the report job.
Y-axis Represents the positive and negative jitter values from destination to source.
It displays jitter values for positive minimum, positive average, positive maximum, negative minimum, negative average, and negative maximum.
One way Latency You can view the one-way latency time values for:
• Minimum
• Maximum
• Average
These values are represented in milli seconds (msecs).
Round-Trip Latency You can view the round-trip time details for:
• Average Maximum
• Average
• Average Minimum
• Minimum Latency
• Maximum Latency
This value is represented in milli seconds (msecs).
X-axis Represents the time period of the report.
The time period refers to the start and end time of the report, specified while creating the report job.
Y-axis Represents the latency.
It displays the values for minimum, maximum, and average latency.
Table 6-24 Historical ICMP Jitter Graphs (continued)
Table/Graph Name Description
6-63Reports Management with Cisco Prime LAN Management Solution 4.2
OL-25942-01

Chapter 6 Performance Reports Generating IPSLA Detailed Reports and Graphs
Errors You can view the error occurrences for:
• Total Busies
• Total Internal Errors
• Packet Loss
• Total Packets Out Sequence Both
• Total Packets Out Sequence Errors Source-Destination
• Total Packets Out Sequence Errors Destination-Source
• Total Packets Late
• Total Minimum Successive Packet Loss
• Total Maximum Successive Packet Loss
X-axis Represents the time period of the report.
The time period refers to the start and end time of the report, specified while creating the report job.
Y-axis Represents the error occurrences.
It displays the error occurrence values for Busies, Internal Errors, Packet Loss, PacketOutSeqBoth, PktOutSeqSDes, PktOutSeqDSes, PktLateAs, PktSkippeds, MinSuccPktLoss, and MaxSuccPktLoss.
Completion Summary
You can view the completion summary for:
• Total Attempts
• Total Completions
• Total Over Threshold
• Total Errors
Table 6-24 Historical ICMP Jitter Graphs (continued)
Table/Graph Name Description
6-64Reports Management with Cisco Prime LAN Management Solution 4.2
OL-25942-01

Chapter 6 Performance Reports Generating IPSLA Detailed Reports and Graphs
Figure 6-16 displays a sample Historical Source-Destination ICMP Jitter Graph
Figure 6-16 Source-Destination ICMP Jitter (Historical)
6-65Reports Management with Cisco Prime LAN Management Solution 4.2
OL-25942-01

Chapter 6 Performance Reports Generating IPSLA Detailed Reports and Graphs
Figure 6-17 displays a sample Historical Destination-Source ICMP Jitter Graph
Figure 6-17 Destination-Source ICMP Jitter (Historical)
6-66Reports Management with Cisco Prime LAN Management Solution 4.2
OL-25942-01

Chapter 6 Performance Reports Generating IPSLA Detailed Reports and Graphs
Figure 6-18 displays a sample Historical ICMP Jitter Round-Trip Latency Graph
Figure 6-18 ICMP Jitter Round-Trip Latency (Historical)
6-67Reports Management with Cisco Prime LAN Management Solution 4.2
OL-25942-01

Chapter 6 Performance Reports Generating IPSLA Detailed Reports and Graphs
Figure 6-19 displays a sample Historical ICMP Jitter Errors Graph
Figure 6-19 ICMP Jitter Errors (Historical)
Figure 6-20 displays a sample Historical ICMP Jitter Completion Summary Graph
Figure 6-20 ICMP Jitter Completion Summary (Historical)
Note There may be instances where the different parameters of a collector may overlap each other. So to view a particular graph curve, you can click on the legends available. This allows you to view only a particular graph corresponding to that selected legend.
6-68Reports Management with Cisco Prime LAN Management Solution 4.2
OL-25942-01

Chapter 6 Performance Reports Generating IPSLA Detailed Reports and Graphs
Latency (Round-Trip Time) Reports and GraphsThis report displays the time taken for a packet to arrive from the source to target and back. You can view the latency data gathered by LMS from its collectors. While the time taken for an IP packet to reach the target from the source is called One Way latency, the time taken to return to the source through the target is called Round Trip Time (RTT).
This report provides latency information for all operations such as Echo, PathEcho, UDP Echo, TCP Connect, DHCP, DNS, DLSw, FTP, VoIP Gatekeeper Registration Delay, and VoIP Call Setup Post Dial Delay.
You can generate Latency reports and graphs for the granularity period such as minute, hourly, daily, weekly, and monthly.
You can generate the following Latency reports and graphs:
• Minute Latency Report
• Minute Latency Graph
• Historical Latency Report
• Historical Latency Graphs
Minute Latency Report
This report provides information on the round-trip time taken by a packet at a specified time. You can also view this report in graphical format by clicking the Graph link on the Minute Latency Report page.
See Table 6-25 for more information on the report.
Minute Latency Graph
To view the Minute Latency Report in the graphical format, click the Graph link on the Minute Latency Report page. The Latency Summary graph appears.
Figure 6-21 displays a sample Latency Summary graph.
Table 6-25 Minute Latency Report
Field Description
Summary
Total Number of Collectors Number of collectors selected to generate the report.
Collectors with Report Data Number of collectors with statistical data in the database for the specified period.
Collectors without Report Data Lists the collectors without any statistical data in the database for the specified period.
Start Time Displays the time when the statistics were collected and stored in the database.
RTT Measures the round-trip time taken to perform a Latency operation.
This value is represented in milli seconds (msecs).
6-69Reports Management with Cisco Prime LAN Management Solution 4.2
OL-25942-01

Chapter 6 Performance Reports Generating IPSLA Detailed Reports and Graphs
Figure 6-21 Latency Summary
See Table 6-26 for more information on the graph.
Historical Latency Report
The Historical Latency report provides information on the RTT, Errors, Standard Deviation, Tries, Completions, and Over Threshold. You can also view the Historical Latency Report in graphical format by clicking the Graph link on the Latency Report page.
See Table 6-27 for more information on the report.
Table 6-26 Latency Graph
Table/Graph Description
Collector Information Collector Name Displays the Collector name.
Source Name Displays the source name.
Target Name Displays the target name.
Operation Displays the operation type.
Report Period Start Date Displays the start date of the report.
End Date Displays the end date of the report.
Granularity Displays the granularity specified while creating the report job.
Latency Summary You can view the availability of the target device for various time period.
X-axis Represents the time period of the report.
The time period refers to the start and end time of the report, specified while creating the report job.
Y-axis Represents the Latency. It displays the values for minimum, maximum, and average latency.
See Table 6-54 for more information on the formula.
Table 6-27 Historical Latency Report
Field Description
Summary
Total Number of Collectors Number of collectors selected to generate the report.
Collectors with Report Data Number of collectors with statistical data in the database for the specified period.
Collectors without Report Data Lists the collectors without any statistical data in the database for the specified period.
6-70Reports Management with Cisco Prime LAN Management Solution 4.2
OL-25942-01

Chapter 6 Performance Reports Generating IPSLA Detailed Reports and Graphs
Historical Latency Graphs
To view the Historical Latency Report in the graphical format, click the Graph link on the Latency Report page. You can view the following graphs:
• Latency Summary
• Error Summary
Report Details
Start Time Displays the time when the statistics were collected and stored in the database.
RTT Min RTT Minimum round-trip time taken to perform a RTT operation.
This value is represented in milli seconds (msecs).
Max RTT Maximum round-trip time taken to perform a RTT operation.
This value is represented in milli seconds (msecs).
Avg RTT Average round-trip time.
This value is represented in milli seconds (msecs).
See Table 6-54 for more information on the formula.
Standard Deviation See Table 6-54 for more information on the formula.
Tries Number of RTT operations initiated.
To know how to calculate the Tries, see Table 6-54.
Completions Number of RTT operations completed without an error or timeout.
See Table 6-54 for more information on the formula.
Over Threshold% Number of RTT operations that violate threshold.
See Table 6-54 for more information on the formula.
Errors Error% See Table 6-54 for more information on the formula.
Disconnects Number of times the target was disconnected from the source.
Timeouts Number of RTT operations timed out.
Busies Number of times an RTT operation was not initiated because of earlier incomplete RTT operations.
NoConnections Number of times an RTT operation was not initiated. This occurs if the target connection is not established.
Drops Number of times an RTT operation was not initiated because:
• The necessary internal resource were not available
Or
• Some unrecognized operations were completed
SeqErrors RTT completions received with an unexpected sequence identifier.
VerifyErrors RTT completions data received that do not match with the expected data.
Table 6-27 Historical Latency Report
Field Description
6-71Reports Management with Cisco Prime LAN Management Solution 4.2
OL-25942-01

Chapter 6 Performance Reports Generating IPSLA Detailed Reports and Graphs
• Completion Summary
See Table 6-28 for more information on the graphs.
Table 6-28 Historical Latency Graphs
Table/Graph Name Description
Collector Information Collector Name Displays the name of the Collector
Source Name Displays the source name.
Target Name Displays the target name.
Operation Displays the operation type.
Report Period Start Date Displays the start date of the report.
End Date Displays the end date of the report.
Granularity Displays the granularity specified while creating the report job.
Latency Summary You can view the round-trip time details for:
• Average Maximum
• Average
• Average Minimum
• Minimum Latency
• Maximum Latency
These values are represented in milli seconds (msecs).
X-axis Represents the time period of the report.
The time period refers to the start and end time of the report, specified while creating the report job.
This value is represented in milli seconds (msecs).
Y-axis Represents the latency.
It displays the values for minimum, maximum, and average latency.
This value is represented in milli seconds (msecs).
6-72Reports Management with Cisco Prime LAN Management Solution 4.2
OL-25942-01

Chapter 6 Performance Reports Generating IPSLA Detailed Reports and Graphs
Figure 6-22 displays a sample Historical Latency Summary graph.
Error Summary You can view the error occurrences for:
• Total Timeouts
• Total Busies
• Total Sequence Errors
• Total Drops
• Total Verify Errors
• Total Disconnects
• Total No Connections
X-axis Represents the time period of the report.
The time period refers to the start and end time of the report, specified while creating the report job.
Y-axis Represents the error occurrences.
It displays the error occurrence values for timeout, busies, sequence, drops, verify, no connections, and disconnects.
Completion Summary You can view the completion summary for the following:
• Total Attempts
• Total Completions
• Total Over Threshold
• Total Errors
X-axis Represents the time period of the report.
The time period refers to the start and end time of the report, specified while creating the report job.
Y-axis Represents the percentage of completion.
It displays the values for completion, over threshold, and errors.
Table 6-28 Historical Latency Graphs (continued)
Table/Graph Name Description
6-73Reports Management with Cisco Prime LAN Management Solution 4.2
OL-25942-01

Chapter 6 Performance Reports Generating IPSLA Detailed Reports and Graphs
Figure 6-22 Historical Latency Summary
Figure 6-23 displays a sample Historical Latency Error Summary Graph
Figure 6-23 Historical Latency Error Summary
6-74Reports Management with Cisco Prime LAN Management Solution 4.2
OL-25942-01

Chapter 6 Performance Reports Generating IPSLA Detailed Reports and Graphs
Figure 6-24 displays a sample Historical Latency Completion Summary Graph
Figure 6-24 Historical Latency Completion Summary
Path Echo Reports and GraphsYou can view the Path Echo data gathered from Path Echo collectors. It displays hop-by-hop performance between the source router and target device on the network by discovering the path.
You can generate Path Echo reports and graphs for the granularity period such as by the hourly, daily, weekly, and monthly.
You can generate the following PathEcho reports and graphs:
• Historical Path Echo Report
• Historical Path Echo Graphs
Historical Path Echo Report
This report provides information on Path ID, Hop details, RTT, Standard Deviation, Tries, Completions, Over Threshold%, Error%, and Errors. You can also view this report in graphical format by clicking the Graph link on the Path Echo Report page.
See Table 6-29 for more information on the report.
6-75Reports Management with Cisco Prime LAN Management Solution 4.2
OL-25942-01

Chapter 6 Performance Reports Generating IPSLA Detailed Reports and Graphs
Table 6-29 Historical PathEcho Report
Field Description
Summary
Total Number of Collectors Number of collectors selected to generate the report.
Collectors with Report Data Number of collectors with statistical data in the database for the specified period.
Collectors without Report Data Lists the collectors without any statistical data in the database for the specified period.
Report Details
Start Time Displays the time when the statistics were collected and stored in the database.
PathID Number that identifies the path.
HopID Number that identifies the hop of the path.
Hop Address Address of the intermediate devices from source to target.
RTT Measures the round-trip time taken for a Path Echo operation.
This value is represented in milli seconds (msecs).
Min RTT Minimum round-trip time for a Path Echo operation.
This value is represented in milli seconds (msecs).
Max RTT Maximum round-trip time for a Path Echo operation.
This value is represented in milli seconds (msecs).
Avg RTT Average round-trip time.
This value is represented in milli seconds (msecs).
See Table 6-54 for more information on the formula.
Standard Deviation Standard deviation for latency.
See Table 6-54 for more information on the formula.
Tries Number of RTT operations initiated.
See Table 6-54 for more information on the formula.
Completions Number of RTT operations completed without an error or timeout.
Over Threshold% Number of Path Echo operations that violate threshold.
See Table 6-54 for more information on the formula.
Error% Displays the error percentage for the total error packets.
See Table 6-54 for more information on the formula.
6-76Reports Management with Cisco Prime LAN Management Solution 4.2
OL-25942-01

Chapter 6 Performance Reports Generating IPSLA Detailed Reports and Graphs
Historical Path Echo Graphs
To view the Historical Path Echo Report in graphical format, click the Graph link on the Path Echo Report page.
Figure 6-25 displays the design of the Path Echo Report.
Figure 6-25 Design of Path Echo Report
• Path List provides the Latency Summary of the paths.
See Table 6-30 for more information.
Errors Disconnects Number of hops along the path were disconnected.
Timeouts Number of RTT operations timed out.
Busies Number of times an RTT operation was not initiated because of earlier incomplete RTT operations.
NoConnections Number of times an RTT operation was not initiated. This occurs if the target connection is not established.
Drops Number of times an RTT operation was not initiated because:
The necessary internal resource were not available
Or
Some unrecognized operations were completed.
SeqErrors Number of RTT operation completions received with an unexpected sequence identifier.
VerifyErrors Number of RTT operation completions data received that do not match with the expected data.
Table 6-29 Historical PathEcho Report (continued)
Field Description
Path List
Hop 1
Path 1
Hop 2
Hop 1
Path 2
Hop 2
1820
46
6-77Reports Management with Cisco Prime LAN Management Solution 4.2
OL-25942-01

Chapter 6 Performance Reports Generating IPSLA Detailed Reports and Graphs
• Path 1 and Path 2 provide the Latency Summary of the hops in that path.
See Table 6-31 for more information.
• Hop 1 and Hop 2 provide Latency Summary, Error Summary, and Completion Summary specific to that hop.
See Table 6-32 for more information.
Table 6-30 Path List Graph
Graph Name Description
Latency Summary You can view the following latency summary details of the paths:
• Average Minimum
• Average Maximum
• Average
These values are represented in milli seconds (msecs).
X-axis Represents the time period of the report.
The time period refers to the start and end time of the report, specified while creating the report job.
Y-axis Represents the latency.
It displays the values for minimum, maximum, and average latency.
Table 6-31 Specific Path Graphs
Graph Name Description
Latency Summary You can view the following latency summary details of the hops in a specific path:
• Average Minimum
• Average Maximum
• Average
This value is represented in milli seconds (msecs).
Represents the time period of the report.
The time period refers to the start and end time of the report, specified while creating the report job.
Represents the latency.
It displays the values for minimum, maximum, and average latency.
Table 6-32 Specific Hop Graphs
Table/Graph Name Description
Collector Information Collector Name Displays the name of the Collector
Source Name Displays the source name.
Target Name Displays the target name.
Operation Displays the operation type.
6-78Reports Management with Cisco Prime LAN Management Solution 4.2
OL-25942-01

Chapter 6 Performance Reports Generating IPSLA Detailed Reports and Graphs
Report Period Start Date Displays the start date of the report.
End Date Displays the end date of the report.
Granularity Displays the granularity specified while creating the report job.
Latency Summary You can view the values for the following round-trip time:
• Average Maximum
• Average
• Average Minimum
• Minimum Latency
• Maximum Latency
This value is represented in milli seconds (msecs).
X-axis Represents the time period of the report.
The time period refers to the start and end time of the report, specified while creating the report job.
Y-axis Represents the latency.
It displays the values for minimum, maximum, and average latency.
Error Summary You can view the values for the following error occurrences:
• Total Timeouts
• Total Busies
• Total Sequence Errors
• Total Drops
• Total Verify Errors
X-axis Represents the time period of the report.
The time period refers to the start and end time of the report, specified while creating the report job.
Y-axis Represents the error occurrences.
It displays the error occurrence values for timeouts, busies, sequence, drops, verify, no connections, and disconnects.
Completion Summary You can view the completion summary for the following:
• Total Attempts
• Total Completions
• Total Over Threshold
• Total Errors
X-axis Represents the time period of the report.
The time period refers to the start and end time of the report, specified while creating the report job.
Y-axis Represents the completion percentage.
It displays the values of completion, over threshold, and errors.
Table 6-32 Specific Hop Graphs (continued)
Table/Graph Name Description
6-79Reports Management with Cisco Prime LAN Management Solution 4.2
OL-25942-01

Chapter 6 Performance Reports Generating IPSLA Detailed Reports and Graphs
RTP Reports and GraphsYou can view the RTP data gathered from RTP collectors. You can generate RTP reports and graphs for the granularity period such as by the minute, hourly, daily, weekly, and monthly.
You can generate the following RTP reports and graphs:
• Minute RTP Report
• Minute RTP Graphs
• Historical RTP Report
• Historical RTP Graphs
Minute RTP Report
This report provides information on RTT, SD and DS Interarrival Jitter, RFactor, MOSCQ, and Total Packets, and Errors. You can also view the RTP Minute Reports in graphical format by clicking the Graph link on the Minute RTP Report page.
See Table 6-33 for more information on the report.
Table 6-33 Minute RTP Report
Field Description
Summary
Total Number of Collectors
Number of collectors selected to generate the report.
Collectors with Report Data
Number of collectors with statistical data in the database for the specified period.
Collectors without Report Data
Lists the collectors without any statistical data in the database for the specified period.
Report Details
Start Time Displays the time when the statistics were collected and stored in database.
Round Trip Latency Measures the round-trip time taken to perform an RTP operation.
This value is represented in milli seconds (msecs).
One way Latency Min (ms) Minimum one way time taken to perform an RTP operation.
This value is represented in milli seconds (msecs).
Avg (ms) Average one way time.
See Table 6-54 for more information on the formula.
This value is represented in milli seconds (msecs).
Max (ms) Maximum one way time taken to perform an RTP Jitter operation.
This value is represented in milli seconds (msecs).
6-80Reports Management with Cisco Prime LAN Management Solution 4.2
OL-25942-01

Chapter 6 Performance Reports Generating IPSLA Detailed Reports and Graphs
Minute RTP Graphs
To view the RTP Minute Graphs, click the Graph link on the Minute RTP Report page. The following graphs appear:
• Round-Trip Latency
• One Way Latency
• Source to Destination
• Destination to Source
• Errors
See Table 6-34 for more information on the graphs.
Source to Destination Interarrival Jitter Interarrival jitter at the destination.
This value is represented in milli seconds (msecs).
RFactor Estimated R-Factor value at the destination.
MOSCQ Estimated destination mean opinion score for conversational quality.
TotalPackets Displays the total number of packets at the destination.
Destination to Source Interarrival Jitter Interarrival jitter at the source.
This value is represented in milli seconds (msecs).
RFactor Estimated R-Factor value at the source.
MOSCQ Estimated source mean opinion score for conversational quality.
TotalPackets Displays the total number of packets at the source.
MOSLQDS Estimated source mean opinion score for listening quality.
Errors PacketLossSD Average of the packets lost from source to destination.
PacketLossDS Average of the packets lost from destination to source.
FrameLossDS Average of the codec frame loss events at the source.
MIA Average of the packets lost whose lost direction is unknown.
OutofSequenceDS Average of the out-of-sequence packets at the source.
EarlyPacketsDS Average of the early packets at the source.
LatePacketsDS Average of the late packets at the source.
Table 6-33 Minute RTP Report (continued)
Field Description
6-81Reports Management with Cisco Prime LAN Management Solution 4.2
OL-25942-01

Chapter 6 Performance Reports Generating IPSLA Detailed Reports and Graphs
Table 6-34 Minute RTP Graphs
Table/Graph Name Description
Collector Information
Collector Name Displays the name of the collector.
Source Name Displays the source name.
Target Name Displays the target name.
Operation Displays the operation type.
Report Period Start Date Displays the start date of the report.
End Date Displays the end date of the report.
Granularity Displays the granularity specified while creating the report job.
Round-Trip Latency
Figure 6-26 displays a sample graph
You can view the round-trip time details.
X-axis Represents the time period of the report.
The time period refers to the start and end time of the report, specified while creating the report job.
Y-axis Represents the round-trip time.
One Way Latency You can view the one way latency time details.
• Minimum
• Maximum
• Average
These values are represented in milli seconds (msecs).
X-axis Represents the time period of the report.
The time period refers to the start and end time of the report, specified while creating the report job.
Y-axis Represents the latency.
It displays the values for minimum, maximum, and average latency.
Source to Destination
Figure 6-27 displays a sample graph
You can view the source to destination values for:
• IA Jitter
• RFactor
• MOSCQ
X-axis Represents the time period of the report.
The time period refers to the start and end time of the report, specified while creating the report job.
Y-axis Represents the Jitter, RFactor, and MOSCQ.
It displays values for IA jitter, R Factor, and MOSCQ from source to destination.
6-82Reports Management with Cisco Prime LAN Management Solution 4.2
OL-25942-01

Chapter 6 Performance Reports Generating IPSLA Detailed Reports and Graphs
Destination to Source
Figure 6-28 displays a sample graph
You can view the destination to source values for:
• IA Jitter
• RFactor
• MOSCQ
X-axis Represents the time period of the report.
The time period refers to the start and end time of the report, specified while creating the report job.
Y-axis Represents the Jitter, RFactor, and MOSCQ.
It displays values for IA jitter, R Factor, and MOSCQ from destination to source.
Errors
Figure 6-29 displays a sample graph
You can view the values for the following error occurrences:
• Packet Loss SD
• Packet Loss DS
• Frame Loss DS
• MIA
• Out of Sequence DS
• Early Packet DS
• Late Packet DS
X-axis Represents the time period of the report.
The time period refers to the start and end time of the report, specified while creating the report job.
Y-axis Represents the error occurrences.
It displays the values of packet loss SD, packet loss DS, frame loss DS, MIA, out of sequence DS, early packets DS, late packets DS.
Table 6-34 Minute RTP Graphs (continued)
Table/Graph Name Description
6-83Reports Management with Cisco Prime LAN Management Solution 4.2
OL-25942-01

Chapter 6 Performance Reports Generating IPSLA Detailed Reports and Graphs
Figure 6-26 displays a sample Minute RTP Round-Trip Latency Graph
Figure 6-26 RTP Round-Trip Latency (Minute)
6-84Reports Management with Cisco Prime LAN Management Solution 4.2
OL-25942-01

Chapter 6 Performance Reports Generating IPSLA Detailed Reports and Graphs
Figure 6-27 displays a sample Minute RTP Source to Destination Graph
Figure 6-27 RTP Source to Destination (Minute)
6-85Reports Management with Cisco Prime LAN Management Solution 4.2
OL-25942-01
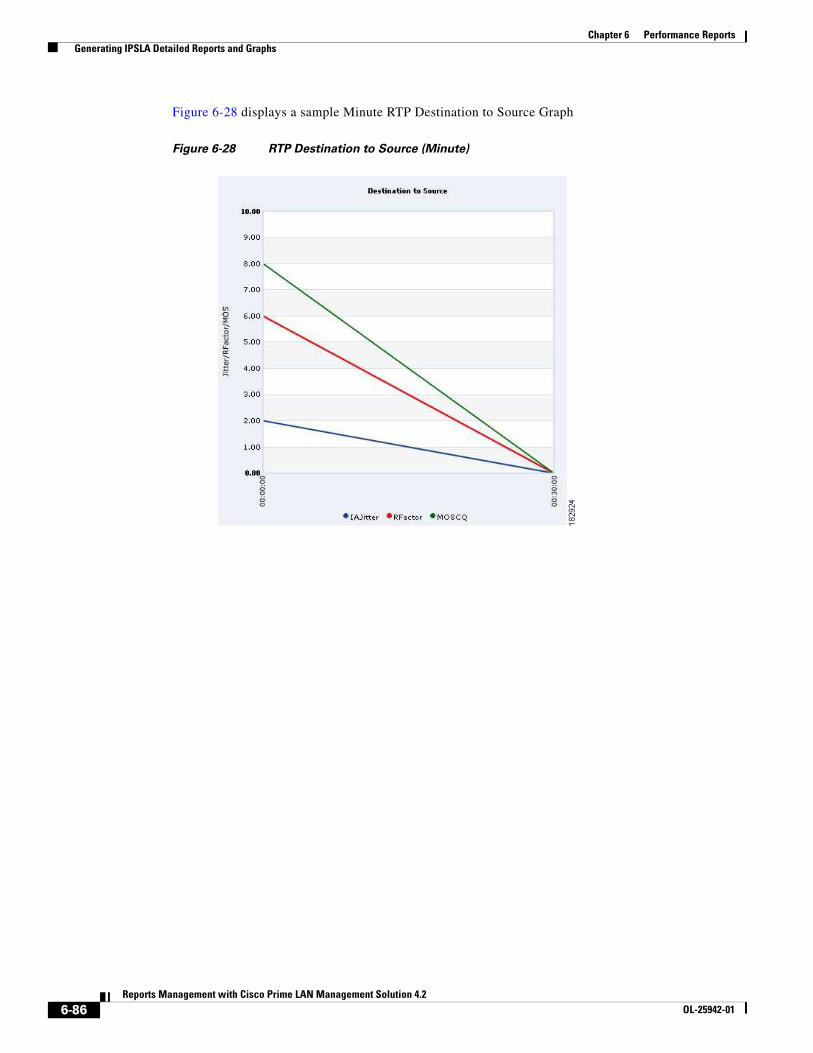
Chapter 6 Performance Reports Generating IPSLA Detailed Reports and Graphs
Figure 6-28 displays a sample Minute RTP Destination to Source Graph
Figure 6-28 RTP Destination to Source (Minute)
6-86Reports Management with Cisco Prime LAN Management Solution 4.2
OL-25942-01

Chapter 6 Performance Reports Generating IPSLA Detailed Reports and Graphs
Figure 6-29 displays a sample Minute RTP Errors Graph
Figure 6-29 RTP Errors (Minute)
Note There may be instances where the different parameters of a collector may overlap each other. So to view a particular graph curve, you can click on the legends available. This allows you to view only a particular graph corresponding to that selected legend.
Historical RTP Report
This report provides information on Round Trip Latency, Interarrival SD Jitter, Interarrival DS Jitter, MOS-CQ SD Jitter, MOS-CQ DS Jitter, and Packet Loss/Errors. You can also view the Historical RTP Reports in graphical format by clicking the Graph link on the RTP Report page.
See Table 6-35 for more information on the report.
Table 6-35 Historical RTP Report
Field Description
Summary
Total Number of Collectors Number of collectors selected to generate the report.
Collectors with Report Data
Number of collectors with statistical data in the database for the specified period.
Collectors without Report Data
Lists the collectors without any statistical data in the database for the specified period.
6-87Reports Management with Cisco Prime LAN Management Solution 4.2
OL-25942-01

Chapter 6 Performance Reports Generating IPSLA Detailed Reports and Graphs
Report Details
Start Time Displays the time when the statistics were collected and stored in the database.
Round Trip Latency Min (ms) Minimum round-trip time for an RTP operation.
This value is represented in milli seconds (msecs).
Avg (ms) Average round-trip time taken to perform an RTP operation.
This value is represented in milli seconds (msecs).
Max (ms) Maximum round-trip time taken to perform an RTP operation.
This value is represented in milli seconds (msecs).
One way Latency Min (ms) Minimum one way time taken to perform an RTP operation.
This value is represented in milli seconds (msecs).
Avg (ms) Average one way time.
See Table 6-54 for more information on the formula.
This value is represented in milli seconds (msecs).
Max (ms) Maximum one way time taken to perform an RTP Jitter operation.
This value is represented in milli seconds (msecs).
Interarrival Source-Destination Jitter
Min (ms) Minimum interarrival jitter at the destination.
This value is represented in milli seconds (msecs).
Avg (ms) Average interarrival jitter at the destination.
This value is represented in milli seconds (msecs).
Max (ms) Maximum interarrival jitter at the destination.
This value is represented in milli seconds (msecs).
Interarrival Destination-Source Jitter
Min (ms) Minimum interarrival jitter at the source.
This value is represented in milli seconds (msecs).
Avg (ms) Average interarrival jitter at the source.
This value is represented in milli seconds (msecs).
Max (ms) Maximum interarrival jitter at the source.
This value is represented in milli seconds (msecs).
RFactor Source-Destination
Min Minimum RFactor at the destination.
Avg Average RFactor at the destination.
Max Maximum RFactor at the destination.
RFactor Destination-Source
Min Minimum RFactor at the source.
Avg Average RFactor at the source.
Max Maximum RFactor at the source.
Table 6-35 Historical RTP Report (continued)
Field Description
6-88Reports Management with Cisco Prime LAN Management Solution 4.2
OL-25942-01

Chapter 6 Performance Reports Generating IPSLA Detailed Reports and Graphs
Historical RTP Graphs
To view the Historical RTP Graphs, click the Graph link on the RTP Report page. The following graphs appear:
• Round-Trip Latency
• Interarrival Source to Destination Jitter
• Interarrival Destination to Source Jitter
• RFactor Source- Destination Jitter
MOS-CQ Source-Destination
Min Minimum estimated destination mean opinion score for conversational quality.
Avg Average estimated mean opinion score for conversational quality at destination.
Max Maximum estimated mean opinion score for conversational quality at destination.
MOS-CQ Destination-Source
Min Minimum estimated mean opinion score for conversational quality at source.
Avg Average estimated mean opinion score for conversational quality at source.
Max Maximum estimated mean opinion score for conversational quality at source.
MOSLQDS Min Minimum estimated source mean opinion score for listening quality.
Avg Average estimated source mean opinion score for listening quality.
Max Maximum estimated source mean opinion score for listening quality.
Total Packets Destination-Source
Min Minimum total packets at the source.
Avg Average total packets at the source.
Max Maximum total packets at the source.
Total Packets Source-Destination
Min Minimum total packets at the destination.
Avg Average total packets at the destination.
Max Maximum total packets at the destination.
Packet Loss/Errors Packet Loss SD Average number of packets lost from source to destination.
Packet Loss DS Average number of packets lost from destination to source.
Early Packet DS Average number of early packets from destination to source.
FrameLoss DS Average number of codec frame loss events at source.
MIA Average of the packets lost whose direction is unknown.
Seq DS Average number of out of sequence packets at source.
Late DS Average number of late packets at source.
Table 6-35 Historical RTP Report (continued)
Field Description
6-89Reports Management with Cisco Prime LAN Management Solution 4.2
OL-25942-01

Chapter 6 Performance Reports Generating IPSLA Detailed Reports and Graphs
• RFactor Destination-Source Jitter
• MOS-CQ Source-Destination Jitter
• MOS-CQ Destination-Source Jitter
• Total Packets Destination-Source
• Total Packets Source-Destination
• Packet Loss Errors
See Table 6-36 for more information on the graphs.
Table 6-36 Historical RTP Graphs
Table/Graph Name Description
Collector Information Collector Name Displays the name of the Collector
Source Name Displays the source name.
Target Name Displays the target name.
Operation Displays the operation type.
Report Period Start Date Displays the start date of the report.
End Date Displays the end date of the report.
Granularity Displays the granularity specified while creating the report job.
Round-Trip Latency
Figure 6-30 displays a sample graph
You can view the values for the following round-trip time:
• Average Maximum
• Average
• Average Minimum
• Minimum Latency
• Maximum Latency
These values are represented in milli seconds (msecs).
X-axis Represents the time period of the report.
The time period refers to the start and end time of the report, specified while creating the report job.
Y-axis Represents the latency.
It displays the values of minimum, maximum, and average latency.
One Way Latency You can view the one way latency time details.
• Minimum
• Maximum
• Average
These values are represented in milli seconds (msecs).
X-axis Represents the time period of the report.
The time period refers to the start and end time of the report, specified while creating the report job.
Y-axis Represents the latency.
It displays the values for minimum, maximum, and average latency.
6-90Reports Management with Cisco Prime LAN Management Solution 4.2
OL-25942-01

Chapter 6 Performance Reports Generating IPSLA Detailed Reports and Graphs
Interarrival Source to Destination Jitter
Figure 6-31 displays a sample graph
You can view the interarrival jitter values from source to destination for:
• Average Maximum
• Average
• Average Minimum
• Minimum
• Maximum
These values are represented in milli seconds (msecs).
X-axis Represents the time period of the report.
The time period refers to the start and end time of the report, specified while creating the report job.
Y-axis Represents the interarrival jitter from source to destination.
It displays the interarrival jitter values for minimum, maximum, and average.
Interarrival Destination to Source Jitter
Figure 6-32 displays a sample graph
You can view the interarrival jitter values from destination to source for:
• Average Maximum
• Average
• Average Minimum
• Minimum
• Maximum
These values are represented in milli seconds (msecs).
X-axis Represents the time period of the report.
The time period refers to the start and end time of the report, specified while creating the report job.
Y-axis Represents the interarrival jitter from destination to source.
It displays the interarrival jitter values for minimum, maximum, and average.
Table 6-36 Historical RTP Graphs (continued)
Table/Graph Name Description
6-91Reports Management with Cisco Prime LAN Management Solution 4.2
OL-25942-01

Chapter 6 Performance Reports Generating IPSLA Detailed Reports and Graphs
RFactor Source- Destination Jitter
Figure 6-33 displays a sample graph
You can view the RFactor values from source to destination for:
• Average Maximum
• Average
• Average Minimum
• Minimum
• Maximum
This values are represented in milli seconds (msecs).
X-axis Represents the time period of the report.
The time period refers to the start and end time of the report, specified while creating the report job.
Y-axis Represents the RFactor from source to destination.
It displays the RFactor values for minimum, maximum, and average.
RFactor Destination-Source Jitter
Figure 6-34 displays a sample graph
You can view the RFactor values from destination to source for:
• Average Maximum
• Average
• Average Minimum
• Minimum
• Maximum
These values are represented in milli seconds (msecs).
X-axis Represents the time period of the report.
The time period refers to the start and end time of the report, specified while creating the report job.
Y-axis Represents the RFactor from destination to source.
It displays the RFactor values for minimum, maximum, and average.
Table 6-36 Historical RTP Graphs (continued)
Table/Graph Name Description
6-92Reports Management with Cisco Prime LAN Management Solution 4.2
OL-25942-01

Chapter 6 Performance Reports Generating IPSLA Detailed Reports and Graphs
MOS-CQ Source-Destination Jitter
Figure 6-35 displays a sample graph
You can view the MOS-CQ values from source to destination for:
• Average Maximum
• Average
• Average Minimum
• Minimum
• Maximum
These values are represented in milli seconds (msecs).
X-axis Represents the time period of the report.
The time period refers to the start and end time of the report, specified while creating the report job.
Y-axis Represents the MOS from source to destination.
It displays the MOS values for minimum, maximum, and average from source to destination.
MOS-CQ Destination-Source Jitter
Figure 6-36 displays a sample graph
You can view the MOS-CQ values from destination to source for:
• Average Maximum
• Average
• Average Minimum
• Minimum Latency
• Maximum Latency
These values are represented in milli seconds (msecs).
X-axis Represents the time period of the report.
The time period refers to the start and end time of the report, specified while creating the report job.
Y-axis Represents the MOS destination to source.
It displays the MOS values for minimum, maximum, and average from destination to source.
Table 6-36 Historical RTP Graphs (continued)
Table/Graph Name Description
6-93Reports Management with Cisco Prime LAN Management Solution 4.2
OL-25942-01

Chapter 6 Performance Reports Generating IPSLA Detailed Reports and Graphs
Total Packets Destination-Source
Figure 6-37 displays a sample graph
You can view the values for the following total number of packets at the source:
• Average Maximum
• Average
• Average Minimum
• Minimum
• Maximum
These values are represented in milli seconds (msecs).
X-axis Represents the time period of the report.
The time period refers to the start and end time of the report, specified while creating the report job.
Y-axis Represents the total number of packets at the source.
It displays the values for minimum, maximum, and average total packets at the source.
Total Packets Source-Destination
Figure 6-38 displays a sample graph
You can view the values for the following total number of packets at the destination:
• Average Maximum
• Average
• Average Minimum
• Minimum Latency
• Maximum Latency
These values are represented in milli seconds (msecs).
X-axis Represents the time period of the report.
The time period refers to the start and end time of the report, specified while creating the report job.
Y-axis Represents the total number of packets at the destination.
It displays the values for minimum, maximum, and average total packets at the destination.
Table 6-36 Historical RTP Graphs (continued)
Table/Graph Name Description
6-94Reports Management with Cisco Prime LAN Management Solution 4.2
OL-25942-01

Chapter 6 Performance Reports Generating IPSLA Detailed Reports and Graphs
Packet Loss Errors
Figure 6-39 displays a sample graph
You can view the values for the following error occurrences:
• Packet Loss SD
• Packet Loss DS
• Early Packet DS
• Frame Loss DS
• MIA
• Seq DS
• Late DS
X-axis Represents the time period of the report.
The time period refers to the start and end time of the report, specified while creating the report job.
Y-axis Represents the error occurrences.
It displays the error occurrence values for packet loss SD, packet loss DS, early packet DS, frame loss DS, MIA, sequence DS, and late DS.
Table 6-36 Historical RTP Graphs (continued)
Table/Graph Name Description
6-95Reports Management with Cisco Prime LAN Management Solution 4.2
OL-25942-01

Chapter 6 Performance Reports Generating IPSLA Detailed Reports and Graphs
Figure 6-30 displays a sample Historical RTP Round-Trip Latency Graph
Figure 6-30 RTP Round-Trip Latency (Historical)
6-96Reports Management with Cisco Prime LAN Management Solution 4.2
OL-25942-01

Chapter 6 Performance Reports Generating IPSLA Detailed Reports and Graphs
Figure 6-31 displays a sample Historical RTP Inter-arrival Source-Destination Jitter Graph
Figure 6-31 RTP Interarrival Source-Destination Jitter (Historical)
6-97Reports Management with Cisco Prime LAN Management Solution 4.2
OL-25942-01

Chapter 6 Performance Reports Generating IPSLA Detailed Reports and Graphs
Figure 6-32 displays a sample Historical RTP Inter-arrival Destination-Source Jitter Graph
Figure 6-32 RTP Interarrival Destination-Source Jitter (Historical)
6-98Reports Management with Cisco Prime LAN Management Solution 4.2
OL-25942-01

Chapter 6 Performance Reports Generating IPSLA Detailed Reports and Graphs
Figure 6-33 displays a sample Historical RTP RFactor Source-Destination Graph
Figure 6-33 RTP RFactor Source-Destination (Historical)
6-99Reports Management with Cisco Prime LAN Management Solution 4.2
OL-25942-01

Chapter 6 Performance Reports Generating IPSLA Detailed Reports and Graphs
Figure 6-34 displays a sample Historical RTP RFactor Destination-Source Graph
Figure 6-34 RTP RFactor Destination-Source (Historical)
6-100Reports Management with Cisco Prime LAN Management Solution 4.2
OL-25942-01

Chapter 6 Performance Reports Generating IPSLA Detailed Reports and Graphs
Figure 6-35 displays a sample Historical RTP MOS-CQ Source-Destination Graph
Figure 6-35 RTP MOS-CQ Source-Destination (Historical)
6-101Reports Management with Cisco Prime LAN Management Solution 4.2
OL-25942-01

Chapter 6 Performance Reports Generating IPSLA Detailed Reports and Graphs
Figure 6-36 displays a sample Historical RTP MOS-CQ Destination-Source Graph
Figure 6-36 RTP MOS-CQ Destination-Source (Historical)
6-102Reports Management with Cisco Prime LAN Management Solution 4.2
OL-25942-01

Chapter 6 Performance Reports Generating IPSLA Detailed Reports and Graphs
Figure 6-37 displays a sample Historical RTP Total Packets Destination-Source Graph
Figure 6-37 RTP Total Packets Destination-Source (Historical)
6-103Reports Management with Cisco Prime LAN Management Solution 4.2
OL-25942-01

Chapter 6 Performance Reports Generating IPSLA Detailed Reports and Graphs
Figure 6-38 displays a sample Historical RTP Total Packets Source-Destination Graph
Figure 6-38 RTP Total Packets Source-Destination (Historical)
6-104Reports Management with Cisco Prime LAN Management Solution 4.2
OL-25942-01

Chapter 6 Performance Reports Generating IPSLA Detailed Reports and Graphs
Figure 6-39 displays a sample Historical RTP Packet Loss Errors Graph
Figure 6-39 RTP Packet Loss Errors (Historical)
Note There may be instances where the different parameters of a collector may overlap each other. So to view a particular graph curve, you can click on the legends available. This allows you to view only a particular graph corresponding to that selected legend.
6-105Reports Management with Cisco Prime LAN Management Solution 4.2
OL-25942-01

Chapter 6 Performance Reports Generating IPSLA Detailed Reports and Graphs
UDP Jitter Reports and GraphsYou can view the jitter data gathered from UDP Jitter collectors. It displays the delay between any two data packets or the interpacket delay between the source and the target device. The target device must have Responder capability.
You can generate UDP Jitter reports and graphs for the granularity period such as by the minute hourly, daily, weekly, and monthly.
You can generate the following UDP Jitter reports and graphs:
• Minute UDP Jitter Report
• Minute UDP Jitter Graphs
• Historical UDP Jitter Report
• Historical UDP Jitter Graphs
Minute UDP Jitter Report
This report provides information on jitter, latency, packet loss, errors, MOS, and ICPIF.
You can also view this report in graphical format by clicking the Graph link on the Minute Jitter Report page.
See Table 6-37 for more information on the report.
Table 6-37 Minute UDP Jitter Report
Field Description
Summary
Total Number of Collectors Number of collectors selected to generate the report.
Collectors with Report Data Number of collectors with statistical data in the database for the specified period.
Collectors without Report Data Lists the collectors without any statistical data in the database for the specified period.
Report Details
Start Time Displays the time when the statistics were collected and stored in the database.
6-106Reports Management with Cisco Prime LAN Management Solution 4.2
OL-25942-01

Chapter 6 Performance Reports Generating IPSLA Detailed Reports and Graphs
Round Trip Latency Min (ms) Minimum round-trip time taken to perform an UDP Jitter operation.
This value is represented in milli seconds (msecs).
Avg (ms) Average round-trip time.
See Table 6-54 for more information on the formula.
This value is represented in milli seconds (msecs).
Max (ms) Maximum round-trip time taken to perform an UDP Jitter operation.
This value is represented in milli seconds (msecs).
Std Dev Standard deviation of the round-trip time.
See Table 6-54 for more information on the formula.
One Way Latency Min (ms) Minimum one way time taken to perform an UDP Jitter operation.
This value is represented in milli seconds (msecs).
Avg (ms) Average one way time.
See Table 6-54 for more information on the formula.
This value is represented in milli seconds (msecs).
Max (ms) Maximum one way time taken to perform an UDP Jitter operation.
This value is represented in milli seconds (msecs).
Std Dev Standard deviation of the one-way time.
See Table 6-54 for more information on the formula.
Table 6-37 Minute UDP Jitter Report (continued)
Field Description
6-107Reports Management with Cisco Prime LAN Management Solution 4.2
OL-25942-01

Chapter 6 Performance Reports Generating IPSLA Detailed Reports and Graphs
Positive Source - Dest Jitter Min (ms) Minimum positive jitter at the destination.
This value is represented in milli seconds (msecs).
Avg (ms) Average positive jitter at the destination.
See Table 6-54 for more information on the formula.
This value is represented in milli seconds (msecs).
Max (ms) Maximum positive jitter at the destination.
This value is represented in milli seconds (msecs).
Std Dev Standard deviation of the positive jitter from source to destination.
See Table 6-54 for more information on the formula.
Negative Source - Dest Jitter Min (ms) Minimum negative jitter at the destination.
This value is represented in milli seconds (msecs).
Avg (ms) Average negative jitter at the destination.
See Table 6-54 for more information on the formula.
This value is represented in milli seconds (msecs).
Max (ms) Maximum negative jitter at the destination.
This value is represented in milli seconds (msecs).
Std Dev Standard deviation of the negative jitter from source to destination.
See Table 6-54 for more information on the formula.
Table 6-37 Minute UDP Jitter Report (continued)
Field Description
6-108Reports Management with Cisco Prime LAN Management Solution 4.2
OL-25942-01

Chapter 6 Performance Reports Generating IPSLA Detailed Reports and Graphs
Positive Dest - Source Jitter Min (ms) Minimum positive jitter at the source.
This value is represented in milli seconds (msecs).
Avg (ms) Average of minimum and maximum positive jitter at the source.
See Table 6-54 for more information on the formula.
This value is represented in milli seconds (msecs).
Max (ms) Maximum positive jitter at the source.
This value is represented in milli seconds (msecs).
Std Dev Standard deviation of the positive jitter from destination to source.
See Table 6-54 for more information on the formula.
Negative Dest - Source Jitter Min (ms) Minimum negative jitter at the source.
This value is represented in milli seconds (msecs).
Avg (ms) Average negative jitter at the source.
See Table 6-54 for more information on the formula.
This value is represented in milli seconds (msecs).
Max (ms) Maximum negative jitter at the source.
This value is represented in milli seconds (msecs).
Std Dev Standard deviation of the negative jitter from destination to source.
See Table 6-54 for more information on the formula.
Completion Summary Tries Sum of all errors and numCompletions.
Over Threshold% Number of jitter operations that violate threshold.
Error% Displays the error percentage.
See Table 6-54 for more information on the formula.
Completions% Displays the completions percentage.
Table 6-37 Minute UDP Jitter Report (continued)
Field Description
6-109Reports Management with Cisco Prime LAN Management Solution 4.2
OL-25942-01

Chapter 6 Performance Reports Generating IPSLA Detailed Reports and Graphs
Minute UDP Jitter Graphs
To view the Minute UDP Jitter Graphs, click the Graph link on the Minute Jitter Report page. The following graphs appear:
• Source-Destination Jitter
• Destination-Source Jitter
• Round-Trip Latency
• One way Latency
• Errors
• MOS
• ICPIF
Note MOS and ICPIF graphs are not generated if the codec type is 0.
See Table 6-38 for more information on the graphs.
Packet Loss/Errors Loss SD Number of packets lost when sent from source to destination.
Loss DS Number of packets lost when sent from destination to source.
Seq Number of packets arrived out of sequence.
MIA Number of the packets lost whose direction is unknown.
Late Number of packets arrived after the timeout.
MOS Mean Opinion Score—a numerical measure of the voice quality in the network.
ICPIF Calculated Planning Impairment Factor—ICPIF numbers represent predefined combinations of loss and delay.
Table 6-37 Minute UDP Jitter Report (continued)
Field Description
Table 6-38 Minute UDP Jitter Graphs
Table/Graph Name Description
Collector Information Collector Name Displays the name of the Collector
Source Name Displays the source name.
Target Name Displays the target name.
Operation Displays the operation type.
Report Period Start Date Displays the start date of the report.
End Date Displays the end date of the report.
Granularity Displays the granularity specified while creating the report job.
6-110Reports Management with Cisco Prime LAN Management Solution 4.2
OL-25942-01

Chapter 6 Performance Reports Generating IPSLA Detailed Reports and Graphs
Source-Destination Jitter
Refer to Figure 6-40 for a sample graph
You can view the following positive and negative jitter values from source to destination:
• Pos Min
• Pos Avg
• Pos Max
• Neg Min
• Neg Avg
• Neg Max
These values are represented in milli seconds (msecs).
X-axis Represents the time period of the report.
The time period refers to the start and end time of the report, specified while creating the report job.
Y-axis Represents the jitter from source to destination.
It displays the source to destination jitter values for positive minimum, positive average, positive maximum, negative minimum, negative average, and negative maximum.
Destination-Source Jitter
Refer to Figure 6-41 for a sample graph
You can view the following positive and negative jitter values from destination to source:
• Pos Min
• Pos Avg
• Pos Max
• Neg Min
• Neg Avg
• Neg Max
These values are represented in milli seconds (msecs).
X-axis Represents the time period of the report.
The time period refers to the start and end time of the report, specified while creating the report job.
Y-axis Represents the jitter from destination to source.
It displays the destination to source jitter values for positive minimum, positive average, positive maximum, negative minimum, negative average, and negative maximum.
Table 6-38 Minute UDP Jitter Graphs (continued)
Table/Graph Name Description
6-111Reports Management with Cisco Prime LAN Management Solution 4.2
OL-25942-01

Chapter 6 Performance Reports Generating IPSLA Detailed Reports and Graphs
Round-Trip Latency
Refer to Figure 6-42 for a sample graph
You can view the round-trip time values for:
• Minimum
• Maximum
• Average
These values are represented in milli seconds (msecs).
X-axis Represents the time period of the report.
The time period refers to the start and end time of the report, specified while creating the report job.
Y-axis Represents the latency.
It displays the values for minimum, maximum, and average latency.
One way Latency You can view the one-way latency time values for:
• Minimum
• Maximum
• Average
These values are represented in milli seconds (msecs).
X-axis Represents the time period of the report.
The time period refers to the start and end time of the report, specified while creating the report job.
Y-axis Represents the latency.
It displays the values for minimum, maximum, and average latency.
Errors
Refer to Figure 6-43 for a sample graph
You can view the error occurrences for the following:
• SD Packet Loss
• DS Packet Loss
• Sequence
• MIA
• Late
X-axis Represents the time period of the report.
The time period refers to the start and end time of the report, specified while creating the report job.
Y-axis Represents the error occurrences.
It displays the values for source-to-destination packet loss, destination-to-source packet loss, sequence, MIA, and late.
MOS
Refer to Figure 6-44 for a sample graph
Mean opinion score (MOS) measures for the voice quality in the network.
X-axis Represents the time period of the report.
The time period refers to the start and end time of the report, specified while creating the report job.
Y-axis Represents the MOS.
Table 6-38 Minute UDP Jitter Graphs (continued)
Table/Graph Name Description
6-112Reports Management with Cisco Prime LAN Management Solution 4.2
OL-25942-01

Chapter 6 Performance Reports Generating IPSLA Detailed Reports and Graphs
Figure 6-40 displays a sample Source to Destination Minute UDP Jitter Report.
Figure 6-40 Source to Destination UDP Jitter (Minute)
ICPIF
Refer to Figure 6-45 for a sample graph
Calculated planning impairment factor loss/delay busy out threshold. The ICPIF numbers represent predefined combinations of loss and delay.
X-axis Represents the time period of the report.
The time period refers to the start and end time of the report, specified while creating the report job.
Y-axis Represents the ICPIF.
Table 6-38 Minute UDP Jitter Graphs (continued)
Table/Graph Name Description
6-113Reports Management with Cisco Prime LAN Management Solution 4.2
OL-25942-01

Chapter 6 Performance Reports Generating IPSLA Detailed Reports and Graphs
Figure 6-41 displays a sample Destination to Source Minute UDP Jitter Graph.
Figure 6-41 Destination to Source UDP Jitter (Minute)
Figure 6-42 displays a Round Trip Latency Minute UDP Jitter Graph.
Figure 6-42 Round-Trip Latency - UDP Jitter (Minute)
6-114Reports Management with Cisco Prime LAN Management Solution 4.2
OL-25942-01

Chapter 6 Performance Reports Generating IPSLA Detailed Reports and Graphs
Figure 6-43 displays a sample Errors - Minute UDP Jitter Graph.
Figure 6-43 Errors - UDP Jitter (Minute)
6-115Reports Management with Cisco Prime LAN Management Solution 4.2
OL-25942-01

Chapter 6 Performance Reports Generating IPSLA Detailed Reports and Graphs
Figure 6-44 displays a sample MOS - Minute UDP Jitter Graph.
Figure 6-44 MOS - UDP Jitter (Minute)
6-116Reports Management with Cisco Prime LAN Management Solution 4.2
OL-25942-01

Chapter 6 Performance Reports Generating IPSLA Detailed Reports and Graphs
Figure 6-45 displays a sample ICPIF Minute UDP Jitter Graph
Figure 6-45 ICPIF - UDP Jitter (Minute)
Note There may be instances where the different parameters of a collector may overlap each other. So to view a particular graph curve, you can click on the legends available. This allows you to view only a particular graph corresponding to that selected legend.
Historical UDP Jitter Report
This report provides information on Round-Trip Latency, Positive SD Jitter, Negative SD Jitter, Positive DS Jitter, Negative DS Jitter, Completion Summary, End-to-End Errors, and Packet Loss and Errors. You can also view this report in graphical format by clicking the Graph link on the Jitter Report page.
See Table 6-39 for more information on the report.
Table 6-39 Historical UDP Jitter Report
Field Description
Summary
Total Number of Collectors Number of collectors selected for generating the report.
Collectors with Report Data Number of collectors with statistical data in the database for the specified period.
Collectors without Report Data
Lists the collectors without any statistical data in the database for the specified period.
Report Details
Start Time Displays the time when the statistics were collected and stored in the database.
6-117Reports Management with Cisco Prime LAN Management Solution 4.2
OL-25942-01
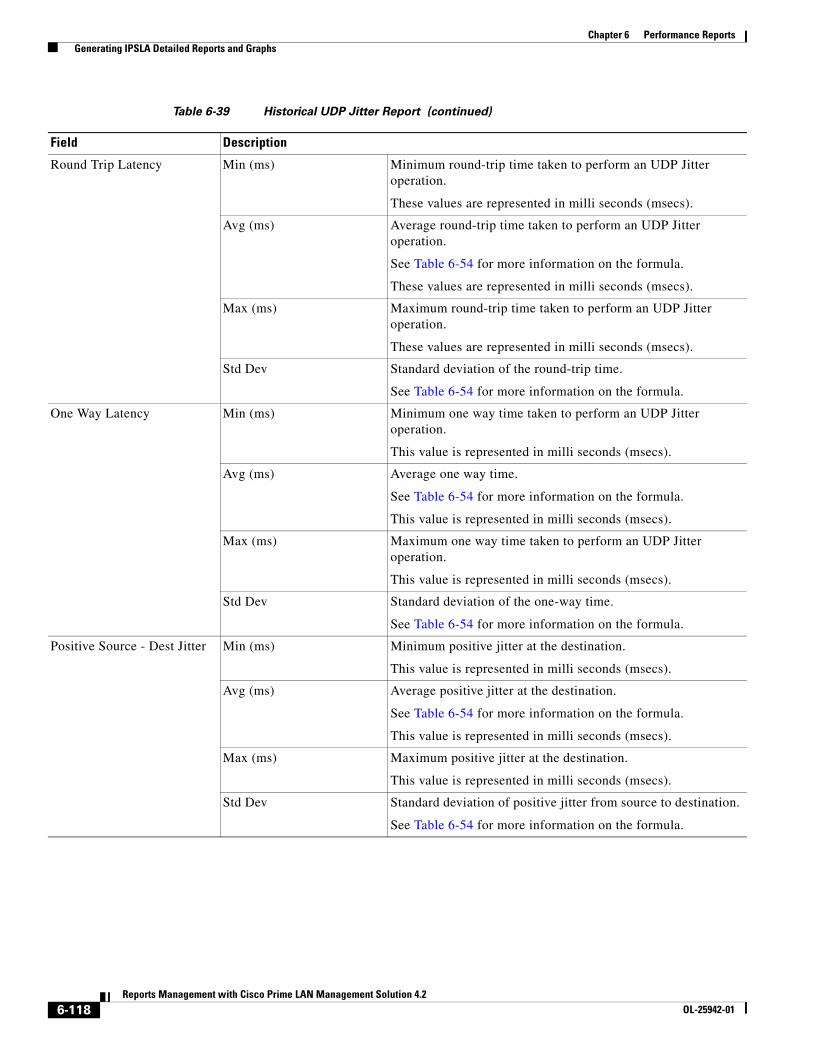
Chapter 6 Performance Reports Generating IPSLA Detailed Reports and Graphs
Round Trip Latency Min (ms) Minimum round-trip time taken to perform an UDP Jitter operation.
These values are represented in milli seconds (msecs).
Avg (ms) Average round-trip time taken to perform an UDP Jitter operation.
See Table 6-54 for more information on the formula.
These values are represented in milli seconds (msecs).
Max (ms) Maximum round-trip time taken to perform an UDP Jitter operation.
These values are represented in milli seconds (msecs).
Std Dev Standard deviation of the round-trip time.
See Table 6-54 for more information on the formula.
One Way Latency Min (ms) Minimum one way time taken to perform an UDP Jitter operation.
This value is represented in milli seconds (msecs).
Avg (ms) Average one way time.
See Table 6-54 for more information on the formula.
This value is represented in milli seconds (msecs).
Max (ms) Maximum one way time taken to perform an UDP Jitter operation.
This value is represented in milli seconds (msecs).
Std Dev Standard deviation of the one-way time.
See Table 6-54 for more information on the formula.
Positive Source - Dest Jitter Min (ms) Minimum positive jitter at the destination.
This value is represented in milli seconds (msecs).
Avg (ms) Average positive jitter at the destination.
See Table 6-54 for more information on the formula.
This value is represented in milli seconds (msecs).
Max (ms) Maximum positive jitter at the destination.
This value is represented in milli seconds (msecs).
Std Dev Standard deviation of positive jitter from source to destination.
See Table 6-54 for more information on the formula.
Table 6-39 Historical UDP Jitter Report (continued)
Field Description
6-118Reports Management with Cisco Prime LAN Management Solution 4.2
OL-25942-01

Chapter 6 Performance Reports Generating IPSLA Detailed Reports and Graphs
Negative Source - Dest Jitter Min (ms) Minimum negative jitter at the destination.
This value is represented in milli seconds (msecs).
Avg (ms) Average negative jitter at the destination.
See Table 6-54 for more information on the formula.
This value is represented in milli seconds (msecs).
Max (ms) Maximum negative jitter at the destination.
This value is represented in milli seconds (msecs).
Std Dev Standard deviation of negative jitter from source to destination.
See Table 6-54 for more information on the formula.
Positive Dest - Source Jitter Min (ms) Minimum positive jitter at the source.
This value is represented in milli seconds (msecs).
Avg (ms) Average positive jitter at the source.
See Table 6-54 for more information on the formula.
This value is represented in milli seconds (msecs).
Max (ms) Maximum positive jitter at the source.
This value is represented in milli seconds (msecs).
Std Dev Standard deviation of positive jitter at the source.
See Table 6-54 for more information on the formula.
Negative Dest - Source Jitter Min (ms) Minimum negative jitter at the source.
This value is represented in milli seconds (msecs).
Avg (ms) Average negative jitter at the source.
See Table 6-54 for more information on the formula.
This value is represented in milli seconds (msecs).
Max (ms) Maximum negative jitter at the source.
This value is represented in milli seconds (msecs).
Std Dev Standard deviation of negative jitter at the source.
See Table 6-54 for information on the formula.
Completion Summary Tries Sum of all errors and numCompletions.
Over Threshold% Number of jitter operations that violate threshold.
Error% Displays the error percentage.
See Table 6-54 for more information on the formula.
Completions% Displays the completions percentage.
End-to-End Errors Internal Errors Errors caused by internal problems in the router.
Busies Number of times an RTT operation was not initiated because of prior incomplete RTT operations.
Table 6-39 Historical UDP Jitter Report (continued)
Field Description
6-119Reports Management with Cisco Prime LAN Management Solution 4.2
OL-25942-01

Chapter 6 Performance Reports Generating IPSLA Detailed Reports and Graphs
Historical UDP Jitter Graphs
To view the Historical UDP Jitter Graphs, click the Graph link on the Jitter Report page. The following graphs appear.
• Source-Destination Jitter
• Destination-Source Jitter
• Round-Trip Latency
• Errors
• MOS
• ICPIF
• Completion Summary
Note MOS and ICPIF graphs are not generated if the codec type is 0.
See Table 6-40 for more information on the graphs.
Packet Loss/Errors Loss SD Number of packets lost when sent from source to destination.
Loss DS Number of packets lost when sent from destination to source.
Seq Number of packets arrived out of sequence.
MIA Number of the packets lost whose direction is unknown.
Late Number of packets arrived after the timeout.
Packet Error% Displays the packet error percentage.
See Table 6-54 for more information on the formula.
MOS MinMOS Minimum of all mean opinion score values.
MaxMOS Maximum of all mean opinion score values.
ICPIF MinICPIF Minimum of all calculated planning impairment factor values.
MaxICPIF Maximum of all calculated planning impairment factor values.
Table 6-39 Historical UDP Jitter Report (continued)
Field Description
Table 6-40 Historical UDP Jitter Graphs
Table/Graph Name Description
Collector Information
Collector Name Displays the name of the Collector
Source Name Displays the source name.
Target Name Displays the target name.
Operation Displays the operation type.
Report Period Start Date Displays the start date of the report.
End Date Displays the end date of the report.
Granularity Displays the granularity specified while creating the report job.
6-120Reports Management with Cisco Prime LAN Management Solution 4.2
OL-25942-01
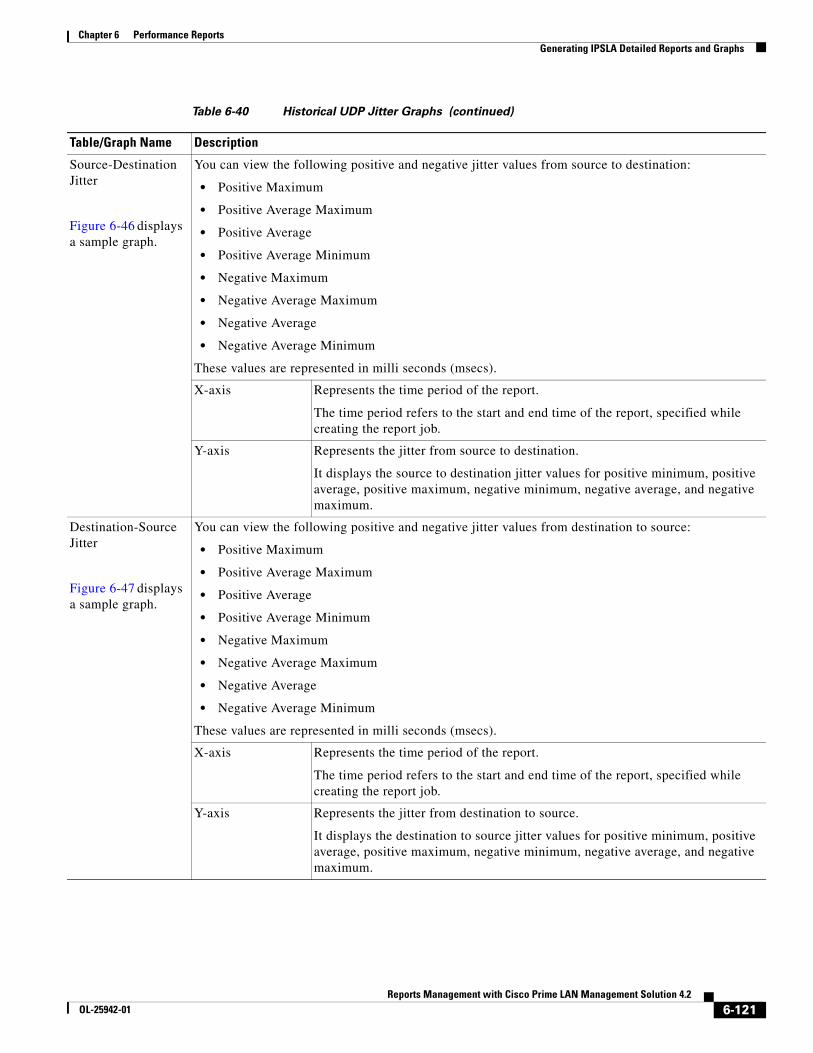
Chapter 6 Performance Reports Generating IPSLA Detailed Reports and Graphs
Source-Destination Jitter
Figure 6-46 displays a sample graph.
You can view the following positive and negative jitter values from source to destination:
• Positive Maximum
• Positive Average Maximum
• Positive Average
• Positive Average Minimum
• Negative Maximum
• Negative Average Maximum
• Negative Average
• Negative Average Minimum
These values are represented in milli seconds (msecs).
X-axis Represents the time period of the report.
The time period refers to the start and end time of the report, specified while creating the report job.
Y-axis Represents the jitter from source to destination.
It displays the source to destination jitter values for positive minimum, positive average, positive maximum, negative minimum, negative average, and negative maximum.
Destination-Source Jitter
Figure 6-47 displays a sample graph.
You can view the following positive and negative jitter values from destination to source:
• Positive Maximum
• Positive Average Maximum
• Positive Average
• Positive Average Minimum
• Negative Maximum
• Negative Average Maximum
• Negative Average
• Negative Average Minimum
These values are represented in milli seconds (msecs).
X-axis Represents the time period of the report.
The time period refers to the start and end time of the report, specified while creating the report job.
Y-axis Represents the jitter from destination to source.
It displays the destination to source jitter values for positive minimum, positive average, positive maximum, negative minimum, negative average, and negative maximum.
Table 6-40 Historical UDP Jitter Graphs (continued)
Table/Graph Name Description
6-121Reports Management with Cisco Prime LAN Management Solution 4.2
OL-25942-01

Chapter 6 Performance Reports Generating IPSLA Detailed Reports and Graphs
Round-Trip Latency
Figure 6-48 displays a sample graph
You can view the round-trip time values for:
• Average Minimum
• Average
• Average Maximum
• Minimum Latency
• Maximum Latency
These values are represented in milli seconds (msecs).
X-axis Represents the time period of the report.
The time period refers to the start and end time of the report, specified while creating the report job.
Y-axis Represents the latency.
It displays the values for minimum, maximum, and average latency.
One way Latency You can view the one-way latency time values for:
• Minimum
• Maximum
• Average
These values are represented in milli seconds (msecs).
Errors
Figure 6-49 displays a sample graph.
You can view the error occurrences for the following:
• Total Busies
• Total Internal Errors
• Total Pkt Loss Src-Dest
• Total Pkt Loss Dest-Src
• Total Sequence Errors
• Total Packets MIA
• Total Packets Late
• Total Packets Errors
X-axis Represents the time period of the report.
The time period refers to the start and end time of the report, specified while creating the report job.
Y-axis Represents the error occurrences.
It displays the error occurrence values for busies, internal errors, SD packet loss, DS packet loss, sequence, MIA, and late.
Table 6-40 Historical UDP Jitter Graphs (continued)
Table/Graph Name Description
6-122Reports Management with Cisco Prime LAN Management Solution 4.2
OL-25942-01

Chapter 6 Performance Reports Generating IPSLA Detailed Reports and Graphs
MOS
Figure 6-50 displays a sample graph.
You can view the MOS values for:
• Average Minimum
• Average Maximum
• Minimum MOS
• Maximum MOS
X-axis Represents the time period of the report.
The time period refers to the start and end time of the report, specified while creating the report job.
Y-axis Represents the MOS.
It displays values for minimum and maximum MOS.
ICPIF
Figure 6-51 displays a sample graph.
You can view the ICPIF values for:
• Average Minimum
• Average Maximum
• Minimum ICPIF
• Maximum ICPIF
X-axis Represents the time period of the report.
The time period refers to the start and end time of the report, specified while creating the report job.
Y-axis Represents ICPIF.
It displays values for minimum and maximum ICPIF.
Completion Summary
Figure 6-52 displays a sample Completion Summary.
You can view the completion summary for:
• Total Attempts
• Total Completions
• Total Over Threshold
• Total Errors
Table 6-40 Historical UDP Jitter Graphs (continued)
Table/Graph Name Description
6-123Reports Management with Cisco Prime LAN Management Solution 4.2
OL-25942-01

Chapter 6 Performance Reports Generating IPSLA Detailed Reports and Graphs
Figure 6-46 displays a sample Historical Source - Destination UDP Jitter Graph.
Figure 6-46 Source-Destination UDP Jitter (Historical)
6-124Reports Management with Cisco Prime LAN Management Solution 4.2
OL-25942-01

Chapter 6 Performance Reports Generating IPSLA Detailed Reports and Graphs
Figure 6-47 displays a sample Historical Destination - Source UDP Jitter Graph
Figure 6-47 Destination-Source UDP Jitter (Historical)
6-125Reports Management with Cisco Prime LAN Management Solution 4.2
OL-25942-01

Chapter 6 Performance Reports Generating IPSLA Detailed Reports and Graphs
Figure 6-48 displays a sample Historical Round-Trip Latency - UDP Jitter Graph.
Figure 6-48 Round-Trip Latency - UDP Jitter (Historical)
6-126Reports Management with Cisco Prime LAN Management Solution 4.2
OL-25942-01

Chapter 6 Performance Reports Generating IPSLA Detailed Reports and Graphs
Figure 6-49 displays a sample Historical Error UDP Jitter Graph
Figure 6-49 Errors - UDP Jitter (Historical)
6-127Reports Management with Cisco Prime LAN Management Solution 4.2
OL-25942-01

Chapter 6 Performance Reports Generating IPSLA Detailed Reports and Graphs
Figure 6-50 displays a sample Historical MOS UDP Jitter Graph
Figure 6-50 MOS - UDP Jitter (Historical)
6-128Reports Management with Cisco Prime LAN Management Solution 4.2
OL-25942-01

Chapter 6 Performance Reports Generating IPSLA Detailed Reports and Graphs
Figure 6-51 displays a sample Historical ICPIF - UDP Jitter Graph
Figure 6-51 ICPIF - UDP Jitter (Historical)
Figure 6-52 displays a sample Completion Summary for Historical UDP Jitter Graph
Figure 6-52 Completion Summary - UDP Jitter (Historical)
Note There may be instances where the different parameters of a collector may overlap each other. So to view a particular graph curve, you can click on the legends available. This allows you to view only a particular graph corresponding to that selected legend.
6-129Reports Management with Cisco Prime LAN Management Solution 4.2
OL-25942-01

Chapter 6 Performance Reports Generating IPSLA Detailed Reports and Graphs
Video Jitter Reports and GraphsYou can view the jitter data gathered from Video Jitter collectors. It displays the delay between two data packets or the interpacket delay between the source and the target device. The target device must have Responder capability.
You can generate Video Jitter reports and graphs for the granularity period such as minute hourly, daily, weekly, and monthly.
You can generate the following Video Jitter reports and graphs:
• Minute Video Jitter Report
• Minute Video Jitter Graphs
• Historical Video Jitter Report
• Hiostorical Video Jitter Graphs
Minute Video Jitter Report
This report provides information on source, latency, packet loss and errors.
You can also view this report in graphical format by clicking the Graph link on the Minute Video Jitter Report page.
See Table 6-41 for more information on the report
Table 6-41 Minute Video Jitter Report
Field Description
Summary
Total Number of Collectors Number of collectors selected to generate the report.
Collectors with Report Data Number of collectors with statistical data in the database for the specified period.
Collectors without Report Data Lists the collectors without any statistical data in the database for the specified period.
Report Details
Start Time Displays the time when the statistics were collected and stored in the database.
6-130Reports Management with Cisco Prime LAN Management Solution 4.2
OL-25942-01

Chapter 6 Performance Reports Generating IPSLA Detailed Reports and Graphs
One Way Latency Min (ms) Minimum one way time taken to perform an Video Jitter operation.
This value is represented in milli seconds (msecs).
Avg (ms) Average one way timetaken to perform an Video Jitter operation.
See Table 6-54 for more information on the formula.
This value is represented in milli seconds (msecs).
Max (ms) Maximum one way time taken to perform an UDP Jitter operation.
This value is represented in milli seconds (msecs).
Std Dev Standard deviation of the one-way time.
See Table 6-54 for more information on the formula.
Positive Source - Destination Min (ms) Minimum positive jitter at the destination.
This value is represented in milli seconds (msecs).
Avg (ms) Average positive jitter at the destination.
See Table 6-54 for more information on the formula.
This value is represented in milli seconds (msecs).
Max (ms) Maximum positive jitter at the destination.
This value is represented in milli seconds (msecs).
Std Dev Standard deviation of the positive jitter from source to destination.
See Table 6-54 for more information on the formula.
Table 6-41 Minute Video Jitter Report (continued)
Field Description
6-131Reports Management with Cisco Prime LAN Management Solution 4.2
OL-25942-01

Chapter 6 Performance Reports Generating IPSLA Detailed Reports and Graphs
Minute Video Jitter Graphs
To view the Minute Video Jitter Graphs, click the Graph link on the Minute Jitter Report page. The following graphs appear:
• Source-Destination Jitter
• One way Latency
• Errors
• Interarrival Source Destination Jitter
See Table 6-42 for more information on the graphs.
Negative Source - Destination Min (ms) Minimum negative jitter at the destination.
This value is represented in milli seconds (msecs).
Avg (ms) Average negative jitter at the destination.
See Table 6-54 for more information on the formula.
This value is represented in milli seconds (msecs).
Max (ms) Maximum negative jitter at the destination.
This value is represented in milli seconds (msecs).
Std Dev Standard deviation of the negative jitter from source to destination.
See Table 6-54 for more information on the formula.
Interarrival To Destination IAJOut(ms) Inter-arrival jitter (RFC 1889) at responder
AvgJitterSD(ms) The average of positive and negative jitter values in source-to-destination direction.
IPDVAvgSDJ(ms) Source to Destination IPDV average jitter according to RFC 5481.
Packet Loss/Errors UnSyncRT The number of RTT operations that have been completed when the sender and responder out of sync with NTP.
NTPState The value indicates whether the sender and the responder are in sync with the Network Time Protocol (NTP)
Loss SD Number of packets lost when sent from destination to source.
Late Number of packets arrived after the timeout.
PktOutSeq The number of packets arrived out of sequence.
Table 6-41 Minute Video Jitter Report (continued)
Field Description
6-132Reports Management with Cisco Prime LAN Management Solution 4.2
OL-25942-01

Chapter 6 Performance Reports Generating IPSLA Detailed Reports and Graphs
Table 6-42 Minute Video Jitter Graphs
Table/Graph Name Description
Collector Information Collector Name Displays the name of the Collector
Source Name Displays the source name.
Target Name Displays the target name.
Operation Displays the operation type.
Profile Name The profile name can be either of the following:
– IPTV — IP television traffic
– IPVSC — IP video surveillance camera traffic
– Telepresence — Cisco TelePresence 1080P traffic
Call Duration Time in Seconds
Collector Name Name of the collector
Report Period Start Date Displays the start date of the report.
End Date Displays the end date of the report.
Granularity Displays the granularity specified while creating the report job.
Source-Destination Jitter You can view the following positive and negative jitter values from source to destination:
• Pos Min
• Pos Avg
• Pos Max
• Neg Min
• Neg Avg
• Neg Max
These values are represented in milli seconds (msecs).
X-axis Represents the time period of the report.
The time period refers to the start and end time of the report, specified while creating the report job.
Y-axis Represents the jitter from source to destination.
It displays the source to destination jitter values for positive minimum, positive average, positive maximum, negative minimum, negative average, and negative maximum.
6-133Reports Management with Cisco Prime LAN Management Solution 4.2
OL-25942-01

Chapter 6 Performance Reports Generating IPSLA Detailed Reports and Graphs
One way Latency You can view the one-way latency time values for:
• Minimum
• Maximum
• Average
These values are represented in milli seconds (msecs).
X-axis Represents the time period of the report.
The time period refers to the start and end time of the report, specified while creating the report job.
Y-axis Represents the latency.
It displays the values for minimum, maximum, and average latency.
Errors You can view the error occurrences for the following:
• UnSyncRT
• NTPState
• Loss
• Late
• Sequence
X-axis Represents the time period of the report.
The time period refers to the start and end time of the report, specified while creating the report job.
Y-axis Represents the error occurrences.
It displays the values for source-to-destination packet loss, destination-to-source packet loss, sequence, MIA, and late.
Interarrival Source Destination Jitter
You can view the interarrival jitter values from destination to source for:
– Average Maximum
– Average
– Average Minimum
– Minimum
– Maximum
X-axis Represents the time period of the report.
The time period refers to the start and end time of the report, specified while creating the report job.
Y-axis Represents the IA Video Jitter
Table 6-42 Minute Video Jitter Graphs (continued)
Table/Graph Name Description
6-134Reports Management with Cisco Prime LAN Management Solution 4.2
OL-25942-01

Chapter 6 Performance Reports Generating IPSLA Detailed Reports and Graphs
Historical Video Jitter Report
This report provides information on source, latency, packet loss and errors.
You can also view this report in graphical format by clicking the Graph link on the Historical Video Jitter Report page.
See Table 6-43 for more information on the report.
Table 6-43 Historical Video Jitter Report
Field Description
Summary
Total Number of Collectors Number of collectors selected to generate the report.
Collectors with Report Data Number of collectors with statistical data in the database for the specified period.
Collectors without Report Data Lists the collectors without any statistical data in the database for the specified period.
Report Details
Start Time Displays the time when the statistics were collected and stored in the database.
One Way Latency Min (ms) Minimum one way time taken to perform an UDP Jitter operation.
This value is represented in milli seconds (msecs).
Avg (ms) Average one way time.
See Table 6-54 for more information on the formula.
This value is represented in milli seconds (msecs).
Max (ms) Maximum one way time taken to perform an UDP Jitter operation.
This value is represented in milli seconds (msecs).
Std Dev Standard deviation of the one-way time.
See Table 6-54 for more information on the formula.
6-135Reports Management with Cisco Prime LAN Management Solution 4.2
OL-25942-01

Chapter 6 Performance Reports Generating IPSLA Detailed Reports and Graphs
Positive Source - Destination Min (ms) Minimum positive jitter at the destination.
This value is represented in milli seconds (msecs).
Avg (ms) Average positive jitter at the destination.
See Table 6-54 for more information on the formula.
This value is represented in milli seconds (msecs).
Max (ms) Maximum positive jitter at the destination.
This value is represented in milli seconds (msecs).
Std Dev Standard deviation of the positive jitter from source to destination.
See Table 6-54 for more information on the formula.
Negative Source - Destination Min (ms) Minimum negative jitter at the destination.
This value is represented in milli seconds (msecs).
Avg (ms) Average negative jitter at the destination.
See Table 6-54 for more information on the formula.
This value is represented in milli seconds (msecs).
Max (ms) Maximum negative jitter at the destination.
This value is represented in milli seconds (msecs).
Std Dev Standard deviation of the negative jitter from source to destination.
See Table 6-54 for more information on the formula.
Interarrival To Destination IAJOut(ms) Inter-arrival jitter (RFC 1889) at responder
AvgJitterSD(ms) The average of positive and negative jitter values in source-to-destination direction.
IPDVAvgSDJ(ms) Source to Destination IPDV average jitter according to RFC 5481.
Table 6-43 Historical Video Jitter Report (continued)
Field Description
6-136Reports Management with Cisco Prime LAN Management Solution 4.2
OL-25942-01

Chapter 6 Performance Reports Generating IPSLA Detailed Reports and Graphs
Hiostorical Video Jitter Graphs
To view the Minute Video Jitter Graphs, click the Graph link on the Minute Jitter Report page. The following graphs appear:
• Source-Destination Jitter
• One way Latency
• Errors
• Interarrival Source Destination Jitter
See Table 6-44 for more information on the graphs.
Packet Loss/Errors UnSyncRT The number of RTT operations that have been completed when the sender and responder out of sync with NTP.
NTPState The value indicates whether the sender and the responder are in sync with the Network Time Protocol (NTP)
Loss SD Number of packets lost when sent from destination to source.
Late Number of packets arrived after the timeout.
PktOutSeq The number of packets arrived out of sequence.
Table 6-43 Historical Video Jitter Report (continued)
Field Description
Table 6-44 Historical Video Jitter Graphs
Table/Graph Name Description
Collector Information Collector Name Displays the name of the Collector
Source Name Displays the source name.
Target Name Displays the target name.
Operation Displays the operation type.
Report Period Start Date Displays the start date of the report.
End Date Displays the end date of the report.
Granularity Displays the granularity specified while creating the report job.
6-137Reports Management with Cisco Prime LAN Management Solution 4.2
OL-25942-01

Chapter 6 Performance Reports Generating IPSLA Detailed Reports and Graphs
Source-Destination Jitter You can view the following positive and negative jitter values from source to destination:
• Pos Min
• Pos Avg
• Pos Max
• Neg Min
• Neg Avg
• Neg Max
These values are represented in milli seconds (msecs).
X-axis Represents the time period of the report.
The time period refers to the start and end time of the report, specified while creating the report job.
Y-axis Represents the jitter from source to destination.
It displays the source to destination jitter values for positive minimum, positive average, positive maximum, negative minimum, negative average, and negative maximum.
One way Latency You can view the one-way latency time values for:
• Minimum
• Maximum
• Average
These values are represented in milli seconds (msecs).
X-axis Represents the time period of the report.
The time period refers to the start and end time of the report, specified while creating the report job.
Y-axis Represents the latency.
It displays the values for minimum, maximum, and average latency.
Errors You can view the error occurrences for the following:
• UnSyncRT
• NTPState
• Loss
• Late
• Sequence
X-axis Represents the time period of the report.
The time period refers to the start and end time of the report, specified while creating the report job.
Y-axis Represents the error occurrences.
It displays the values for source-to-destination packet loss, destination-to-source packet loss, sequence, MIA, and late.
Table 6-44 Historical Video Jitter Graphs (continued)
Table/Graph Name Description
6-138Reports Management with Cisco Prime LAN Management Solution 4.2
OL-25942-01

Chapter 6 Performance Reports Generating IPSLA Detailed Reports and Graphs
Creating Summarized ReportsCisco Prime LMS 4.2 will provide support to create portlet reports. Scheduling and generating e-mail notification will be provided for these reports.
The summarized reports that can be generated are:
• IPSLA Summarized Reports - Availability
• IPSLA Summarized Reports - Latency
• IPSLA Summarized Reports - Jitter
To create the reports:
Step 1 Select Reports > Performance > IPSLA Summary.
Step 2 Select the report you want to generate form the list of reports.
The Reports Generator window appears.
Step 3 Specify the details as required.
For more information on specifying the details, see Table 6-45.
Interarrival Source Destination Jitter
You can view the interarrival jitter values from destination to source for:
– Average Maximum
– Average
– Average Minimum
– Minimum
– Maximum
X-axis Represents the time period of the report.
The time period refers to the start and end time of the report, specified while creating the report job.
Y-axis Represents the IA Video Jitter
Table 6-44 Historical Video Jitter Graphs (continued)
Table/Graph Name Description
Table 6-45 Generating Summarized Reports
Field Name Description
Report Details
Name Enter the name of the report you want to customize.
Description Enter the description of the report.
Schedule
6-139Reports Management with Cisco Prime LAN Management Solution 4.2
OL-25942-01

Chapter 6 Performance Reports Generating IPSLA Detailed Reports and Graphs
Schedule Type Select the schedule type from the drop-down lis t. There are five schedule types:
• Immediate— Schedules the report immediately. The report will contain data based on the selected Report period such as Instance Type or Custom.
• Once—Schedules the report only once. This report will contain the data based on the selected Report period such as Instance Type or Custom.
• Daily—The report is generated everyday at the time specified. The report will contain the data for the last 24 hours. If you select Daily, the Report period details are disabled.
• Weekly—The report is generated once a week on the date and time specified. This report will contain the data of the last seven days. If you select Weekly, the Report period details are disabled.
• Monthly—The report is generated once a month on the day and time specified. This report will contain the data of the last 30 days. If you select Monthly, the Report period details are disabled.
Job Scheduled Date Specify the date and time at which the job is scheduled at. The Job Schedule Date should be greater than the To date that you have specified in the Report Period section.
This field is disabled if you have selected Immediate as the Schedule Type
Table 6-45 Generating Summarized Reports (continued)
Field Name Description
6-140Reports Management with Cisco Prime LAN Management Solution 4.2
OL-25942-01

Chapter 6 Performance Reports Generating IPSLA Detailed Reports and Graphs
Report Period
Instance Type Select the Instance Type from the drop-down list. There are five instances type.
Latest Polled — Polls the job report immediately. This instance will contain the latest polled data.
Last One Hour — Polls the job report for the last one hour. This instance will contain the polled data of the last one hour.
Last One Day— Polls the job report for the last one day. This instance will contain the polled data for the last 24 hours.
Last One Week — Polls the job report for the last one week.This instance will contain the polled data for the last seven days.
Last One Month — Polls the job report for the last month.This instance will contain the polled data for the last four weeks.
Custom If you select Custom:
Specify the From and To time period of the Report.
The Custom details are disabled if you have selected the Instance Type.
Report Range
Select Report Range If you select Availability as the Report:
Then enter the Report Range percentage in the From and To column.
If you select Jitter or Latency, as the Report then the following Report range types are displayed:
All— If you have selected All, then then a report will be generated for all collectors and sorted on Latency or Jitter from highest to Lowest
TOP- 10— If you have selected TOP-10, then the top 10 collectors with the highest value will be listed in the report and sorted on Latency or Jitter from highest to lowest.
TOP-20— If you have select TOP-20, then the top 20 collectors with the highest value will be listed in the report and sorted on Latency or Jitter from highest to lowest.
If you select Violation as the Report, then the Report Range field does not appear.
Table 6-45 Generating Summarized Reports (continued)
Field Name Description
6-141Reports Management with Cisco Prime LAN Management Solution 4.2
OL-25942-01

Chapter 6 Performance Reports Generating IPSLA Detailed Reports and Graphs
Report Publish Location
Report Publish Path Use the Browse button to locate the directory in which you want to save the report.
The reports are saved in PDF format or CSV format.
However by default the reports are saved in PDF format.
The stored report is in a tabular format.
This field is disabled if you have selected Immediate as the Schedule Type.
• If the report publish location is specified, without email notification option, then the reports will be published in PDF format in the specified path.
• If the report publish location is specified, with attachment option as PDF, then the reports will be published in PDF format and an email notification will be sent with attachment as PDF.
• If the reports publish location is specified, with attachment option as CSV, then the reports will be published in CSV format and email notification will be sent with attachment as CSV.
Note Cisco Prime LMS does not support Japanese characters and special characters such as, \ / : * ? “ < > . ! % in the file or folder name.
Outage Option
Exclude Planned Outage Periods
The Outage check box will be enabled only for the IPSLA Reports (Availability Hourly) and not for the IPSLA Summarized Reports.
Table 6-45 Generating Summarized Reports (continued)
Field Name Description
6-142Reports Management with Cisco Prime LAN Management Solution 4.2
OL-25942-01

Chapter 6 Performance Reports Generating Poller Reports
Step 4 Click Generate Report.
The report is generated.
You can click Reset to clear the values you entered.
Generating Poller ReportsThis section explains how to create, edit, copy and view Poller Reports. You can perform the following operations in the Poller Reports panel:
• Creating a Poller Report
• Viewing a Poller Report
• Understanding Poller Reports
Email Notification
Email Address This field is disabled if you have selected Immediate as the Schedule Type.
This e-mail notification includes the following details:
• Job ID
• Main Report Name
• Report Type
• Job Name
• Schedule Type
• Schedule Date and Time
• Report Period
• Attachment option (If the attachment option is enabled)
Enter e-mail addresses to which the job sends messages at the beginning and at the end of the job. You can enter multiple e-mail addresses, separated by commas.
Configure the SMTP server to send e-mails in the View / Edit System Preferences
dialog box (Admin > System > System Preferences).
We recommend that you configure the Cisco Prime e-mail ID in the View / Edit System Preferences dialog box (Admin > System > System Preferences).
When the job starts or completes, an e-mail is sent with the Cisco Prime e-mail ID as the sender's address.
Email attachment You can now send an e-mail notifications that include graphs and reports as attachments. You can send these attachments as either a PDF or a CSV file. The default is a PDF file.
If the attachment size exceeds the configured limit, a mail will be sent to the user with the message:
Attachment size exceeded.
Table 6-45 Generating Summarized Reports (continued)
Field Name Description
6-143Reports Management with Cisco Prime LAN Management Solution 4.2
OL-25942-01

Chapter 6 Performance Reports Generating Poller Reports
Creating a Poller ReportCisco Prime LMS 4.2 allows you to create Poller Reports based on the template added in a given Poller. You can create Poller Reports for any one of the templates in a given Poller.
To create a Poller Report:
Step 1 Select Reports > Performance > Poller.
The Create Poller Report dialog box appears.
Table 6-46 describes the fields in the Create Poller Report dialog box.
Table 6-46 Create Poller Report Fields
Field/Button Description
Select Poller Select a Poller from the drop-down list.
Select Template Choose a template from the drop-down list. For example, CPU Utilization.
Date Range
Last Enter a value in the text field and select a time frame of your report.
You can only enter full days.
Select the time frame as Days, Weeks, Months or Years from the drop-down list.
For example, 5 Days, 2 Weeks, 3 Months, 2 Years.
From Specify the start date and time of your report.
Select the date by clicking the calendar icon and time from the drop-down list.
This field is disabled if you have selected Last as the Date Range.
To Specify the end date and time of your report.
Select the date by clicking the calendar icon and time from the drop-down list.
This field is disabled if you have selected Last as the Date Range.
6-144Reports Management with Cisco Prime LAN Management Solution 4.2
OL-25942-01

Chapter 6 Performance Reports Generating Poller Reports
Schedule
Run Type Select one of the following Run Types from the drop-down list:
• Immediate—Report is generated immediately.
• Once—Report is generated only once for the set date and time.
• Daily—Report is generated daily at the scheduled time.
• Weekly—Report is generated weekly for the set date and time.
• Monthly—Report is generated monthly for the date and set time.
If From and To fields are selected in the Date Range field, only Immediate and Once are displayed in the Run Types drop-down list.
Date Specify the date and time at which the job is scheduled at.
The date should be later than the To date specified in the Date Range pane. The time should be later than the current time.
Report Information
Report Name Enter a descriptive name for your report. The name must also be unique.
The name can contain a mix of alphabets, numerals, and some special characters (such as - _ .).
E-Mail ID Enter the e-mail address to which the job sends messages regarding job status.
The e-mail address must be in the format: [email protected].
You can enter multiple e-mail addresses, separated by comma or semicolon.
Configure the SMTP server to send e-mails in the System Preferences dialog box (Admin > System > SMTP Default Server).
We recommend that you configure the Cisco Prime e-mail ID in the System Preferences dialog box (Admin > System > System Preferences).
When the job starts or completes, an e-mail is sent with the Cisco Prime e-mail ID as the sender's address.
Attach Report Select this check box to attach the report as a CSV file. By default a CSV file is sent to the e-mail addresses specified in the E-Mail ID field. If you selectIf you select Add Full Report check box, instead of CSV a PDF format of the report will be sent as an attachment to the specified e-mail id.
You need to enable the e-mail Attachment check box and specify the Maximum Attachment size in the System Preferences dialog box (Admin > System > System Preferences) to send the report as an e-mail.
If the file size exceeds the Maximum Attachment size, the URL link of the report is sent as an e-mail. You can click the URL link to view the report.
Table 6-46 Create Poller Report Fields (continued)
Field/Button Description
6-145Reports Management with Cisco Prime LAN Management Solution 4.2
OL-25942-01

Chapter 6 Performance Reports Generating Poller Reports
Step 2 Select a Poller name from the drop-down list.
Step 3 Select a Template name from the drop-down list.
You can select any one of the templates available in the drop-down list.
Step 4 Update the necessary fields in the following panes:
• Date Range
• Schedule
• Report Information
Report Publish Path Use the Default Path check box to publish the report at a specific location.
• If you select the Default Path check box, it publishes the report in the default directory path. For more information, see Set Report Publish Location under Administration of Cisco Prime Lan Management Solution 4.2 .
• If you de-select the Default Path check box, it allows you to specify a directory path to which the report is published. If the directory path is not specified, then the report will be published to:
– For Windows: $NMSROOT\MDC\tomcat\webapps\upm\reports
– For Solaris / Soft Appliance: $NMSROOT/MDC/tomcat/webapps/upm/reports
A PDF format of the report (along with HTML and CSV formats) is published to the specified location.
Note Cisco Prime LMS does not support Japanese characters and special characters such as, \ / : * ? “ < > . ! % in the file or folder name.
Add Full Report Use the Add Full Report check box to create a PDF format of the report for all devices.
If you select this check box along with Attach Report check box, a PDF format of the report will be sent as an attachment to the specified e-mail id. If the file size exceeds the Maximum Attachment size, then a CSV file will only be sent as an attachment along with the URL link of the HTML report. You can download the PDF format of the report using the export option provided in the HTML report.
The PDF format of the report takes longer time to generate as it includes the report for all the polled devices.
Note Scheduling PDF reports with large number of data on a daily basis results high CPU and memory usage. We recommend you to schedule PDF reports with less number of data at optimal time intervals.
Table 6-46 Create Poller Report Fields (continued)
Field/Button Description
6-146Reports Management with Cisco Prime LAN Management Solution 4.2
OL-25942-01

Chapter 6 Performance Reports Generating Poller Reports
Step 5 Click Create to create the report or Reset to clear all the fields.
If you click Create a message appears confirming that the job is created successfully and the Job ID is displayed.
You can see the created report in the Poller Report category tree list.
You can go to the Report Job Browser at the bottom of the page to check the status of the Report job.
Note If you have selected more than the optimal limit of 10,000 instances the PDF format of the report might fail to generate.
Viewing a Poller ReportYou can view a Poller Report by clicking the Launch option.
If data for a report is not available, a message appears, Report Not Available. This message appears because information is not available for the specified duration or the report job has failed.
To view a Poller Report:
Step 1 Select Reports > Performance > Poller.
Step 2 Click the Job ID from the Job Browser at the bottom of the page.
Step 3 Select Launch from the context menu.
The corresponding report page appears, displaying the report details. For more information, see Understanding Poller Reports.
You can also copy the URL of a report to clipboard.
Understanding Poller ReportsThis section provides you details on the fields available in a Poller Report. The information in the Poller Report is presented using tables and graphs.
The Poller Report displays only the latest 1000 MIB variable instances for all the devices. Export the report to PDF to view data for all the MIB variable instances.
You can export the report to a file of PDF or CSV.
Table 6-47 describes the fields in the Poller Report.
Table 6-47 Poller Reports Fields
Field Description
Report Details
Report Name Name of the Poller report.
Generation Time Date and time at which the report was generated. For example, Mon, Apr 21 2009, 12:44:08
6-147Reports Management with Cisco Prime LAN Management Solution 4.2
OL-25942-01

Chapter 6 Performance Reports Generating Custom Report
Each data point in the line graph has a tooltip that displays the value for the time period.
Generating Custom ReportCisco Prime LMS 4.2 allows you to create reports of MIB variables that are common to all Pollers or specific to a Poller polled. These reports are called Custom Reports.
This section explains how to create, edit, copy and view Custom Reports. You can perform the following operations in Custom Reports:
• Creating a Custom Report
• Viewing a Custom Report
• Understanding Custom Reports
Creating a Custom ReportYou can create a Custom Report by selecting the Custom Reports category and clicking the Create option.
To create a Custom Report:
Step 1 Select Reports > Performance.
The Report Management page appears.
Start Date Start date and time of the report data. For example, Sun, Apr 20 2009, 12:44:03.
End Date End date and time of the report data. For example, Mon, Apr 21 2009, 12:44:03.
Report Summary
No. of Devices Number of devices included in generating the report.
No. of Instance Variables
Number of instance variables included in generating the report.
Variables
Device Name Displays the device name. For example, 3500XL
Click on the device name to view the graph. The graph is displayed in a separate pop-up window.
Instance Name MIB variable instance monitored for the device. For example, CPU of supervisor
Min Minimum value for the MIB variable instance.
Max Maximum value for the MIB variable instance.
Avg Average value for the MIB variable instance.
Table 6-47 Poller Reports Fields
Field Description
6-148Reports Management with Cisco Prime LAN Management Solution 4.2
OL-25942-01

Chapter 6 Performance Reports Generating Custom Report
Table 6-48 describes the fields in the Create Custom Report dialog box.
Table 6-48 Create Custom Report Fields
Field/Button Description
Device Selector All devices,device groups, port groups and pollers in a tree format.
Device Selector shows only the devices that are being polled currently.
Search Input Enter your search expression in this field.
You can enter the device name.
Search Use the search icon to perform a simple search of devices, after you have entered your search input.
For more information on how to use Device Selector, see Inventory Management guide for LMS 4.2.
Advanced Search Search for devices by specifying a set of rules.
For more information on Advanced Search, see Inventory Management guide for LMS 4.2
All Click All to view all the devices that are currently being polled.
Select the check boxes to select the devices.
Search Results All Simple or Advanced search results. You can do a select all, clear all, or select a few devices from the list.
Selection Devices that you have selected using the All tab and Search Results tab.
Poller Selector All the configured Pollers, in a tree format.
Poller Selector shows only the Pollers that are being polled currently.
You can use the search icon to perform a simple search of Pollers, after you have entered your search input. Advanced Search is not available for Poller Selector.
Show MIB Variables
(button)
Lists all the MIB variables that are common to the selected devices or Pollers in the MIB Variables pane.
6-149Reports Management with Cisco Prime LAN Management Solution 4.2
OL-25942-01

Chapter 6 Performance Reports Generating Custom Report
MIB Variables
Filter Source Enter the MIB variable name or OID in the text field and click GO.
The following criteria and conditions are available as a drop-down list. Use them to filter your expression:
Criteria:
• Variable Name—Enter the MIB variable name.
• OID—Enter the OID number of the MIB variable name.
Condition:
• Contains—Enter any three consecutive characters of the MIB variable name or the OID for the selected criteria.
• Starts with—First few characters of the MIB variable name or the OID for the selected criteria.
• Ends with—Last few characters of the MIB variable name or the OID for the selected criteria.
Variable Name Displays the MIB variable name. For example, ifInOctets
OID Displays the Object Identifier of the MIB variable. For example, 1.3.6.1.2.1.2.2.1.10
Date Range
Last Enter a numeric value in the text field and select a time frame of your report.
You can only enter full days.
Select the time frame as Days, Weeks, Months or Years from the drop-down list.
For example, 5 Days, 2 Weeks, 3 Months, 2 Years.
From Specify the start date and time of your report.
Select the date by clicking the calendar icon and time from the drop-down list.
This field is disabled if you have selected Last as the Date Range.
To Specify the end date and time of your report.
Select the date by clicking the calendar icon and time from the drop-down list.
This field is disabled if you have selected Last as the Date Range.
Table 6-48 Create Custom Report Fields (continued)
Field/Button Description
6-150Reports Management with Cisco Prime LAN Management Solution 4.2
OL-25942-01

Chapter 6 Performance Reports Generating Custom Report
Schedule
Run Type Select one of the following Run Types from the drop-down list:
• Immediate—Report is generated immediately.
• Once—Report is generated only once for set date and time.
• Daily—Report is generated daily at the scheduled time.
• Weekly—Report is generated weekly for the set date and time.
• Monthly—Report is generated monthly for the set date and time.
If From and To fields are selected in the Date Range field, only Immediate and Once are displayed in the Run Types drop-down list.
Date Specify the date and time at which the job is scheduled at.
The date should be later than the To date specified in the Date Range pane. The time should be later than the current time.
Report Information
Report Name Enter a name for your report. The report name should be unique.
The name can contain a mix of alphabets, numerals, and some special characters (such as - _ .).
e-mail ID Enter e-mail address to which the job sends messages regarding job status.
The e-mail address must be in the format: [email protected].
You can enter multiple e-mail addresses, separated by comma or semicolon.
Configure the SMTP server to send e-mails in the System Preferences dialog box (Admin > System > SMTP Default Server).
We recommend that you configure the Cisco Prime e-mail ID in the System Preferences dialog box (Admin > System > System Preferences).
When the job starts or completes, an e-mail is sent with the Cisco Prime e-mail ID as the sender's address.
Attach Report Select this check box to attach the report as a CSV file. By default a CSV file is sent to the e-mail address specified in the e-mail ID field. If you select Add Full Report check box, instead of CSV a PDF format of the report will be sent as an attachment to the specified e-mail id.
You need to enable the e-mail Attachment check box and specify the Maximum Attachment size in the System Preferences dialog box (Admin > System > System Preferences) to send the report as an e-mail.
If the file size exceeds the Maximum Attachment size, the URL link of the report is sent as an e-mail. You can click the URL link to view the report.
Table 6-48 Create Custom Report Fields (continued)
Field/Button Description
6-151Reports Management with Cisco Prime LAN Management Solution 4.2
OL-25942-01

Chapter 6 Performance Reports Generating Custom Report
Step 2 Select one of the following in the Create Custom Report dialog box:
• Device Selector—All the devices, device type groups, user defined groups, and subnet groups that are being polled currently, in a tree format.
• Device Groups—All device groups being polled currently, in a tree structure.
• Port Groups—All port groups being polled currently, in a tree structure.
• Poller Selector—All pollers being polled currently, in a tree structure.
Based on your selection either a list of devices or pollers is listed, in a tree format.
Step 3 Select the devices or pollers from the tree list.
Report Publish Path Use the Default Path check box to publish the report at a specific location.
• If you select the Default Path check box, it publishes the report in the default directory path. For more information, see Set Report Publish Location under Administration of Cisco Prime Lan Management Solution 4.2.
• If you de-select the Default Path check box, it allows you to specify a directory path to which the report is published. If the directory path is not specified, then the report will be published to:
– For Windows: $NMSROOT\MDC\tomcat\webapps\upm\reports
– For Solaris / Soft Appliance: $NMSROOT/MDC/tomcat/webapps/upm/reports
A PDF format of the report (along with HTML and CSV formats) is published to the specified location.
Note Cisco Prime LMS does not support Japanese characters and special characters such as, \ / : * ? “ < > . ! % in the file or folder name.
Add Full Report Use the Add Full Report check box to create a PDF format of the report for all devices.
If you select this check box along with Attach Report check box, a PDF format of the report will be sent as an attachment to the specified e-mail id. If the file size exceeds the Maximum Attachment size, then a CSV file will only be sent as an attachment along with the URL link of the HTML report. You can download the PDF format of the report using the export option provided in the HTML report.
The PDF format of the report takes longer time to generate as it includes the report for all the polled devices.
Note Scheduling PDF reports with large number of data on a daily basis results high CPU and memory usage. We recommend you to schedule PDF reports with less number of data at optimal time intervals.
Table 6-48 Create Custom Report Fields (continued)
Field/Button Description
6-152Reports Management with Cisco Prime LAN Management Solution 4.2
OL-25942-01

Chapter 6 Performance Reports Generating Custom Report
Step 4 Click Show MIB Variables.
This lists all the MIB variables that are common to the selected devices or pollers in the MIB Variables pane.
Step 5 Go to the MIB Variables pane.
Step 6 Select the necessary MIB variables by checking the corresponding check boxes.
You can use the Filter Source option to select MIB variables, based on the criteria available in the drop-down list.
See Table 6-48 for a description on how to use Filter Source option in MIB Variables pane.
Step 7 Update the necessary fields in the following panes:
• Date Range
• Schedule
• Report Information
See Table 6-48 for the description of the fields that appear in the Create Custom Report dialog box.
Step 8 Click Create to create the report or Reset to clear all the fields.
If you click Create a message appears confirming that the job is created successfully and the Job ID is displayed. You can see the created report in the Custom Report category tree list.
You can go to the Report Job Browser page to check the status of the Report job.
Note If you have selected more than the optimal limit of 10,000 instances, the PDF format of the report might not generate.
Viewing a Custom ReportTo view a Custom Report:
Step 1 Select Reports>Performance>Custom.
The list of completed jobs appear at the bottom of the page. You can view the reports of the jobs that completed successfully.
Step 2 To view the report, click "View Report".
The Report page of that job appears, displaying the report details. For more information, see Understanding Custom Reports
Note You cannot view the reports of the failed jobs or partially completed jobs.
6-153Reports Management with Cisco Prime LAN Management Solution 4.2
OL-25942-01

Chapter 6 Performance Reports Generating Custom Report
Understanding Custom ReportsThis section describes the fields available in a Custom Report. The information in the Custom Report is presented using tables and graphs.
The Custom Report displays only the latest 1000 MIB variable instances for all the devices. Export the report to PDF to view data for all the MIB variable instances.
You can export the report to a file of PDF or CSV.
Table 6-49 describes the fields in a Custom Report.
Table 6-49 Custom Reports Fields
Field Description
Report Details
Report Name Name of the custom report.
Generation Time Date and time at which the report was generated.
For example, Mon, Apr 21 2009, 12:44:08.
Start Date Start date and time of the report data. For example, Sun, Apr 20 2009, 12:44:03.
End Date End date and time of the report data. For example, Mon, Apr 21 2009, 12:44:03.
Report Summary
No. of Devices Number of devices participated in generating the report.
No. of Instance Variables
Number of instance variables participated in generating the report.
MIB Variable
Device Name Device name. For example, 3500XL.
Click on the device name to view the respective graph. The graph is displayed in a separate pop-up window.
Instance Name Instance monitored for the corresponding device.
For example, CPU of supervisor.
Min Minimum value for the corresponding instance name.
Max Maximum value for the corresponding instance name.
Avg Average value for the corresponding instance name.
6-154Reports Management with Cisco Prime LAN Management Solution 4.2
OL-25942-01

Chapter 6 Performance Reports Generating and Understanding IPSLA System Summary Reports
Generating and Understanding IPSLA System Summary ReportsLMS 4.2 generates system reports automatically for all collectors based on the report types and granularity after the consolidation of the statistical data. The system reports generated are in tabular format.
You can also generate system reports using the CLI command, ipm generate reports. For more information, see Managing System Reports.
Note The system uses applicable collectors for generating the reports. For example, an Echo collector will not be used for generating the UDP Jitter system reports.
The system reports are generated for the following granularity:
• Daily—System generates daily reports everyday after the consolidation of Hourly to Daily statistical data.
For more information, see Viewing Daily System Reports.
• Weekly—System generates weekly reports every Saturday after the consolidation of Daily to Weekly statistical data.
For more information, see Viewing Weekly System Reports.
• Monthly—System generates monthly reports at the end of every month after the consolidation of Daily to Monthly statistical data.
For more information, see Viewing Monthly System Reports.
For more information on Hourly to Daily, Daily to Weekly, and Daily to Monthly consolidation, see Consolidation of Statistical Data
Viewing Daily System ReportsYou can view the daily system report for each collector on the LMS server
To view the daily system reports:
Step 1 Select Reports > Performance > IPSLA System Summary > Daily.
The Daily System Report page displays the details for the selected report type.
For more information on the report details, see the respective Historical Report:
• Historical Availability Report
• Historical Latency Report
• Historical UDP Jitter Report
• Historical HTTP Report
• Historical ICMP Jitter Report
• Historical Path Echo Report
• Minute RTP Report
• Historical Ethernet Jitter Report
6-155Reports Management with Cisco Prime LAN Management Solution 4.2
OL-25942-01

Chapter 6 Performance Reports Generating and Understanding IPSLA System Summary Reports
Filtering System Reports
The Filter option available in the System Reports dialog box, allows you to filter the System Report based on certain fields and value. The filter operation uses “contains”as the default criteria to filter the System Reports based on the string provided in the filter text area. The System Reports filter operation is not case sensitive.
Table 6-51 lists the various fields based on which you can filter the System Reports.
Example 1:
If you want to filter the System Reports based on the Generated Date.
1. From the Filter drop-down, select Generated Date.
Table 6-50 Daily Report
Field Description
Report Name Displays the report name.
For example, Availability_2007-05-07.html is the report name where:
• Availability—Refers to the report type.
• 2007-05-07—Refers to the day when the report is generated.
Generated Date Displays the date and time when the report is created.
Report Type Displays the report type.
Refresh
(Icon)
Allows you to refresh the report jobs.
Filter Filters the System Reports based on certain fields and values.
For more information, see Filtering System Reports.
Table 6-51 Filtering System Report
Fields for Filtering Description
All Displays all report jobs.
Report Type Select one of the following report types from the drop-down list:
• Availability
• Latency
• UDP Jitter
• HTTP
• ICMP
• PathEcho
• RTP
• EthernetJitter
Generated Date Enter the complete or part of the generated date.
Report Name Enter the complete or part of the report name.
6-156Reports Management with Cisco Prime LAN Management Solution 4.2
OL-25942-01

Chapter 6 Performance Reports Generating and Understanding IPSLA System Summary Reports
2. In the Filter text area enter the name of the month and date (For example, Mar 23) or name of the month only. For example, Mar.
3. Click Filter
All those System Reports that were generated are filtered and provided in the results.
Example 2:
If you want to filter the System Reports based on Report Type and with value HTTP:
1. From the Filter drop-down, select Report Type.
2. From the Report Type drop-down, select HTTP.
3. Click Filter
All those System Reports whose report type is HTTP are displayed in the results.
Viewing Weekly System ReportsYou can view the weekly system report for each collector on the LMS server.
To view the weekly reports:
Step 1 Select Reports > Performance > IPSLA System Summary > Weekly.
The Weekly System Report page appears.
For more information on this page, see Table 6-52.
Step 2 Click the required Report Name hyperlink to view the Weekly System Report.
The Weekly System Report page displays the details for the selected report type.
For more information on the report details, see the respective Historical Report:
• Historical Availability Report
• Historical Latency Report
• Historical UDP Jitter Report
• Historical HTTP Report
• Historical ICMP Jitter Report
• Historical Path Echo Report
• Minute RTP Report
• Historical Ethernet Jitter Report
6-157Reports Management with Cisco Prime LAN Management Solution 4.2
OL-25942-01

Chapter 6 Performance Reports Generating and Understanding IPSLA System Summary Reports
Table 6-52 lists and describes the fields in a Weekly Report.
Viewing Monthly System ReportsYou can view the monthly summary for each collector on the LMS server.
To view monthly reports:
Step 1 Select Reports > Performance > IPSLA System Summary > Monthly.
The Monthly System Report page appears.
For more information on this page, see Table 6-53.
Step 2 Click the required Report Name hyperlink to view the Monthly System Report.
The Monthly System Report page displays the details for the selected report type.
For more information on the report details, see the respective Historical Report:
• Historical Availability Report
• Historical Latency Report
• Historical UDP Jitter Report
• Historical HTTP Report
• Historical ICMP Jitter Report
• Historical Path Echo Report
• Minute RTP Report
• Historical Ethernet Jitter Report
Table 6-52 Weekly Reports
Field Description
Report Name Displays the report name.
For example, Availability_2007-05-07.html is the report name where:
• Availability—Refers to the report type.
• 2007-05-07—Refers to the first day of the week when the report is generated.
Generated Date Displays the date and time when the report is created.
Report Type Displays the report type.
Refresh
(Icon)
Allows you to refresh the report jobs.
Filter Filters the System Reports based on certain fields and values.
For more information, see Filtering System Reports.
6-158Reports Management with Cisco Prime LAN Management Solution 4.2
OL-25942-01

Chapter 6 Performance Reports Generating and Understanding IPSLA System Summary Reports
Table 6-53 lists and describes the fields in a Monthly Report.
Managing System ReportsThis section explains how to manage the system reports using CLI commands.
• Generating System Reports
• Deleting System Reports
Generating System Reports
Use the following command to generate the system reports for all report types and all granularities.
Command
ipm generatereports
Syntax Description
ipm generatereports -u userid -p password
Example
ipm generatereports -u admin -p admin
Successful: ipm generatereports: Successfully generated reports.
This result occurs when the system reports are generated successfully.
Table 6-53 Monthly Reports
Field Description
Report Name Displays the report name.
For example, Availability_2007-05-07.html is the report name where:
• Availability—Refers to the report type.
• 2007-05-07—Refers to the first day of the month when the report is generated.
Generated Date Displays the date and time when the report is created.
Report Type Displays the report type.
Refresh
(Icon)
Allows you to refresh the report jobs.
Filter Filters the System Reports based on certain fields and values.
For more information, see Filtering System Reports.
6-159Reports Management with Cisco Prime LAN Management Solution 4.2
OL-25942-01

Chapter 6 Performance Reports Consolidation of Statistical Data
Deleting System Reports
Use the following command to delete the system reports.
Command
ipm deletereports
Syntax Description
ipm deletereports -u userid -p password {-noofdays no_of_days} [-input argumentFile]
noofdays—Specify the number of days for which you want to save the report.
input—Text file that contains arguments for the command.
Example
ipm deletereports -u admin -p admin - noofdays 4
Successful: ipm deletereports: Successfully deleted reports.
This result occurs when the system reports are deleted successfully.
Consolidation of Statistical DataLMS 4.2 consolidates the statistical data for all collectors based on the granularity such as Daily, Weekly, and Monthly.
• Hourly to Daily Consolidation
• Daily to Weekly Consolidation
• Daily to Monthly Consolidation
Hourly to Daily Consolidation
The system consolidates the Daily statistical data everyday at 12:30 AM. At the end of every day, the statistical data collected every hour is consolidated and averaged for the day and stored in the Daily table.
For example, 1001.x, where:
• 1001—Refers to the Job ID.
• x—Refers to the instances of hourly to daily consolidation.
Daily to Weekly Consolidation
The system consolidates the Weekly statistical data every Sunday at 1 AM. At the end of every week, the statistical data collected every day is consolidated and averaged for the week, and stored in the Weekly table.
For example, 1002.x, where:
• 1002—Refers to the Job ID.
• x—Refers to the instances of daily to weekly consolidation.
6-160Reports Management with Cisco Prime LAN Management Solution 4.2
OL-25942-01

Chapter 6 Performance Reports Formulae Used in LMS 4.2 Reports and Graphs
Daily to Monthly Consolidation
The system consolidates the Monthly statistical data on the first day of every month at 2 AM. At the end of every month, the statistical data collected every day is consolidated and averaged for the month and stored in the Monthly table.
For example, 1003.x, where:
• 1003—Refers to the Job ID.
• x—Refers to the instances of daily to monthly consolidation.
Note Bad values returned by the source device affects the daily, weekly, and monthly statistical reports. To prevent this, LMS 4.2 discards the statistics with bad values, such as greater than 999999999 or negative values.
Formulae Used in LMS 4.2 Reports and GraphsThis section explains the various formulae used while generating Minute/Historical reports and graphs See Table 6-54.
Table 6-54 Formulae Used in LMS 4.2 Reports and Graphs
Report Parameter Formula
Availability% (Number of Completions1/ Number of Tries2) *100
Error% (Errors / Number of Tries) * 100
Latency Errors=Disconnects+Timeouts+Busies+NoConnections+ Drops+ SeqErrors+VerifyErrors.Availability
PathEcho
HTTP Errors=DNS Server Timeout+TCP Connect Timeout+Transaction Timeout+DNS Query Error+HTTP Error+Drops+Busies.
UDP Jitter Errors=Internal Errors+Busies.
ICMP Jitter
Ethernet Jitter
Standard Deviation formula for One way latency
SQRT3 {(Num of One way completions* sumSqrdOW4) - (SumOW5 * SumOW)} / {Num of One way completions * (Num of One way completions - 1)}
Standard Deviation formula for RTT
SQRT6 {(Number of Completions * sumSqrdRTT7) - (sumRTT8 * sumRTT)} / {Number of Completions * (Number of Completions -1)}
Standard Deviation formula for Jitter
SQRT{(numberofjitter * sumSqrdJitter9) - (sumjitter10 * sumjitterj) / numberofjitter * (numberofjitter - 1)}
OverThreshold% (OverThresholds11 / Tries12) * 100
Packet Error% (Total packet errors / total packets13) *100
UDP Jitter TotalPacketErrors=LossSD+LossDS+Seq+MIA+Late.
Ethernet Jitter
ICMP Jitter TotalPacketErrors=PacketLoss+PktOutSeqBoth+PktOutSeqDSes+PktOutSeqSDes+PktLateAS+PacketSkippds.
6-161Reports Management with Cisco Prime LAN Management Solution 4.2
OL-25942-01

Chapter 6 Performance Reports Formulae Used in LMS 4.2 Reports and Graphs
Average RTT Sum of round-trip time / Number of Completions.
HTTP: Average TCP Connect RTT
Sum of round-trip time for DNS query within the HTTP operation / Number of Completions.
HTTP: Average TCP Connect RTT
Sum of round-trip time for DNS query within the HTTP operation / Number of Completions.
HTTP: Average Transaction RTT
Sum of round-trip time taken to download the specified object by URL / Number of Completions.
Average One way latency Sum One way latency / Num One way latency.
Average Message Body Octets
Sum of size of the message body received in response to HTTP request / Number of Completions.
1. Number of Completions—Number of RTT operations completed without an error or timeout.
2. Number of Tries—Sum of all errors and number of completions.
3. SQRT—Square root.
4. sumSqrdOW—Sum of square of the one way latency time measured successfully.
5. SumOW—Sum of the one way latency time measured successfully.
6. SQRT—Square root.
7. sumSqrdRTT—Sum of square of the round-trip time measured successfully.
8. sumRTT—Sum of the round-trip time measured successfully.
9. sumsqrdjitter: Sum of square of jitter.
10. sumjitter = sum of all jitter.
11. OverThresholds—Number of jitter operations that violate threshold.
12. Tries—Sum of all errors (numDisconnects, numTimeouts, numBusies, numNoConnections, numDrops, numSeqErrors, and numVerifyErrors, and numCompletions).
13. total packets—Number of packets configured in operation * Number of completions.
Table 6-54 Formulae Used in LMS 4.2 Reports and Graphs (continued)
Report Parameter Formula
6-162Reports Management with Cisco Prime LAN Management Solution 4.2
OL-25942-01

Chapter 6 Performance Reports Formulae Used in LMS 4.2 Reports and Graphs
6-163Reports Management with Cisco Prime LAN Management Solution 4.2
OL-25942-01

Chapter 6 Performance Reports Formulae Used in LMS 4.2 Reports and Graphs
6-164Reports Management with Cisco Prime LAN Management Solution 4.2
OL-25942-01

Chapter 6 Performance Reports Formulae Used in LMS 4.2 Reports and Graphs
6-165Reports Management with Cisco Prime LAN Management Solution 4.2
OL-25942-01

Chapter 6 Performance Reports Formulae Used in LMS 4.2 Reports and Graphs
6-166Reports Management with Cisco Prime LAN Management Solution 4.2
OL-25942-01

Chapter 6 Performance Reports Formulae Used in LMS 4.2 Reports and Graphs
6-167Reports Management with Cisco Prime LAN Management Solution 4.2
OL-25942-01

Chapter 6 Performance Reports Formulae Used in LMS 4.2 Reports and Graphs
6-168Reports Management with Cisco Prime LAN Management Solution 4.2
OL-25942-01

Chapter 6 Performance Reports Formulae Used in LMS 4.2 Reports and Graphs
6-169Reports Management with Cisco Prime LAN Management Solution 4.2
OL-25942-01

Chapter 6 Performance Reports Formulae Used in LMS 4.2 Reports and Graphs
6-170Reports Management with Cisco Prime LAN Management Solution 4.2
OL-25942-01

Chapter 6 Performance Reports Formulae Used in LMS 4.2 Reports and Graphs
6-171Reports Management with Cisco Prime LAN Management Solution 4.2
OL-25942-01

Chapter 6 Performance Reports Formulae Used in LMS 4.2 Reports and Graphs
6-172Reports Management with Cisco Prime LAN Management Solution 4.2
OL-25942-01

Chapter 6 Performance Reports Formulae Used in LMS 4.2 Reports and Graphs
6-173Reports Management with Cisco Prime LAN Management Solution 4.2
OL-25942-01

Chapter 6 Performance Reports Formulae Used in LMS 4.2 Reports and Graphs
6-174Reports Management with Cisco Prime LAN Management Solution 4.2
OL-25942-01

Chapter 6 Performance Reports Formulae Used in LMS 4.2 Reports and Graphs
6-175Reports Management with Cisco Prime LAN Management Solution 4.2
OL-25942-01

Chapter 6 Performance Reports Formulae Used in LMS 4.2 Reports and Graphs
6-176Reports Management with Cisco Prime LAN Management Solution 4.2
OL-25942-01

Chapter 6 Performance Reports Formulae Used in LMS 4.2 Reports and Graphs
6-177Reports Management with Cisco Prime LAN Management Solution 4.2
OL-25942-01

Chapter 6 Performance Reports Formulae Used in LMS 4.2 Reports and Graphs
6-178Reports Management with Cisco Prime LAN Management Solution 4.2
OL-25942-01

Chapter 6 Performance Reports Formulae Used in LMS 4.2 Reports and Graphs
6-179Reports Management with Cisco Prime LAN Management Solution 4.2
OL-25942-01

Chapter 6 Performance Reports Formulae Used in LMS 4.2 Reports and Graphs
6-180Reports Management with Cisco Prime LAN Management Solution 4.2
OL-25942-01

Chapter 6 Performance Reports Formulae Used in LMS 4.2 Reports and Graphs
6-181Reports Management with Cisco Prime LAN Management Solution 4.2
OL-25942-01

Chapter 6 Performance Reports Formulae Used in LMS 4.2 Reports and Graphs
6-182Reports Management with Cisco Prime LAN Management Solution 4.2
OL-25942-01

Chapter 6 Performance Reports Formulae Used in LMS 4.2 Reports and Graphs
6-183Reports Management with Cisco Prime LAN Management Solution 4.2
OL-25942-01

Chapter 6 Performance Reports Formulae Used in LMS 4.2 Reports and Graphs
6-184Reports Management with Cisco Prime LAN Management Solution 4.2
OL-25942-01