CHAPTER 6 - Omar Al-Kadi's Homepageomar.alkadi.net/wp-content/uploads/DIPch6.pdfmonochrome intensity...
58
CHAPTER 6 COLOR IMAGE PROCESSING
Transcript of CHAPTER 6 - Omar Al-Kadi's Homepageomar.alkadi.net/wp-content/uploads/DIPch6.pdfmonochrome intensity...

CHAPTER 6
COLOR IMAGE PROCESSING

2
CHAPTER 6: COLOR IMAGE PROCESSING
The use of color image processing is motivated by twofactors:
Color is a powerful descriptor that often simplifies object identification and extraction from a scene.
Humans can discern thousands of color shades and intensities (compared to ~only 2 dozen shades of gray!).
Two major areas:
Full-color processing: images are acquired with a full-color sensor.
Pseudo-color processing: a color is assigned to a particular monochrome intensity or range of intensities.
In the past, most digital image color processing was done at the pseudo-color level.
Today, full-color image processing techniques are used in a broad range of applications.
3
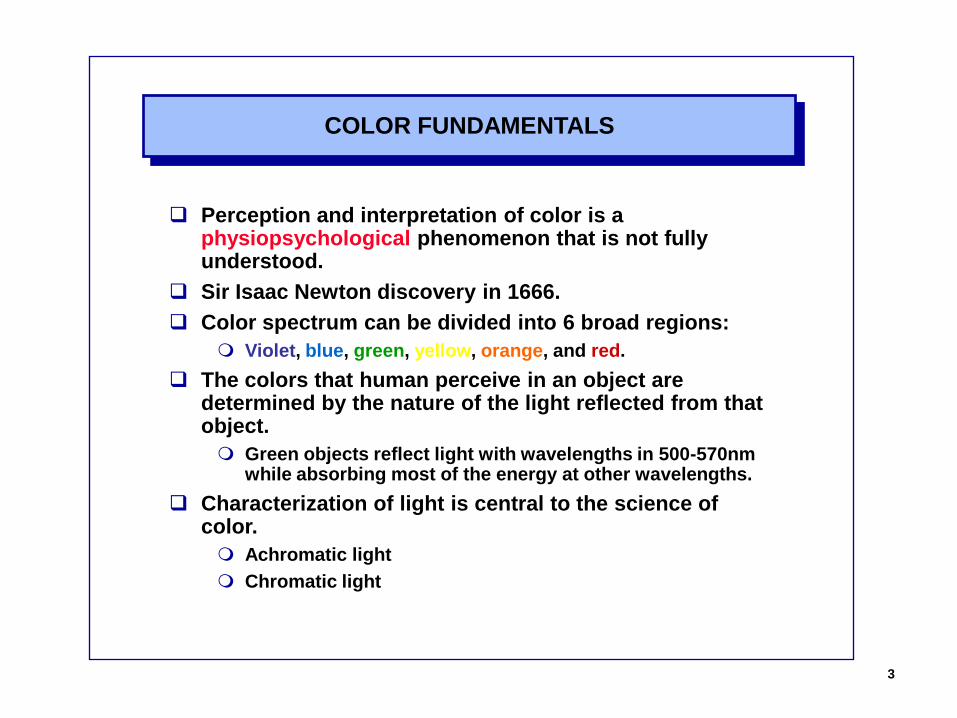
COLOR FUNDAMENTALS
Perception and interpretation of color is a physiopsychological phenomenon that is not fully understood.
Sir Isaac Newton discovery in 1666.
Color spectrum can be divided into 6 broad regions:
Violet, blue, green, yellow, orange, and red.
The colors that human perceive in an object are determined by the nature of the light reflected from that object.
Green objects reflect light with wavelengths in 500-570nm while absorbing most of the energy at other wavelengths.
Characterization of light is central to the science of color.
Achromatic light
Chromatic light

4
COLOR SPECTRUM

5
CHROMATIC LIGHT
Chromatic light spans the EM spectrum from 400nm to 700nm.
3 basic quantities to describe the quality of a chromatic light source:
Radiance (W): total amount of energy that flows from the light source.
Luminance (lm): the amount of energy an observer perceives from a light source.
Brightness: a subjective descriptor that is impossible measure in partice.
Example: light emitted from a source operating in the far infrared region.
Radiance: significant!
Luminance: hardly perceived!
The cones are responsible for color vision.
65% are sensitive to red light.
33% are sensitive to green light.
2% are sensitive to blue light (blue cones are the most sensitive)

6
VISIBLE SPECTRUM

7
ABSORPTION OF LIGHT BY THE CONES
No single color may be called red, green, or blue.

8
PRIMARY AND SECONDARY COLORS OF LIGHT
Primary colors are mixed to produce secondary colors of light (magenta, cyan, yellow).
Secondary colors are mixed to produce primary colors of light (red, green, blue).

9
COLOR TV
A color TV screen differs from a black-and-white screen in three ways:
There are three electron beams that move simultaneously across the screen. They are named the red, green and blue beams.
The screen is not coated with a single sheet of phosphor as in a black-and-white TV. Instead, the screen is coated with red, green and blue phosphors arranged in dots or stripes. If you turn on your TV or computer monitor, and look closely at the screen with a magnifying glass, you will be able to see the dots or stripes.
On the inside of the tube, very close to the phosphor coating, there is a thin metal screen called a shadow mask. This mask is perforated with very small holes that are aligned with the phosphor dots (or stripes) on the screen.
When a color TV needs to create a red dot, it fires the red beam at the red phosphor. Similarly for green and blue dots.
To create a white dot, red, green and blue beams are fired simultaneously -- the three colors mix together to create white.
To create a black dot, all three beams are turned off as they scan past the dot. All other colors on a TV screen are combinations of red, green and blue.

10
CIE CHROMATICITY DIAGRAM
Points on the boundary are pure colors in the visible spectrum.
Any point within the diagram represents some mixture of spectrum colors.
A straight line segment joining any 2 points defines all the different color variations that can be obtained by mixing these 2 colors additively.
Any color in the triangle can be produced by various combinations of the corner colors.

11
COLOR MODELS
A color model is a specification of colors in a standard way.
A coordinate system and a subspace where each color is represented by a single point.
Most color models are oriented toward hardware or applications.
Hardware oriented models for DIP
RGB (red, green, blue) model for color monitors and color video cameras
CMY (cyan, magenta, yellow) model for color printing
CMYK (cyan, magenta, yellow, black) model for color printing
HSI (hue, saturation, intensity) model that corresponds to the way humans describe and interpret color

12
RGB MODEL
Each color is represented by a point in or on the unit cube.
Images represented with the RGB color model have 3 component images:
Red componentGreen componentBlue component
If 8 bits are used for each pixel, we have a 24-bit RGB image.

13
RGB 24-BIT COLOR CUBE
(28)3 = 16,777,216 colors

14
COLOR PLANES
R = 127G = 0-255B = 0-255
A color image is acquired using the process in reverseorder.

15
SAFE RGB COLORS

16
RBG SAFE-COLOR CUBE
Each surface has 36 colors: 6x36 = 216

17
CMY & CMYK COLOR MODELS
Secondary colors of light : Cyan, magenta, yellow (primary colors of pigments)
Most devices (color printers, copiers, etc.) that deposit color pigments on paper require CMY data input or perform an internal RGB to CMY conversion.
RGB to CMY conversion (all color values are in the range [0,1]):
C 1 R light reflected from a surface coated with pure cyan does not contain red
M = 1 - G light reflected from a surface coated with pure magenta does not contain green
Y 1 B light reflected from a surface coated with pure yellow does not contain blue
Equal amounts of cyan, magenta, and yellow should produce black.In practice, this combination produces muddy-looking black.In order to produce true black, a fourth color is added to the model.
CMYK color model: cyan, magenta, yellow, and black

18
HSI COLOR MODEL
RBG and CMY are suitable for hardware implementations.
Unfortunately, they are not good for describing colors for human interpretation.
One does not refer to the color of a car by giving the % of each of the primaries!
Humans describe a color object by its hue, saturation, and brightness.
Hue: a color attribute that describes a pure color.
Saturation: gives a measure of the degree to which pure color is diluted by white light.
Brightness: a subjective descriptor that is practically impossible to measure.
The HSI model decouples the intensity component from the color-carrying information (hue & saturation).

19
CONCEPTUAL RELATIONSHIP BETWEEN RGB AND HSI COLOR MODELS
(0,0,0)
(1,1,1)This line is the intensity axisjoining black and white vertices.
The intensity component of this color point can be determined by passing a plane perpendicular to the axis and containing the point.
In this plane segment, all the points have the same hue but different saturation and intensity.
Conclusion: H, S, and I values required to form the HSI space can be obtained from the RGB cube.
As the planes moves up and down, the boundaries defined by the intersection of each plane with the faces of the cube have either a triangular or hexagonal shape.

20
HUE AND SATURATION IN THE HSI MODEL
View obtained by looking at the RBG cube down its gray-scale axis.
It is not unusual to see HSI planes defined in terms of a hexagon, a triangle, or even a circle.

21
TRIANGULAR AND CIRCULAR COLOR PLANES IN THE HSI MODEL
mid-point of the vertical intensity axis

22
CONVERTING COLORS FROM RGB TO HSI
if B Gwith
if B > G
2/12
1
))(()(
)()(2
1
cosBGBRGR
BRGR
360
)],,[min()(
31 BGR
BGRS
H
)(3
1BGRI
The RBG values have been normalized to the range [0,1].
Can be normalized to the range [0,1] by diving all the values by 360.

23
CONVERTING COLORS FROM HSI TO RGB
The HSI values are given in the interval [0,1].
The applicable equations depend on the values of H.
RG sector (00 H < 1200):
)1( SIB
)60cos(
cos1
0 H
HSIR )(3 BRIG
GB sector (1200 H < 2400): first subtract 1200 from it.
)1( SIR
)60cos(
cos1
0 H
HSIG )(3 GRIB
BR sector (2400 H 3600): first subtract 2400 from it.
)1( SIG
)60cos(
cos1
0 H
HSIB )(3 BGIR

24
PSEUDO-COLOR IMAGE PROCESSING
Pseudo-color image processing: assignment of colors to gray values based on a specified criterion.
The principal use of pseudo-color is for human visualization and interpretation of gray-scale events in images.
A principal motivation for using color is that humans can discern thousands of color shades and intensities!
Intensity slicing and color coding is a simple example of pseudo-color image processing.
The image is a 3-D function.
Planes parallel to the coordinate plane are used.
More general transformations achieve a wider range of pseudo-color enhancement results.

25
INTENSITY SLICING
A different color is assigned to each side of the plane.
Algorithm:
[0,L-1]: gray-scale
L0: blacklL-1: white
P planes: l1,l2,…,lP
P planes partition the gray-scale into P+1 intervals: V1,V2,…,VP+1
Color assignments:
f(x,y) = ck if f(x,y) Vk

26
INTENSITY SLICING INTO 8 COLORS
A different color is assigned to each region without regard for the meaning of the gray levels in the image.

27
INTENSITY SLICING INTO 2 COLORS
When there is a porosity or crack in a weld, the full strength of the X-rays going through the object saturates the sensor on the other side of the object.
Hence, gray levels of value 255 in an 8-bit image coming from such a system automatically imply a problem with the weld!
If a human is the ultimate judge in inspecting welds, this simple color coding would result in lower error rates!

28
INTENSITY SLICING INTO 2 COLORS
Average monthly rainfall over a period of 3 years
Much easier to interpret

29
3 INDEPENDENT COLOR TRANSFORMATIONS

30
PSEUDO-COLOR ENHANCEMENT: AN EXAMPLE
Why do we have the same color for the explosives and background?
Why do we have the same color for the explosives and garment bag?

31
COMBINATION OF SEVERAL MONOCHROME IMAGES INTO A SINGLE COLOR COMPOSITE

32
3 MONOCHROME IMAGES ARE COMBINED
visible blue
visible redvisible green
near infrared
First 3 images are combined into an RGB image
Red component was replaced with the infrared image
Note that the infrared band is strongly responsive to the biomass components in a scene

33
COMBINING IMAGES FROM A SPACECRAFT
This image was obtained by combining several of the sensor images from the Galileo spacecraft.
One way to combine the sensed image data is by how they show differences in surface chemical composition.
Bright red depicts material newly ejected from an active volcano.
Surrounding yellow materials are older sulfur deposits.

34
BASICS OF FULL-COLOR IMAGE PROCESSING
Two major categories of full-color IP approaches
Each component image is processed individually, and a composite color image is formed from the components.
Color pixels (which are vectors) are directly processed.
Two conditions have to be satisfied for per-color-component and vector-based processing to be equivalent.
The process has to be applicable to both scalars and vectors.
The operation on each component of a vector must be independent of the other components.
Example:
Suppose the process is neighborhood averaging.
Same result would be obtained using the scalar and vector methods.

35
COLOR TRANSFORMATIONS - FORMULATION
g(x,y) = T[f(x,y)]: pixels values are triplets or quartets.
si = Ti(r1,r2,…,rn):
si and ri: variables denoting the color components
{T1,T2,…,Tn}: set of transformation functions
For RGB color space, n=3.
For CMYK color space, n=4.
Example:
g(x,y)=kf(x,y), 0<k<1: intensity modification
Any color space can be used.
HSI color space: s3=kr3, s1=r1, s2=r2
RGB color space: si=kri, i=1,2,3
CMY color space: si=kri+(1-k), i=1,2,3
In this case, although the HSI transformation involves the fewest # of operations, the computations required to convert an RGB or CMY(K) image more than offsets the advantages!

36
COLOR-SPACE COMPONENTS OF A FULL-COLOR IMAGE
CMYK
RGB
HSI

37
MODIFIED INTENSITY OF THE FULL-COLOR IMAGE

38
COLOR COMPLEMENTS
The hues directly opposite one another on the color circle are called complements.
Complements are analogous to gray-scale negatives: they are useful in enhancing detail embedded in dark region of a color image.
The RGB complement transformation functions used here do not have a straightforward HSI color space equivalent.

39
COLOR SLICING
Highlighting a specific range of colors in an image is useful for separating objects from their surroundings.
The most straightforward approach is to extend the gray-level slicing techniques.
si = Ti(r1,r2,…,rn): si is a function of all ri.
Colors of interest are enclosed by a cube:
0.5 if [|rj – aj| > W/2]any 1jn
si = i = 1,2,…,nri otherwise
Colors of interest are enclosed by a sphere:
0.5 if (rj – aj)2 > (R0)
2
si = i = 1,2,…,nri otherwise
The width of the cube and the radius of the sphere were determined interactively.

40
AN EXAMPLE OF COLOR SLICING
Reds within anRGB cube
Reds within anRGB sphere
Edible parts of the strawberries are separated!
In each of the 2 cases below, a prototype red with RGB color coordinate (0.6863,0.1608,0.1922) was selected from the most prominent strawberry.
41
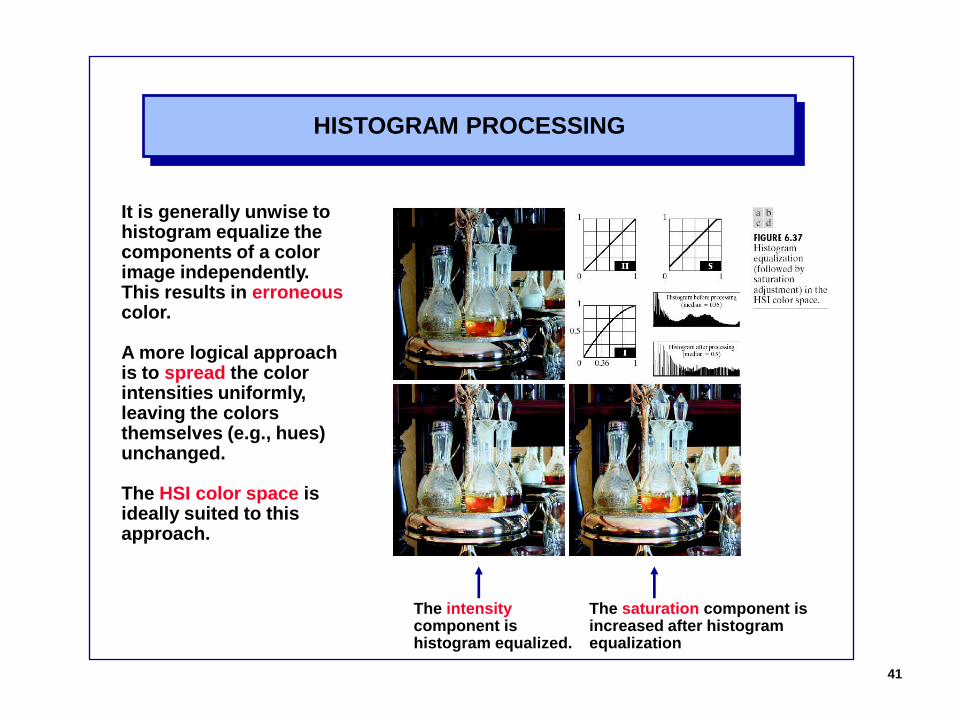
HISTOGRAM PROCESSING
It is generally unwise to histogram equalize the components of a color image independently. This results in erroneouscolor.
A more logical approach is to spread the color intensities uniformly, leaving the colors themselves (e.g., hues) unchanged.
The HSI color space is ideally suited to this approach.
The intensitycomponent is histogram equalized.
The saturation component is increased after histogram equalization

42
COLOR IMAGE SMOOTHING
xySyx
yxRK ),(
),(1
xySyx
yxGK ),(
),(1
xySyx
yxBK ),(
),(1
xySyx
yxcK
yxc),(
),(1
),(
),( yxc
Smoothing by neighborhood averaging can be carried out using either individual color planes or the RGB color vectors.

43
AN RGB IMAGE AND ITS COLOR PLANES

44
HSI PLANES

45
SMOOTHED IMAGES
By smoothing only the intensity plane, the pixels in the smoothed image maintain their original hue and saturation – and their original color!

46
COLOR IMAGE SHARPENING
)],([2 yxc
),(2 yxR
),(2 yxG
),(2 yxB
The Laplacian
The Laplacian of a full-color image can be obtained by computing the Laplacian of each component plane separately.

47
SHARPENED IMAGES
Obtained by combining the Laplacian of the intensity plane with the unmodified hue and saturation planes.

48
COLOR SEGMENTATION IN HSI COLOR SPACE
Assume we want to segment an image based on color, and to carry out the process on individual planes.
HSI space:
Hue plane conveniently represents the color.
Saturation plane is used as a masking image.
Intensity plane is seldom used because it carries no color information.
The binary mask is generated by thresholding the saturation plane with T = 0.1x(maximum value in the saturation plane).
The product image is thresholded with T = 0.9

49
COLOR SEGMENTATION IN RGB COLOR SPACE
RGB color vectors generally result in better segmentation results.
A set of sample points representative of the colors of interest is given.
Obtain an estimate of the average color that will be segmented.
Classify each pixel in the given image with according to the specified range.
One measure of similarity is the Euclidean distance:
D(z,a) = ||z-a|| = [(z-a)T(z-a)]1/2 = [(zR-aR)2 + (zG-aG)2 + (zB-aB)2]1/2
D(z,a)D0 D(z,a)=[(z-a)TC-1(z-a)]1/2D0 Computationally much simpler!

50
AN EXAMPLE OF COLOR SEGMENTATION IN RGB COLOR SPACE
Compute the mean vector a using the points contained within the rectangle.
Center the box at a.
Compute the standard deviation of the R,G,B values of the sample points.
Determine the dimension along each axis by computing 1.25xSD.
R: SD of red components
Dimension along the R-axis:
(aR – 1.25R) to (aR + 1.25R)

51
COLOR EDGE DETECTION
The gradient introduced in Chapter 3 is not defined for vector quantities.
So, computing the gradient on individual planes, and then using the results to form a color image will lead to erroneous results.
We need to define the gradient for c(x,y) = [R(x,y) G(x,y) B(x,y)]T
A method has been proposed by Di Zenzo in 1986:
Direction of max rate of change:
Value the rate of change:
)
1
(
2tan
2
1
yyxx
xy
gg
g
2
1
2sin22cos)()(2
1)(
xyyyxxyyxx gggggF

52
AN EXAMPLE OF COLOR EDGE DETECTION USING 2 APPROACHES
Both approaches yielded reasonableresults. Is the extra detail worth the added computational burden of the vector approach?
The edge detail is more complete!

53
COMPONENT GRADIENT IMAGES

54
NOISE IN COLOR IMAGES
The noise models discussed in Chapter 5 are applicable to color images.
Gaussian noiseRayleigh noiseErlang noiseExponential noiseUniform noiseImpulse (salt and pepper) noise
Usually, the noise content of a color image has the same characteristics in each color channel.
However, it is possible for color channels to be affected differently by noise.

55
GAUSSIAN NOISE IN A COLOR IMAGE
Fine grain noise tends to be less noticeable in color images.

56
NOISY RGB IMAGE CONVERTED TO HSI
Compare
The degradation in hue and saturation planes is due to the nonlinearity of cos and min operations!
The intensity plane is slightly smoother than any of the 3 RGB noisy planes.
)(3
1BGRI
Image averaging reducesrandom noise!

57
ONE NOISY RGB CHANNEL AFFECTS ALL HSI PLANES
The noise spreads from the green channel to all the HSI planes.

58
COLOR IMAGE COMPRESSION
Compression reducesthe amount of data required to represent a digital image.
The data that are the object of any compression are the components of each color pixel.
Compressed with JPEG 2000.
The compressed image contains only 1 data bit for every 230 bits of data in the original image.


![FLEXURAL INTENSITY MEASUREMENT ON FINITE PLATES …...Pavic's formulae [2]. This approach enabled them to determine both structural and acoustic intensities through sound pressure](https://static.fdocuments.net/doc/165x107/60e53a8cab45097ab854d7c0/flexural-intensity-measurement-on-finite-plates-pavics-formulae-2-this-approach.jpg)