CHAPTER 6: Decadal Erosion Rate Controls - Introduction 118m.rezaeian/thesis/eroison...
70
CHAPTER 6: Decadal Erosion Rate Controls - Introduction 118 6-1 Motivation Erosion interacts with tectonic and climatic processes to shape the topography of active mountain belts. Compressional orogens with the highest rates of rock uplift have the highest rates of denudation. Their uplift rates are controlled by erosion through an isostatic response mechanism. This interplay of tectonic uplift and erosion is affected by local climate, vegetation, steepness of the topography and erodibility of the rock mass (e.g., Koons, 1987; Pinter & Brandon, 1997; Willett, 1999). Of these, climate is often thought to be the dominant variable, while vegetation and substrate strength are commonly assumed to be of secondary importance, and held constant in geodynamic models. However, due to the influence of vegetation as a function of precipitation, the relationship between rainfall and erosion is nonlinear and complex. Decadal average erosion rates are known for many catchments in the Alborz Mountains (Chapter 5). Erosion rates vary across the mountain belt, but not in the simple way expected from consideration of the pattern of precipitation. The north flank of the mountain belt has annual precipitation totals far outstripping those on the south flank, but erosion rates peak in the south. It is evident that other factors control the pattern of erosion in the Alborz. In this chapter, these controls will be investigated. Specifically, I have quantified precipitation, runoff, stream power, vegetation cover, slope, and relief, and substrate properties, and normalized these factors where possible. The complex interactions between these potential controls make it difficult to quantify the erosional effects of individual factors with precision; therefore, non-linear correlations with thresholds are characteristic of decadal erosion and its controls. Using dimensionless normalized values, makes it possible to compare different entities statistically and investigate the interaction between them. Special attention has been paid to the seasonality of precipitation and runoff which reflects not only the erosive impact of rainstorms in wet seasons, but also the attenuating effects of seasonally changing vegetation (e.g., Douglas, 1967). Seismicity has not been considered in detail. Although recent, large earthquakes have caused significant mass wasting in the Alborz Mountains, insufficient data is at hand to evaluate the relation between erosion and seismicity quantitatively. Rezaeian M., 2008, Coupled tectonics, erosion and climate in the Alborz Mountains, Iran. PhD thesis, University of Cambridge; 219 p. Rezaeian M., 2008, Coupled tectonics, erosion and climate in the Alborz Mountains, Iran. PhD thesis, University of Cambridge; 219 p.
Transcript of CHAPTER 6: Decadal Erosion Rate Controls - Introduction 118m.rezaeian/thesis/eroison...

CHAPTER 6: Decadal Erosion Rate Controls - Introduction
118
6-1 Motivation
Erosion interacts with tectonic and climatic processes to shape the topography of active mountain
belts. Compressional orogens with the highest rates of rock uplift have the highest rates of denudation. Their
uplift rates are controlled by erosion through an isostatic response mechanism. This interplay of tectonic
uplift and erosion is affected by local climate, vegetation, steepness of the topography and erodibility of the
rock mass (e.g., Koons, 1987; Pinter & Brandon, 1997; Willett, 1999). Of these, climate is often thought to be
the dominant variable, while vegetation and substrate strength are commonly assumed to be of secondary
importance, and held constant in geodynamic models. However, due to the influence of vegetation as a
function of precipitation, the relationship between rainfall and erosion is nonlinear and complex.
Decadal average erosion rates are known for many catchments in the Alborz Mountains (Chapter 5).
Erosion rates vary across the mountain belt, but not in the simple way expected from consideration of the
pattern of precipitation. The north flank of the mountain belt has annual precipitation totals far outstripping
those on the south flank, but erosion rates peak in the south. It is evident that other factors control the pattern
of erosion in the Alborz. In this chapter, these controls will be investigated. Specifically, I have quantified
precipitation, runoff, stream power, vegetation cover, slope, and relief, and substrate properties, and
normalized these factors where possible. The complex interactions between these potential controls make it
difficult to quantify the erosional effects of individual factors with precision; therefore, non-linear
correlations with thresholds are characteristic of decadal erosion and its controls. Using dimensionless
normalized values, makes it possible to compare different entities statistically and investigate the interaction
between them. Special attention has been paid to the seasonality of precipitation and runoff which reflects not
only the erosive impact of rainstorms in wet seasons, but also the attenuating effects of seasonally changing
vegetation (e.g., Douglas, 1967).
Seismicity has not been considered in detail. Although recent, large earthquakes have caused
significant mass wasting in the Alborz Mountains, insufficient data is at hand to evaluate the relation between
erosion and seismicity quantitatively.
Rezaeian M., 2008, Coupled tectonics, erosion and climate in the Alborz Mountains, Iran. PhD thesis, University of Cambridge; 219 p.
Rezaeian M., 2008, Coupled tectonics, erosion and climate in the Alborz Mountains, Iran. PhD thesis, University of Cambridge; 219 p.

CHAPTER 6: Decadal Erosion Rate Controls-Statistical Approaches
119
6-2 Statistical Approaches
6-2-1 Introduction
Data on erosion and potential controls comes in different formats and resolutions. Erosion rates
have been calculated from at-a-station hydrometric measurements, resulting in catchment-wide average
values. Similarly, meteorological data are for specific stations, but these stations are different in number
and location from the nodes in the hydrometric network. In contrast, topographic data, and proxies for
vegetation density are remote sensed, with spatially continuous and uniform coverage. These variables
can be assessed within individual cells of a grid covering the entire mountain belt. Geomechanical
properties, on the other hand, are inferred from geological maps, without a robust calibration. These
properties are grouped in broad classes, and can not be quantified on a graded scale.
This diversity of data format and density makes a direct comparison between variables difficult.
The first challenge, therefore, is to homogenise the data. This can be done by compounding all available
data into representative values for geographic units. The unit of choice is the catchment, specifically the
drainage basins with a hydrometric station. Alternatively homogenisation can be achieved by
extrapolation of at-a-station data to a full grid of estimated values. Both approaches have limitations and
advantages. In this study, I have combined them to obtain complementary results.
Any analysis of multiple, inter-related variables in a large domain is likely to be hostage to spatial
complexity and the interference of individual effects. This limits the degree of certainty with which
individual controls and responses can be identified and quantified, and has caused a large part of observed
variance in erosion rates in other studies to remain unexplained (cf., Dadson et al., 2003). By segregating
data into geographic domains with a reduced heterogeneity of selected variables, for example lithology or
vegetation, it is possible to isolate the effects of other variables on erosion. I have studied erosion and its
forcing on the scale of the integral Alborz Mountains, but I have also split available data into a northern
and a southern domain, defined as the north and south flank of the mountain belt, respectively, in the hope
that this would result in a better resolution of the mechanisms of erosion.
It is clear from results presented in Chapter 5 that erosion of the Alborz Mountains is highly
seasonal. It does, therefore, make sense to look not only at annual average values of variables, but also at
seasonal variability. Deeper levels of temporal complexity, rich as they may be, have not been tapped in
this study.
6-2-2 Homogenisation
The process of translating or extrapolating information from fine to coarse scales is usually referred to as
up-scaling, and the reverse process is down-scaling. Among four general methods for the rescaling of data
as identified by King (1991), I have applied Lumping to compound girded data into characteristic values
for geographic units, i.e., up-scaling, and Direct Extrapolation to obtain girded values from at-a-station
data, i.e. down-scaling.
Lumping is the simplest method for up-scaling by which coarse-scale mean values are derived from
averaging fine-scale, often pixelated variables, such as vegetation density, slope, relief, and precipitation.
Lumping assumes that the mathematical formulation of processes in fine-scale models remains valid at
Rezaeian M., 2008, Coupled tectonics, erosion and climate in the Alborz Mountains, Iran. PhD thesis, University of Cambridge; 219 p.

CHAPTER 6: Decadal Erosion Rate Controls-Statistical Approaches
120
coarser scales, or that larger scale systems behave in the same, or a similar way as the average fine-scale
system. This assumption holds only if the equations that describe the system are linear. Lumping is
known to lead to considerable bias, because it doesn’t account for temporal or spatial variability in
processes and ignores non-linear changes with scale (Rastetter et al., 1992).
In this study, the geographic unit for lumping is the catchment. This choice is dictated by the nature of the
data on erosion and sediment transport, which has been collected at hydrometric stations. Therefore,
catchment-wide average values of all other variables have been calculated for all gauged catchments.
Lumped data can be analysed with or without regard for the size of the catchment. It can be argued that
the weight of a data point should be determined by the size of the area to which it applies. The simplest
weighting scheme therefore uses a direct proportionality of data weight to catchment size. It has been
applied in this study. In recognition of the fact that this is not necessarily the most robust weighting
strategy, and in the absence of an established protocol, catchment data have also been considered in un-
weighted format.
Lumping methods are notorious for their suppression of spatial heterogeneity and its effect on response
variables (Turner, 1989). These methods do not effectively exploit the potential of the data sets with the
finest spatial scales in a larger ensemble. To do this, coarser data sets must be artificially refined. Direct
extrapolation is the simplest way of achieving this. In this method, the catchment-wide average value of a
variable, as assessed from at-a-station measurements, is assigned to each cell of a geographic grid that is
located entirely within that catchment. Cells straddling one or more catchment boundaries are assigned a
value equivalent to the average of catchment values weighted for the relative extent of the different
catchments within the cell. In this way, a full grid of values is obtained. More sophisticated extrapolation
schemes would apply smoothing strategies. In the absence of an established protocol, I have applied a
direct extrapolation strategy in this study.
6-2-3 r-Squared Value
I have investigated the forcing and mechanisms of erosion in the Alborz Mountains by constraining the
relationships between erosion and individual forcing factors. The strength of these relations has been
evaluated by means of the r-squared measure.
r-squared is a statistical measure of how well a regression line approximates real data points. It is
a descriptive measure with values between zero and one, indicating how good one term is at predicting
another. An r-squared of 1.0 (100%) indicates a perfect fit. The formula for Pearson’s product-moment
correlation coefficient, r is:
r(X,Y) = [ Cov (X,Y) ] / [ StdDev (X) . StdDev (Y) ] (6.2.1)
where X and Y are two independent variables, Cov is the covariance of these variables, and StdDev is the
standard deviation of a given variable. r-squared values have been calculated for linear and non-linear
best fits to the data, and are given for each pairing.
Rezaeian M., 2008, Coupled tectonics, erosion and climate in the Alborz Mountains, Iran. PhD thesis, University of Cambridge; 219 p.

CHAPTER 6: Decadal Erosion Rate Controls - Precipitation
121
6-3 Precipitation
6-3-1 Introduction
Precipitation is involved in many different erosion mechanisms. Rain splash may detach loose
particles from Earth’s surface. Soil detachment and transport by rain splash is usually the first step in soil loss
and sediment transport. Directionality of drop impacts can give rise to a net displacement of mass, and
rainfall on hill slopes drives a down slope flux of sediment because ballistic path length is greatest in that
direction. Rainfall is partitioned into infiltration and runoff. Infiltration feeds seepage flow, which may cause
formation of erosional pipes in substrates. It also sets up gradients in pore water pressure, increases the
weight of permeable substrate and decreases its cohesion. Together, these effects can cause slope failure, and
down slope displacement of large volumes of sediments.
Water that doesn’t infiltrate accumulates at the surface, forming runoff on hill slopes. Once depth and
velocity of flow are sufficient to overcome to the strength of the substrate, erosion occurs. Runoff
concentration in channels enables rivers to carry sediment, and to erode valley deposits and bedrock.
Precipitation may fall in the form of snow. Although snow fall in itself is not erosive, it can cause eroding
avalanches, and spring melt of substantial snow packs may create erosive river discharges. A portion of
rainfall evaporates, and vegetation may act to intercept raindrops, transferring water to the surface by gentle
stem flow. These mechanisms can complicate simple relationship between rainfall, runoff and erosion.
The spatial and temporal distribution of precipitation in mountain belts is influenced by: i) The
synoptic weather systems, and ii) Orography. A brief summary of orography is given, followed by a summary
of the synoptic weather system of north Iran.
Mountain ranges have distinct orographic precipitation patterns. These are thought to control patterns
of erosion and rock exhumation on geological time scales, and can have profound effects to shape the
mountain ranges and their tectonic regime through asymmetric erosion (e.g., Beaumont et al. 1992, Willett,
1999, Reiners et al. 2003; Roe, 2005).Moist air rising over a topographic barrier expands, causing its capacity
to retain moisture to decrease. Simultaneously, the air cools and water vapour condensates, forming droplets.
Together, these two mechanisms drive precipitation on mountain flanks facing into predominant air streams.
The distribution of orographic precipitation is set by the steepness of the topographic front and the velocity of
atmospheric flow across it. Often, rising air has dried before it reaches the orogen ridge pole, and orographic
precipitation maxima may be located well away from the topographic divide. Across the divide, the air mass
can fall with reverse orographic effects, and a rain shadow results (e.g., Browning & Hill, 1981; Roe, 2005).
Air can also flow around a topographic obstacle. Blocking of atmospheric flow leads to range-
parallel flow towards areas with lower topography, typically at the tips of mountain ranges (e.g., Medina &
Houze, 2003). In such cases, precipitation does not penetrate deep into mountain belts, but precipitation rates
may be high at the leading edge of the mountain topography. Flow of moist air along a mountain front causes
advection of water vapour into certain corridors, where precipitation rates may be untypically high as a result.
Rezaeian M., 2008, Coupled tectonics, erosion and climate in the Alborz Mountains, Iran. PhD thesis, University of Cambridge; 219 p.

CHAPTER 6: Decadal Erosion Rate Controls - Precipitation
122
6-3-2 Climate Synopsis
The major mountain ranges of the Alborz and Zagros play an influential role in temporal and spatial
distribution of precipitation across the Iranian plateau. Only limited amounts of moist air penetrate Iran from
different sources and water vapour flux is restricted by the geographic distribution of nearby water masses.
Precipitation mainly originates from the Mediterranean Sea, Black Sea, and Caspian Sea. The Red Sea and
Persian Gulf-Oman Sea provide moisture to the air masses entering the country from the south west (e.g.,
Khalili, 1984; Alijani & Harman, 1985; Nazemosadat & Cordery, 2000).
The average annual precipitation on the Iranian plateau is around 250 mm, giving rise to an arid to
semi-arid climate in Iran, except in mountain areas exposed to moist air masses. The Caspian Sea is a major
source of moisture for north Iran and the Caspian lowlands are the wettest part of Iran with annual
precipitation in excess of 1000mm. In this region, the precipitation is a direct function of evaporation in the
Caspian basin, which is most intense in summer. As a result, summers are wet on the Caspian coast, and the
adjacent highlands.
The mountain slopes of the northwest Zagros and the southwest Alborz receive a considerable
amount of orographic precipitation (Alijani & Harman, 1985; Nazemosadat & Cordery, 2000). It is associated
with an eastward propagating, mid-latitude cyclonic system from the Mediterranean region, which produces
heavy winter precipitation across much of Iran (Martyn, 1992). This system accounts for up to half of the
total annual precipitation in Iran (Alijani et al., 2007). Most of the incoming water vapour is intercepted by
the high mountain ranges of the region, while the interior high plains receive only a small amount of
precipitation. In winter, precipitation falls as snow at higher elevations (Syed et al., 2006).
In summer, Mediterranean cyclonic systems affect only the north-western, north-eastern, and Caspian
regions (Alijani & Harman, 1985). Due to the southward shift of the global pressure belts in winter in the
northern hemisphere (Barth & Steinkohl, 2004); they affect the whole country in winter. Spring is a transition
from wet winter to dry summer (Alijani & Harman, 1985).
Annual rainfall variability is high in the arid and semi-arid regions, with values of the coefficient of
variation of precipitation ranging from 18% in the north-west of the Alborz to 50% in south-east of the
mountains (Dinpashoh et al., 2004; Modarres & Silva, 2007).
6-3-3 Climate of the Alborz Mountains
6-3-3-1 Direction of Air Flow
The rainfall in the Caspian lowland has long been thought to be due to orographic lifting of unstable
air arriving from the Caspian Sea (Ganji, 1968). However, Khalili (1973) explained the south Caspian
precipitation pattern based on a cyclonic mechanism involving air moving from a high pressure center over
Siberia. A branch of the air flow crosses the Caspian Sea from NE to SW and precipitation occurs as a result
of thermodynamic destabilization of the Siberian cold air as it crosses the warmer sea surface.
Rezaeian M., 2008, Coupled tectonics, erosion and climate in the Alborz Mountains, Iran. PhD thesis, University of Cambridge; 219 p.

CHAPTER 6: Decadal Erosion Rate Controls - Precipitation
123
The dominant direction of airflow can be seen from wind direction data catalogued by the NCEP
(National Centers for Environmental Prediction), and published by NOAA’s climate program office. This
catalogue contains monthly average wind directions for 2.5 x 2.5 degree grid cells, calculated based on data
for 1970-2001.
In the southern Alborz, autumn and winter winds are to the NE, while spring and summer winds are
to the SW. In the northern Alborz and the Caspian coast, wind directions are more variable. In summer, and
to a degree in autumn, winds are from the NE; winter winds are from the E, and in spring from the N. Air
flow from the Caspian basin is blocked by high topography of the central Alborz, and water vapour is
advected westward along the mountain front during much of the year. As the topographic barrier curves
around the SW tip of the Caspian basin, it occludes the lateral air flow and forces high precipitation rates.
Given the orientation and curvature of Alborz Mountains around the South Caspian Basin, the
dominant northeast - southwest air flow produces a main flow parallel to the east Alborz and perpendicular to
the mountain belt in the west.
6-3-3-2 Spatial Distribution
The Alborz Mountains are the major highland of northern Iran. They are a boundary between the
coastal plains of the Caspian region, with humid or sub-humid climate, and the Central Iranian Plateau, with
arid or semi-arid climate. This produces a sharp gradient in precipitation across the mountain range. I have
used daily precipitation data from 411 meteorological stations operated by the Ministry of Energy of Iran
measured over a period of 2-33 years (TAMAB, unpublished data), and monthly precipitation totals from 466
stations operated by the Iranian Meteorological Organization (IRIMET, http://www.irimet.net/) over a period
of 2-40 years (Fig. 6.3.1), to determine the spatial pattern of annual precipitation across the Alborz
Mountains.
Fig. 6.3.1: Total annual precipitation in the Alborz, derived from 877 meteorological stations.
Locations of weather stations operated by TAMAB and IRIMET in northern Iran are shown as white circles.
Rezaeian M., 2008, Coupled tectonics, erosion and climate in the Alborz Mountains, Iran. PhD thesis, University of Cambridge; 219 p.

CHAPTER 6: Decadal Erosion Rate Controls - Precipitation
124
Figure 6.3.1 shows the spatial pattern of the total annual precipitation. It ranges from 85 mm in the
southeastern Alborz up to 1800 mm in the western Caspian plain, and precipitation rates decrease from west
to east and from north to south.
The west-southwest and east-southeast sectors of the mountain belt have least annual precipitation
(<300 mm) while the south-central Alborz near northern Tehran and Karaj and the highlands of the main
divide have higher precipitation totals (600 mm/yr) than adjacent sectors in the south flank of the mountain
belt. Low precipitation totals are not limited to the southern Alborz: some areas such as the Haraz valley to
the north of Damavand (Fig. 3.1 for location) receive <400mm/yr. Thus, the precipitation pattern of the
Alborz reflects the mode of air flow in the region.
6-3-3-3 Precipitation Cross Sections
Precipitation gradients across the mountain belt have been investigated along nine N-S cross sections:
Talesh, Sefid Rud, Shah Rud, Taleqan, Chalus, Tehran, Haraz, Firuz Kuh (Talar), Neka (Fig. 6.3.2 & 6.3.3).
AFT data along most of these sections have been reviewed in Chapter 2 (Section 2-2-15-5-3).
Fig. 6.3.2: Location map of cross sections overlaid on the total annual precipitation map of the Alborz.
The distribution of annual precipitation totals across the mountain belt has some common patterns, as
well as along-strike differences. In the south flank of the mountain belt, precipitation rates are lowest (<200
mm/yr) at the mountain front and in the adjacent interior. Throughout the south, precipitation rates increase
steadily with elevation of the topography in a strong orographic pattern. Precipitation rates peak on high
ridges, and drop dramatically beyond these barriers in intramontane basins and longitudinal valleys. The
highest precipitation rates in the south flank are found in the central Chalus, Tehran and Haraz sections,
where the main divide is highest. Away from the highest topography, orography of the southern Alborz is
Rezaeian M., 2008, Coupled tectonics, erosion and climate in the Alborz Mountains, Iran. PhD thesis, University of Cambridge; 219 p.

CHAPTER 6: Decadal Erosion Rate Controls - Precipitation
125
Chalus
200
400
600
800
1000
1200
Ann
ua
l pre
cip
itatio
n (m
m)
0 20 40 60 80 100 120
0
1000
2000
3000
4000
Ele
va
tion
(m
)
Kilometer south
Talesh
0 10 20 30 40 50 60 70
Kilometer west
200
400
600
800
1000
1200
An
nu
al p
recip
itatio
n (m
m)
0
500
1000
1500
2000
2500
Ele
va
tion
(m
)
Sefid Rud
200
400
600
800
1000
1200
1400
1600
1800
2000
Ann
ua
l pre
cip
itatio
n (m
m)
0 20 40 60 80 100 120 140
0
500
1000
1500
2000
2500
3000
Ele
vation
(m
)
Kilometer south
Tehran
Kilometer south
200
400
600
800
1000
1200
Ann
ua
l pre
cip
itatio
n (m
m)
0 20 40 60 80 100 120
0
500
1000
1500
2000
2500
3000
3500
4000
4500
Ele
va
tio
n (
m)
weaker. Although individual ridges are associated with elevated precipitation rates, a general, increasing
trend at the scale of the mountain belt is less pronounced in the peripheral areas.
In northern flank of the mountain belt, precipitation rates increase with elevation only in the Sefid
Rud, Shah Rud and Taleqan sections of the western Alborz. Further east, precipitation rates are highest in the
coastal plain, decreasing steadily towards the mountain belt interior.
However, where sufficient data are available for the high mountains, precipitation rates appear to increase
again on the northern rise to the main divide.
In north flank of the Alborz, total annual precipitation is anti-correlated with altitude; it is the highest
in the coastal plain and decreases with altitude with a gradient of 22-68 mm of rain per 100 meters (e.g.,
Khalili, 1973). This pattern is observed along the Chalus, Tehran and Haraz sections.
This general pattern is violated where the coastal plain is wide. Two main epicenters of high
precipitation are observed around the Sefid Rud and Talar-Tajan alluvial fans far from the coast in the west
and central-eastern part of coastal plain, respectively. Both are located upwind from major barriers (Medina
& Houze, 2003), and an ascending trend in the precipitation-altitude relation is observed in these sections.
The precipitation gradient is 24-28 mm per 100 m, with a zone of maximum precipitation at around 2000 to
2400 m (e.g., Khalili, 1973). This pattern is considered as a uniform precipitation enhancement by altitude.
Taleqan
200
400
600
800
1000
1200
1400
Ann
ua
l pre
cip
itatio
n (m
m)
0 20 40 60 80 100 120 140
0
1000
2000
3000
4000
Ele
va
tion
(m
)
Kilometer south
Shah Rud
0
200
400
600
800
1000
1200
1400
1600
An
nu
al p
recip
itatio
n (m
m)
0 20 40 60 80 100 120 140
0
500
1000
1500
2000
2500
3000
3500
4000
Ele
va
tion
(m
)
Kilometer south
Rezaeian M., 2008, Coupled tectonics, erosion and climate in the Alborz Mountains, Iran. PhD thesis, University of Cambridge; 219 p.
CHAPTER 6: Decadal Erosion Rate Controls - Precipitation
126
Haraz
200
400
600
800
1000
Ann
ual p
recip
itatio
n (m
m)
0 20 40 60 80 100 120 140 160
0
1000
2000
3000
4000
5000
6000
Ele
vatio
n (
m)
Kilometer south
Fig. 6.3.3: Topography and annual precipitation along nine cross sections (for location see Fig.
6.3.2). Maximum, minimum, and mean elevation within a 20-km-wide swath oriented perpendicular to the
strike of the Alborz Mountains are shown in grey. Average annual precipitation shown in blue. Error bars
show 2σ interval .
6-3-3-4 Transverse and Longitudinal Valleys
Transverse valleys are conspicuous as they cut across tectonically controlled geological structures
forming pronounced gorges or canyons through prominent topographic barriers (e.g., Alvarez, 1999). In
Figure 6.3.1, high rainfall totals along the main transverse valleys of Chalus, Haraz and Talar illustrate the
role of deep trunk valleys, admitting water vapour from the north deep into the mountain interior. Transverse
valleys act as conduits for wet front transport in mountain belts, and as a result, the have greater precipitation
totals than the surrounding areas (e.g., Thiede et al., 2004).
The Haraz valley forms a deep gorge with high relief (4000 m at Mount Damavand) in northern slope
of the Alborz. Its head waters are located close to southern mountain front, and the catchment occupies the
widest segment of the northern slope in the mountain belt. In its middle reaches, the Haraz River turns around
a major topographic barrier, Mount Damavand. This is where much of the water vapour pouring into the
mountain belt through this corridor, rains out. The precipitation profile along the Haraz valley (Fig. 6.3.3)
shows a high amount of precipitation (1000mm) in the coastal plain, decreasing into the mountain belt with a
minimum of 270 mm in the Baladeh longitudinal valley, and then rising again to 656 mm in the northern
slope of Mount Damavand. Damavand is too high to have high precipitation rates at its peak, as can be seen
from the drop in precipitation around the main divide in this section.
Longitudinal valleys define first-order topographic lows inside mountain belts. They tend to sit behind frontal
ridges that parallel the gross structural grain (Koons, 1995; Jamieson et al., 2004). These ridges constitute
Neka
0 20 40 60 80 100 120
0
500
1000
1500
2000
2500
3000
3500
Ele
va
tion
(m
)
Kilometer south-east
0
100
200
300
400
500
600
An
nu
al p
recip
itatio
n (m
m)
0
200
400
600
800
1000 An
nua
l pre
cip
itatio
n (m
m)
0 20 40 60 80 100 120 140 160
0
1000
2000
3000
4000
Ele
va
tion
(m
)
Kilometer south
Firuz Kuh
Rezaeian M., 2008, Coupled tectonics, erosion and climate in the Alborz Mountains, Iran. PhD thesis, University of Cambridge; 219 p.

CHAPTER 6: Decadal Erosion Rate Controls - Precipitation
127
200 400 600 800 1000 1200 1400 1600
0
100
200
300
400
500
600
700
800
900
Spring
Summer
Autumn
Winter
To
tal
se
as
on
al
pre
cip
ita
tio
n (
mm
)
Total annual precipitation (mm)
barriers to uprising air flow and generate rain shadows inside the mountain belt. Precipitation is suppressed
along interior valleys due to adiabatic heating and compression of descending air, but upslope enhancement
of the precipitation occurs over the windward valley slopes toward divide. The longitudinal valleys of Shah
Rud in the south-west and Baladeh in the northern slope of the mountain belt clearly show this precipitation
pattern. For the Shah Rud valley the effect is visible in three sections: Sefid Rud, Shah Rud and Taleqan
(marked on Fig. 6.3.3).
6-3-4 Seasonality of Precipitation
Daily precipitation data from the Ministry of Energy of Iran have been aggregated in average total
seasonal precipitation rates, across the Alborz. Winters have average precipitation of 171±65 mm, but spring
and summer, with average precipitation totals of 165±100 and 158±250 mm, respectively, are only
marginally drier. Autumn is considerably drier throughout the mountain belt with 74±70 mm rainfall.
However, these mountain belt averages hide significant shifts in the location of precipitation, borne out most
clearly in the large range of the summer averages.
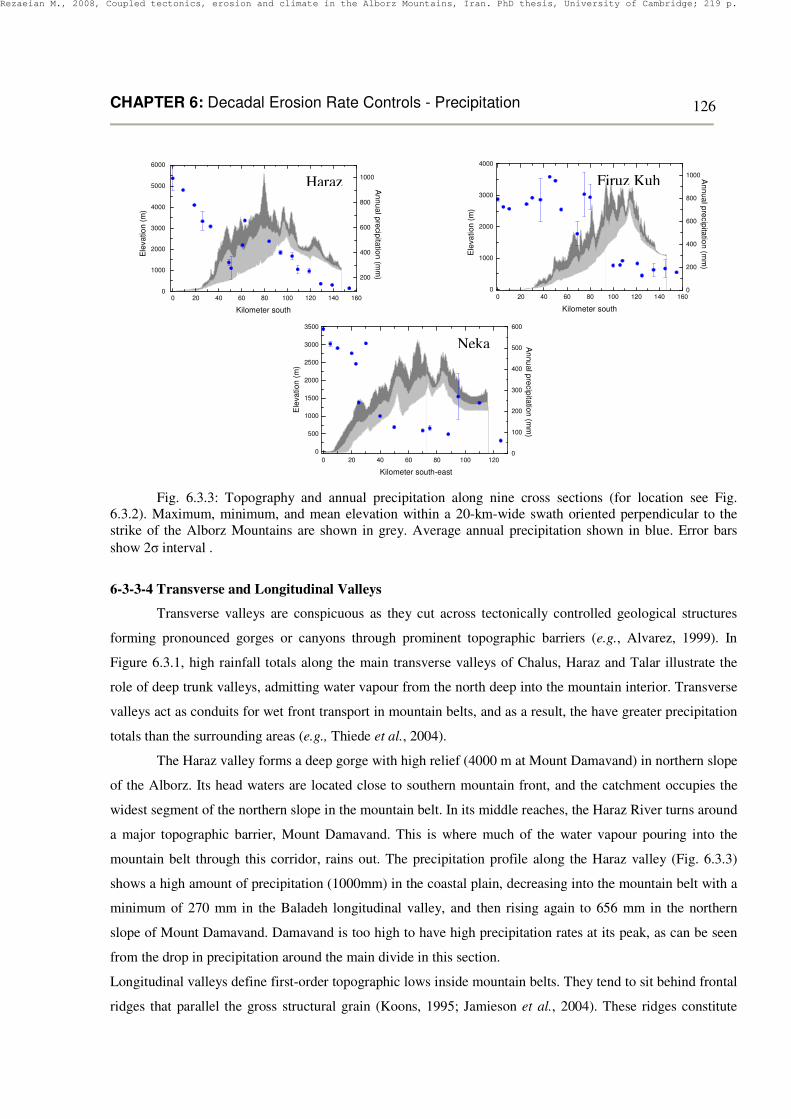
To explore the seasonality in more detail, total seasonal precipitation was plotted against total annual
precipitation for 411 weather stations in the Alborz Mountains (Fig. 6.3.4).
Fig. 6.3.4: Seasonal precipitation and annual precipitation, for 411 gauging stations, operated by
TAMAB. Bars show 2σ interval within binned annual precipitation.
Throughout the Alborz, autumn is the driest season, but the wettest season changes with the total
annual precipitation. In areas with relatively low annual precipitation totals, winter is the wettest season, with
significant additional rainfall in spring, while summers are very dry.
Across the mountain belt winter precipitation varies least, and in wetter areas, total annual
precipitation is increasingly dominated by summer rainfall. The cross-over from a winter/spring dominated
precipitation regime to a summer-dominated regime is at about 800 mm of precipitation per year.
Rezaeian M., 2008, Coupled tectonics, erosion and climate in the Alborz Mountains, Iran. PhD thesis, University of Cambridge; 219 p.

CHAPTER 6: Decadal Erosion Rate Controls - Precipitation
128
0 200 400 600 800 1000 1200 1400 1600 1800 2000
0.0
0.1
0.2
0.3
0.4
0.5
0.6
Spring
0 200 400 600 800 1000 1200 1400 1600 1800 2000
0.0
0.1
0.2
0.3
0.4
0.5
0.6
Summer
0 200 400 600 800 1000 1200 1400 1600 1800 2000
0.0
0.1
0.2
0.3
0.4
0.5
0.6 Autumn
To
tal se
aso
na
l p
recip
ita
tio
n n
orm
alize
d b
y t
ota
l a
nn
ua
l p
recip
ita
tio
n
Total annual precipitation (mm)
0 200 400 600 800 1000 1200 1400 1600 1800 2000
0.0
0.1
0.2
0.3
0.4
0.5
0.6
Winter
The trends are best illustrated by normalizing seasonal precipitation rates by the annual total
precipitation at a station (Fig. 6.3.5). Where annual total precipitation >800 mm, summer precipitation is 30-
50% of the total. Winter precipitation is ~40-65% of the annual total in drier areas where annual total
precipitation < 800mm. Spring proportions decrease slightly with increasing annual precipitation, while
autumn contribution increases marginally.
Fig. 6.3.5: Seasonal proportion of total annual precipitation in 411 meteorological gauging stations in
the Alborz.
Thus there is a sharp shift in seasonality between the dry (< 800 mm) and wet part of the mountain
belt (> 800 mm). The spatial pattern of wet seasons is illustrated in Figure 6.3.6. In the north flank of the
Alborz, summer is the wettest season with 30-50 % of the annual rain total. This seasonal bias is strongest in
the west of the mountain belt, and decreases to the east (Fig. 6.3.6a). The southern Alborz has a semi-
Mediterranean precipitation regime with dry summers and autumns, and precipitation peaking in winter as
snow and spring as rain (e.g., Khalili, 1973); winter precipitation makes up approximately 40-65 % of the
annual total in the areas where the precipitation is less than 800 mm per year (Fig. 6.3.6b).
The relative variability (average of the absolute deviations of the values above from their
mean) of seasonal precipitation proportions evolves with the annual total precipitation (Figure 6.3.7). When
normalized by the annual total precipitation, the variability of seasonal precipitation is greatest where the
annual total precipitation is smallest. The variability decreases steadily to a minimum of 0.07 at an annual
total precipitation of ~800 mm, and is approximately constant at that value in wetter areas.
Rezaeian M., 2008, Coupled tectonics, erosion and climate in the Alborz Mountains, Iran. PhD thesis, University of Cambridge; 219 p.

CHAPTER 6: Decadal Erosion Rate Controls - Precipitation
129
0 200 400 600 800 1000 1200 1400
0.05
0.10
0.15
0.20
Vari
ab
ilit
y o
f n
orm
alized
seaso
nal p
recip
itati
on
Total annual precipitation (mm)
Fig. 6.3.6: Proportion of annual precipitation during summer (a) and winter (b) in the Alborz,
estimated from daily precipitation data from 411 stations operated by TAMAB.
Fig. 6.3.7: Variability of normalized seasonal precipitation plotted against total annual precipitation,
for 411 meteorological gauging stations in the Alborz. Bars show 2σ interval within precipitations bins. (A
polynomial best fit to the data: y = 1E-07x2 - 0.0002x + 0.16 has R
2 = 0.19, and Pearson’s correlation
coefficient = -0.40).
(a)
(b)
Rezaeian M., 2008, Coupled tectonics, erosion and climate in the Alborz Mountains, Iran. PhD thesis, University of Cambridge; 219 p.

CHAPTER 6: Decadal Erosion Rate Controls - Precipitation
130
The spatial distribution of the seasonal normalized precipitation is shown in Figure 6.3.8, in which a
strong contrast is evident between north and south flank. The northern Alborz has low variability, decreasing
trend from west to east; the southern Alborz has high variability, especially in central-west regions. This
pattern is a function of the synoptic climate discussed in section 6.3.2. In the next section I explore the link
between precipitation and erosion.
Fig. 6.3.8: Variability of seasonal precipitation normalized by annual precipitation in the Alborz,
estimated from daily precipitation data from 411 stations operated by TAMAB.
6-3-5 Precipitation and Erosion
6-3-5-1 Annual Total Precipitation and Erosion
Three statistical approaches, lumping without weighting, lumping with weighting and direct
extrapolation have been applied to constrain the correlation between total annual and seasonal precipitation,
and erosion in the Alborz Mountains.
Lumped un-weighted total annual precipitation for catchments (Fig. 6.3.9) are weakly positively
correlated with catchment wide annual erosion rate with R2= 0.01, Pearson’s correlation coefficient = 0.1.
However, when the data is weighted according to catchment area, a weak anti-correlation found with
R2= 0.21; Pearson’s correlation coefficient = -0.25 (Fig. 6.3.10). This result is dominated by larger
catchments.
The direct extrapolation method has been applied to account for spatial heterogeneity within
catchments. For this purpose, the Alborz domain was split into discrete cells of unit catchment size and
annual precipitation for each cell was plotted against the estimated erosion rate (Fig. 6.3.11).
This method, too finds a weak anti-correlation between erosion rate and total precipitation with R2= 0.02,
Pearson’s correlation coefficient = -0.1; which implies that heterogeneity of precipitation totals within
catchments decreases the statistical correlation.
Rezaeian M., 2008, Coupled tectonics, erosion and climate in the Alborz Mountains, Iran. PhD thesis, University of Cambridge; 219 p.

CHAPTER 6: Decadal Erosion Rate Controls - Precipitation
131
200 400 600 800 1000 1200
0.0
0.1
0.2
0.3
0.4
0.5
0.6
An
nu
al
ero
sio
n (
mm
)
Annual precipitation (mm)
200 400 600 800 1000 1200
0.0
0.2
0.4
0.6
0.8
1.0
1.2
An
nu
al
ero
sio
n (
mm
)
Annual precipitation (mm)
These results indicate that annual total precipitation is not a strong control on catchment erosion rates
in the Alborz Mountains, and that this finding is not an effect of sub-catchment scale heterogeneity of
precipitation and its forcing.
As expressed in R square values, the correlation between annual erosion rate and total precipitation is
weakest for direct extrapolation and highest for lumping with weighting. This implies a major heterogeneity
of annual precipitation within catchments.
Fig. 6.3.9: Annual erosion and annual precipitation data, binned, for 86 drainage basins in the Alborz.
Error bars show 2σ interval. (A polynomial best fit to the data: y = 9E-08x2 - 5E-05x + 0.18 has R
2= 0.01).
Fig. 6.3.10: Annual erosion plotted against annual precipitation, for 86 drainage basins in the Alborz.
Each data point is weighted according to catchment area. Bars show 2σ interval within precipitation bins. (A
polynomial best fit to the data: y = -9E-08x2 + 0.0003x + 0.01 has R2= 0.21).
Rezaeian M., 2008, Coupled tectonics, erosion and climate in the Alborz Mountains, Iran. PhD thesis, University of Cambridge; 219 p.

CHAPTER 6: Decadal Erosion Rate Controls - Precipitation
132
200 400 600 800 1000
0.0
0.1
0.2
0.3
0.4
0.5
An
nu
al
ero
sio
n (
mm
)
Annual precipitation (mm)
Fig. 6.3.11: Annual erosion plotted against annual precipitation estimated for 2515 data points in the
Alborz. Bars show 2σ interval within precipitation bins. (A polynomial best fit to the data: y = 4E-07x2 -
0.0006x + 0.39 has R2= 0.02)
6-3-5-2 Seasonal Precipitation and Erosion
Annual erosion and the variability of seasonal precipitation are weakly positively correlated with R2=
0.09; Pearson’s correlation coefficient=0.19 (Fig. 6.3.12).
The spatial pattern of the variability of seasonal precipitation (Fig. 6.3.8) matches some first-order
features of the decadal erosion pattern. Watersheds with high variability are located in southern part of the
mountain belt where erosion rates are high. In contrast, catchments in the north Alborz where erosion rates
are lower mainly have low variability of seasonal precipitation.
The seasonality of erosion is coupled with precipitation (Figure 6.3.13). The main seasons for
sediment supply are spring and autumn in the dry and wet part of the Alborz, respectively. Surprisingly, the
wettest seasons of winter and summer contribute less to the total erosional flux. This issue is addressed in
runoff section. Two different trends are recognised in Figure 6.3.13. Annual precipitation is negatively
correlated with the proportion of annual erosion in spring, but positively in autumn. Watersheds with annual
precipitation < 800mm contribute significantly to annual erosion (40-65%) in spring; therefore, an anti-
correlation is dominant. However, watersheds with annual precipitation >800mm have a significant part of
annual erosion (~40%) in autumn.
The combination of these two different trends overprints any correlation between annual precipitation
and erosion.
The role of seasonal precipitation becomes even clearer when a focus is developed on individual
seasons. This has been done by segregating catchments with winter precipitation total > 25% of the annual
total. This cut off coincides broadly with the 800 mm annual total precipitation mark. In 43 catchments where
winter precipitation is > 25% of the annual total, annual average erosion rates are positively correlated with
the proportion of the total annual precipitation in winter, with R2 = 0.26; Pearson’s correlation coefficient =
0.46 (Fig. 6.3.14). In these catchments, winter precipitation is seen to drive erosion.
Rezaeian M., 2008, Coupled tectonics, erosion and climate in the Alborz Mountains, Iran. PhD thesis, University of Cambridge; 219 p.

CHAPTER 6: Decadal Erosion Rate Controls - Precipitation
133
0.24 0.26 0.28 0.30 0.32 0.34 0.36 0.38 0.40 0.42 0.44
0.0
0.1
0.2
0.3
0.4
0.5
0.6
0.7
0.8
An
nu
al e
ro
sio
n (
mm
)
Proportion of total annual precipitation in winter
300 400 500 600 700 800 900 1000 1100 1200
0.0
0.1
0.2
0.3
0.4
0.5
0.6
0.7
0.8
0.9
1.0 Spring
Summer
Autumn
Winter
Fra
cti
on
of
an
nu
al
ero
sio
n
Total annual precipitation (mm)
0.04 0.06 0.08 0.10 0.12 0.14 0.16
0.0
0.2
0.4
0.6
0.8
An
nu
al e
ro
sio
n (
mm
)
Variability of total seasonal precipitation normalized
by total annual precipitation
Fig. 6.3.12: Annual erosion plotted against variability of seasonal precipitation estimated in 88
drainage basins. Bars show 2σ confidence interval within variability of precipitation bins. (A polynomial best
fit to the data: y = 52.0x2 - 7.95x + 0.46 has R
2= 0.09).
Fig. 6.3.13: Proportion of annual erosion plotted against annual precipitation estimated for 79
watersheds. Bars show 2σ confidence interval within precipitation bins.
Fig. 6.3.14: Annual erosion plotted against proportion of annual precipitation in winter estimated in
43 drainage basins in which receives > 25 % of annual precipitation. Bars show 2σ confidence interval within
proportion of precipitation bins. (A polynomial best fit to the data: y = 12.72x2 - 7.22x + 1.13 has R
2= 0.26,
and Pearson’s correlation coefficient = 0.46)
Rezaeian M., 2008, Coupled tectonics, erosion and climate in the Alborz Mountains, Iran. PhD thesis, University of Cambridge; 219 p.

CHAPTER 6: Decadal Erosion Rate Controls - Precipitation
134
0.16 0.18 0.20 0.22 0.24 0.26 0.28 0.30 0.32 0.34 0.36
-0.2
-0.1
0.0
0.1
0.2
0.3
0.4
0.5
0.6
An
nu
al
ero
sio
n (
mm
)
Proportion of annual precipitation in summer
In contrast, no correlation has been found between erosion and the proportion of precipitation in
summer in all catchments where this proportion > 0.15% (R2 = 0.004; Pearson’s correlation coefficient = -
0.06) (Fig. 6.3.15).
Fig. 6.3.15: Annual erosion rate plotted against proportion of annual precipitation in summer
estimated in 43 drainage basins in which summer precipitation > 15 % of annual precipitation. Bars show 2σ
confidence interval within proportion of precipitation bins. (A polynomial best fit to the data: y = 1.36x2 -
0.91x + 0.33 has R2 = 0.004)
In summary, erosion of the Alborz Mountains appears to depend on seasonal rather than annual total
precipitation. In particular, winter precipitation correlates with catchment erosion rates, and rates are highest
where the proportion of winter precipitation is greatest. The proportion of summer precipitation has no
influence on catchment erosion rate.
Rezaeian M., 2008, Coupled tectonics, erosion and climate in the Alborz Mountains, Iran. PhD thesis, University of Cambridge; 219 p.

CHAPTER 6: Decadal Erosion Rate Controls - Vegetation
135
6-4 Vegetation
6-4-1 Introduction
Vegetation impedes erosion by increasing soil cohesion and intercepting precipitation, but it also
facilitates chemical weathering (e.g., Leopold et al. 1995; Collin et al., 2004; Istanbulluoglu et al., 2005).
The capacity of runoff to detach material is proportional to shear stress and a portion of the applied fluid
shear stress is partitioned between plants and soils in the presence of vegetation. Vegetation increases the
threshold shear stress, below which the rate of material detachment from a soil and regolith is negligible.
Additional cohesion in the soil profile provided by vegetation also acts to stabilize the slopes against
landsliding (Prosser et al., 1995; Istanbulluoglu et al., 2004; Tucker et al., 2006).
The effect of vegetation on erosional processes depends on vegetation type, climate, geology,
topography, and anthropogenic and natural disturbances.
In forests, dense upper- and understory vegetation combine with well developed litter layers to protect the
soil surface from rain splash. A dense vegetation cover with a relatively shallow root system protects
slopes against erosion by runoff, but has little impact on the propensity to deep-seated failure. Forest
vegetation with deep-reaching root clumps is capable of holding together steep slopes in weathered
bedrock, lowering the rate of landsliding. Changes of vegetation cover can have a profound effect on
erosion rate. They can be brought about in many ways. For example, earthquake can cause dieback
through the shearing of tree root mass, reducing water uptake and health of trees, and thereby promoting
elevated rates of slope failure in epicentre areas. Tree fall has been recognized as a major type of
disturbance (Garwood et al., 1979; Wells et al., 2001).
Lightning fires can clean tracts of dryland vegetation, greatly reducing the threshold for erosion
(e.g., Hevely, 1980; Wondzell & King, 2003). Ashfall from volcanic eruptions changes the chemistry of
soils and the runoff infiltration balance, resulting in sweeping and long-lived vegetation changes. Finally,
forest clearance and tillage have resulted in increased soil loss and erosion in many places while irrigation
and terracing have reduced these processes elsewhere.
Overall, there is thought to be a negative correlation of erosion with vegetation for a given
topography: as vegetation density increases, the erosion rate decreases. In tectonically active areas, this
may result in steeper slopes and lower drainage density, and therefore greater relief in densely vegetated
areas. In the long run, this topographic change could negate the clamping of erosion by vegetation.
A strategy to deconvolve the effect of vegetation from other controls on erosion has not yet been
designed. In this section, I will document vegetation type and density in the Alborz, and explore their
influence on erosion.
6-4-2 Flora in the Alborz
Based on plant species, climate and physiography, Iranian habitats fall into four ecological zones.
From north to south they are: Hyrcanian, Irano-Touranian, Zagros, Gulf-Omanian (Heshmati, 2007).
The location of the Alborz Mountains between the South Caspian Sea and the Central Iranian
Plateau imposes a major climatic gradient; consequently, a great biological diversity with variegated flora
Rezaeian M., 2008, Coupled tectonics, erosion and climate in the Alborz Mountains, Iran. PhD thesis, University of Cambridge; 219 p.

CHAPTER 6: Decadal Erosion Rate Controls - Vegetation
136
and fauna is observed. The mountain range encompasses a Hyrcanian province in the North and an Irano-
Touranian province in the south.
The Hyrcanian forests of the north Alborz are a relict of the Tertiary Hyrcanian flora. They
occupy the flanks and summits of the coastal mountains at the southern margin of the Caspian Sea,
linking across the Aras River with humid forests on the south-eastern shores of the Black Sea through
Transcaucasia. This province is often treated as a part of the Euro-Siberian region (Blondel & Aronson,
1999; Bobek, 1991). Pterocarya fraxinifolia is an example of a Tertiary relic element growing in the
lower-altitude forest of the Hyrcanian province since the Miocene-Pliocene (Zohary, 1973; Akhani &
Salimian, 2003; Ramezani et al., 2008).
Dense Hyrcanian forest constitutes a green belt over the northern slopes of the Alborz Mountains.
The width of the forested zone varies from 12-70 km and the total area is 19,250 km 2. It extends from sea
level to an altitude of 2,800 m asl, and consists of mainly deciduous forest of beech Fagus orientalis,
hornbeam Carpinus, maple Acer, lime Tilia, alder Alnus and oak Quercus castanaefolia. Ground flora is
abundant and includes grasses, herbs, ferns, shrubs and saplings. Within this zone, dense vegetation is
supported by high annual precipitation from 600 to 2,000mm, a considerable part of which falls in
summer. Above the timber line at elevations of 2,800m to 3,300m perennial spiny cushion-like plants
predominate. This flora shows affinities with the vegetation of the high mountains of the Hindu Kush
(UNDP, 2003; Rouhi-Moghaddam et al., 2007; Ramezani et al. 2008).
An Irano-Touranian arid to semi-arid flora dominates the southern slope of the Alborz
Mountains. Inside the mountain belt, it consists of an open forest steppe zone with a width of 30-90 km,
connected to the flat lands of Central Iran with desert vegetation further to south. Trees and shrub species
of this flora are significantly resistant to summer drought and heat, and can tolerate winter cold.
Dominant species include sub-steppic Juniperus sabina, J. communis, Amigdallus scoparia, Onobrychis
cornuta, Acantholimon spp., Astragalus spp., Artemisia aucheri, Alleum spp., Bromus tumentellus,
Pistacia vera, Berberos integessima, Acer spp.
In the Irano-Touranian zone the maximum precipitation is 500 mm per year in the mountains and
200 mm per year on the flats (UNDP, 2003; Heshmati, 2007).
Anthropogenic disturbance is important in the northern and southern periphery of the mountain belt
where the population density is high and substantial farming activity is common. Although the present
day vegetation pattern broadly fits the ecological zonation, deforestation and agriculture have locally
affected the vegetation density, particularly in low relief areas and along major valleys. In the north
Alborz, this has reduced vegetation biomass, but along the southern margin of the mountain belt irrigation
has created grass zones along waterways.
6-4-3 Vegetation Index
The Vegetation Index (VI) is an empirical measure of vegetation mass at the land surface.
Vegetation indices can be constrained from multiple-wavelength satellite images. To enhance the
vegetation signal, two (or more) frequency bands can be combined. Commonly used bands are the red
(0.6-0.7 mm) and NIR (near infra-red) wavelengths (0.7-1.1 mm).
Rezaeian M., 2008, Coupled tectonics, erosion and climate in the Alborz Mountains, Iran. PhD thesis, University of Cambridge; 219 p.

CHAPTER 6: Decadal Erosion Rate Controls - Vegetation
137
Two vegetation index algorithms, NDVI and EVI, are used globally. The standard Normalized Difference
Vegetation Index (NDVI), also referred to as greenness index, is most often used, but susceptible to error
and uncertainty over variable atmospheric and canopy background conditions. It represents the absorption
of visible red radiation and reflected near infra red radiation within the vegetation canopy, expressed on a
scale from -1 to +1. Values between -0.2 and 0.05 are characteristics for snow, inland water bodies,
deserts and exposed soils, and values from about 0.05 to 0.7 are associated with progressively increasing
amounts of green vegetation (Myneni et al., 1997).
In 1995, Liu & Huete proposed the Enhanced Vegetation Index (EVI), a modified NDVI
combining blue, red, and near infra red bands from Moderate Resolution Imaging Spectrometer (MODIS)
data. This index has improved sensitivity in high biomass regions and improved vegetation monitoring
through a decoupling of the canopy background signal and a reduction in atmosphere influences (Tucker,
1979; Liu & Huete, 1995; Huete et al., 1997; Huete et al., 1999; Huete et al., 2002; Matsutisha et al.
2007).
EVI data has been proposed by the MODIS (Moderate Resolution Imaging Spectroradiometer)
Land Discipline Group as a global-based vegetation index for monitoring the Earth’s terrestrial
photosynthetic vegetation activity.
6-4-3-1 Enhanced Vegetation Index (EVI) in the Alborz
I have used EVI to characterise the vegetation state of the Alborz Mountains. Enhanced
Vegetation Index data for the Alborz at a spatial resolution of 250m were obtained from
http://iridl.ldeo.columbia.edu/, managed by NOAA's climate program office and Columbia University.
The data were produced by the MODIS VI algorithm on a per-pixel basis, relying on multiple
observations over 16-day periods to generate a composite product. The goal of compositing
methodologies is to select the best observation for a pixel, from all the retained, filtered data, to represent
each pixel over the 16-day compositing period. The time interval covered by the data used in this study is
January to December 2006.
Thus, the EVI data allow an analysis of seasonal vegetation changes. It is assumed that the broad
pattern observed in 2006 is representative of the vegetation state of the Alborz Mountains over the longer
time interval covered by the erosion data described in chapter 5.
Raw EVI data was downloaded as ASCII in ARC map, converted to grid and projected; I built up
seasonal and annual EVI maps from the original data by averaging the pixel values over multiple 16-day
intervals. The mean EVI was calculated per pixel and catchment-wide, and used to examine the
correlation of erosion with vegetation mass by means of three statistical approaches of lumped un-
weighted, weighted and direct extrapolation.
6-4-4 Spatial Pattern of EVI
The Enhanced Vegetation Index map of north Iran (Fig. 6.4.1) shows a sharp contrast between
the northern and southern flank of the Alborz Mountains. The wet, north flank has a high EVI, commonly
> 0.15 and the dry, southern flank has EVI <0.15.
Rezaeian M., 2008, Coupled tectonics, erosion and climate in the Alborz Mountains, Iran. PhD thesis, University of Cambridge; 219 p.

CHAPTER 6: Decadal Erosion Rate Controls - Vegetation
138
Fig. 6.4.1: Mean annual EVI in northern Iran derived from MODIS (Moderate Resolution
Imaging Spectroradiometer) data for the time interval January - December 2006. The grid is shown at
250m resolution. Individual values represent the average of all 16-day composites during the observation
period.
Catchment-wide values of mean annual EVI (Fig. 6.4.2) range from 0.05 to 0.41, with two
subsets of EVI = 0.05 - 0.20 and EVI = 0.25 - 0.45 corresponding to the Hyrcanian and Irano-Touranian
provinces, respectively (Fig. 6.4.3).
Fig. 6.4.2: Smoothed mean annual EVI in the Alborz. Mean EVI calculated from MODIS
(Moderate Resolution Imaging Spectroradiometer) observations, smoothed at the catchment scale using a
circular moving mean with 15km diameter, and plotted with1 km spatial resolution.
Catchments in the SW and central Alborz, and some catchments around the main divide have a
mean annual EVI of 0.05-0.1. Low EVI values are also found in a section of the Haraz valley, a north-
draining longitudinal valley situated in the rainshadow of the northern frontal range. Catchments with
high EVI (0.3-0.35) are located in northernmost part of the mountain range, mainly in the NW, where the
annual precipitation rates are highest.
Rezaeian M., 2008, Coupled tectonics, erosion and climate in the Alborz Mountains, Iran. PhD thesis, University of Cambridge; 219 p.

CHAPTER 6: Decadal Erosion Rate Controls - Vegetation
139
0.05 0.10 0.15 0.20 0.25 0.30 0.35 0.40 0.45
0
5
10
15
20
25
30
Nu
mb
er
of
ca
tch
me
nts
Mean annual EVI
Hyrcanian province Irano-Touranian province
Fig. 6.4.3: The frequency of mean annual EVI in the Alborz. Catchment-average EVI values for
108 drainage basins are bi-modally distributed, showing the strong contrast between the Irano-Touranian.
province and the Hyrcanian province.
6.4.5 Seasonality of EVI
Throughout the Alborz, vegetation biomass is strongly seasonal. I have calculated pixel- specific
seasonal means for spring (21th March-21
th June), summer (22
th June-22
th september), autumn (23
th
September-21th December) and winter (22
th December-20
th March). Figure 6.4.4 shows seasonal means in
winter (6.4.4a) and summer (6.4.4b) as two end members. The mean EVI value in winter is low, ranging
from -0.09 to 0.30. The lowest values are characteristic of the area covered by snow in Irano-Touranian
province; the higher values are characteristic of Hyrcanian province. The contrast between north and
south flank persists in summer, but the EVI values range in a different interval between 0.1 and 0.55.
Winter mean EVI values are lowest in an area between the peaks of Damavand in the central
Alborz and Alam Kuh in the central-west Alborz, including the highlands above Tehran-Karaj. This
region has wet winters and very dry summers. In areas with high annual mean EVI, summers are wetter
than winters. Thus, where the biomass is low, precipitation falls when vegetation cover is weakest, and
where the biomass is high, precipitation is concentrated in times with the densest cover.
Seasonality in the EVI is also evident in catchment-wide data (Fig. 6.4.5). Winters have the
lowest EVI; summers and springs have similar, high EVIs.
In all seasons, the mean seasonal EVI increases with the annual mean. Moreover, the absolute
range of seasonal mean values increases with the annual mean EVI.
Rezaeian M., 2008, Coupled tectonics, erosion and climate in the Alborz Mountains, Iran. PhD thesis, University of Cambridge; 219 p.

CHAPTER 6: Decadal Erosion Rate Controls - Vegetation
140
0.05 0.10 0.15 0.20 0.25 0.30 0.35 0.40
-0.1
0.0
0.1
0.2
0.3
0.4
0.5
0.6
Spring
Summer
Autumn
Winter
Me
an
se
aso
na
l E
VI
Mean annual EVI
Fig. 6.4.4: Pixel-specific mean seasonal EVI derived from MODIS for (a) winter and (b) summer 2006 at
the 250 m resolution.
Fig. 6.4.5: Mean seasonal and annual EVI values for 108 drainage basins in the Alborz.
When normalized with respect to the annual mean EVI (Fig. 6.4.6) the relative variability of seasonal
means changes systematically with mean annual EVI, and the Irano-Touranian and Hyrcanian provinces
Rezaeian M., 2008, Coupled tectonics, erosion and climate in the Alborz Mountains, Iran. PhD thesis, University of Cambridge; 219 p.

CHAPTER 6: Decadal Erosion Rate Controls - Vegetation
141
0.05 0.10 0.15 0.20 0.25 0.30 0.35 0.40 0.45
-0.5
0.0
0.5
1.0
1.5
2.0
2.5
Spring
Summer
Autumn
Winter
Me
an
se
as
on
al
EV
I n
orm
ali
ze
d b
y m
ea
n a
nn
ua
l E
VI
Mean annual EVI
0.05 0.10 0.15 0.20 0.25 0.30 0.35 0.40
0.2
0.4
0.6
0.8
Va
riab
ilit
y o
f n
orm
ali
zed
sea
so
na
l E
VI
Mean annual EVI
can be distinguished. For mean annual EVI< 0.15, seasonality of EVI decreases with increasing annual
mean values. For mean annual EVI> 0.15, seasonality of EVI is only weakly dependant on annual mean
values. This difference in relative strength of seasonality is strongly expressed in the winter and summer
means.
Fig. 6.4.6: Mean seasonal EVI normalized by mean annual EVI plotted against mean annual EVI
for 108 drainage basins.
Variability of seasonal EVI against annual EVI indicates the areas with higher EVI values have
lower seasonal variability of EVI (Fig. 6.4.7). The spatial distribution of this variability (Fig. 6.4.8) has a
dominant high in the high mountains of the central and west Alborz, where winter precipitation is as
snow. This area includes the high peaks of Damavand and Alam Kuh and the watersheds they feed. In
these areas summer is the main growing season, and, the summer EVI reaches up to 2.25 times mean
annual EVI, while in winter it ranges between 0.5 and -0.5.
Fig. 6.4.7: Variability of mean seasonal EVI normalized by mean annual EVI, plotted against
mean annual EVI, binned, for 108 drainage basins. Error bars show 2σ interval. (A polynomial best fit the
data: y = 3.32x2 - 2.42x + 0.71 has R
2 = 0.70, Pearson’s correlation coefficient = -0.81)
Rezaeian M., 2008, Coupled tectonics, erosion and climate in the Alborz Mountains, Iran. PhD thesis, University of Cambridge; 219 p.

CHAPTER 6: Decadal Erosion Rate Controls - Vegetation
142
Fig. 6.4.8: Spatial pattern of variability of mean seasonal EVI normalized by mean annual EVI
estimated for 88 drainage basins. The grid is shown at 1 km resolution with a 15 km diameter smoothing
mean applied.
6-4-6 EVI and Precipitation
The spatial distribution of mean annual EVI (Fig. 6.4.1 & 6.4.2) matches the spatial pattern of
mean annual precipitation. Both show a general decrease of values from north to south and also from west
to east. Statistically, mean annual EVI is strongly correlated with mean annual precipitation (R2
= 0.50;
Pearson’s correlation coefficient = 0.74) (Fig. 6.4.9). Watersheds with low EVI <0.15 have a mean annual
precipitation of 300 to 600 mm; watersheds with high EVI > 0.15 have a mean annual precipitation
greater than 500 mm.
Crucially, these two domains have a marked and different seasonality of precipitation. This is
best seen in the seasonality of proportions of annual precipitation totals (Fig. 6.4.10).
Watersheds with EVI <0.15 have a different seasonal dynamic than more densely vegetated
drainage basins, except for autumn when the whole range receives the least proportion of annual
precipitation.
In areas with low mean annual EVI, up to 80% of precipitation falls in winter and spring (Fig.
6.4.10). The proportion of cold season precipitation gradually decreases as total annual rainfall, and with
it annual EVI, increases. In areas with the highest EVI, cold season contributions to total annual
precipitation can be as low as 35%.
In areas with low EVI, summer precipitation can be as little as ~ 10% of the annual total, and
where EVI is high, its contribution to the annual total can be up to 35%. Throughout, autumn
precipitation is a relatively minor component of the annual total everywhere in the mountain.
Combining Figures 6.4.9 and 6.4.10, it is clear that watersheds with substantial precipitation
throughout year constantly are highly vegetated with EVI > 0.15. In contrast, watersheds with EVI < 0.15
are dry in autumn and summer but have precipitation in winter and spring. The seasonal drought and
limited precipitation during the wet seasons together result in a low vegetation density (EVI < 0.15).
Rezaeian M., 2008, Coupled tectonics, erosion and climate in the Alborz Mountains, Iran. PhD thesis, University of Cambridge; 219 p.

CHAPTER 6: Decadal Erosion Rate Controls - Vegetation
143
200 400 600 800 1000 1200
0.05
0.10
0.15
0.20
0.25
0.30
0.35
0.40
Me
an
an
nu
al
EV
I
Mean annual precipitation (mm)
0.05 0.10 0.15 0.20 0.25 0.30 0.35 0.40
0.1
0.2
0.3
0.4
0.5 Spring
Summer
Autumn
Winter
No
rm
ali
ze
d s
ea
so
na
l p
re
cip
ita
tio
n
Mean annual EVI
Interestingly, higher summer precipitation appears to enhance biomass. In contrast, higher winter
and spring precipitation cause a decrease of biomass. One possible mechanism for this is erosion (See
section 6-4-7).
Fig. 6.4.9: Mean annual EVI plotted against mean annual precipitation, for 108 drainage basins in
the Alborz. Bars show 2σ interval within precipitation. (A polynomial model fits the data with: y = -3E-
07x2 + 0.0007x - 0.12; R
2 = 0.52, Pearson’s correlation coefficient = -0.73).
Fig. 6.4.10: Seasonal proportion of mean annual precipitation and mean annual EVI for 97
drainage basins in the Alborz. Error bars show 2σ interval.
6-4-7 EVI and Erosion
To explore vegetation controls on erosion rate, three statistical approaches of lumping without
weighting, lumping with weighting and direct extrapolation were employed.
Range-wide statistics are relatively poor as a result of the combination of two fundamentally different
ecological zones across the mountain belt.
Unweighted, catchment-wide mean annual EVI is poorly anti-correlated with erosion (Fig.
6.4.11) (R2= 0.13; Pearson’s correlation coefficient = -0.03). However, when catchment-wide values are
weighted for catchment size, then a more meaningful anti-correlation emerges (R2= 0.20; Pearson’s
correlation coefficient = -0.33) (Fig. 6.4.12). Using direct extrapolation, a weaker anti-correlation is
found between erosion rate and EVI with R2= 0.06 and Pearson’s correlation coefficient = -0.22 (Fig.
6.4.13).
Rezaeian M., 2008, Coupled tectonics, erosion and climate in the Alborz Mountains, Iran. PhD thesis, University of Cambridge; 219 p.

CHAPTER 6: Decadal Erosion Rate Controls - Vegetation
144
0.05 0.10 0.15 0.20 0.25 0.30 0.35 0.40
0.0
0.2
0.4
0.6
An
nu
al
ero
sio
n (
mm
)
Mean annual EVI
0.00 0.05 0.10 0.15 0.20 0.25 0.30 0.35 0.40
0.0
0.2
0.4
An
nu
al
ero
sio
n (
mm
)
Annual EVI
0.05 0.10 0.15 0.20 0.25 0.30 0.35 0.40
0.0
0.2
0.4
0.6
An
nu
al
ero
sio
n (
mm
)
Annual EVI
Fig. 6.4.11: Annual erosion rate and EVI for 89 drainage basins in the Alborz. Error bars show 2σ
interval. (A polynomial model fits the data with: R2 = 0.13y = 9.94x
2 - 4.47x + 0.59)
Fig. 6.4.12: Annual erosion rate and mean annual EVI estimated for 89 drainage basins in the
Alborz. Each data point is weighted according to catchment area. Error bars show 2σ interval. (A
polynomial model fits the data with: y = 8.93x2 - 4.35x + 0.65; R
2 = 0.20)
Fig. 6.4.13: Annual erosion rate and mean annual EVI for 2515 grid cells in the Alborz. EVI was
sampled discretely across the range and plotted against the interpolated local erosion rate. Error bars show
2σ interval. (A polynomial model fits the data with: y = 2.84x2 - 1.65x + 0.37; R
2 = 0.06).
Rezaeian M., 2008, Coupled tectonics, erosion and climate in the Alborz Mountains, Iran. PhD thesis, University of Cambridge; 219 p.

CHAPTER 6: Decadal Erosion Rate Controls - Vegetation
145
These results indicate that at the mountain belt scale vegetation may have an effect on erosion
rate, such that increased vegetation density suppress erosion rates, as expected.
Sub-catchment scale variability of biomass decreases the correlation of vegetation and erosion. A
linear fit to the EVI-erosion data may obscure the true nature of their relationship. In all three statistical
approaches, erosion rates are lowest for intermediate EVI values of EVI= 0.20-0.25. Erosion rates
increase progressively on either side of this intermediate EVI range. A possible interpretation is that at
low EVI, lack of vegetation permits easy detachment of weathering products, and at high EVI, associated
high rainfall rates drive erosion regardless of vegetation cover. This would give rise to a strong
seasonality of erosion as a function of EVI.
The effect of EVI on the seasonality of erosion is illustrated in Figure 6.4.14. Spring is by far the
dominant erosion season in catchments with mean annual EVIs of up to 0.20. The importance of spring
erosion subsides as EVI increases beyond this value, and autumn gradually gains erosional importance.
This transition has been examined in more detail in Figure 6.4.15, in which watersheds with
annual EVI >0.15 are classified based on the seasonality of erosion. In north flank of the Alborz, where
most of these catchments are located, areas with the highest proportion of erosion in spring have the
lowest mean annual erosion rates, indicating an anti-correlation between EVI and erosion similar to the
dry southern Alborz. Only watersheds with very high mean annual EVI have high mean annual erosion
rates. In these catchments, erosion occurs in autumn, when mean seasonal EVI is significantly lower than
in spring and summer. Low seasonal vegetation cover may be a primary cause of high seasonal erosion
erosion rates.
Denser vegetation in growth seasons adds shielding, and soil strength. It may also modulate
surface runoff and impede transport of entrained sediment by increasing surface roughness. In general,
grass or vegetation filter strips trap sediments eroded upslope by modifying the hydraulic characteristics
of flow; they reduce flow turbulence and velocity, thus increasing infiltration and sediment deposition.
Vegetation can reduce runoff by 10-90 % and trap 77-97 % of sediment, according to flow velocity and
vegetation roughness (e.g., Abu-Zreig, 2001; Rey, 2004; Fiener & Auerswald, 2006; Legu´edois et al.,
2008). Trapped sediments are released in times with lower vegetation, which results in lower infiltration
and higher runoff. In the Alborz this occurs in autumn. This discussion anticipates a detailed examination
of runoff and its effects on erosion in the next section.
Rezaeian M., 2008, Coupled tectonics, erosion and climate in the Alborz Mountains, Iran. PhD thesis, University of Cambridge; 219 p.

CHAPTER 6: Decadal Erosion Rate Controls - Vegetation
146
0.20 0.25 0.30 0.35 0.40
0.0
0.2
0.4
0.6
0.8
1.0 Spring
Summer
Autumn
An
nu
al
ero
sio
n (
mm
)
Annual EVI
0.05 0.10 0.15 0.20 0.25 0.30 0.35 0.40
-0.1
0.0
0.1
0.2
0.3
0.4
0.5
0.6
0.7
0.8
0.9
Spring
Summer
Autumn
Winter
Fracti
on
of
an
nu
al ero
sio
n
Annual EVI
Fig. 6.4.14: Seasonal fraction of annual erosion and mean annual EVI for 79 drainage basins in
the Alborz. Error bars show 2σ interval.
Fig. 6.4.15: Annual erosion and EVI for watersheds with EVI > 0.15. Each data bin is classified
according to the season of peak erosion (typically, this is when >40% of total annual erosion occurs).
Error bars show 2σ interval.
Rezaeian M., 2008, Coupled tectonics, erosion and climate in the Alborz Mountains, Iran. PhD thesis, University of Cambridge; 219 p.

CHAPTER 6: Decadal Erosion Rate Controls - Runoff
147
0 500 1000 1500 2000 2500
0
5
10
15
20
25
30
Nu
mb
er
of
ca
tch
me
nts
Annual runoff (mm)
6-5 Runoff
6-5-1 Introduction
Runoff is the portion of rainfall which is not lost to infiltration or evapo-transpiration; it may
include recharge from groundwater and melt water from snow packs. Base flow is the portion of runoff
that results from seepage of ground water into a channel. In many locations, infiltration excess and
saturation excess are the main mechanisms for generating runoff. Infiltration excess overland flow, or
Hortonian flow (Horton, 1933) occurs when the rainfall intensity exceeds the infiltration capacity of the
substrate. Saturation excess overland flow occurs when the soil water content reaches the storage capacity
and surplus rain cannot be accommodated in pore spaces (Wondzella & King, 2003; Smith & Goodrich,
2005). Semiarid and sub-humid zones are prone to infiltration excess runoff because of predominance of
relatively short, high intensity rainfalls on bare rock surfaces. In contrast, saturation excess runoff is more
common in humid areas with greater rainfall volumes but lower intensities. In these areas there is no
excess runoff early in the wet season (Mccartney et al., 1998; Smith & Goodrich, 2005).
Runoff is a principal driver of erosion by detaching and entraining sediment and by adding to the
transport capacity of channelised flow (e.g., Cerda, 1997). Vegetation modifies overland flow as
discussed in section 6-4. In bare zones, infiltration excess runoff is in direct interaction with substrate and
slope, driving erosion effectively; in contrast, large infiltration in vegetated zones precludes any
significant interaction.
6-5-2 Spatial Distribution of Runoff
The spatial distribution of runoff in the Alborz Mountains is known from daily discharge data
from 108 hydrometric stations operated by the Ministry of Energy of Iran, covering 5-55 years (TAMAB,
unpublished data). Specific annual runoff has been computed as the annual average river discharge
divided by drainage area upstream of the gauging station. The values range from 30-2000 mm between
stations. The modal runoff in the Alborz is 200-250 mm/yr, and the frequency count of specific annual
runoff per catchment has an asymmetric distribution with positive skew and coefficient of variation of
86% for the population of gauged catchments (Fig. 6.5.1).
Fig. 6.5.1: The frequency of specific annual runoff from gauged catchments in the Alborz. This
plot includes runoff data from 108 drainage basins.
Rezaeian M., 2008, Coupled tectonics, erosion and climate in the Alborz Mountains, Iran. PhD thesis, University of Cambridge; 219 p.

CHAPTER 6: Decadal Erosion Rate Controls - Runoff
148
0 200 400 600 800 1000 1200 1400 1600
0
2
4
6
8
0
2
4
6
8
Annual runoff (mm)
Spring
Summer
Se
as
on
al
run
off
(m
m/d
ay
)
Autumn
Winter
Figure 6.5.2 shows the spatial pattern of annual runoff smoothed at 15 km length scale. It
decreases from west to east and from north to south. The south flank of the mountain belt has low runoff
values of < 250 mm/yr, except for the central Tehran- Karaj sector and the highlands on the main divide.
In the northern Alborz, runoff is lowest in the east and some segments of the Haraz valley (See Fig. 3.1
for the location).
Fig. 6.5.2: Total annual runoff in the Alborz, derived from daily discharge measurements at 108
hydrometric stations operated by TAMAB. Runoff data was smoothed at catchment scale using a circular
moving mean with 15km diameter, and displayed at 1 km spatial resolution.
6-5-3 Seasonality of Runoff
Runoff is seasonal in the Alborz (Fig. 6.5.3). Throughout the mountains, spring has the highest
runoff rate, and summer has the lowest runoff rate. Autumn has low runoff rates in catchments with
annual runoff <600-700 mm, but high runoff rates in catchments with annual runoff > 600-700mm.
Fig. 6.5.3: Seasonal runoff and annual runoff estimated for 108 drainage basins in the Alborz.
Bars show 2σ interval within annual runoff bins.
Rezaeian M., 2008, Coupled tectonics, erosion and climate in the Alborz Mountains, Iran. PhD thesis, University of Cambridge; 219 p.

CHAPTER 6: Decadal Erosion Rate Controls - Runoff
149
0 200 400 600 800 1000 1200 1400
0.1
0.2
0.3
0.4
0.5
0.6
Spring
Summer
Autumn
Winter
Annual runoff (mm)
No
rm
ali
ze
d s
ea
so
na
l ru
no
ff
0 200 400 600 800 1000 1200 1400
0.05
0.10
0.15
Va
ria
bil
ity
of
no
rm
ali
ze
d s
ea
so
na
l ru
no
ff
Annual runoff (mm)
In order to better characterize the intra-annual variability of catchment runoff, average seasonal
runoff was normalized by total annual runoff. Results are shown in Figure 6.5.4. This figure reveals two
main domains with different dynamics. Catchments with total annual runoff < 600 mm have more than
40% and up to 65 % of total annual runoff in spring and less than 15 % in summer. In contrast,
catchments with the total annual runoff > 600 mm have a more even distribution with 20-35 % of the total
annual runoff in each of four seasons.
Fig. 6.5.4: Normalized seasonal runoff plotted against total annual runoff for 108 drainage basins
in the Alborz. Bars show 2σ intervals within annual runoff bins.
Total annual runoff and variability of normalized seasonal runoff are weakly anti-correlated (Fig.
6.5.5), with R2= 0.11, Pearson’s correlation coefficient of -0.31. Again, there appear to be two domains.
Where total annual runoff is less than about 600 mm, the average variability is 0.11-0.13, but the range of
catchment-specific values is large. Where total annual runoff is more than about 600 mm, the average
variability is 0.05-0.07, and the range of catchment specific values is small, specifically in catchments
with very high runoff totals.
Fig. 6.5.5: Variability of normalized seasonal runoff as a function of annual runoff for 108
drainage basins. Bars show 2σ intervals within annual runoff bins. (A polynomial model fits the data
with: y = 9E-09x2 - 6E-05x + 0.13; R
2 = 0.11)
Rezaeian M., 2008, Coupled tectonics, erosion and climate in the Alborz Mountains, Iran. PhD thesis, University of Cambridge; 219 p.

CHAPTER 6: Decadal Erosion Rate Controls - Runoff
150
300 400 500 600 700 800 900 1000 1100 1200
0
200
400
600
800
1000
1200
1400
1600
To
tal
an
nu
al
ru
no
ff (
mm
)
Total annual precipitation (mm)
The spatial pattern of the seasonal runoff variability (Fig. 6.5.6) displays a strong visual
correspondence with first order features of the annual erosion pattern. Watersheds with high variability
located in south-western and central part of the mountain belt have the highest erosion rates, and in the
extreme northeast erosion and runoff seasonality appear to peak together.
Fig. 6.5.6: Variability of the proportion of annual runoff in four seasons in the Alborz, estimated
from daily discharge measurements at 108 gauging stations operated by TAMAB. The map pattern was
smoothed at catchment scale using a circular moving mean with 15km diameter, and displayed at 1 km
spatial resolution.
6-5-4 Runoff and Precipitation
Annual runoff is strongly correlated with annual precipitation. The best fit model is a polynomial
function of degree two, with R2= 0.36 and Pearson’s correlation coefficient = 0.57 (Fig. 6.5.7).
Catchments with the highest amounts of precipitation, mainly located in north-northwest of the mountain
belt, have the greatest runoff; and catchments in the west-southwest and east-southeast of the Alborz
combine low runoff and low precipitation.
Fig. 6.5.7: Total annual runoff and total annual precipitation in 96 drainage basins in the Alborz.
Bars show 2σ interval within precipitation bins. Straight line is 1:1 relation. Runoff is mainly less than
precipitation. (A polynomial model fits the data with: y = 0.001x2 - 0.47x + 280.19; R
2 = 0.38)
Rezaeian M., 2008, Coupled tectonics, erosion and climate in the Alborz Mountains, Iran. PhD thesis, University of Cambridge; 219 p.
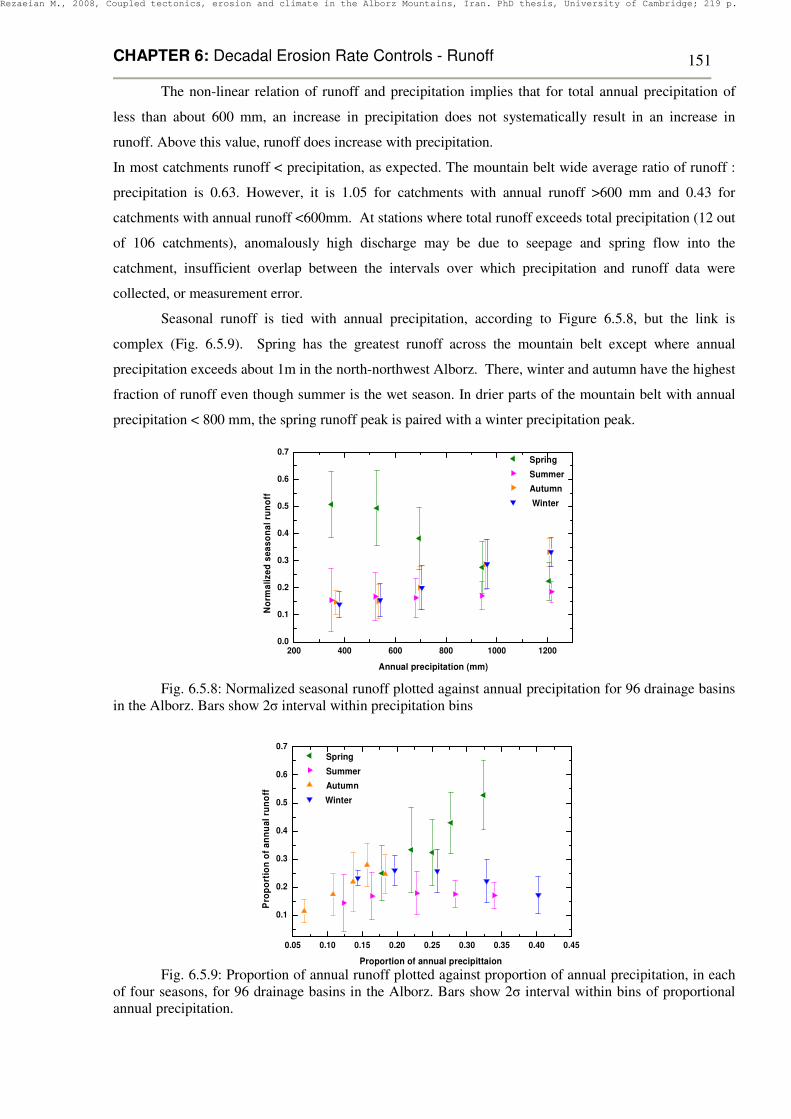
CHAPTER 6: Decadal Erosion Rate Controls - Runoff
151
0.05 0.10 0.15 0.20 0.25 0.30 0.35 0.40 0.45
0.1
0.2
0.3
0.4
0.5
0.6
0.7
Spring
Summer
Autumn
Winter
Pro
po
rti
on
of
an
nu
al
ru
no
ff
Proportion of annual precipittaion
200 400 600 800 1000 1200
0.0
0.1
0.2
0.3
0.4
0.5
0.6
0.7 Spring
Summer
Autumn
Winter
No
rm
ali
ze
d s
ea
so
na
l ru
no
ff
Annual precipitation (mm)
The non-linear relation of runoff and precipitation implies that for total annual precipitation of
less than about 600 mm, an increase in precipitation does not systematically result in an increase in
runoff. Above this value, runoff does increase with precipitation.
In most catchments runoff < precipitation, as expected. The mountain belt wide average ratio of runoff :
precipitation is 0.63. However, it is 1.05 for catchments with annual runoff >600 mm and 0.43 for
catchments with annual runoff <600mm. At stations where total runoff exceeds total precipitation (12 out
of 106 catchments), anomalously high discharge may be due to seepage and spring flow into the
catchment, insufficient overlap between the intervals over which precipitation and runoff data were
collected, or measurement error.
Seasonal runoff is tied with annual precipitation, according to Figure 6.5.8, but the link is
complex (Fig. 6.5.9). Spring has the greatest runoff across the mountain belt except where annual
precipitation exceeds about 1m in the north-northwest Alborz. There, winter and autumn have the highest
fraction of runoff even though summer is the wet season. In drier parts of the mountain belt with annual
precipitation < 800 mm, the spring runoff peak is paired with a winter precipitation peak.
Fig. 6.5.8: Normalized seasonal runoff plotted against annual precipitation for 96 drainage basins
in the Alborz. Bars show 2σ interval within precipitation bins
Fig. 6.5.9: Proportion of annual runoff plotted against proportion of annual precipitation, in each
of four seasons, for 96 drainage basins in the Alborz. Bars show 2σ interval within bins of proportional
annual precipitation.
Rezaeian M., 2008, Coupled tectonics, erosion and climate in the Alborz Mountains, Iran. PhD thesis, University of Cambridge; 219 p.

CHAPTER 6: Decadal Erosion Rate Controls - Runoff
152
300 400 500 600 700 800 900 1000 1100 1200
0.02
0.04
0.06
0.08
0.10
0.12
0.14
0.16
0.18
0.20
Va
ria
bil
ity
of
no
rm
ali
ze
d s
ea
so
na
l ru
no
ff
Annual precipitation (mm)
The variability of total seasonal runoff normalized by total annual runoff is anti-correlated with
total annual precipitation, where R2 = 0.22; Pearson’s correlation coefficient = -0.5 (Fig. 6.5.10).
For precipitation < 800 mm/yr, the seasonal runoff variability can range widely from 0.02 to 0.2, but
where precipitation > 800 mm/yr, it never exceeds 0.10.
Fig. 6.5.10: Variability of normalized seasonal runoff plotted against annual precipitation for 108
drainage basins in the Alborz. Bars show 2σ interval within precipitation bins. (A polynomial model fits
the data with: y = 2E-08x2 - 0.0001x + 0.18; R
2 = 0.22)
6-5-5 Dynamics of Seasonal Runoff
Seasonal runoff is modulated by snow accumulation and melt, evapo-transpiration, and
infiltration and base flow. This gives rise to a complex precipitation-runoff dynamic in the Alborz
Mountains.
In the northern Alborz, summers are wet and autumns dry but runoff peaks in autumn. The lag in
runoff may be due in part to significant evapo-transpiration and infiltration in summer, while exfiltration
and seepage of summer rain could swell autumn base flow, but this remains ill-constrained. High
fractions of autumn runoff are limited to the frontal range of the northern Alborz, where summer
precipitation is greatest (Fig. 6.5.11a).
In the south flank of the mountain range a lag time exists between the winter precipitation high
and the runoff peak in spring. The highest fraction of annual runoff occurs during spring throughout the
southern Alborz (Fig. 6.5.11b).
At high altitude, most winter precipitation is as snow. It accumulates, suppressing winter runoff (Fig.
6.5.12). Snow melt in spring combines with spring precipitation in the southern Alborz, while seepage
may also contribute to the delay of the runoff peak.
In a study of 27 years of runoff from a catchment above the Amir Kabir reservoir in the southern
Alborz, Mashayekhi and Mahjoub (1991) have found that the lag time between the winter precipitation
peak and the runoff peak is due to snow melt from mid-March at lower elevation until end May at higher
elevation. Moussavi et al. (1989) have also argued that the runoff in spring is mainly generated by
snowmelt in the south flank of the Alborz.
Rezaeian M., 2008, Coupled tectonics, erosion and climate in the Alborz Mountains, Iran. PhD thesis, University of Cambridge; 219 p.

CHAPTER 6: Decadal Erosion Rate Controls - Runoff
153
0.15 0.20 0.25 0.30 0.35 0.40
0.10
0.15
0.20
0.25
0.30
0.35
Pro
po
rtio
n o
f an
nu
al ru
no
ff i
n w
inte
r
Proportion of annual precipitation in winter
Fig. 6.5.11: Proportion of annual runoff during (a) autumn and (b) spring in the Alborz, derived
from daily discharge measurements at 108 hydrometric stations operated by TAMAB. Runoff was
smoothed at the catchment scale using a circular moving mean with 15km diameter, and displayed at1 km
spatial resolution.
Fig. 6.5.12: Proportion of annual runoff in winter plotted against proportion of annual
precipitation in winter for 96 drainage basins in the Alborz. Bars show 2σ interval within precipitation
bins. (A linear model fits the data with: y = -0.40x + 0.35; R2 = 0.21; Pearson’s correlation coefficient = -
0.46).
(a)
(b)
Rezaeian M., 2008, Coupled tectonics, erosion and climate in the Alborz Mountains, Iran. PhD thesis, University of Cambridge; 219 p.

CHAPTER 6: Decadal Erosion Rate Controls - Runoff
154
0 100 200 300 400 500 600 700 800 900
0.05
0.10
0.15
0.20
0.25
0.30
0.35
0.40
An
nu
al
EV
I
Annual runoff (mm)
0 100 200 300 400 500 600 700 800 900 1000 1100
0.05
0.10
0.15
0.20
0.25
0.30
0.35
0.40
An
nu
al
EV
I
Annual runoff (mm)
6-5-6 Runoff and EVI
Although both runoff and vegetation density are linked with annual precipitation, annual EVI is
poorly correlated with annual runoff; R2 = 0.09 and Pearson’s correlation coefficient=0.31 (Fig. 6.5.13).
Mean annual EVI in catchments in south flank of the Alborz is anti-correlated with total annual runoff (R2
= 0.24; Pearson’s correlation coefficient = -0.43), but northern cachments display a positive correlation of
these variables (R2 = 0.21; Pearson’s correlation coefficient = 0.39).
Fig. 6.5.13: Annual EVI and runoff for 106 drainage basins Bars show 2σ interval within runoff
bins. (A polynomial model fits the data with: y = -2E-08x2 + 0.0001x + 0.19; R
2 = 0.09).
Fig. 6.5.14: Same as Fig. 6.5.13, but with data segregated for north and south flank of the
mountain belt, shown as open and filled squares, respectively. (A polynomial model fits the data with: y =
-6E-08x2 + 0.0002x + 0.19; R
2 = 0.21, and y = 9E-08x
2 - 0.0001x + 0.11; R
2 = 0.24, for north and south,
respectively.).
Moreover, annual EVI is strongly anti-correlated with the variability of seasonal runoff as
normalized by annual runoff, R2= 0.38 and Pearson’s correlation coefficient= -0.62 (Fig. 6.5.15). This
reflects the steady wet climate of the densely vegetated north flank of the mountain belt where high
infiltration rates suppress variability of runoff, and the highly seasonal runoff of the barren south flank,
where topographic slope and lithology may add to a high hydrological variability ( see sections 6.6 and
6.7).
Given the importance of the seasonality of runoff in dry part of the Alborz (Fig. 6.5.8 & 6.5.9),
normalized seasonal runoff has been explored in conjunction with annual EVI (Fig. 5.5.16).
Rezaeian M., 2008, Coupled tectonics, erosion and climate in the Alborz Mountains, Iran. PhD thesis, University of Cambridge; 219 p.

CHAPTER 6: Decadal Erosion Rate Controls - Runoff
155
0.00 0.02 0.04 0.06 0.08 0.10 0.12 0.14 0.16 0.18 0.20
0.00
0.05
0.10
0.15
0.20
0.25
0.30
0.35
0.40
An
nu
al
EV
I
Variability of normalized seasonal runoff
0.0 0.1 0.2 0.3 0.4 0.5 0.6 0.7
0.00
0.05
0.10
0.15
0.20
0.25
0.30
0.35
0.40
0.45
Spring
Summer
Autumn
Winter
An
nu
al
EV
I
Normalized seasonal runoff
Fig. 6.5.15: Annual EVI plotted against variability of normalized seasonal runoff for 108
drainage basins in the Alborz. Bars show 2σ interval within runoff bins. (A polynomial model fits the data
with: y = 1.84x2 - 1.64x + 0.38; R
2 = 0.38).
Fig. 6.5.16: Annual EVI and seasonal runoff normalized by annual runoff for 108 drainage basins
in the Alborz. Bars show 2σ interval in runoff bins.
A significant anti-correlation exists between annual EVI and the proportion of annual runoff in
spring, when a major amount of erosion occurs (Chapter 5), confirming the reduced effect of vegetation
impedance during peak erosion.
Vegetation also appears to affect the ratio of runoff and precipitation (Fig.6.5.17). With
increasing EVI, the runoff/precipitation ration decreases steadily to a minimum at annual EVI = 0.15-
0.20. In areas with denser vegetation, the ratio increases gradually with EVI.
Pearson’s correlation coefficient and R2 are improved, when they are estimated for north and
south flank catchments separately. Pearson’s correlation coefficient and R2 are -0.69 and 0.52 in the south
flank and 013 and 0.11 in the north flank, respectively. The meaningful anti-correlation of EVI and the
runoff/precipitation ratio in the south flank of the Alborz may imply that vegetation can affect erosion by
modulating the runoff/precipitation ratio.
Rezaeian M., 2008, Coupled tectonics, erosion and climate in the Alborz Mountains, Iran. PhD thesis, University of Cambridge; 219 p.

CHAPTER 6: Decadal Erosion Rate Controls - Runoff
156
0 500 1000 1500 2000
0.0
0.2
0.4
0.6
0.8
An
nu
al
ero
sio
n (
mm
)
Annual runoff (mm)
0.05 0.10 0.15 0.20 0.25 0.30 0.35 0.40
0.1
0.2
0.3
0.4
0.5
0.6
0.7
0.8
0.9
1.0
An
nu
al
run
off
/ a
nn
ua
l p
rec
ipit
ati
on
Annual EVI
Fig. 6.5.17: The ratio of annual runoff / precipitation plotted against annual EVI for 95
watersheds in the Alborz. Bars show 2σ interval within EVI bins. (A polynomial best fit the data : y =
9.78x2 - 4.46x + 0.89 has R
2= 0.11; Pearson’s correlation coefficient = -0.02)
6-5-7 Runoff and Erosion
The strength of the runoff control on erosion rate in the Alborz Mountains has been explored with
two statistical approaches, lumping without weighting and lumping with weighting. The direct
extrapolation method is not applicable in this case because runoff is an independent variable (See section
6.2).
Both methods show a non-linear relation of annual runoff and erosion, with an erosion maximum
at intermediate runoff values. However, the maximum is different between these methods. Lumped, un-
weighted catchment data show a near linear increase of erosion rate with runoff to a maximum at about
1300 mm total annual runoff. When weighted for catchment size, the data show an erosion maximum at
about 500 mm total annual runoff (Fig. 6.5.18 & 6.5.19, respectively). The large difference between these
results underlines the influence of weighting.
Seasonal variability of runoff and erosion are weakly positively correlated (Fig. 6.5.20), with R2 =
0.04; Pearson’s correlation coefficient = 0.20.
Fig. 6.5.18: Annual erosion and runoff for 89 drainage basins in the Alborz. Bars show 2σ
interval within runoff bins. (A polynomial model fits the data with: y = -4E-08x2 + 0.0002x + 0.12; R
2 =
0.06; Pearson’s correlation coefficient = 0.20).
Rezaeian M., 2008, Coupled tectonics, erosion and climate in the Alborz Mountains, Iran. PhD thesis, University of Cambridge; 219 p.

CHAPTER 6: Decadal Erosion Rate Controls - Runoff
157
0 200 400 600 800
0.0
0.2
0.4
0.6
An
nu
al
ero
sio
n (
mm
)
Annual runoff (mm)
0.00 0.05 0.10 0.15 0.20
0.0
0.2
0.4
0.6
An
nu
al ero
sio
n (
mm
)
Variability of total seasonal runoff normalized by total annual runoff
0.2 0.3 0.4 0.5 0.6 0.7 0.8 0.9
-0.15
0.00
0.15
0.30
0.45
0.60
0.75
0.90
An
nu
al e
rosio
n (
mm
)
Annual runoff / annual precipitation
Fig. 6.5.19: Annual erosion and runoff for 89 drainage basins in the Alborz. Each data point is
weighted according to catchment area. Bars show 2σ interval within runoff bins. (A polynomial model
fits the data with: y = -0.35x2 + 0.58x + 0.12; R
2 = 0.09; Pearson’s correlation coefficient = 0.16)
Fig. 6.5.20: Annual erosion plotted against variability of total seasonal runoff normalized by total
annual runoff for 88 drainage basins in the Alborz. Bars show 2σ interval within runoff bins. (A
polynomial model fits the data with: y = -0.68x2 + 1.05x + 0.12; R
2 = 0.04).
Fig. 6.5.21: Annual erosion plotted against annual runoff / precipitation for 95 watersheds in the
Alborz. Data are segregated for north and south flank catchments, shown with open and filled squares,
respectively. (Polynomial models fit the data for south and north flanks with: y = 0.62x2 - 0.04x + 0.15;
R2 = 0.35, and y = -0.28x
2 + 0.56x - 0.01; R
2 = 0.08, respectively). Bars show 2σ interval within
runoff/precipitation bins.
Rezaeian M., 2008, Coupled tectonics, erosion and climate in the Alborz Mountains, Iran. PhD thesis, University of Cambridge; 219 p.

CHAPTER 6: Decadal Erosion Rate Controls - Runoff
158
0.1 0.2 0.3 0.4 0.5 0.6
0.0
0.1
0.2
0.3
0.4
0.5
0.6
0.7
0.8
0.9
Spring
Summer
Autumn
Winter
Fra
cti
on
of
an
nu
al
ero
sio
n
Fraction of annual runoff
Erosion is relatively highly correlated with the runoff/precipitation ratio in both flanks of the
mountain belt. R2 and Pearson’s correlation coefficient are 0.08 and 0.27, and 0.35 and 0.57, in the north
flank and south flank, respectively.
Importantly, the seasonality of erosion is coupled with the seasonality of runoff (Fig. 6.5.22).
When the seasonal fraction of annual runoff is less than about 0.25, it scales linearly and directly with the
seasonal fraction of annual erosion, except during winter when erosion is always disproportionately low.
However, in catchments with a highly seasonal runoff, erosion rates are disproportionately high during
seasons with most discharge. This is true for the north flank of the mountain belt, where autumns have
most discharge, as well as for the south flank of the mountain belt, where discharge peaks in spring. Thus,
seasons with high runoff, set the erosion pattern, and on the scale of the mountain belt, runoff seasonality
caused by snow melt matches erosion “hot spots”. This link is explored next.
Fig. 6.5.22: Proportion of annual erosion plotted against proportion of annual runoff for four
seasons, for 78 watersheds in the Alborz. Bars show 2σ interval within runoff bins. Solid line is 1:1
relation.
6-5-8 Dynamics of Snowmelt-Generated Runoff
Episodic floods provide a primary mechanism for transport of large amounts of sediment; in
some cases more than 90% of the total annual sediment load is transported in several days of high runoff
as reported in different areas with different climate regime (e.g., Parker & Troutman, 1989; Dadson et al.,
2005; Beylich et al., 2006).
One efficient mechanism of flood generation is snowmelt runoff on a frozen substrate (e.g., Wade
& Kirkbride, 1996; Ferrick & Gatto, 2005; Beylich et al., 2006; Yavuz et al., 2006). This mechanism is
most effective in terms of erosion when thermal shock and freeze-thaw process drive high physical
weathering rates, producing regolith especially during periods of snow accumulation and melt. As a
result, material is available for erosion from hillslopes when transport capacity is greatest.
Daily observations of suspended sediment concentration and water discharge in the Haraz and
Sefid Rud catchments (Pazwash, 1982; Sadeghi et al., 2005), have shown episodic floods in late winter -
early spring, in which daily sediment discharge can exceed the mean annual value.
Rezaeian M., 2008, Coupled tectonics, erosion and climate in the Alborz Mountains, Iran. PhD thesis, University of Cambridge; 219 p.

CHAPTER 6: Decadal Erosion Rate Controls - Runoff
159
0.30 0.35 0.40 0.45 0.50 0.55 0.60
0.0
0.1
0.2
0.3
0.4
0.5
0.6
An
nu
al
ero
sio
n (
mm
)
Proportion of total annual runoff in spring
0 100 200 300 400 500
0
100
200
300
400
500
600
To
tal
se
as
on
al
ru
no
ff (
mm
)
Total seasonal precipitation (mm)
The erosional response to snowmelt-generated runoff is severe and proves to be a stronger control
on erosion than the total annual precipitation. It dominates the sediment flux from the southern Alborz.
Within this area, a higher correlation exists between the seasonal runoff and erosion. Specifically, for
catchments in which spring runoff exceeds 26% of the annual total runoff, annual erosion increases
systematically with increasing proportional importance of spring runoff.
A polynomial function of degree two (y = 1.37x2 - 0.59x + 0.15) defines the correlation between
the seasonal runoff and erosion with R2 = 0.18 and Pearson’s correlation coefficient = 0.40 (Fig. 6.5.23).
Fig. 6.5.23: Annual erosion as a function of the proportion of annual runoff in spring for 64
drainage basins with > 26 % of annual runoff in spring. Bars show 2σ interval within runoff bin. (A
polynomial model fits the data with: y = 1.78x2 - 1.01x + 0.25; R
2 = 0.18)
6-5-9 Dynamics of Groundwater-Generated Runoff
Groundwater can make up in excess of 50-90% of stream flow (Arnold, 2000). In the north
Alborz, it must constitute the bulk of the autumn runoff, when river discharge exceeds precipitation (Fig.
6.5.24). This contrasts with summers when precipitation exceeds runoff by 2.4 times. Given the fact that
summer erosion is low in the north Alborz despite heavy precipitation, and high in autumn when runoff
peaks, the ground water dynamic deserves some further attention.
Fig. 6.5.24: Total seasonal runoff and precipitation in summer and autumn for 64 catchments in
the north flank of the Alborz. Filled circles are summer data; open circles are autumn data. Solid line is
1:1 relation.
Rezaeian M., 2008, Coupled tectonics, erosion and climate in the Alborz Mountains, Iran. PhD thesis, University of Cambridge; 219 p.

CHAPTER 6: Decadal Erosion Rate Controls - Runoff
160
0.26 0.28 0.30 0.32 0.34 0.36 0.38
0.0
0.2
0.4
0.6
0.8
1.0
An
nu
al ero
sio
n (
mm
)
Proportion of total annual runoff in autumn
It has been noted that riparian evapo-transpiration is greater in wet periods than in dry periods. In
the north Alborz, where EVI peaks in summer, this may lead to a large seasonal loss of surface and
groundwater. Only deeper groundwater is relatively unaffected, and this may dominate recharge of
surface flow in autumn. In that season, lower EVI reflects reduced biomass, and water uptake and evapo-
transpiration loss may be less as a result (e.g., Federer, 1973; Daniel, 1976; Tallaksen, 1995). This could
be a primary cause of high flow rates in autumn, in the wettest part of the north Alborz. If this
interpretation is correct, then there is a time lag of several months between precipitation and outflow of
groundwater in these catchments The lengths of the flow paths involved are not known.
Where this effect is large and autumn runoff contributes disproportionately to the annual total
runoff, erosion rates appear to be affected. This can be seen in the runoff and erosion statistics for
catchments where the proportion of total runoff in autumn is greater than 25% (annual precipitation >700
mm). In these catchments annual erosion rates increase with the proportion of autumn runoff. The data
are best fit by a non-linear model with R2 = 0.44; Pearson’s correlation coefficient = 0.44) (Fig. 6.5.25).
However, only when the proportion of autumn runoff exceeds about 35% of the annual total its effects on
catchment erosion is important.
The mechanism by which, strong autumn recharge drives catchment erosion, has not been studied
in detail. Recharge is focused in topographic lows and unlikely to affect hillslopes. Therefore, autumn
sediment mobilization must occur in channels rather than on hillslopes. Sediment delivery to channels
may be a more gradual process, or concentrated in summer months when precipitation rates are high, but
onward transport happens when stream flow is greatest, and this is recorded at gauging stations.
Fig. 6.5.25: Annual erosion rate plotted against the proportion of annual runoff in autumn for 32
drainage basins with > 25 % of annual runoff in autumn. Bars show 2σ interval within runoff bins. (A
polynomial model fits the data with: y = 93.3x2 - 56.9x + 8.8; R
2 = 0.44)
In summary, overland flow caused by direct precipitation, enhanced by snow-melting in spring,
or groundwater recharge in autumn, and modified by evapo-transpiration are the main mechanisms of
runoff generation in the Alborz.
Across the mountain belt, erosion rates increase with annual runoff, peak at intermediate runoff
values, and then decrease. This pattern is overprinted by a strong seasonality of the runoff control on
erosion. In the semi-arid southern and high Alborz, winter precipitation accumulates as snow and
Rezaeian M., 2008, Coupled tectonics, erosion and climate in the Alborz Mountains, Iran. PhD thesis, University of Cambridge; 219 p.

CHAPTER 6: Decadal Erosion Rate Controls - Runoff
161
meltwater merges with spring rain to maximize runoff at a time when the products of thermal weathering
of friable rocks are first exposed. As a result, erosion rates peak in spring in this part of the mountain belt,
and this mechanism may well be responsible for the highest erosion rates of the entire region. In the north
flank of the Alborz Mountains, heavy summer rains do not translate in significant runoff, probably due to
significant evapo-transpiration loss and infiltration through dense vegetation. However, deep ground
water recharges autumn stream flow, and where this is most effective, autumn runoff drives catchment
erosion, probably through the purging of sediment concentrated in stream beds and valley floors.
Rezaeian M., 2008, Coupled tectonics, erosion and climate in the Alborz Mountains, Iran. PhD thesis, University of Cambridge; 219 p.

CHAPTER 6: Decadal Erosion Rate controls-Lithology
162
6-6 Lithology
6-6-1 Introduction
In this section, an effort is made to establish a conceptual approach to classifying geological
substrate on the basis of its mechanical properties. In the absence of any systematic measurement of
geomechanical properties of rocks in the Alborz, porosity is identified as a convenient mechanical proxy
measure of rock strength. Porosity is also a first control on the weathering susceptibility of rocks.
Infiltration and seepage of meteoric water depends on the interaction of fluids with contrasting
lithologies. Since the mineral-fluid interface, including that in pores, is the primary location of weathering
reactions (Fitzner, 1990), porous rocks with greater ability to hold fluids from precipitation or melt water
tend to have higher chemical weathering rates than lithologies with low porosity.
Porosity is also crucial in terms of freeze-thaw processes in which hydraulic pressure in the voids
during freezing increases the pore-size distribution and average pore radius (Fitzner, 1990) leading to a
loss of cohesion, and a capacity to accept and retain more moisture. This results in a significant reduction
of the unconfined compressive strength in porous rocks; in contrast, rocks with low porosity permit
neither the infiltration nor the pressurization of fluid required for significant freeze-thaw damage (e.g.,
Hall, 1999; Hale & Shakoor, 2003; Chen et al., 2004; Ferrick & Gatto, 2005; Yavuz et al., 2006;
Lindqvist et al., 2007).
Strength, porosity, saturation coefficient, water absorption, coefficient of volumetric expansion
and thermal conductivity are the general mechanical properties which are considered to be most important
for weathering. Of these, porosity and strength are fundamental in both chemical and physical weathering
(Gerrard, 1988; Schaetzl & Anderson, 2005).
Rock strength can affect mountain belts in two ways. In fine scales, it controls the landscape via
weathering, but in larger scales, bedrock strength can limit local relief in a mountain range, and once
hillslopes approach a mechanically limited steepness, landsliding will lower ridgelines at the pace set by
the rate of river incision (e.g., Montgomery, 2003). The latter is addressed in the section on topographic
controls on erosion. In this section rock strength and weathering controls are investigated.
Compressive strength of a given rock type varies within a wide range, depending on porosity,
cementation, degree of weathering, formation heterogeneity, grain size angularity, and degree of
interlocking of mineral grains, and finally, orientation of load application with respect to microstructure
(e.g., foliation in metamorphic rocks and bedding planes in sedimentary rocks).
In this respect, the intrinsic variability of intact rock properties causes the association between
strength and rock type to be limited. Uni-axial compression of rock samples in a laboratory is the most
frequently used means of determining rock strength; strength measurements are broadly related to dry
density, and therefore to porosity (e.g., Colback & Wild, 1965; Burshetin, 1969; Goodman, 1989;
Hawkins & McConnell, 1992; Waltham, 2002; Vásárhelyi & Ván, 2006; Pariseau, 2007). Moreover,
saturation state of the pore space has been found to be a major control on rock strength. In many cases,
strength decreases remarkably after only 1% water saturation, but the rate of reduction in strength
depends upon lithology (Burshetin, 1969; Hawkins & McConnell, 1992).
Rezaeian M., 2008, Coupled tectonics, erosion and climate in the Alborz Mountains, Iran. PhD thesis, University of Cambridge; 219 p.

CHAPTER 6: Decadal Erosion Rate controls-Lithology
163
6-6-2 Substrate in the Alborz
The Alborz Mountains have a broad range of stratigraphic units from Precambrian to Quaternary,
covering a wide range of lithologies.
The carbonates of the Alborz mainly consist of Paleozoic-Mesozoic limestone and occasionally
Paleocene-early Neogene limestones. They vary from thick, highly fractured, karstic masses to thin
unfractured beds. Carbonate rocks dominate in the eastern Alborz and, together with meta-sediments,
cover a significant area in the north flank of the north-central and west Alborz.
Impermeable sediments and metamorphic rocks with a low porosity are mainly Mesozoic in age
but older, Paleozoic and some Precambrian units crop out in the internal part of the north flank of the
Alborz. This rock class comprises of siltstones, sandstones, conglomerates and low grade metamorphic
rocks, in places alternated with impermeable layers of shale, schist and marl. Together with carbonates,
these rocks dominate the north flank of the Alborz Mountains, and form about 62% of all outcrop in the
integral Alborz. This group includes the Upper Proterozoic Kahar Formation consisting of argillaceous
and siliceous slate with intercalation of quartzite, dolomite (Berberian, 1974; Geological Survey of Iran,
1991b).
Igneous rocks of the Alborz include granites, lava flows, volcanic ash, and tuff and tuffeous
conglomerates and sandstones, and have a wide range of geological ages from Precambrian to
Quaternary. They share geomechanical characteristics with young clastic sedimentary rocks. Rocks of
this class crop out in a wide band across the central-southern part of the range. They are abundant in the
west but feature less in the eastern Alborz. Outcrops of volcanics in the western Alborz join to the
northern Alborz at the westernmost end of the mountain belt, but in the north-east limited outcrops of this
class mainly comprise conglomerate-sandstone.
Evaporites of the Alborz include marls, salts and gypsum of Paleogene and Neogene age. This
class, which coexists with young volcanic rocks, has outcrops in the south central Alborz. In addition,
small outcrops are found in intramontane basins in the west Alborz; in combination with igneous rocks,
they cover 37% of the whole study area. The metapelitic-metavolcanic complex of Late Ordovician
Gorgan Schists (Geological Survey of Iran, 1991a; Ghavidel-syooki, 2007), in the NE Alborz, is
considered volcanic, and therefore classified in this second group.
In Figure 6.6.1, the porosity and strength of these or similar rock types are indicated using
measurements on samples collected elsewhere (after: Pariseau, 2007; Afrouz 1992; Dincer et al., 2004).
Basalt, fine grained limestone, shale and marble have a low porosity (0.3-0.85 %) but high
strength (70-116 MPa). Volcanic tuff, evaporitic rocks, sandstone and andesite have higher porosities,
between 4% and 21.5%, but their strength decreases steadily with increasing porosity from 43 to 27.5
MPa.
Rezaeian M., 2008, Coupled tectonics, erosion and climate in the Alborz Mountains, Iran. PhD thesis, University of Cambridge; 219 p.

CHAPTER 6: Decadal Erosion Rate controls-Lithology
164
V. Tuff Evapo. Sand st. Andesite Basalt Lime st. Shale Marble
0
20
40
60
80
100
120
140
Un
co
nfi
ne
d c
om
pre
ss
ive
str
en
gth
(M
Pa
)
0.01
0.1
1
10
100
Po
ro
sity
%
Fig. 6.6.1: Unconfined compressive strength (UCS), and porosity of selected rock types estimated
from a total of 570 measurements (data from: Pariseau, 2007; Afrouz 1992; Dincer et al., 2004). Porosity
is displayed by open circles and UCS by filled circles. Bars show 2σ interval.
6-6-3 Spatial Distribution
The broad outcrop pattern of the principal lithological classes of the Alborz Mountains is shown
in Figure 6.6.2. There are two classes: (I) strong, low porosity rocks, including carbonates, meta-
sedimenatry rocks, and (П) weak, high porosity rocks, including igneous, evaporates and conglomerate-
sandstone. Their outcrop pattern has been obtained from the hydro-geological map of Iran. Each class has
a broad variability in geomechanical properties due to a large degree of lithological heterogeneity,
geological structure, and weathering. Moreover, a higher variability is expected in class (П) due to a large
range of porosity from 4 % to 21.5 %.
Rocks in class (I) dominate the north Alborz, with minor outcrops of rocks in class (II), along the
northern range front and in isolated inliers. The south flank of the mountain belt is dominated by rocks in
class (П) with carbonates of class (I) exposed in some deep incised valleys and in the hanging wall of
main thrust faults. Variability of properties within individual formations is illustrated with an example in
the next section.
Rezaeian M., 2008, Coupled tectonics, erosion and climate in the Alborz Mountains, Iran. PhD thesis, University of Cambridge; 219 p.

CHAPTER 6: Decadal Erosion Rate controls-Lithology
165
Fig. 6.6.2: Rock class map of the Alborz showing two main lithological units (compiled from:
Ministry of Energy of Iran, 1983).
6-6-4 Geomechanical Properties of the Karaj Formation
The tuffeous Eocene Karaj Formation is the only formation for which detailed geomechanical
data are available. These data were collected during the construction of a freeway from Tehran to the
Caspian Sea along two S-N tunnels with lengths of 300 m and 6,300 m (Yassaghi & Salari Rad, 2005;
Yassaghi et al., 2005). The Eocene Karaj Formation is a major component of the southern Alborz. The
magmatic sequence of the formation mainly consists of submarine volcano-sedimentary rocks of mid
Eocene age (Dedual, 1967), including green tuffs with volcanic intercalations (Emami, 2000). Along the
tunnelled sections, rocks mainly consist of lithic (up to 45%), vitiric (up to 35%) and crystalline (up to
20%) tuffs (Yassaghi et al., 2005).
Physical and mechanical characteristics of these three types of tuff and other subvolcanic rocks
are listed in Table 6.6.1. The porosity in samples varies from 7.2 to 15.2 %; it is higher in vitric and lithic
tuffs than in crystalline tuffs and andesitic-basalts.
Unconfined compressive strength is higher in vitric and lithic tuff than crystalline tuff and
andesitic-basaltic, and is negatively correlated with porosity (Table 6.6.1).
In order to investigate the effect of water on the rock strength Yassaghi et al. (2005) have also
measured unconfined compressive strength in saturated samples. Their results indicate that tuffs lose
strength by an average of 30% when saturated. The strength reduction is larger for samples with higher
porosity; it reduces from about 25% in the crystalline tuffs to 43% in the vitric ones.
This implies that volcanic tuffs and specially vitric tuffs are likely to weather fast, and prone to
failure during heavy or sustained winter and spring precipitation.
Rezaeian M., 2008, Coupled tectonics, erosion and climate in the Alborz Mountains, Iran. PhD thesis, University of Cambridge; 219 p.

CHAPTER 6: Decadal Erosion Rate controls-Lithology
166
0.0 0.2 0.4 0.6 0.8 1.0
0.0
0.2
0.4
0.6
0.8
An
nu
al
ero
sio
n (
mm
)
Proportion of catchment area covered by igneous-evaporitic rock
Rock type Porosity % UCS for natural sample
(MPa)
UCS for saturated sample
(MPa)
Lithic tuff 7.2-11.7 87-110 58-71
Vitric tuff 10.9-15.2 80-105 49-55
Crystalline tuff 9.4-10.5 100-142 78-106
Andesitic-basaltic 9.4-10.5 100-120 -
Tables 6.6.1: Mechanical properties of Karaj Formation (Yassaghi & Salari-Rad, 2005; Yassaghi et al.,
2005).
6-6-5 Substrate and Erosion
Here, the correlation between annual erosion rate and substrate is explored using catchment wide
erosion data and the proportion of the catchment area covered by each lithological class. Data have been
analysed in un-weighted and weighted format. The third statistical method of direct extrapolation is not
applicable for lithological control analyses because it is scale independent (See section 6.2).
A significant correlation exists between mean annual erosion and the fraction of a catchment
covered by igneous, evaporitic and sedimentary rocks (class П) (Fig. 6.6.3 & 6.6.4). Catchments with a
greater proportion of class II rocks have higher annual erosion rates. The correlation is enhanced when
the data is weighted for catchment area with R2 = 0.13 and 0.36 for un-weighted and weighted
approaches, respectively. Similarly, Pearson’s correlation coefficient, an index of similarity, increases
from 0.38 to 0.60 when weighting is applied.
As a complement, Figures 6.6.5 and 6.6.6 show an anti-correlation between mean annual erosion
and the fraction of a catchment covered by carbonates and clastic-metamorphic rocks (class I).
Catchments with a greater proportion of class (I) rocks have lower erosion rates. Again, the statistical
correlation improves when the data are weighted according to catchment size, R2 = 0.20 and 0.36 for un-
weighted and weighted approaches respectively. Pearson’s correlation coefficient is -0.51 and -0.57 for
un-weighted and weighted data, respectively.
Fig. 6.6.3: Annual erosion plotted against proportion of catchment area covered by class П rocks.
Bars show 2σ interval within coverage bins. (A polynomial model fits the data with: y = 0.04x2 + 0.24x +
0.12 has R2 = 0.13)
Rezaeian M., 2008, Coupled tectonics, erosion and climate in the Alborz Mountains, Iran. PhD thesis, University of Cambridge; 219 p.

CHAPTER 6: Decadal Erosion Rate controls-Lithology
167
0.0 0.1 0.2 0.3 0.4 0.5 0.6 0.7 0.8
0.0
0.1
0.2
0.3
0.4
0.5
0.6
0.7
0.8
An
nu
al
ero
sio
n (
mm
)
Proportion of catchment area covered by igneous-evaporitic rock
0.0 0.2 0.4 0.6 0.8 1.0
0.0
0.2
0.4
0.6
0.8
An
nu
al
ero
sio
n (
mm
)
Proportion of catchment area covered by carbonate-clastic-metamorphic rock
0.1 0.2 0.3 0.4 0.5 0.6 0.7 0.8 0.9 1.0
0.0
0.1
0.2
0.3
0.4
0.5
0.6
An
nu
al
ero
sio
n (
mm
)
Proportion of catchment area covered by carbonate-clastic-metamorphic rock
Fig. 6.6.4: Annual erosion plotted against proportion of catchment area covered by rocks of class
П. Data were weighted according to catchment area. Bars show 2σ interval within coverage bins. (A
polynomial model fits the data with: y = 0.03x2 + 0.53x + 0.07 has R
2 = 0.36)
Fig. 6.6.5: Annual erosion plotted against proportion of catchment area covered by rocks of class
I. Bars show 2σ interval within coverage bins. (A polynomial model fits the data with: y = -0.65x2 +
0.38x + 0.28 has R2 = 0.20)
Fig. 6.6.6: Annual erosion plotted against proportion of catchment area covered by rocks of class
I., Data were weighted according to catchment area. Bars show 2σ interval within coverage bins. (A
polynomial model fits the data with: y = -0.37x2 - 0.06x + 0.43 has R
2 = 0.36)
Rezaeian M., 2008, Coupled tectonics, erosion and climate in the Alborz Mountains, Iran. PhD thesis, University of Cambridge; 219 p.

CHAPTER 6: Decadal Erosion Rate controls-Lithology
168
In summary, of the main lithologies of the Alborz Mountains, porous tuffs and young
sedimentary rocks may be most susceptible to freeze-thaw weathering and chemical weathering. The uni-
axial compressive strength of tuffs of Karaj Formation drops by up to 43% upon saturation according to
measurements (Yassaghi et al., 2005). These volcanic tuffs dominate the southern Alborz, where up to 60
% of annual precipitation falls as snow at high elevations (Moussavi et al., 1989; Mashayekhi &
Mahjoub, 1991), making this area especially susceptible to weathering and disaggregation due to winter
freeze-thaw and spring snow melt and runoff. The north Alborz is dominated, instead by stronger, less
porous rock types. On the scale of the mountain belt, a relatively strong correlation exists between
catchment erosion rates and rock class. Catchments with a larger proportion of weak and porous rocks
systematically have higher erosion rates.
Rezaeian M., 2008, Coupled tectonics, erosion and climate in the Alborz Mountains, Iran. PhD thesis, University of Cambridge; 219 p.

CHAPTER 6: Decadal Erosion Rate Controls-Topography
169
6-7 Topography
6-7-1 Introduction
Attributes of topography may be important controls on erosion. The elevation of the Earth’s
surface represents a potential energy field, but for this energy to result in erosion, a topographic gradient
is required (cf., Strahler, 1950). Many erosion processes have a rate dependence on the local topographic
slope (e.g., Roering et al., 2007). On a global scale, this is reflected in the erosion rates of large river
catchments. Catchments with the greatest elevation difference between headwaters and base level, and/or
the steepest topographic gradient from headwaters to base level have the highest erosion rates (e.g.,
Ahnert, 1970; Summerfield & Hulton, 1994; Harrison, 2000). However, many river catchments are much
larger than the length scale of most erosion processes, and local relief can be used instead to investigate a
link between topography and erosion. Local relief is defined as the elevation difference between the
highest and lowest points in a landscape over a given distance. Thus, local relief is a measure of the
steepness of a landscape. It can be measured from digital elevation models.
Montgomery and Brandon (2002) have estimated catchment-wide average local relief worldwide.
They have found a strong, positive correlation between relief and catchment erosion rates. However, in
areas with very high erosion rates of >1 mm/yr no relation exists between local relief and erosion rate. In
such areas the modal topographic slope is typically the same as the angle of internal friction of the rock
mass (Schmidt & Montgomery, 1995; Burbank et al., 1996; Binnie, 2005; Hovius & Stark, 2006; Lin et
al., 2008), and tectonically oversteepened slopes collapse in bedrock landslides. This is a landscape with
maximum relief, set by the spacing of the major streams, determined in part by the ambient climate, and
the strength of the rock mass (cf., Roering et al., 2005). It is commonly found in active mountain belts.
This section addresses the relation between erosion, and topographic slope and relief in the
Alborz Mountains. The basis of this study is NASA’s Shuttle Radar Topographic Mission (SRTM) digital
elevation model. It has a posted horizontal resolution of 90 m and a vertical accuracy of 6.5 m in Iran
(Kiamehr & Sjoberg, 2005).
6-7-2 Elevation
The elevation of the Alborz Mountains is summarised in Figure 6.7.1. A first order distinction
can be made between the elevation of the north and south flanks of the mountain belt. The boundary
between the two flanks has been defined as the main divide between catchments draining north into the
Caspian Sea, and catchments draining south towards central Iran. The Shah Rud, located to the south of
the ridge pole of the Alborz Mountains, but draining north via the Sefid Rud, has been included in the
south flank statistics. The south flank of the mountain belt merges into the high plateau of central Iran. It
has very little topography below 1 km asl (Fig. 6.7.1).
Rezaeian M., 2008, Coupled tectonics, erosion and climate in the Alborz Mountains, Iran. PhD thesis, University of Cambridge; 219 p.

CHAPTER 6: Decadal Erosion Rate Controls-Topography
170
1,000 2,000 3,000 4,000 5,000
0
1,000
2,000
3,000
4,000
Area (
km
2)
Elevation (m)
0
2
4
6
8
10
12
Pro
po
rtio
n o
f tota
l area
(%)
Fig. 6.7.1: Elevation statistics of the south (filled bars) and north (open bars) flank of the Alborz
Mountains. The absolute surface area, and the fraction of total surface area of the mountain belt, located
within a given elevation bin are shown.
The mean elevation of the south flank is 2011 m asl. The north flank of the Alborz Mountains
has a bimodal distribution of elevations with modal peaks at 400-500 and 1600-1700 m asl., and a mean
elevation of 1617 m asl. However, a relatively large proportion of the north flank is located at elevations
significantly above the second mode, and, more importantly, sub-modal elevations have a much higher
frequency than in the south flank. This reflects the structure of the north flank, with a lower frontal range
associated with the north Alborz fault, relatively low mountains, hydrologically connected with the
Caspian Sea in the east Alborz, and a broad piedmont plain. As a result, the elevation of the north flank
has a high coefficient of variation of 0.59.
6-7-3 Slope
From the SRTM DEM, the local topographic slope was calculated at a length scale of 1000 m.
This length scale is similar to the channelisation length scale in many mountain landscapes (Meunier et
al., 2008). The slope at a point was determined as the gradient of the line of steepest descent, determined
with the flow direction setting in ArcMap, in a circle with a radius of 500, centred on that point. The
resulting slope map is shown in Figure 6.7.2. In the Alborz Mountains, the maximum value of the tangent
of the local topography is about 0.9. Very steep slopes are commonly found in the interior of the
mountain belt, often associated with outcrops of competent lithologies such as massive carbonates and
impermeable clastic-metamorphic rocks. It is important to observe that throughout the mountain belt the
local slope varies significantly at sub-catchment length scales.
Rezaeian M., 2008, Coupled tectonics, erosion and climate in the Alborz Mountains, Iran. PhD thesis, University of Cambridge; 219 p.

CHAPTER 6: Decadal Erosion Rate Controls-Topography
171
0.0 0.1 0.2 0.3 0.4 0.5 0.6 0.7 0.8 0.9 1.0
0
500
1,000
1,500
2,000
2,500
3,000
Are
a (
km
2)
Slope (tangent)
Fig. 6.7.2: Map of local slopes in the Alborz, computed at 1 km lengthscale from a 90 m Digital
Elevation Model (DEM).
The frequency distribution of local topographic slopes is different between the north and south
flanks of the mountain belt. Figure 6.7.3 shows the slope statistics of both domains, binned at intervals
equivalent to ¼ times the standard deviation of the slope frequency distribution in question. The north
flank of the mountain belt has a classic slope frequency distribution with a modal slope of 18.24° (tangent
= 0.33), close to the mean slope, and a quasi normal distribution around this peak. The broad distribution
has a slight positive skew, probably reflecting the range of rock mass strengths in the North Alborz. In
contrast, the slope frequency distribution in the south flank of the mountain belt is extremely positively
skewed, with a modal slope of only 8° (tangent = 0.15), and a much greater mean slope of 15.02° (tangent
= 0.27).
Fig. 6.7.3: Frequency distribution of local topographic slopes in south (filled bars) and north
(open bars) flank of the Alborz Mountains.
Notwithstanding the apparent match of steep slopes and strong rocks in the high mountains, the
modal topographic slopes are significantly lower than the likely angle of internal friction of the rock mass
(see section 6.6) in most of the Alborz. This may be due in part to the length scale of the slope
Rezaeian M., 2008, Coupled tectonics, erosion and climate in the Alborz Mountains, Iran. PhD thesis, University of Cambridge; 219 p.

CHAPTER 6: Decadal Erosion Rate Controls-Topography
172
measurements, which is greater than the length scale of many mechanically controlled hillslope segments.
However, it may also imply that the mountain belt has not systematically attained maximum relief. A
weak, although positive, correlation between the mean local slope of catchments and the proportion of the
catchment consisting of carbonates and clastic-metamorphic rocks (R2 = 0.09; Pearson’s correlation
coefficient = 0.31) confirms this notion, but it is not clear in general that the greater steepness of the
northern Alborz has its origin in rock mechanics. Throughout the mountain belt, deep weathering profiles
are found above intact rock mass, together with important accumulations of colluvium. It is likely that
these materials, and their erosion, rather than the properties of the intact parent rock, set the local
topographic slope (cf., Montgomery, 2001).
The control of slope over erosion in the Alborz has been investigated using three statistical
methods, applied to the integral data set as well as separate data for each of the range flanks. Lumped, un-
weighted catchment-wide averages of topographic slope and erosion rate are poorly, if negatively
correlated (R2 = 0.06; Pearson’s correlation coefficient = -0.17; n = 82). Weighting of the data for
catchment size does not improve the correlation (R2 = 0.00004; Pearson’s correlation coefficient = 0.003;
n = 82), nor does direct extrapolation of the data to take into account spatial heterogeneity at the sub-
catchment scale (R2 = 0.001; Pearson’s correlation coefficient = 0.03; n = 2515).
When split, the data show significant differences between the north and south flanks of the
mountain belt. In the north flank, no relation between slope and erosion rate is detected by any of the
three statistical methods (R2 = 0.09, 0.004, and 0.01; Pearson’s correlation coefficient = -0.30, 0.08, and
0.01 for lumped un-weighted, lumped and weighted, and extrapolated data, respectively). However, there
is some indication that local topographic slope and catchment-wide erosion rates are positively correlated
in the south flank of the Alborz Mountains (R2 = 0.07, 0.03, and 0.18; Pearson’s correlation coefficient =
0.27, 0.17, and 0.36 for lumped un-weighted, lumped and weighted, and extrapolated data, respectively)
(Fig. 6.7.4 displays this correlation for the extrapolated data). There is a hint of threshold behaviour in the
south flank data. Erosion rate increases systematically with mean local slope up to slope values of about
15°, but appears to be constant on steeper slopes. This could signal a transition to a limit landscape
dominated by bedrock landslides in weak volcaniclastic rocks (see section 6.6). For comparison, the angle
of internal friction of comparable rocks in the Coastal Range of east Taiwan is 28° (Ramsey et al., 2006).
In the light of the finding in previous sections that the ratio of annual runoff/precipitation, and
vegetation density are controls on erosion, their correlation with slope is explored here (Fig. 6.7.5 &
6.7.6). A significant positive correlation between annual runoff/precipitation and local topographic slope
in south flank of the Alborz does imply a topographic control on erosion in this area. In the north flank,
this control is little pronounced. Pearson’s correlation coefficients for this relation are 0.13 in the north
and 0.85 in the south (Fig. 6.7.5).
Rezaeian M., 2008, Coupled tectonics, erosion and climate in the Alborz Mountains, Iran. PhD thesis, University of Cambridge; 219 p.

CHAPTER 6: Decadal Erosion Rate Controls-Topography
173
0.0 0.1 0.2 0.3 0.4 0.5
0.0
0.1
0.2
0.3
0.4
0.5
0.6
0.7
An
nu
al
ero
sio
n (
mm
)
Mean slope (tangent)
0.12 0.14 0.16 0.18 0.20 0.22 0.24 0.26 0.28
0.1
0.2
0.3
0.4
0.5
0.6
0.7
0.8
0.9
1.0
An
nu
al ru
no
ff /
an
nu
al
prec
ipit
ati
on
Mean slope (tangent)
Fig. 6.7.4: Annual erosion rate and mean slope estimated for 2515 data points in the Alborz,
segregated for north (open squares) and south (filled squares) flank. Bars show 2σ interval within slope
bins (A polynomial model fits the data for south flank with: y = -3.82x2 + 2.40x + 0.08; R
2= 0.18).
In the light of the finding in previous sections that the ratio of annual runoff/precipitation, and
vegetation density are controls on erosion, their correlation with slope is explored here (Fig. 6.7.5 &
6.7.6). A significant positive correlation between annual runoff/precipitation and local topographic slope
in south flank of the Alborz does imply a topographic control on erosion in this area. In the north flank,
this control is little pronounced. Pearson’s correlation coefficients for this relation are 0.13 in the north
and 0.85 in the south (Fig. 6.7.5).
Fig. 6.7.5: The ratio annual runoff/precipitation plotted against mean local slope for 95 drainage
basins in the Alborz. Data for north flank (open squares) and south flank (filled squares) have been
separated. Bars show 2σ interval within slope bins. (Polynomial models fit the data for north and south
flanks with: y = 16.07x2 - 5.93x + 0.97; R
2 = 0.09, and y = 1.33x
2 + 2.89x - 0.04; R
2 = 0.73, respectively).
6-7-4 Relief
Local relief was calculated from the SRTM DEM at an arbitrary length scale of 1km to be able to
capture intra-catchment variability. This length scale has no specific physical significance, but it has been
kept constant in order to enable direct comparison of relief across the mountain belt. Figure 6.7.6 is a
relief map of the Alborz Mountains. Maximum local relief in the mountain belt is about 600 m, in strong
carbonates and recent volcanic rocks of the Damavand area. High relief is also found in the crystalline
Rezaeian M., 2008, Coupled tectonics, erosion and climate in the Alborz Mountains, Iran. PhD thesis, University of Cambridge; 219 p.

CHAPTER 6: Decadal Erosion Rate Controls-Topography
174
massif of Alam Kuh, and along substantial outcrops of carbonates and clastic-metamorphic rocks in the
interior of the mountain belt, but at the catchment scale, relief and the proportion of these rocks are
essentially uncorrelated (R2 = 0.05; Pearson’s correlation coefficient = 0.09).
Fig. 6.7.6: Distribution of local relief in the Alborz. The local relief was computed within a
500m-radius circle of every grid cell using a 90 m digital elevation model (DEM), and smoothed at 1km
resolution.
In the north flank of the mountain belt, relief frequencies are normally distributed (Fig. 6.7.7),
with modal and mean relief of 260m and 270 m, respectively. In the south flank the equivalent values are
200 m and 214 m, and the frequency distribution is positively skewed. The coefficient of variation of
relief is nearly identical for both flanks, 0.50 to 0.56.
Not surprisingly, local topographic slope and local relief are strongly correlated in the Alborz
Mountains. Figures 6.7.8 shows the mean local slope and mean local relief of areas with a unit size of 15
km2, equivalent to the size of the smallest gauged catchment in the mountain belt. The data can be
described by a relation R = -1411.7S2 + 1343.3S + 76.14, where R is the mean local relief, S is the mean
local slope (R2 = 0.55; Pearson’s correlation coefficient = 0.69). There are very few places in the
mountain belt with local relief of >500 m at 1 km length scale. The equivalent local slope at that length
scale is 26.5°. This is close to mechanical limites to topographic steepness observed elsewhere. However,
most of the topography does not attain this steepness, and may therefore not be at a landslide threshold.
Instead, weathering-limited mass wasting may be the dominant mode of hillslope erosion.
Rezaeian M., 2008, Coupled tectonics, erosion and climate in the Alborz Mountains, Iran. PhD thesis, University of Cambridge; 219 p.

CHAPTER 6: Decadal Erosion Rate Controls-Topography
175
0.0 0.1 0.2 0.3 0.4 0.5
0
100
200
300
400
500
Re
lie
f (m
)
Slope (tangent)
0 100 200 300 400 500 600
0
500
1,000
1,500
2,000
2,500
3,000
3,500
Area
(k
m2)
Relief (m)
Fig. 6.7.7: Frequency distribution of local relief over 1 km in the south (filled bars) and north
(open bars) flanks of the Alborz.
Fig. 6.7.8: Mean relief and slope estimated for 2515 cells in the Alborz. Those were sampled
discretely across the range; unit area is computed according to the smallest watershed. Local relief has
been estimated within a 500m-diameter circle of every grid cell. (R2= 0.55; y = -1411.7x
2 + 1343.3x +
76.14). Bars show 2σ confidence interval.
The control of relief over erosion in the Alborz has been investigated using three statistical
methods, applied to the integral data set as well as separate data for each of the range flanks. On the scale
of the mountain belt, lumped, un-weighted catchment-wide averages of topographic relief and erosion
rate are poorly, if negatively correlated (R2 = 0.003; Pearson’s correlation coefficient = -0.04; n = 87).
Weighting of the data for catchment size does not improve the correlation (R2 = 0.004; Pearson’s
correlation coefficient = 0.03; n = 87), nor does direct extrapolation of the data to take into account spatial
heterogeneity at the sub-catchment scale (R2 = 0.02; Pearson’s correlation coefficient = 0.05; n = 2515).
When split the data show significant differences between the north and south flanks of the
mountain belt. In the north flank, no relation between local relief and erosion rate is detected by any of
the three statistical methods (R2 = 0.03, 0.007, and 0.005; Pearson’s correlation coefficient = -0.16, 0.10,
and 0.09 for lumped un-weighted, lumped and weighted, and extrapolated data, respectively). However,
local topographic relief and catchment-wide erosion rates are positively correlated in the south flank of
the Alborz Mountains (R2 = 0.17, 0.07, and 0.29; Pearson’s correlation coefficient = 0.40, 0.23, and 0.53
Rezaeian M., 2008, Coupled tectonics, erosion and climate in the Alborz Mountains, Iran. PhD thesis, University of Cambridge; 219 p.

CHAPTER 6: Decadal Erosion Rate Controls-Topography
176
50 100 150 200 250 300 350 400 450 500
0.0
0.1
0.2
0.3
0.4
0.5
0.6
0.7
0.8
An
nu
al
ero
sio
n (
mm
)
Relief (m)
for lumped un-weighted, lumped and weighted, and extrapolated data, respectively). Figure 6.7.9 shows
this correlation for extrapolated data.
Fig. 6.7.9: Annual erosion rate and mean local relief for 2515 data points in the Alborz. Data for
north (open squares) and south (filled squares) have been segregated. Bars show 2σ interval within relief
bins (Polynomial models fit the data for south and north flanks with: y = -2E-06x2 + 0.002x - 0.01; R
2 =
0.29, and y = 2E-06x2 - 0.001x + 0.29; R
2 = 0.06, respectively).
Given the role of the ratio of annual runoff/precipitation as a control on erosion, it’s correlation
with relief is explored here (Fig. 6.7.10). As for local topographic slope, a significant positive correlation
is found between annual runoff/precipitation and local relief in south flank of the mountain belt, but not in
the north (R2 and Pearson’s correlation coefficient are 0.87 and 0.93, and 0.16 and 0.13 for the south and
north flank, respectively).
In conclusion, mean annual erosion rates appear not to be controlled by local slope and
topographic relief at the scale of the mountain belt. However, within the southern Alborz, erosion is
significantly, and positively correlated with both these topographic characteristics. This may be due, in
part, to the effect of topographic slope on the runoff/precipitation ratio, which results in a more efficient
translation from rainfall to surface flow in steeper terrain. Another cause may be the concentration of
vegetation and biomass in parts of the landscape with the lowest topographic slopes and relief. This
tendency is visible both in the south and the north flank of the mountain belt (Fig. 6.7.11). If it is a control
on erosion, then it has been overridden by other factors in the northern Alborz, where topographic
characteristics do not correlate meaningfully with catchment erosion.
Rezaeian M., 2008, Coupled tectonics, erosion and climate in the Alborz Mountains, Iran. PhD thesis, University of Cambridge; 219 p.

CHAPTER 6: Decadal Erosion Rate Controls-Topography
177
100 150 200 250 300 350 400
0.1
0.2
0.3
0.4
0.5
0.6
0.7
0.8
0.9
1.0
An
nu
al ru
no
ff / a
nn
ual p
recip
ita
tio
n
Mean relief (m)
0.10 0.15 0.20 0.25 0.30
0.05
0.10
0.15
0.20
0.25
0.30
0.35
0.40
An
nu
al E
VI
Mean slope (tangent)
Fig. 6.7.10: The ratio of annual runoff/precipitation plotted against mean relief for 95 watersheds
in the Alborz. Data for north (open squares) and south (filled squares) have been segregated. Bars show
2σ interval within relief bins (Polynomial models fit the data for south and north flanks with: R2 = 0.87; y
= 3E-06 x2 + 0.001x - 0.01 & R
2 = 0.16; y = 1E-05 x
2 - 0.005x + 1.05, respectively).
Fig. 6.7.11: Annual EVI plotted against mean slope for 95 watersheds in the Alborz. Data for
north (open squares) and south (filled squares) have been segregated. Bars show 2σ interval within relief
bins (Polynomial models fit the data for south and north flanks with: R2 = 0.47; y = 1.20 x
2 - 0.71x + 0.18
& R2 = 0.28; y = -1.80 x
2 - 0.09x + 0.37, respectively).
Rezaeian M., 2008, Coupled tectonics, erosion and climate in the Alborz Mountains, Iran. PhD thesis, University of Cambridge; 219 p.

CHAPTER 6: Decadal Erosion Rate Controls-Stream Power
178
6-8 Stream power
6-8-1 Introduction
Stream power provides an expression of the rate of energy expenditure at a given point in a river
system and is inherently linked to sediment transport competence, and the ability of the stream to perform
geomorphic work on its bed. The concept was introduced by Gilbert (1914), and developed by Rubey (1933),
Knapp (1938), Velikanov (1954), and Bagnold (1956, 1966). The expression for total stream power is:
Ω=γQS, (6.8.1)
where Ω is total stream power per unit length of channel (W m−1
), γ is the specific weight of water (9807
N/m2), Q is discharge (m
3/s) and S is the energy slope of the stream. Total stream power is calculated over the
entire width of the channel. It does not specify how much energy is available per unit bed area. Specific
stream power provides a measure of the rate of energy expenditure per unit area of channel bed and is
expressed as:
ω=Ω/W, (6.8.2)
where ω is specific stream power (W/m2) and W is the width (m) of the active channel. Downstream
hydraulic geometry relations established for a range of rivers indicate that at bankfull flow, channel width is
approximately proportional to the square root of discharge (Leopold & Maddock, 1953; Knighton, 1996;
Church, 2002; Finnigan et al., 2005).
I have calculated unit stream power in the Alborz Mountains, using the SRTM DEM with a posted
resolution of 90 m to measure local slope along the line of steepest descent in a 3 x 3 grid cell area, and total
annual discharge at a point calculated by interpolation of runoff measurements discussed in section 6.5. From
high-resolution (<15 m) satellite images, channel width was estimated at 14 stations in the central west
Alborz (Fig. 6.8.1). At these stations, the relationship between channel width and mean daily discharge can
be described by a power law (R2 = 0.49, Pearson’s correlation coefficient = 0.70):
W = 23Q0.56
, (6.8.3)
in good agreement with the general model described above.
Rezaeian M., 2008, Coupled tectonics, erosion and climate in the Alborz Mountains, Iran. PhD thesis, University of Cambridge; 219 p.

CHAPTER 6: Decadal Erosion Rate Controls-Stream Power
179
1 10
10
100
41-115
17-041
15-017
15-011
15-023
41-121
14-02141-109
41-139
41-143
41-117
15-001
15-005
15-007
Ch
an
nel w
idth
(m
)
Mean daily discharge (m3/s)
Fig. 6.8.1: River channel width and mean annual discharge in the Alborz (R2= 0.49; Pearson’s
correlation coefficient = 0.70). The solid line is a nonlinear least-square fit to the data. Widths were measured
as the distance between banks discernible on high resolution satellite images (<15m)
6-8-2 Spatial-Temporal Distribution
Figure 6.8.2 shows the distribution of unit stream power across the Alborz Mountains, with local
values ranging from 0.1 W/m2 to 4.5 W/m
2. High values are found in areas with high runoff and steep slopes
in the north Alborz, especially in catchments receiving snow melt discharge from the high mountains of Alam
Kuh and Damavand. Notably, the small catchments in the northern range front of the mountain belt receive
most precipitation, but have relatively low topographic slopes, subduing local unit stream power values.
Lower values of <2.5-3 W/m2 are characteristic of the drier southern Alborz.
Fig. 6.8.2: Unit stream power in the Alborz, derived from slope map and interpolation of daily
discharge measurements at 81 hydrometric stations operated by TAMAB. The map was smoothed at
catchment scale using a circular moving mean with 15km diameter, and is displayed at 1 km spatial
resolution.
Rezaeian M., 2008, Coupled tectonics, erosion and climate in the Alborz Mountains, Iran. PhD thesis, University of Cambridge; 219 p.

CHAPTER 6: Decadal Erosion Rate Controls-Stream Power
180
0.10 0.12 0.14 0.16 0.18 0.20 0.22 0.24 0.26 0.28 0.30
0.5
1.0
1.5
2.0
2.5
3.0
3.5
4.0
An
nu
al
str
ea
m p
ow
er
(W/m
2)
Slope (tangent)
0 200 400 600 800 1000
0.5
1.0
1.5
2.0
2.5
3.0
3.5
An
nu
al
str
ea
m p
ow
er
(W/m
2)
Annual runoff (mm)
Both total annual runoff and local topographic slope are strong controls on the pattern of unit stream
power in the Alborz Mountains. Unit stream power increases systematically with annual runoff up to the
values of about 600 mm (Fig. 6.8.3), typically found in the south flank of the mountain belt, but decreases at
higher discharges. Topographic slope is strongly and linearly correlated with unit stream power (Fig. 6.8.4),
with R2 = 0.56 and Pearson’s correlation coefficient = 0.76. In the north flank of the Alborz Mountains, slope
and runoff are essentially uncorrelated, but in the south flank steeper slopes have higher runoff rates (section
6-7).
Fig. 6.8.3: Average annual unit stream power and runoff for 91 watersheds in the Alborz. Bars show
2σ interval within runoff bins. (A polynomial model fits the data with: y = -2E-06x2 + 0.004x + 0.68; R
2 =
0.22)
Fig. 6.8.4: Average annual unit stream power and mean local slope for 87 watersheds in the Alborz.
Bars show 2σ interval within slope bins. (A linear model fits the data with: y = 11.94x - 0.79; R2 = 0.56)
Across the Alborz Mountains, stream power is negatively correlated with vegetation. In both flanks
of the mountain belt, unit stream power is high, on average 2.25-2.75 W/m2 where EVI<0.10, but the rate of
decrease of unit stream power with increasing EVI is greater in the south flank than in the north flank (Fig.
6.8.5). Given that EVI is positively correlated with precipitation, and therefore runoff (section 6.5), the trends
Rezaeian M., 2008, Coupled tectonics, erosion and climate in the Alborz Mountains, Iran. PhD thesis, University of Cambridge; 219 p.

CHAPTER 6: Decadal Erosion Rate Controls-Stream Power
181
0.16
0.20
0.24
0.28
0.32
0.36
0.40
0.44
0.16
0.20
0.24
0.28
0.32
0.36
0.40
0.44
0.5 1.0 1.5 2.0 2.5 3.0 3.5
No
rma
lize
d s
ea
so
na
l s
tre
am
po
we
r
Spring
Summer
Autumn
Winter
Annual stream power (W/m2)
0.05 0.10 0.15 0.20 0.25 0.30 0.35 0.40
0.5
1.0
1.5
2.0
2.5
3.0
3.5
4.0
An
nu
al str
eam
po
wer (
W/m
2)
Annual EVI
observed in Figure 6.8.5 imply a strong negative correlation of EVI and topographic slope, where vegetation
density is greatest on gentle slopes (see section 6.7).
Fig. 6.8.5: Average annual unit stream power and mean annual EVI for 76 watersheds in the Alborz.
Data for the south (filled squares) and north (open squares) flank have been segregated. Bars show 2σ interval
within EVI bins. (Polynomial models fit the data with: y = 28.02x2 - 18.09x + 4.17; R
2 = 0.29, and y = -
232.85x2 + 26.28x + 1.23; R
2 = 0.26, for north and south, respectively).
As a consequence of the seasonality of precipitation and runoff (sections 6-3 and 6-5, respectively),
stream power varies through the year in the Alborz Mountains. Due to the constant contribution of local
topographic slope, the seasonality of stream power is subdued, but 32% of the cumulative annual stream
power is achieved in spring, 29% in winter, 25 % in autumn, and 14% in summer.
Across the mountain belt spring is consistently the season with the greatest cumulative stream power,
but where the total annual stream power is smallest, the winter component outweighs the summer and autumn
components, whereas winter has the smallest relative contribution where total annual stream power is greatest
(Fig. 6.8.6).
Fig. 6.8.6: Normalized average seasonal and annual unit stream power for 91 watersheds in the
Alborz. Bars show 2σ interval within stream power bins.
Rezaeian M., 2008, Coupled tectonics, erosion and climate in the Alborz Mountains, Iran. PhD thesis, University of Cambridge; 219 p.

CHAPTER 6: Decadal Erosion Rate Controls-Stream Power
182
0 1 2 3 4
0.0
0.2
0.4
An
nu
al
ero
sio
n (
mm
)
Unit stream power (W/m2)
6-8-3 Stream power and Erosion
Three statistical approaches have been taken to explore the stream power control on erosion in the
Alborz Mountains. Lumped, un-weighted analysis reveals no relation between catchment average values of
total annual unit stream power and catchment erosion rates (R2 = 0.0002; Pearson’s correlation coefficient =
0.04). Direct extrapolation of data gives a similarly poor correlation of the two parameters (R2 = 0.007;
Pearson’s correlation coefficient = 0.04), but weighting of the data according to catchment size yields a very
weak positive correlation of stream power and erosion rate (R2 = 0.04; Pearson’s correlation coefficient =
0.2), dominated by larger catchments (Fig. 6.8.7).
Fig. 6.8.9: Annual erosion rate and average annual unit stream power for 81 drainage basins in the
Alborz. Each data point is weighted based on the catchment area. Error bars show 2σ interval within stream
power bins.
Therefore, it must be concluded that average annual unit stream power is not a first order
control on the ongoing erosion of the Alborz Mountains. This surprising and important finding
implies that topographic and runoff effects on erosion cancel each other on the scale of the mountain
belt, and/or that other controls override the effect of stream power.
Within the physiognomically and lithologically more homogeneous domains of the northern
and southern flanks of the mountain belt, some effects of stream power can be discerned. In the
southern Alborz, annual erosion rates are positively correlated with average annual stream power (R2
= 0.17; Pearson’s correlation coefficient = 0.40) (Fig. 6.8.10), but in the northern Alborz no significant
correlation has been found (R2 = 0.03; Pearson’s correlation coefficient = -0.06).
The relation between catchment erosion and available stream power can also be considered
on a season-by-season basis. The result, shown in Fig. 6.8.11, is similar to that in Fig. 6.5.22 for
erosion and runoff. This is not surprising, given that runoff is a principal term of stream power.
There is a broad trend of increasing seasonal erosion with increasing seasonal stream power, from
which individual seasons deviate. In winter, the proportion of erosion is independent of the
Rezaeian M., 2008, Coupled tectonics, erosion and climate in the Alborz Mountains, Iran. PhD thesis, University of Cambridge; 219 p.

CHAPTER 6: Decadal Erosion Rate Controls-Stream Power
183
0.10 0.15 0.20 0.25 0.30 0.35 0.40
-0.2
-0.1
0.0
0.1
0.2
0.3
0.4
0.5
0.6
0.7
0.8
0.9 Spring
Summer
Autumn
Winter
Frac
tio
n o
f an
nu
al ero
sio
n
Fraction of annual stream power
0.5 1.0 1.5 2.0 2.5 3.0
-0.1
0.0
0.1
0.2
0.3
0.4
0.5
0.6
0.7
0.8
An
nu
al e
ro
sio
n (
mm
)
Annual stream power (W/m2)
proportion of total annual stream power, and in spring and autumn areas with high seasonal stream
power have disproportionally high seasonal erosion rates. The important implication is that other
factors than stream power or its terms suppress erosion in winter, and elevate erosion in spring and
autumn.
Fig. 6.8.10: Average annual erosion and unit stream power for 81 drainage basins in the Alborz. Data
for the south (filled squares) and north (open squares) flank have been segregated. Bars show 2σ interval
within stream power bins. (Polynomial models fit the data with: y = 0.03 x2 - 0.15x + 0.33, y = 0.06 x
2 -
0.04x + 0.20 for north and south, respectively).
Fig. 6.8.11: Proportion of annual erosion and annual unit stream power for 73 watersheds in the
Alborz. Bars show 2σ interval within fraction of stream power bins.
The relation between catchment erosion and available stream power can also be considered
on a season-by-season basis. The result, shown in Fig. 6.8.11, is similar to that in Fig. 6.5.22 for
erosion and runoff. This is not surprising, given that runoff is a principal term of stream power.
There is a broad trend of increasing seasonal erosion with increasing seasonal stream power, from
which individual seasons deviate. In winter, the proportion of erosion is independent of the
proportion of total annual stream power, and in spring and autumn areas with high seasonal stream
power have disproportionally high seasonal erosion rates. The important implication is that other
Rezaeian M., 2008, Coupled tectonics, erosion and climate in the Alborz Mountains, Iran. PhD thesis, University of Cambridge; 219 p.

CHAPTER 6: Decadal Erosion Rate Controls-Stream Power
184
factors than stream power or its terms suppress erosion in winter, and elevate erosion in spring and
autumn.
Rezaeian M., 2008, Coupled tectonics, erosion and climate in the Alborz Mountains, Iran. PhD thesis, University of Cambridge; 219 p.

CHAPTER 6: Decadal Erosion Rate Controls-Discussion
185
6-9 Discussion
Table 6.9.1 and figure 6.9.1 summarise the strength of precipitation, runoff, vegetation density, substrate
properties, topographic attributes and stream power as controls over catchment erosion in the Alborz
Mountains. In this table, correlation strengths are expressed as r-squared values, given for data covering the
integral Alborz, and data covering the north or south flank of the mountain belt only.
Table 6.9.1: R-squared values for polynomial and linear fit (between annual erosion rate and its controls).
Erosion driving control r-squared value (polynomial fit) r-squared value (linear fit)
Precipitation (total) 0.01 0.01
Precipitation (N) 0.08 0.08
Precipitation (S) 0.07 0.03
Runoff (total) 0.06 0.04
Runoff (N) 0.12 0.12
Runoff (S) 0.10 0.004
Runoff/ Prec.(total) 0.08 0.12
Runoff/ Prec.(N) 0.08 0.07
Runoff/ Prec.(S) 0.35 0.32
Vegetation (total) 0.13 0.0009
Vegetation (N) 0.17 0.10
Vegetation (S) 0.22 0.16
Lithology (class I) 0.20 0.26
Lithology (class I) (N) 0.24 0.29
Lithology (class I) (S) 0.37 0.00005
Lithology (class II) 0.13 0.14
Lithology (class II) (N) 0.10 0.15
Lithology (class II) (S) 0.15 0.0002
Slope (total) 0.06 0.04
Slope (N) 0.13 0.09
Slope (S) 0.07 0.14
Relief (total) 0.003 0.002
Relief (N) 0.03 0.02
Relief (S) 0.17 0.16
Stream power (total) 0.0002 0.002
Stream power (N) 0.03 0.004
Stream power (S) 0.17 0.16
The first observation from the table and figure (6.9.1) is that no single variable explains a major part
of the observed pattern of average annual erosion, neither on the scale of the mountain belt, nor within
individual range flanks. However, two variables explain aspects of the erosion pattern at the scale of the
mountain belt. They are lithology (specifically the presence of relatively strong sedimentary and
(meta)sedimentary rocks within the catchment), and vegetation density, and of these two lithology appears to
be the stronger control (R2 = 0.26, and R
2 = 0.13, respectively). Interestingly, both these variables set the
erodibility of the catchment surface, rather than the erosivity of the processes that mobilise material. The
importance of erodibility is confirmed by the fact that the presence of hard rocks in the catchment, rather than
Rezaeian M., 2008, Coupled tectonics, erosion and climate in the Alborz Mountains, Iran. PhD thesis, University of Cambridge; 219 p.

CHAPTER 6: Decadal Erosion Rate Controls-Discussion
186
0
0.05
0.1
0.15
0.2
0.25
0.3
0.35
0.4
Pre
cip
itatio
n (to
tal)
Pre
cip
itatio
n (N
)
Pre
cip
itatio
n (S
)
Ru
no
ff (tota
l)
Ru
no
ff (N)
Ru
no
ff (S)
Ru
no
ff/pre
cip
itatio
n (to
tal)
Ru
no
ff/pre
cip
itatio
n (N
)
Ru
no
ff/pre
cip
itatio
n (S
)
Slo
pe
(tota
l)
Slo
pe
(N)
Slo
pe
(S)
Re
lief (to
tal)
Re
lief (N
)
Re
lief (S
)
Stre
am
po
we
r (tota
l)
Stre
am
po
we
r (N)
Stre
am
po
we
r (S)
Ve
ge
tatio
n (to
tal)
Ve
ge
tatio
n (N
)
Ve
ge
tatio
n (S
)
Stro
ng
su
bstra
te (c
lass I)
Stro
ng
su
bstra
te N
(cla
ss I)
Stro
ng
su
bstra
te S
(cla
ss I)
We
ak s
ub
stra
te (c
lass II)
We
ak s
ub
stra
te N
(cla
ss II)
We
ak s
ub
stra
te S
(cla
ss II)
R-s
qu
are
d v
alu
e
polynomial fit linear fit
the presence of soft rocks correlates with erosion rates. Weak, porous rocks are more erodible, making it
more likely for factors setting erosivity to dominate the erosion pattern.
Fig. 6.9.1: R-squared value for the polynomial and linear fit between annual erosion and factors
which control the annual erosion (See Table 6.9.1).
Substrate and surface strength are the only demonstrable control on the pattern of erosion on the scale
of the mountain belt. Factors commonly thought to set erosion patterns, including precipitation, runoff,
topographic slope and stream power, do not act notably as controls on this scale. Their effect is masked by
the effects of rock strength and weatherability, and vegetation cover.
Lithologically, two domains can be distinguished within the Alborz Mountains. One is dominated by
the relatively strong rocks (meta)sedimentary rocks mentioned above. The other is dominated by weaker,
more weatherable volcanics, volcaniclastics, conglomerates and evaporites. The boundary between domains
runs approximately parallel to the main divide, such that the first rock type builds the north flank of the
Alborz Mountains, and the second rock type builds the south flank. These domains coincide to first order
with the Hyrcanian forest province in the northern Alborz and the Irano-Touranian arid to semi-arid flora of
the southern Alborz. Thus, there is a major zonation of erodibility within the mountain belt, between a highly
erodible southern zone, and a less erodible northern zone. The boundary between these zones is located
around the main divide of the mountain belt. Within each domain, and especially in the south flank of the
Alborz, other controls on erosion emerge from the statistics.
Rezaeian M., 2008, Coupled tectonics, erosion and climate in the Alborz Mountains, Iran. PhD thesis, University of Cambridge; 219 p.

CHAPTER 6: Decadal Erosion Rate Controls-Discussion
187
Average annual runoff (R2 = 0.10), the ratio of annual runoff/precipitation (R
2 = 0.35), local relief (R
2
= 0.17), and stream power defined as the product of runoff and local slope (R2 = 0.17), all account
meaningfully for an aspect of the pattern of erosion observed within the south flank of the mountain belt.
They add to the base effects of lithology, notably the presence of strong rocks in the catchment (R2 = 0.37)
and vegetation cover (R2 = 0.22), which continue to dominate on this sub-regional scale. At this scale, the
ratio of runoff/precipitation emerges as a strong control on erosion, and a high runoff efficiency typically
translates into a high erosion rate.
Both runoff and precipitation are highly seasonal throughout the Alborz, and especially in the south
flank of the mountain belt, as is the density of vegetation. In fact, runoff peaks in spring when snow melt
adds to seasonal rains, vegetation cover is low, and the long season of freeze-thaw weathering comes to a
close. This is when erosion rates are highest in the southern Alborz, and maximum erosion rates are found
where the topographic relief and associated stream power are greatest.
In the north flank of the mountain belt, where strong sedimentary and meta-sedimentary rocks
dominate, the effects of the drivers of erosion are more obscured, but the broad conclusions from analysis of
data from the south flank do apply here too. However, the seasonality of erosion is different in the north,
with an emphasis on fluvial sediment transport in autumn in the wettest parts of the mountain belt. I have
attributed this to a combination of high infiltration and evapotranspiration rates with optimal vegetation cover
in summer, which prevent sediment mobilised during rain storms from travelling far down river channels, and
to a remarkable base flow into rivers in the northern Alborz in autumn, which enhances their capacity to
transport clastic loads.
In the final chapter of this thesis, I shall use these findings to explain the long-lived pattern of exhumation of
the Alborz Mountains, and explore consequences for the structural and topographic evolution of this and
other mountain belts.
Rezaeian M., 2008, Coupled tectonics, erosion and climate in the Alborz Mountains, Iran. PhD thesis, University of Cambridge; 219 p.