Chapter 5 Stability of complex formation between a donor...
29
Chapter 5 Stability of complex formation between a donor azo dye and an acceptor molecule at the air-water interface 5.1 Introduction The phenomena of complex formation are seen in various systems in surface science. There are many ways a complex can be formed and their mechanisms and interactions are very different. In biological systems, there have been reports on the complex formation between cholesterol and di-palmitoyl phosphatidyl choline at the air-water interface [1, 2]. Here, the interactions between the polar heads are important which lead to the formation of a con- densed complex system. A complex formation in the mixed monolayer of oppositely charged lipid groups(dioctadecyl dimethyl ammonium bromide with sodium hexadecyl sulfate), has been reported [3]. Here, the electrostatic interactions play a dominant role and led to a large reduction in the A/M in the mixed monolayer. Mixed Langmuir monolayer studies are useful in stabilizing the monolayers with func- tional properties. For the stabilization one needs to understand the interactions between the monolayer components in the mixed film. There are a few reports in the literature on the mixed monolayer behavior of a dye with a liquid crystalline(LC) material. A mixed mono- layer study on the non-amphiphilic dichroic azo dye with an amphiphilic LC molecule, 8CB has been reported [4]. Their studies indicated that the azo dye which possessed both donor and acceptor groups at the ends did not form a stable mixed monolayer. However, an azo dye 89
Transcript of Chapter 5 Stability of complex formation between a donor...

Chapter 5
Stability of complex formation between adonor azo dye and an acceptor moleculeat the air-water interface
5.1 Introduction
The phenomena of complex formation are seen in various systems in surface science. There
are many ways a complex can be formed and their mechanisms and interactions are very
different. In biological systems, there have been reports on the complex formation between
cholesterol and di-palmitoyl phosphatidyl choline at the air-water interface [1, 2]. Here,
the interactions between the polar heads are important which lead to the formation of a con-
densed complex system. A complex formation in the mixed monolayer of oppositely charged
lipid groups(dioctadecyl dimethyl ammonium bromide with sodium hexadecyl sulfate), has
been reported [3]. Here, the electrostatic interactions play a dominant role and led to a large
reduction in the A/M in the mixed monolayer.
Mixed Langmuir monolayer studies are useful in stabilizing the monolayers with func-
tional properties. For the stabilization one needs to understand the interactions between the
monolayer components in the mixed film. There are a few reports in the literature on the
mixed monolayer behavior of a dye with a liquid crystalline(LC) material. A mixed mono-
layer study on the non-amphiphilic dichroic azo dye with an amphiphilic LC molecule, 8CB
has been reported [4]. Their studies indicated that the azo dye which possessed both donor
and acceptor groups at the ends did not form a stable mixed monolayer. However, an azo dye
89

with only a donor group at one end and no acceptor group at the other end formed a stable
miscible mixed monolayer upto 0.8 MF of 8CB.
A mixed Langmuir monolayer study on liquid crystal molecules in which one compo-
nent with an electron donor group and the other with an electron acceptor group has been
reported [5]. Here the two individual monolayers were unstable in time at constant surface
pressure. The equilibrium spreading pressure for the individual components were found to
be zero. On the other hand, the mixed monolayer formed a condensed phase exhibiting large
reduction in the A/M and was found to be stable with time. Several studies have discussed
the importance of dye doped liquid crystals. This chapter deals with the miscibility stud-
ies in the mixed monolayer of an azo dye, p-(ethoxy)p-phenylazo phenyl hexanoate(EPPH)
with 8CB. There are many reports on azo dye in the literature on the more polar nature
of the cis form(3.0 to 3.5 Db) compared with the trans form(0 to 0.5 Db) [6, 7, 8]. This
change in the polarity affects the monolayer phases and its rheological properties [9]. Their
studies show that, in the cis-form, the monolayer yields an isotropic, Newtonian film which
cannot be oriented by surface flows. However, reverting the molecule back to trans form
led to the formation of compact monolayer which responds to flow with an anisotropic and
non-Newtonian behavior.
5.2 Experiment
The materials EPPH(Eastman Kodak) and 8CB(Aldrich) were obtained commercially. EPPH
was recrystallised using ethanol as a solvent and 8CB was used as procured. The isomers of
EPPH are shown in Figure 5.1. The structure of EPPH in trans state is shown in Figure 5.1(a).
The molecule is rod like with core length of about 9Å. The structure of EPPH in cis state
is shown in Figure 5.1(b). Here, the molecule is in bent form with core dimension of 5.5
Å. A change in geometry for the azo dye from a rod shape to bent shape can be induced
by photo-illuminating the azo dye with UV or visible radiation. For the EPPH azo dye, the
trans(rod shape) form can be converted to cis(bent shape) form by irradiating UV light of
360 nm wavelength. In the cis-form, the length of the molecule decreases but, the effective
90

O
N
N
CH
3
OO
CH
3
9A
o
(a) Trans isomer of EPPH
O
O
CH 3
O
NN
CH 3
o
5.5 A
(b) Cis isomer of EPPH
Figure 5.1: Structure of EPPH isomers.
area which it occupies increases. To revert back the molecule to trans form one can either
use blue light(400 nm) for faster relaxation or can keep it in dark for slower relaxation.
The set up for the study of the surface pressure(π) - area per molecule(A/M) isotherm has
been described in detail in chapter-3. Stock solution of 1.5 mM concentration was used to
prepare the mixtures. The barriers were compressed at the rate of 1.1 (Å2/molecule)/min.
The temperature was maintained at 28±0.7 ◦ C by circulating water. The relative humidity
was about 80±5 %. The π-A/M experiments were usually carried out in dark for the mixed
monolayer unless otherwise mentioned.
We have carried out epifluorescence microscopy on this system wherein a fluorescent
dye, NBDHDA, of about 1% molar concentration in the monolayer was used. The details
are given in chapter-3. Brewster angle microscopy(BAM) technique was used for the obser-
vation of the monolayer phases. Mini-BAM with a laser of wavelength 632 nm was incident
on the water surface at Brewster angle (53◦) and the reflected light from the interface was
allowed to fall on the detector. The presence of the monolayer alters the Brewster angle
91

condition leading to a change in reflectivity. This change in the reflectivity will give rise to
a contrast in the BAM images. The pixel dimensions of the CCD detector was nearly square
and was of 8.3 µm x 8.2 µm. The field of view was 6.4 x 4.8 mm2 and the resolution was
of the order of 200 µm. The monolayer imaged under BAM with a large field of view gives
information on the homogeneity and phase coexistence.
5.2.1 Setup for Photo-induced conformational change
The experiments were conducted in a dark room to avoid stray light which can affect the
dye. The schematic diagram of the setup used for observing the textures under BAM for
the azo monolayer and their mixtures is shown in Figure 5.2. To study the effect of photo-
12 2
4
7
86
5
3
Figure 5.2: A schematic diagram of the setup for photo-illumination and BAM microscopyobservations of the monolayer. 1.) Nima 611M trough, 2.) Barriers, 3.) Water, 4.) Photo-active azo monolayer, 5.) Mercury arc lamp(100 W) 6.) Replaceable filters for UV(peakedat 360 nm) and visible excitations(above 420 nm) 7.) Aluminium reflectors and 8.) Brewsterangle microscope(Mini-BAM).
illumination on the mixed monolayer we used a standalone Mercury arc lamp of 100 W.
Filter(Schott) of 1 mm thickness was used to allow the 360 nm radiation. To revert back to
trans form filter which allow 440 nm radiation was used. The intensities at 360 nm and 440
nm were 0.5 mW/cm2 and 0.5 mW/cm2 respectively. The lamp was placed some 15 cm away
92

from the monolayer to reduce heating effects. Aluminium covers were used as reflectors.
5.3 Results
The surface pressure(π)-area per molecule(A/M) isotherm for EPPH-8CB mixed monolayer
is shown in Figure 5.3. The individual EPPH monolayer exhibited a plateau region below
an A/M of 30 Å2
where the surface pressure was less than 0.1 mN/m. Upon compression,
the surface pressure increased steeply. The monolayer collapsed at a surface pressure of
15.2 mN/m with a limiting area(A0) of 26 Å2. The isotherm for 8CB was in agreement with
earlier reports [10, 11]. For the mixed monolayers, there was a drastic reduction in the A0
value. This was maximum at 0.5 MF of EPPH in 8CB. For all the compositions of EPPH,
the isotherms exhibited only one collapse pressure indicating a good miscibility.
010
2030
4050 0
0.20.4
0.60.8
10
5
10
15
20
25
(m
N/m
)π
o
MFA/M (A )
2
EPPH
Figure 5.3: Surface pressure(π) - area per molecule(A/M) isotherm for EPPH-8CB mixedmonolayer at various mole fractions(MF) of EPPH in 8CB at t = 28 ◦C.
93

Another interesting result was the nature of the collapse in the isotherms. For the case
of EPPH monolayer, after the collapse, the surface pressure drastically falls down. For the
case of 8CB monolayer, the collapse was followed by a plateau region which is referred as
“plateau” type collapse. This behavior is referred as “spike” type collapse. For the mixed
monolayer, “plateau” type collapse behavior was found upto 0.7 MF of EPPH in 8CB. The
“spike” behavior of collapse was seen at higher concentrations of EPPH. The collapse pres-
sure is an important parameter in judging the miscibility and the stability for the mixed
Langmuir monolayer. Figure 5.4 shows the variation of collapse pressure for EPPH-8CB
mixed monolayer with increasing MF of EPPH in 8CB. It can be seen that the collapse pres-
sure value increases with MF of EPPH and reaches a maximum at 0.7 MF and decreases at
higher MF. Interestingly, we find that the magnitudes of the collapse pressure for the mixed
monolayer were higher than that of the individual monolayers.
0 0.2 0.4 0.6 0.8 10
5
10
15
20
25
30
MFEPPH
Col
laps
e P
ress
ure
(mN
/m)
Figure 5.4: Variation of the collapse pressure with increasing mole fraction(MF) of EPPH in8CB.
We have carried out Brewster angle microscopy(BAM) studies on the mixed monolayer
94

of EPPH and 8CB for various compositions under dark conditions. The BAM images ob-
tained for EPPH monolayer are shown in Figure 5.5. At large A/M, corresponding to the zero
surface pressure region, the monolayer appeared stiff with irregularly shaped islands sepa-
rated by voids. The islands exhibited grainy textures(Figure 5.5(a)). The voids decreased
(a) 135 Å2
(b) 46.2 Å2
(c) 23.5 Å2
(d) 20.3 Å2
(e) 13.1 Å2
Figure 5.5: Brewster angle microscopy(BAM) images for EPPH at different A/M. Figure (a)and (b) show the presence of irregularly shaped islands with voids between them. Theseislands are rough and possess grainy texture. Figure(c) shows the disappearance of voids.Figure(d) shows the occurrence of bright spots indicating the onset of nucleation. Figure(e)shows the presence of 3D crystals in the collapsed state. Scale of each image is 6.4 x 4.8mm2.
progressively upon compression(Figure 5.5(b)). They disappeared completely at an A/M
of 23.5 Å2
corresponding to the steep region of the isotherm (Figure 5.5(c)). On further
compression, the monolayer collapsed to 3D crystals(Figure 5.5(d) and 5.5(e)). The BAM
images for the mixed monolayer at 0.7 MF of EPPH in 8CB are shown in Figure 5.6. The
textures differs drastically from that of the EPPH monolayer alone. Here, the textures were
homogeneous with less defects and voids(Figure 5.6(a) and 5.6(b)). At lower A/M, the im-
95

(a) 54.5 Å2
(b) 20.5 Å2
(c) 18.4 Å2
(d) 15.4 Å2
Figure 5.6: BAM images for 0.7 MF of EPPH in 8CB. Figures (a) and (b) show the presenceof homogeneously covered monolayer. Figures (c) and (d) show the collapsed state of themixed monolayer. Here the bright spots indicate 3D crystals which coexists with multilayersin the background. Scale of each image is 6.4 x 4.8 mm2.
ages show the nucleation of small crystallites which appeared as bright spots (Figures 5.6(c)
and 5.6(d)). The BAM images taken for the mixed monolayer of 0.5 MF of EPPH in 8CB
are shown in Figure 5.7. The images were similar to that of 0.7 MF of EPPH. At very low
A/M, an uniform and homogeneously covered film was observed(Figure 5.7(a)). At lower
A/M, they exhibited similar textures (Figure 5.7(b) and 5.7(c)). In the collapsed state, a few
bright dots were observed in the mixed monolayer at 0.7 MF of EPPH in 8CB. The bright
dots were much less. We found that with the increasing presence of 8CB uniform and homo-
geneous texture was formed. The BAM images for the mixed monolayer at 0.3 MF of EPPH
96

(a) 112.9 Å2
(b) 35.9 Å2
(c) 25.1 Å2
(d) 14.1 Å2
Figure 5.7: BAM images for 0.5 MF of EPPH in 8CB. Figures(a) to (c) exhibit a homoge-neous and uniformly covered monolayer. Figure(d) shows the collapsed state of the mixedmonolayer. Here the texture is predominantly uniform with a few bright spots(3D crystals).Scale of each image is 6.4 x 4.8 mm2.
in 8CB are shown in Figure 5.8. In this case also, the mixed monolayer appeared uniform
and homogeneous(Figure 5.8(a)). In the collapse stated, appearance of very small bright dots
were seen(Figure 5.8(b)). These brighter domains are multilayers and were found to grow
more(Figures 5.8(c) and 5.8(d)). The varying intensity of the multilayer domains indicate
varying thickness. The BAM images for pure 8CB are shown in Figure 5.9. The coexisting
G(dark region) + L1(bright region) phase is shown in Figure 5.9(a). With compression, L1
phase appeared and the G domains diminished in size(Figure 5.9(b)). Above the collapse,
the appearance of three layer (D1) domains was observed as small grains (Figure 5.9(c)).
97
(a) 40.6 Å2
(b) 18.5 Å2
(c) 14.2 Å2
(d) 13.5 Å2
Figure 5.8: BAM images for 0.3 MF of EPPH in 8CB. Figure(a) shows the predominantlypresent condensed monolayer which appeared uniform and homogeneous. Figure(b) showsthe collapsed state indicating the onset of small bright dots. Figures (c) and (d) show domainsof varying intensities(multilayers). Scale of each images is 6.4 x 4.8 mm2.
With compression, the fusion of D1 domains are seen(Figures 5.9(d) to 5.9(f)). At lower
A/M, a nearly uniform coverage of the D1 phase was seen(Figure 5.9(g)). At still lower
A/M, the images show the presence of multilayers(D2) which were much brighter than the
D1 domains. These observations are in accordance with the earlier BAM and epifluorescence
microscopic techniques on 8CB monolayer [10, 11, 12].
We have calculated thermodynamic excess functions for the mixed monolayer of EPPH
and 8CB. For an ideal case of either complete miscibility or complete immiscibility, the law
98

(a) 113.3 Å2
(b) 56.7 Å2
(c) 34.9 Å2
(d) 17.9 Å2
(e) 14.5 Å2
(f) 13.8 Å2
(g) 13.1 Å2
(h) 9.3 Å2
Figure 5.9: BAM images for 8CB. Figure(a) shows the coexisting G + L1 phase. Figure(b)shows the homogeneously covered L1 phase. In Figure(c), the nucleation of the three layerD1 domains from the L1 phase is seen. Figures (d) to (f) show progressive fusion of theD1 domains leading to an uniform coverage(Figure(g)). Figure(h) shows the occurrence ofmany bright spots which represent the multilayer D2 domains coexisting with D1 domains.Scale of each image is 6.4 mm x 4.8 mm2.
of additivity of areas is given by,
Aid = AEPPHXEPPH + A8CBX8CB (5.1)
where, Aid is the ideal A/M, AEPPH and A8CB are the A/M for the pure monolayer com-
ponents, XEPPH and X8CB are the mole fractions of EPPH and 8CB respectively. The Aid
99

calculated using the values obtained for individual monolayer was compared with the ex-
perimentally determined A/M(A12) for the mixed monolayer. A deviation from the ideal
behavior indicates the presence of interactions between the monolayer components in the
mixture. The variation of Aid and A12 with MF of EPPH in 8CB at different surface pres-
0.0 0.2 0.4 0.6 0.8 1.0
20
25
30
35
40
45
50
o
A
/M (
A2)
MFEPPH
1 mN/m
2 mN/m
3 mN/m
4 mN/m
Figure 5.10: Plot of experimentally determined A/M, A12(dashed lines) and computed idealA/M, Aid (continuous lines) with mole fraction of EPPH in 8CB.
sures are shown in Figure 5.10. A marked deviation in A12 from Aid was seen for the mixed
monolayer. The excess or deficit of area per molecule (Aexc) for the mixture from that of the
ideal case will indicate the type of interactions. This is given by,
Aexc = A12 − Aid (5.2)
The Aexc being positive indicates that the interactions are repulsive and the Aexc being neg-
ative indicates that the interactions are attractive. The variation of Aexc with increasing MF
of EPPH in 8CB at different surface pressures are shown in Figure 5.11. We find that the
Aexc is negative throughout the EPPH composition. The maximum condensation was found
100

to occur(-13 Å2) at 0.5 MF of EPPH in 8CB. This indicated that the molecules in the mixed
monolayer are compactly packed. The degree of stability for the mixed monolayer was ana-
0.0 0.2 0.4 0.6 0.8 1.0
-14
-12
-10
-8
-6
-4
-2
0
2
Ae
xc(A
2)
MFEPPH
1 mN/m
2 mN/m
3 mN/m
4 mN/m
o
Figure 5.11: Plot of the excess A/M, Aexc with mole fraction(MF) of EPPH in 8CB. Themaximum condensation is seen at 0.5 MF of EPPH in 8CB.
lyzed by calculating the excess Gibbs free energy. The excess Gibbs free energy, ∆Gexc, for
the mixed monolayers at constant surface pressures was obtained by integrating the excess
area, Aexc, over surface pressure [13]. This is given by,
∆Gexc = Na
∫ π
π∗Aexcdπ (5.3)
Here, π∗ is the surface pressure at which the two components of the mixed monolayer behave
ideally(usually taken as zero) and Na is the Avogadro number. The variation of the excess
Gibbs free energy(∆Gexc) with increasing MF of EPPH in 8CB at different surface pressures
is shown in Figure 5.12. The ∆Gexc is found to be negative throughout the composition and
is minimum at 0.5 MF of EPPH in 8CB. This indicated that the mixed monolayer was stable
at all compositions and the maximum degree of stability occurs at 0.5 MF for ∆Gexc value of
about -275 J/mol.
101

0.0 0.2 0.4 0.6 0.8 1.0
-300
-250
-200
-150
-100
-50
0
∆∆ GE
XC (
J/m
ol)
MFEPPH
1 mN/m
2 mN/m
3 mN/m
4 mN/m
Figure 5.12: Variation of the excess Gibbs free energy, ∆Gexc with increasing mole frac-tion(MF) of EPPH in 8CB at different surface pressures. At 0.5 MF of EPPH in 8CB, apronounced minima is seen for different surface pressures.
The static compressional elastic modulus(|E|) is a measure of the monolayer resistance
towards change in area. In general, it provides information on the rigidity of the mixed
monolayer system. According to Davies and Rideal [14], the monolayer phases can be clas-
sified based on the magnitude of |E| (Table 5.1). It is calculated from the π - A/M isotherm
using,
|E| = (A/M)(dπ /d(A/M)) (5.4)
Higher value of |E| implies that the system possess low in-plane elasticity. The variation
Table 5.1: Magnitude of compressional elastic modulus, |E|, in different monolayer phases
Phase Clean Surface L1 L2 S
|E| (mN/m) 0 10 - 50 100 - 250 1000 - 2000
102

of compressional elastic modulus, |E| with surface pressure, π is shown in Figure 5.13 for
EPPH-8CB mixed monolayer. Here, we find that for the mixed monolayer the value of |E|
above 0.5 MF of EPPH in 8CB is higher when compared with that of individual monolayer.
The individual monolayers of EPPH and 8CB yielded |E| values of 35 mN/m and 100 mN/m
0 5 10 15 20 25 300
50
100
150
200
250
300|E
| (m
N/m
)
0.0 MF 0.1 MF 0.3 MF 0.5 MF 0.7 MF 0.9 MF 1.0 MF
π
(mN/m)
Figure 5.13: Variation of compressional elastic modulus, |E|, with surface pressure at differ-ent mole fraction(MF) of EPPH in 8CB.
at a surface pressure of 5 mN/m respectively. The |E| exhibited a maximum value of about
250 mN/m at 0.7 MF of EPPH and at a surface pressure of 12 mN/m. This indicated a higher
rigidity for the mixed monolayer.
The temporal behavior of the monolayers were analyzed by monitoring the kinetics
through area relaxation and surface pressure relaxation in a dark environment. In the area
relaxation method, the surface pressure is fixed. To maintain the surface pressure, the barri-
ers need to move correspondingly to adjust the area. Monitoring the variation of area with
time provides information on the material loss at the A-W interface. The evolution of area
103
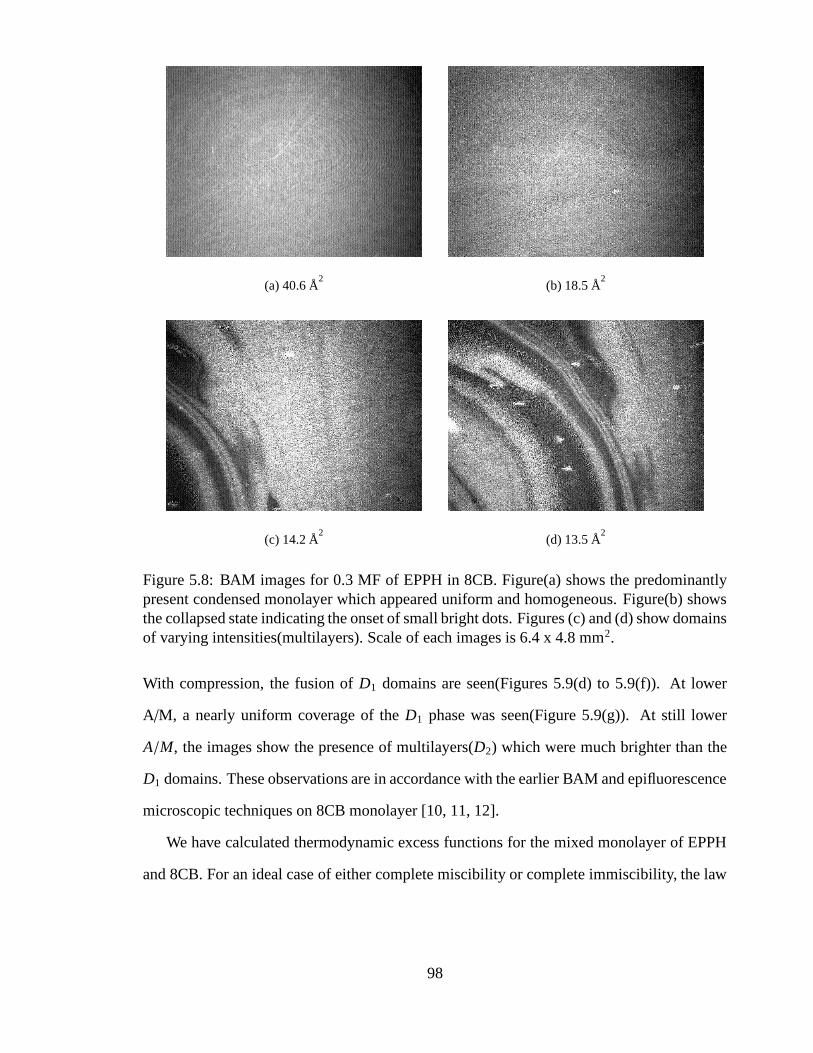
with time for different EPPH compositions is shown in Figure 5.14. For the case of EPPH
monolayer at a surface pressure of 5 mN/m, the An decreases gradually. The normalized
area(An) is defined at a given surface pressure(π0) as the ratio of the A/M, A, at a given time
to the initial A/M, A0. At higher surface pressures(10 mN/m) decrease in An was rapid for
EPPH monolayer. However, for the case of 0.5 MF of EPPH and 0.7 MF of EPPH in 8CB,
the decrease in An were negligible (at π0 values of 5 mN/m and 10 mN/m).
0.7
0.8
0.9
1
0 5 10 15 20 25 30
0.4
0.6
0.8
1
EPPH0.5 MF EPPH0.7 MF EPPH
A n
A n
Time (minutes)
π = 5 mN/m0
π 0
= 10 mN/m
Figure 5.14: Variation of the normalized area, An with increasing time at a given surfacepressure π0 at different mole fractions(MF) of EPPH in 8CB.
The kinetics of the surface pressure variation with time at given area per molecule
was studied for the monolayers. In this method, we have used a compression rate of
2.8 (Å2/molecule)/min. to reach the desired surface pressure. This method did not perturb
the monolayer since there was no barrier movement. The analysis of the variation of π with
104

time provides information on the kinetics of reorganisation of the molecules in the mono-
layer and on the kinetics of collapse of the monolayer [3]. The πn is defined as the ratio of
the surface pressure(π) which varies with time from the initial surface pressure(π0) attained
at a given area per molecule. The change in normalized surface pressure, πn, with time for
different compositions are shown in Figure 5.15. For EPPH monolayer, the surface pressure
falls gradually from the initial π of 5 mN/m. For an initial π of 10 mN/m, the fall in π was
rapid. Also the plot showed a bump around 7.5 minutes. In general, there is a fall in the
surface pressure as a function of time. However, this is less for the case of 0.5 MF of EPPH
in 8CB.
0.2
0.4
0.6
0.8
1EPPH 0.5 MF EPPH 0.7 MF EPPH
0 5 10 15 20 25 30Time (minutes)
0
0.2
0.4
0.6
0.8
1
π nπ n
Figure 5.15: Variation of the normalized surface pressure, πn, with increasing time and atdifferent mole fractions(MF) of EPPH in 8CB.
We have probed the photo stability of the monolayers by alternately illuminating them
105

at given area per molecule with UV and visible radiation. When illuminated with UV ra-
diation, the EPPH molecules, which have a photo-active azo moiety changes from trans to
cis isomer in the mixed monolayer. On illuminating with visible light, it reverts back to
trans isomer. These transformations from cis to trans and trans to cis leads to change in the
surface pressure. The variation in surface pressure for EPPH monolayer on alternately illu-
minating with UV and visible radiation with time is shown in Figure 5.16. The monolayer
when illuminated with UV radiation leads to a sudden jump in the surface pressure from a
value of about 4.5 mN/m to 11 mN/m. However, when illuminated with visible radiation
instead of UV radiation the surface pressure drops to about 2 mN/m. Repeated cycles of
alternately UV and visible illumination yields a pattern as shown in Figure 5.16. We find,
in general, for repeated cycles a decrease in the peak surface pressure for UV illumination.
Correspondingly the dip(decrease from the initial surface pressure during repeated cycles of
illumination) arising due to visible illumination also decreases with repeated cycles.
0 5 10 15 20 25 30Time (minutes)
2
4
6
8
10
12
π (
mN
/m)
EPPH - 5 mN/m
Figure 5.16: Variation in the surface pressure(π) on alternately illuminating with UV andvisible radiation for EPPH monolayer. Here the initial surface pressure was 4.5 mN/m.
106

We have carried out photo-stability tests on the mixed monolayer. The variation of the
surface pressure with time on alternately illuminating with UV and visible radiation is shown
in Figure 5.17. For 0.7 MF of EPPH, the variation in surface pressure with time upon alter-
nately illuminating with UV and visible radiation showed a similar trend as that of the pure
EPPH. This shows that even in the mixture, the transformation from trans to cis occurred
indicating a weaker association between the components forming the complex. This trend is
shown in Figure 5.17(a).
107

5 10 15 20 25Time (minutes)
2
4
6
8
10
12
π (
mN
/m)
0.7 MF EPPH - 5 mN/m0.7 MF EPPH - 10 mN/m
(a)
5 10 15 20 25Time (minutes)
4
5
6
7
8
9
10
11
π (m
N/m
)
0.5 MF EPPH - 5 mN/m0.5 MF EPPH - 10 mN/m
(b)
Figure 5.17: Variation of the surface pressure(π) in the mixed monolayer at different molefraction(MF) of EPPH in 8CB on alternate UV and visible illumination.
108

Similar trend was seen for 0.5 MF of EPPH but with less variation in peak surface pres-
sure and dip(decrease from the initial surface pressure during repeated cycles of illumina-
tion) values on alternately illuminating with UV and visible radiation. This is shown in
Figure 5.17(b). This showed that the dissociation of complex occurs even in the mixed
monolayer. To confirm the weak complex formation we have undertaken a direct BAM
imaging during the alternate UV and visible irradiation on the pure and mixed monolayer
for EPPH-8CB system. Figure 5.18 shows the texture of the EPPH monolayer changing
with time upon illumination. The initial grainy islands transformed to bright dots when it
(a) t=5 m;UV (b) t=7 m;V (c) t=13 m;UV
Figure 5.18: Brewster angle microscope images for EPPH monolayer during alternate illu-mination of ultra-violet(UV) and visible(V) radiation. Figure(a) shows the presence of brightdots appearing with the grainy texture in the background when illuminated using UV radia-tion. Figure(b) shows the presence of grainy islands with decrease in the number of brightdots when illuminated using visible radiation. Figure(c) shows the further increase of brightdots when illuminated using UV radiation. Scale of each image is 6.4 x 4.8 mm2.
was UV illuminated(Figure 5.18(a)). Less bright dots were observed upon visible illumi-
nation(Figure 5.18(b)). In general, upon UV illumination, more bright dots were seen to
nucleate(Figure 5.18(c)). The repeated runs led to increase in the growth of crystallites even
in visible radiation. The in-situ BAM imaging during alternate UV-visible illumination for
0.5 MF of EPPH in 8CB at a surface pressure of 5 mN/m is shown in Figure 5.19. At this
surface pressure, reversible demixing and mixing occurred during alternate UV and visible
illumination. We have undertaken in-situ BAM imaging during repeated UV and visible
illumination. This is carried out for 0.5 MF of EPPH in 8CB at a higher surface pressure
of 14 mN/m(Figure 5.20). At this surface pressure phase separation of 8CB rich phase and
109

(a) t=0 m;V (b) t=3 m;UV (c) t=4 m;V (d) t=4 m 30 s;V
(e) t=5 m;V (f) t=9 m;UV (g) t=10 m;UV (h) t=11 m;V
(i) t=14 m;V (j) t=16 m;V (k) t=18 m 30s;UV (l) t=21 m;UV
(m) t=23 m 30 s;V (n) t=27 m ;V (o) t=31 m ;V
Figure 5.19: Brewster angle microscopy images for 0.5 MF of EPPH in 8CB at 5 mN/mwith alternate UV and visible(V) irradiation. Figure(a) shows the initial homogeneous anduniform texture. Figure(b) shows the appearance of voids under UV illumination. Figures (c)to (e) show the disappearance of voids on illuminating with visible light. Figures (f) and (g)show the textural change under the second cycle of UV illumination. Here a phase separationto 8CB rich phase and EPPH rich phase was observed. Figures (h) to (j) show the evolutionfrom the immiscible phase to a homogeneous and uniform phase indicating a miscibilityunder visible illumination. Figures (k) and (i) show the phase separation occurring duringUV illumination in the third cycle. Figures (m) to (o) show the evolution from the phaseseparated to miscible monolayer during visible illumination. Scale of each image is 6.4 x 4.8mm2.
110

EPPH rich phase was observed. This separated phases were not miscible fully during visible
irradiation even for longer durations.
(a) t=2 m;UV (b) t=5 m;UV (c) t=10 m;UV (d) t=12 m;V
(e) t=18 m;V (f) t=22 m;V (g) t=27 m;V (h) t=30 m;V
(i) t=30 m 30s;UV (j) t=30 m 50s;UV (k) t=37 m;UV (l) t=42 m 30s;V
(m) t=54 m;V (n) t=69 m;V (o) Overnight;V
Figure 5.20: BAM images of 0.5 mole fraction(MF) of EPPH in 8CB at 14 mN/m withalternate UV and visible(V) radiation. The initial texture was uniform and homogeneous.Figures (a) to (c) show the appearance of grainy texture during UV illumination. Figures (d)to (h) show development of streaks and less bright domains during visible radiation in thefirst cycle. Figures (i) to (k) show the bright fluidic domains appearing from the less brighttexture during UV illumination. Figures (l) to (o) show the transformation of bright textureto less bright texture during visible radiation in the second cycle. The pattern did not changeback to uniform and homogeneous film even after leaving overnight. Scale of each image is6.4 x 4.8 mm2.
111
5.4 Discussions
The experiments on EPPH monolayer and EPPH - 8CB mixed monolayer were carried out
in dark environment. The studies on the behavior of the pure and mixed monolayer were
carried out using surface manometry, collapse pressure behavior, BAM imaging, thermody-
namic excess function calculations and temporal stability. The π-A/M isotherm for the mixed
monolayer exhibited a single collapse pressure for all EPPH compositions. This indicated
a good miscibility between the EPPH and 8CB molecules. The collapse pressures for the
mixed monolayer were higher in the range of 0.3 to 0.7 MF of EPPH in 8CB as compared to
the collapse pressures for the individual monolayer(4.7 mN/m for 8CB and 15.1 mN/m for
EPPH). The maximum collapse pressure occurred at 0.7 MF of EPPH in 8CB and was 25
mN/m. This indicated a much better stability of the mixed monolayer. The EPPH monolayer
exhibited a spike after the collapse where the surface pressure decreased rapidly. The 8CB
monolayer exhibited a plateau region after the collapse where the surface pressure was con-
stant. For the mixed monolayer, the nature of collapse projects a transition from the spike
to a plateau. Upto 0.7 MF of EPPH, the π-A/M isotherm exhibited a plateau. The spike
nature of collapse occurred for higher concentrations of EPPH. Such collapse behavior has
been reported in systems with dissociated polar heads [15]. Recent studies in cholesterol and
phospholipid system indicated that the mechanism of collapse was similar to that of liquid
crystalline compounds at the air-water interface [16]. Though the interactions are quite dif-
ferent, we found a transition from a “spike” to “plateau” in our system. There was a drastic
reduction in the limiting area per molecule(A0) value for the mixed film and the reduction
was maximum at 0.5 MF. This indicated a highly condensed mixed monolayer.
The Brewster angle microscopy imaging on pure EPPH indicated large irregularly shaped
islands with grainy textures separated by voids in between them(Figures 5.5(a) and 5.5(b)).
We observed the nucleation and subsequent growth of crystallites even before the collapse
for EPPH monolayer(Figure 5.5(d)). The occurrence of bright 3D crystals indicated the
collapse(Figure 5.5(e)). The presence of 8CB in EPPH stabilized the mixed monolayer. The
112
Brewster angle microscopy images at a composition of 0.3, 0.5 and 0.7 MF of EPPH in
8CB indicated an uniform bright and homogeneous textures till collapse. In all these cases,
there were less occurrences of bright 3D crystals after the collapse. This indicated that the
presence of 8CB inhibits the crystal formation in EPPH tending to form multilayers.
Our thermodynamic excess function analysis indicated a deviation from the ideality in
the A/M for the mixed monolayer. This showed the presence of interactions in the mixed
monolayer. The excess A/M calculated was negative indicating an attractive interactions.
The maximum degree of condensation was at 0.5 MF of EPPH. The reduction in the A/M of
about -13 Å2
was seen at 0.5 MF which is an indication for higher degree of condensation.
The components in the mixed monolayer tend to form a compact monolayer which was more
stable at air-water interface. The excess Gibbs free energy shows a value of about -275 J/mol
at 0.5 MF of EPPH in 8CB indicating a stable complex formation between the components
in the mixed monolayer [7].
The analysis of the |E| reveals the rigidity for the mixed monolayer. From the magni-
tude of |E|, we infer that the mixed monolayer is a condensed monolayer. Based on these
analysis and our BAM studies we conclude that this is likely to be a variant of L2 phase.
A weak charge transfer interactions between the donor EPPH and acceptor 8CB molecules
might have played a role in the formation of the complex at the A-W interface. Due to the
quenching of the fluorescent dye epifluorescence studies on these systems was not possible.
The quenching might be due to the complex formation of EPPH with fluorescent dye which
is an electron acceptor.
The temporal stability for the EPPH monolayer and mixed monolayer were investigated
under dark conditions. Drastic reduction of normalized area(An) with time for EPPH was ob-
served when compared to that of mixed monolayer. This indicated that the EPPH molecules
tend to nucleate and form crystals with time even at low surface pressure. This is also sup-
ported by our BAM imaging for EPPH monolayer(Figure 5.5). The presence of 8CB with
EPPH stabilized the mixed monolayer and there was negligible reduction in the An with
time (Figure 5.14). The analysis on the variation of An with time indicated the stability and
113
low nucleation rate for the mixed film when compared with EPPH alone. The analysis on
the variation of πn with time for the EPPH monolayer and mixed monolayer indicated that
there was some reorganisation of the molecules in the monolayer of EPPH which resulted
in the appearance of bump. Stable monolayer are the ones whose dissolution rates in the
subphase are very small when compared with the compression speed. The monolayer tends
to reorganize when the compression is stopped towards a state where the free energy is min-
imum. This reorganization should be faster than the dissolution rates. The magnitude of
reorganisation depends on compression and increases with increase in compression rate.
Our experiments on monitoring the surface pressure variation during alternate illumi-
nation of UV and visible radiation indicated a decreasing trend in the peak and dip values
in the surface pressure for EPPH. This was due to the formation of 3D crystals in EPPH
as indicated by our in-situ BAM imaging (Figure 5.18). However, in the mixtures at 0.5
MF and 0.7 MF of EPPH in 8CB, the fall in the peak value and the dip value of surface
pressures upon alternate UV and visible illumination was less when compared with EPPH
monolayer(Figure 5.17). The peak and the dip in surface pressure values from the initial
surface pressure were similar for EPPH, 0.5 MF of EPPH and 0.7 MF of EPPH mixtures.
This shows that the complex formation was not very strong and can be dissociated by UV
illumination where the azo dye transformed from the trans state to cis state.
We have also carried out Brewster angle microscopy imaging to probe the stability of
the complex by photo illumination for EPPH-8CB mixed monolayer system. Though the
mixed monolayer was condensed as observed in BAM(under dark conditions), the photo-
illumination caused dissociation of complex. This indicated a weaker complex formation
between the EPPH and 8CB molecules. Our experiments on 0.5 MF of EPPH in 8CB in-
dicated that at low surface pressure(5 mN/m) the mixed monolayer phase separated during
UV illumination and was miscible during visible radiation(Figure 5.19). The experiments
carried out at higher surface pressure(14 mN/m) for 0.5 MF of EPPH in 8CB indicated that
the system phase separated permanently(Figure 5.20).
Raduge et. al. have reported [17] experiments and simulations on an azo system which
114

provides vital information on the macroscopic change in wetting at the molecular level. Their
experiments clearly demonstrate that the photo-transformation of the azo dye into cis and
trans isomers causes change in the orientation of the static dipoles with respect to the surface
normal, thus leading to the surface energy difference.
In bulk systems for liquid crystalline mixtures, the stability of the mesophase can be
enhanced or a new mesophase can be induced. Acceptor-donor molecules form a class of
charge-transfer complexes which results in the induced mesophase. Here, the presence of
specific polar ends whose tendency is to withdraw electrons or donate electrons towards the
rigid core make it either electron deficient or electron rich [18, 19]. Other phenomena such
as enhanced birefringence, polar diffraction gratings [20, 21], dye induced orientation of the
liquid crystalline molecules [22], optical recording [23] and optical switching [24] are some
of the novel applications of these photo-active systems. Photo-induced wetting and their
controllability by proper design of the photo-active compounds yield better stability and
durability. These developments are promising for patterned growth and photo-lithography
applications [17], [25].
We have carried out surface manometry, kinetic studies on surface pressure and area,
compressional elasticity modulus, Brewster angle microscopy and thermodynamic studies
on the EPPH - 8CB mixed monolayer. Based on these studies, we conclude that the mixed
monolayer is stable when compared to individual molecules. The presence of 8CB in EPPH
inhibits the formation of crystallites in EPPH and tend to form multilayers above the col-
lapse. The condensed area and the increase in collapse pressure for the mixed monolayer
reveals the formation of the complex. The stability of the complex was checked with photo-
illumination. The azo moiety of EPPH transforms from trans to cis upon illumination in
EPPH-8CB mixed system. On illumination with visible light, the reverse transformation
from cis to trans occurred in the mixed system. Based on BAM studies for mixed system,
at low surface pressure, reversible demixing and mixing occurred during alternate UV and
visible illumination. However, phase separation was permanently seen at higher surface
pressures.
115

Bibliography
[1] S.L. Keller, W.H. Pitcher III, W.H. Huestis and H.M. McConnell, Phys. Rev. Lett., 81,
5019, 1998.
[2] S. L. Keller, A. Radhakrishnan and H.M. McConnell, J. Phys. Chem. B, 104, 7522,
2000.
[3] M.I. Viseu, A.M.G. Silva and S.M.B. Costa, Langmuir, 17, 1529, 2001.
[4] T. Martynski, A. Biadasz and D. Bauman, Liquid Crystals, 29, 281, 2002.
[5] A. Ohlmann, W. Rettig, S. Diele, F. Kuschel and W. Weissflog, Thin Solid Films, 199,
181, 1991.
[6] J.J. DeLang, J.M. Robertson and I. Woodward, Proc. R. Soc. London, Ser. A., 171, 398,
1939.
[7] B. Stiller, P. Karageorgiev, T. Jungling, D. Prescher, T. Zetzsche, R. Dietel, G.
Knochenhauer and L. Brehmer, Mol. Crys. Liq. Cryst., 355, 401, 2001.
[8] N. Sarkar, S. Bhattacharjee and S. Sivaram, Langmuir, 13, 4142, 1997.
[9] K.S. Yim and G.G. Fuller, Phys. Rev. E, 67, 041601, 2003.
[10] N.G.M.D. Mul and J.A. Mann Jr., Langmuir, 10, 2311, 1994.
[11] M.C. Friedenberg, G.G. Fuller, C.W. Frank and C.R. Robertson, Langmuir, 10, 1251,
1994.
[12] K. A. Suresh and A. Bhattacharyya, Langmuir, 13, 1377, 1997.
116

[13] F.C. Goodrich, Proceedings of the 2nd International Congress on Surface Activity, But-
terworths(London), 1, 85, 1957.
[14] J.T. Davies and E.K. Rideal, Interfacial Phenomena, Academic Press:NY, pp 265,
1961.
[15] A. Angelova, D. Vollhardt and R. Ionov, J. Phys. Chem, 100, 10710, 1996.
[16] W.R. Schief, M. Antia, B.M. Discher, S.B. Hall and V. Vogel, Biophys. Jour., 84, 3792,
2003.
[17] C. Raduge, G. Papastavrous, D.G. Kurth and H. Motschmann, Eur. Phys. Jour. E, 10,
114, 2003.
[18] D. Demus, G. Pelzl, N.K. Sharma and W. Weissflog, Mol. Crys. Liq. Cryst., 76, 241,
1981.
[19] K. Praefcke and D. Singer in Hand book of liquid crystals: Low Molecular Weight of
Liquid Crystals II, edited by D. Demus, J. Goodby, G.W. Gray, H.W. Spiess and V. Vill,
Wiley-VCH, 1998.
[20] L.M. Blinov, S.P. Palto, S.G. Yudin, M.P.D. Santo, G. Cipparrone, A. Mazzulla and R.
Barberi, App. Phys. Lett., 80, 16, 2002.
[21] A. Petrossian and S. Residori, Europhys. Lett., 60, 79, 2002.
[22] T. Ikeda, T. Sasaki and K. Ichimura, Nature, 361, 428, 1993.
[23] F. Simoni, O. Francescangeli, Y. Reznikov and S. Slussarenko, Optics Letters, 22, 549,
1997.
[24] H. Wang, Y. Huang, Z. Liu, F. Zhao, W. Lin, J. Wang and Z. Liang, Appl. Phys. Lett.,
82, 3394, 2003.
[25] Applied Photochromic Polymer Systems, edited by C.B. McArdle, Chapman &
Hall:NY, 1992.
117