A Sensitivity Analysis of "Forests on the Edge: Housing Development on America's Private Forests"

VULNERABILITY OF COASTAL WETLANDS IN THE SOUTHEASTERN UNITED STATES
Chapter 5: Sensitivity of Gulf Coast Forests to Climate
Change
Paul A. Harcombe Department of Ecology and Evolutionary Biology
Rice University 137A Anderson Biological Lab
Houston, Texas 77005
Jeff S. Glitzenstein St. Marks National Wildlife Refuge
Tall Timbers Fire Ecology Research Station Route 1, Box 678
Tallahassee, Florida 32312-9712
Paul Krusic Lamont-Doherty Earth Observatory
P.O. Box 1000, Tree Ring Lab Palisades, New York 10964
Rosine B.W. Hall Department of Biology
Auburn University Montgomery, Alabama 361 17
Edward S. Cook Lamont-Doherty Earth Observatory
P.O. Box 1000, Tree Ring Lab Palisades, New York 10964
Mark Fulton Department of Ecology and Evolutionary Biology
Rice University 137A Anderson Biological Lab
Houston, Texas 77005
Donna R. Streng St. Marks National Wildlife Refuge
Tall Timbers Fire Ecology Research Station Route 1, Box 678
Tallahassee, Florida 3231 2-971 2
Abstract: Data from a long-term study of vegetation and tree demography were used to investigate potential effects of climate change on a major forested region of the United States, the Coastal Plain of the Southeast. Study sites included dry, mesic, and wet sites in the Big Thicket of east Texas that are representative of important vegetation types on the Coastal Plain. Results indicated spatial and temporal variability in species importance and stand turnover rates related to history of human disturbance, history of natural disturbance, and site conditions. Investigation of within-stand patterns related to shade-tolerance. a central element of the theory of forest dynamics, reinforced the idea that shade tolerance and tradeoffs relating to it are central to our understanding of the mechanisms controlling forest variation in time and space. Analyses of tree-ring chronologies indicated that species range boundaries are not set by climatic limitations on individual growth. On the other hand, analyses of seedling demography, sapling and tree growth, and tree rings indicated short-term variations that suggest sensitivity of the forests to long-term climate change. Comparing effects of disturbance on stand dynamics with effects of climate variation on individual growth, our analyses suggest that climate change would have a stronger and more direct effect through changes in frequency and intensity of hunicanes, floods, and droughts than through changes in relative growth performance among species. Because of high stand turnover rates, possible responses would be rapid. While the responses noted here are not as dramatic as we had previously seen, they do have important implications for managers of both natural area preserves and commercial timberlands.
46 BIOLOGICAL SCIENCE REPORT USGSIBRDIBSR-1998-0002
Introduction Coastal Plains and Flatwoods Ecoregion, Western Gulf
Forests of the Coastal Plain region of the southeastern United States are among the most productive in North America and form the basis of a large timber and wood products industry. In addition, unmanaged forests in parks and preserves are important biologically and for conser- vation (e.g., Marks and Harcombe 198 1 ; Bridges and Orzell 1989; Ware et al. 1993). Understanding potential effects of climate change on Coastal Plain forests is therefore criti- cal from both economic and biological perspectives (see also Morse et al. 1995).
Existing long-term studies are particularly useful for understanding potential impacts of climate change on for- ests for three reasons. First, long-term studies initiated prior to climate changes provide invaluable baseline data on for- est variability under existing climatic conditions. Without such data, distinguishing long-term changes in forests caused by climate change from short-term fluctuations caused by disturbance or climatic anomalies may be im- possible. Second, long-term studies provide an opportu- nity to directly observe effects on forests of short-term climate fluctuations and related disturbance phenomena, such as fires and hurricanes. We can then use these obser- vations of actual forest change as the basis for inferences about sensitivity to longer term climate and disturbance changes in the future. Finally, long-term studies may pro- vide critical data for testing and refining predictions about climate change effects made using simulation models.
In this report, we summarize the results of 20 years of forest dynamics study in the Big Thicket region of south- east Texas. Our study is unique in the amount of detailed data that have been collected on woody plant growth and population changes on the same sites over a long time pe- riod. A second unique feature of the study is the simulta- neous accumulation of a variety of environmental data (e.g., drought, light, flooding) with which to interpret the woody plant population data. Also, the location of the study in the Big Thicket is highly advantageous for global change research. The forests of the Big Thicket are typical of a large biogeographic region on the Coastal Plain of the southeastern United States which spans the area from east Texas to the Carolinas; many of the results presented here apply to the region as a whole. Also, the study area is close to the southwestern range limit of most of the eastern for- est trees. If forests change in response to shifts in global climate, the changes will likely occur first at the range limits; our long-term study is therefore in an excellent po- sition to detect early indications of possible long-term shifts in species composition and demographic processes.
The Big Thicket is at the western edge of the Southern Mixed Hardwoods region (Kiichler 1964) or the South- eastern Evergreen Forest described by Braun (1950). Re- cent biogeographic studies place the Big Thicket in the
Section, Subsection 231Fb (Southwest Ratwoods; Keys et al. 1995). The climate is humid subtropical with an av- erage annual rainfall of 1,341 mmlyr (National Climatic Data Center 1994) evenly distributed throughout the year. Average annual temperature is 20.4" C; mean monthly tem- perature exceeds 10" C for all months. The growing sea- son is long, from March to November, with approximately 240 consecutive frost-free days. Physically, it is mostly within the drainage of the Neches River 50-100 km in- land from the Gulf of Mexico and about 75 km west of the Louisiana border.
As in most of the Coastal Plain, plant communities of the Big Thicket area have been altered by humans. Exclu- sion of fire has converted large portions of upland habitats that were formerly longleaf pine savannas or woodlands (i.e., open forests with a grassy understory) to closed for- est (Harcombe et al. 1993; Ware et al. 1993). Furthermore, logging, which reached its peak in the early 20th century, may have left remnant stands somewhat enriched with shade-intolerant species, such as loblolly pine (Pinus taeda), water oak (Quercus nigra), and sweetgum (Liq- uidambar styraczjlua). Bottomland areas have also been logged, but species composition and forest structure over large areas do not appear greatly different than in remnant old-growth forests from other parts of the Coastal Plain (e.g., Congaree Swamp National Monument, South Caro- lina).
Long-term Study Sites -
Much of our work has focused on three permanent study plots. These three sites represent the major dry, mesic, and wet forest communities of the Coastal Plain of the south- eastern United States (Marks and Harcombe 198 1 ; Christensen 1988; Harcombe et al. 1993; Ware et al. 1993). Sites were selected to be as undisturbed as possible, in order to study natural patterns of forest dynamics rather than responses to logging. Although this objective was not entirely achieved and may not be possible in the current landscape, the mesic and wet sites probably do not differ greatly from old-growth forest in most ecologically mean- ingful parameters.
The dry site is a low sandy ridge southeast of Warren, Texas, adjacent to a floodplain in the Turkey Creek Unit of the Big Thicket National Preserve. The vegetation type is Oak-Hickory-Pine (Kiichler 1964) or Upper Slope Pine Oak (Marks and Harcombe 1981). The dominant hard- woods, post oak (Quercus stellata), southern red oak (Quercus falcata), and black hickory (Carya texana), form a relatively open canopy 15-20 m tall below emergent longleaf pine (Pinus palustris), loblolly pine, and short- leaf pine (Pinus echinata; Table 5-1). Red maple (Acer rubrum) and sweetgum are minor canopy components that tend to occur in moist microhabitats, especially along the

VULNERABILITY OF COASTAL WETLANDS IN THE SOUTHEASTERN UNITED STATES 47
Table 5-1. Basal area (m2/ha) and annualized percent change in basal area for the three study sites. Annual percent change in basal area (BA) is the difference between current and initial basal area divided by the initial basal area and the number of years since the initial basal area reading (e.g., annual percent change in BA for Neches Bottom=[BA94-BA80Y[BA80'(94-80)].
Turkey Creek (Dry) Wier Woods (Mesic) Neches Bottom (Wet)
B A Annual % B A Annual % B A Annual % Species 1993 change in BA 1995 change in BA 1994 change in BA
Longleaf pine Post oak Southern red oak Shortleaf pine Yaupon Flowering dogwood Bluejack oak Hickory Loblolly pine White oak American holly Upland laurel oak Laurel oak Southern magnolia American beech White-bay magnolia Blackgum Sweetgum Red maple Water oak Swamp chestnut oak American hornbeam Baldcypress Swamp blackgum Overcup oak Water hickory American elm Other
Total
edges of the study plot. The understory is a moderately dense mixture of tree saplings and shrubs; flowering dog- wood (Cornus jlorida) and yaupon (I1e.r vomitoria) are particularly abundant, and saplings of most tree species are common. The soil is sandy. The site was logged in 1930, but many trees of considerable age remained on the site so the stand is not strongly even-aged (Harcombe et al. 1993; Kaiser 1995). Prior to 1930, the site probably burned rela- tively frequently, judging from the widespread presence of charcoal on stumps and the importance of longleaf pine, a fire-adapted species, in the overstory. Nevertheless, hard- woods probably contributed 3040% of stand basal area.
Stand basal area increased from 21.7 m2/ha in 1982 to 26.2 m2/ha in 1993, a compound rate of increase of 1.7% per year. Though all major species increased in absolute basal area (Table 5-I), there was a slight decrease in rela- tive dominance for three of the four major species (longleaf pine, post oak, and southern red oak) and an increase in
relative dominance and diversity (14 new species) of mi- nor species (Kaiser 1995). These trends suggest succes- sional recovery from the 1930 logging event in a system in which fire frequency is much lower than it was prior to logging. The dramatic difference in species composition between the prelogging forest and the forest today illus- trates the magnitude of the effect of fire on the pre-Anglo landscape.
The mesic site is located in Wier Woods Preserve (The Nature Conservancy) near Lumberton, Texas, about 16 km north of Beaumont. Forests of this type have been called Southern Mixed Hardwood Forest (Quarterman and Keever 1962), Beech-Magnolia-Holly (Delcourt and Delcourt 1977), or Lower Slope Hardwood Pine (Marks and Harcombe 1981). The closed canopy of tall trees (25- 40 m) is dominated by loblolly pine, water oak, American beech (Fagus grundifolia), southern magnolia (Magnolia grundzgora), and white oak (Quercus alba). Red maple,

48 BIOLOGICAL SCMCE REPORT USGS/BRD/BSR-1998-0002
sweetgum, and black gum (Nyssa sylvatica) are abundant as small to medium stems but are infrequent as large trees. American holly (Ilex opaca), flowering dogwood, and yaupon are important understory species. The soil is loamy. The forest was logged for pine once in about 1910 and there appears to have been no further human modification of the stand (Glitzenstein et al. 1986).
Hurricane Bonnie passed over Wier Woods on June 26, 1986. Winds at that time were estimated at 120 km/hr (Neumann et d. 1993; Doyle and Girod 1997). Tree-ring analyses (Glitzenstein et al. 1986) suggested earlier epi- sodes of canopy opening in 1810, 1855, and, to a lesser extent, in the mid- 1960's. The latter episode may have been caused by Humcane Carla in 1961. The great Galveston Hurricane of 1900 (Bray 1901) may have contributed to canopy disturbance in the early 1900's, but this effect was difficult to separate from the effects of logging disturbance.
Basal area has varied between 33.7 m2/ha and 35.1 m21 ha during the 16-year period of the study. Changes in indi- vidual species (Table 5-1) reflect a variety of causes. Loblolly pine is increasing in basal area because postlogging recruits have reached their stage of maximum growth; however, it is a shade-intolerant species which is not regenerating in the stand and therefore seems destined to decline in the absence of future major canopy opening. American holly, the other strongly increasing species, is a shade-tolerant midstory species which is responding to light increases as the postlogging canopy becomes more het- erogeneous. Water oak and American beech showed the most significant declines. Water oak is a relatively shade-intolerant, somewhat short-lived species that might be expected to decline from a postlogging position of domi- nance. In contrast, American beech is a shade-tolerant spe- cies of mature forests and seems to be declining for rea- sons unrelated to stand development. Possible explanations include a long-delayed reaction to drought in the 1980's w increased pathogen invasions due to structural damage by Hurricane Bonnie.
The wet site is on the floodplain of the Neches River, near Evadale, Texas, in the Neches Bottom Unit of the Big Thicket National Preserve. The Neches River drains ap- proximately 26,000 km2 of the humid forested region of southeast Texas. The study stand is a mature example of Southern Floodplain Forest (Kiichler 1964) or River Flood- plain Forest (Marks and Karcombe 1981). On the flat.$, widely spaced, large individuals of sweetgum, swamp chest- not oak (Quercus michawii), water oak, and red maple dominate the somewhat open overstory above a dense midcanopy layer of American hornbeam (Carpinus caroliniutza). Under intact canopies, the shrub layer is open, with only a single important species, possumhaw (Iiexde- cidua). In canopy openings, density of tree saplings (Hall 1993) or herbs (Mohler 1979) can reach very high levels. Baldcypress (Tmodium d i s t i c h ) and water tupelo (Nyssa
aquatica) are commonly found in the sloughs. The transi- tion between slough and flat vegetation ig relatively abrupt. Baldcypress was removed along the sloughs early in the century, but there is no strong evidence for subsequent log- ging; the stand appears unevenly aged, with oldest indi- viduals originating before 1800.
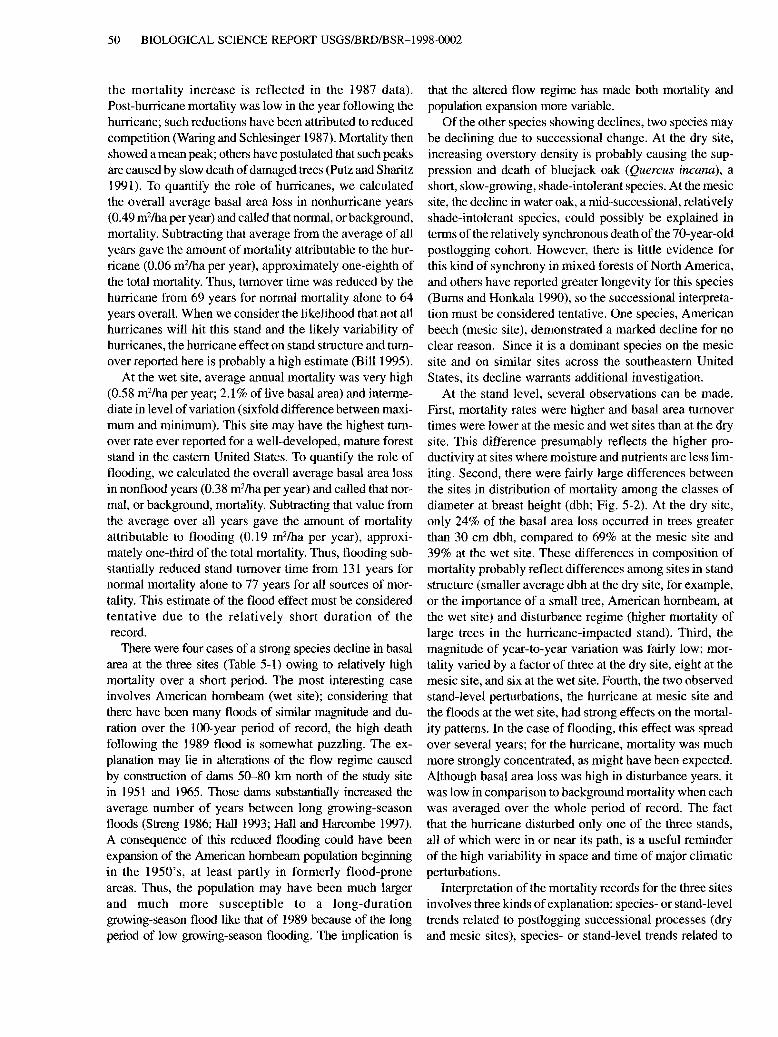
Distributions of seedlings, saplings, and trees on this stand are all related to elevation (Streng et a]. 1989; Hall 1993; Hall and Harcombe 1997; R.G. b o x , Goddard Space Flight Center, Greenbelt, Maryland, unpublished data). Saplings also showed a strong tendency to occur in patches (Hall 1993). The soil is very deep, somewhat poorly drained, very slowly permeable acidic clay. During most of rhe year, available water is ample and, during winter and spring, the water table is high, at a depth of only 3& 60 em most years. Maximum flooding during the forest long-term study occurred in 1989 and 1992 (Fig. 5-1 ; Hall 1993).
Total basal area fluctuated between 28.1 m2/ha in 1980 and 29.1 m2/ha in 1989, followed by a 5% decline to 27.7 m2/ha in 1994. However, there were trends in several im- portant species. Sweetgum, water oak, swamp chestnut oak, baldcypress, and overcup oak (Quercus lyrata) increased, while American holly, American elm ( U l t n ~ s mricana), and water hickory (Carya aquatica) decreased. More no- tably, American hornbeam, a very important midstory spe- cies, has been declining since the study began, with a par- ticularly precipitous drop of nearly 50% after 1989 due to flood-related mortality.
One of the strongest indications of potential direct ef- fects of climate change on composition at this site was the strong effect of the severe drought in 1980 on seedling composition, recruitment, and mortality at the wet site (Streng et al. 1989). Timing of mortality within the 1980
Figure 5-1. Total and maxlmum consecutive &ys llaaded for the fhts at the wet study slte, 1926-90.

VULNERABILITY OF COASTAL WETLANDS IN THE SOUTHEASTERN UNITED STATES 49
growing season was closely correlated with the intensity of drought stress as measured by predawn leaf water potential measurements. Mortality of larger-seeded spe- cies, especially oaks, was less affected than was mortality of lighter-seeded trees such as sweetgum and American hornbeam. This difference in mortality suggests that pro- longed dry periods may select against the lighter-seeded trees, leading to increased dominance by oaks.
Cross-site Comparisons Each of the three intensive study sites has a unique his-
tory which must be understood if information of general significance regarding mechanisms of forest dynamics and causes of forest change is to be extracted from these and other case studies. Furthermore, each site is a single, unreplicated representative of its habitat type. Therefore, caution must be exercised in interpreting the results; at- tempts to extract generalizations must be made, but these generalizations should serve only as hypotheses for fur- ther testing. We compare and contrast patterns in mortal- ity, sapling dynamics, and stand turnover to elucidate mechanisms of forest dynamics and factors influencing
forest change. Knowledge of these mechanisms and factors can form the basis for predictions about global change effects.
Mortality At the dry site, mortality loss varied by a factor of three
over the period of record (Fig. 5-2), averaging about 0.22 m2/ha per year (0.9% of live basal area). There were no obvious trends or event-related peaks, except that under- story trees showed slightly elevated mortality between 1987 and 1993, probably owing to increased canopy density. Much of the year-to-year variation in overall mortality was related to chance death of large trees. Turnover time, the time it would take to replace all the live basal area if new growth were equal to mortality, was 108 years.
At the mesic site, average mortality loss was higher (0.55 m2/ha per year; 1.5% of live basal area) and more variable (eightfold difference between maximum and minimum). Highest mortality (1.59 m2/ha; 4.3% of live basal area) was associated with Hurricane Bonnie (Fig. 5-2), which hit the stand in 1986 (the hurricane actually occurred in 1986, but since it occurred after the mortality survey for that year,
'.'I Neches Bottom (wet) - -
E 1.6 Weir Woods (mesic)
u 1.2
V
U) a 0.8 0 -
0.4 Q L
a 0 - a -' 1 Turkey Creek (dry) U)
Figure 5-2. Basal area loss by size class for all sites, 1980-96.
50 BIOLOGICAL SCENCE REPORT USGS/BRD/BSR-1998-0002
the mortality increase is reflected in the 1987 data). Post-hurricane mortality was low in the year following the hurricane; such reductions have been attributed to reduced competition (Waring and Schlesinger 1987). Mortality then showed a mean peak; others have postulated that such peaks are caused by slow death of damaged trees (Putz and Sharitz 1991). To quantify the role of hurricanes, we calculated the overall average basal area loss in nonhurricane years (0.49 m2ka per year) and called that normal, or background, mortality. Subtracting that average from the average of all years gave the amount of mortality attributable to the hur- ricane (0.06 m2ka per year), approximately one-eighth of the total mortality. Thus, turnover time was reduced by the hurricane from 69 years for normal mortality alone to 64 years overall. When we consider the likelihood that not all hurricanes will hit this stand and the likely variability of hurricanes, the hurricane effect on stand structure and tum- over reported here is probably a high estimate (Bill 1995).
At the wet site, average annual mortality was very high (0.58 m2/ha per year; 2.1 % of live basal area) and interme- diate in level of variation (sixfold difference between maxi- mum and minimum). This site may have the highest turn- over rate ever reported for a well-developed, mature forest stand in the eastern United States. To quantify the role of flooding, we calculated the overall average basal area loss in nonflood years (0.38 m2/ha per year) and called that nor- mal, or background, mortality. Subtracting that value from the average over all years gave the amount of mortality attributable to flooding (0.19 m2ka per year), approxi- mately one-third of the total mortality. Thus, flooding sub- stantially reduced stand turnover time from 131 years for normal mortality alone to 77 years for all sources of mor- tality. This estimate of the flood effect must be considered tentative due to the relatively short duration of the record.
There were four cases of a strong species decline in basal area at the three sites (Table 5-1) owing to relatively high mortality over a short period. The most interesting case involves American hornbeam (wet site); considering that there have been many floods of similar magnitude and du- ration over the 100-year period of record, the high death following the 1989 flood is somewhat puzzling. The ex- planation may lie in alterations of the flow regime caused by construction of dams 50-80 km north of the study site in 1951 and 1965. Those dams substantially increased the average number of years between long growing-season floods (Streng 1986; Hall 1993; Hall and Harcombe 1997). A consequence of this reduced flooding could have been expansion of the American hombeam population beginning in the 1950's, at least partly in formerly flood-prone areas. Thus, the population may have been much larger and much more susceptible to a long-duration growing-season flood like that of 1989 because of the long period of low growing-season flooding. The implication is
that the altered flow regime has made both mortality and population expansion more variable.
Of the other species showing declines, two species may be declining due to successional change. At the dry site, increasing overstory density is probably causing the sup- pression and death of bluejack oak (Quercus incana), a short, slow-growing, shade-intolerant species. At the mesic site, the decline in water oak, a mid-successional, relatively shade-intolerant species, could possibly be explained in terms of the relatively synchronous death of the 70-year-old postlogging cohort. However, there is little evidence for this lund of synchrony in mixed forests of North America, and others have reported greater longevity for this species (Bums and Honkala 1990), so the successional interpreta- tion must be considered tentative. One species, American beech (mesic site), demonstrated a marked decline for no clear reason. Since it is a dominant species on the mesic site and on similar sites across the southeastern United States, its decline warrants additional investigation.
At the stand level, several observations can be made. First, mortality rates were higher and basal area turnover times were lower at the mesic and wet sites than at the dry site. This difference presumably reflects the higher pro- ductivity at sites where moisture and nutrients are less lim- iting. Second, there were fairly large differences between the sites in distribution of mortality among the classes of diameter at breast height (dbh; Fig. 5-2). At the dry site, only 24% of the basal area loss occurred in trees greater than 30 cm dbh, compared to 69% at the mesic site and 39% at the wet site. These differences in composition of mortality probably reflect differences among sites in stand structure (smaller average dbh at the dry site, for example, or the importance of a small tree, American hornbeam, at the wet site) and disturbance regime (higher mortality of large trees in the hurricane-impacted stand). Third, the magnitude of year-to-year variation was fairly low; mor- tality varied by a factor of three at the dry site, eight at the mesic site, and six at the wet site. Fourth, the two observed stand-level perturbations, the hurricane at mesic site and the floods at the wet site, had strong effects on the mortal- ity patterns. In the case of flooding, this effect was spread over several years; for the hurricane, mortality was much more strongly concentrated, as might have been expected. Although basal area loss was high in disturbance years, it was low in comparison to background mortality when each was averaged over the whole period of record. The fact that the hurricane disturbed only one of the three stands, all of which were in or near its path, is a useful reminder of the high variability in space and time of major climatic perturbations.
Interpretation of the mortality records for the three sites involves three kinds of explanation: species- or stand-level trends related to postlogging successional processes (dry and mesic sites), species- or stand-level trends related to

VULNERABILITY OF COASTAL WETLANDS IN THE SOUTHEASTERN UNITED STATES 5 1
particular perturbations (mesic and wet sites), and normal or background mortality. Identification of these processes makes detection of future changes in mortality that might be related to climate change possible; long-term records which allow comparisons between species and between sites, such as the ones accumulated in this study, provide the baseline for detection of effects of global change. Also, the quantitative data reported here allow us to make some assessment of the potential for change. For example, the high rates of natural turnover indicate that these forests will respond rapidly to climate change, and if hurricanes and floods increase in frequency and intensity as a result of global warming, forest turnover rate may be even more rapid. If higher mortality is not offset by higher growth, standing biomass of the forests may decline.
Sapling and Seedling Dynamics At the dry site, saplings have been declining (Fig. 5-3),
owing largely to a decline in loblolly pine following a pulse of recruitment in the 1970's. The recruitment pulse is at- tributed to reduction in competition by a ground fire or selective logging (Harcombe et al. 1993). In contrast to the overall decline, five species poorly represented in the overstory but typical of mesic sites (southern magnolia, sweetgum, American holly, red maple, and upland laurel oak [Quercus laurifolia]) showed peak densities in the 1980's as small saplings (Fig. 5-3). As these saplings grew larger, they moved into the large sapling class, which lev- eled off recently (Fig 5-3). Trends for seedlings (woody stems less than 50 cm tall) were similar to those for sap- lings, showing declines in dry-site species and increases in mesic species. The greatest declines were experienced by species typical of open, longleaf pine savannas or wood- lands, including longleaf pine, bluejack oak, and deerbeny (Vaccinium stamineum; Table 5-2). Seedlings of canopy trees typical of somewhat less frequently burned oak-hickory woodlands and dry sites (post oak, southern red oak, mockernut hickory [Carya albal, and black hickory) also declined but not quite as precipitously. In contrast, seedlings of mesic species showed dramatic in- creases (e.g., yaupon, which increased fourfold).
At the mesic site, sapling density has increased gradu- ally over the period of record (Fig. 5-3); southern magno- lia accounts for much of the increase. This increase may be partly attributable to an increase in canopy heterogene- ity in the postlogging forest as a consequence of larger mean dbh of dying canopy trees (Bill 1995). There was no strong increase in small saplings in the years following Hurricane Bonnie, in marked contrast to the response observed for Hurricane Kate at Woodyard Hammock in Florida (W.J. Platt, Louisiana State University, unpublished data) and to our own reconstructions of recruitment pulses at the rnesic site following earlier periods of enhanced canopy opening (Glitzenstein et al. 1986). Nevertheless, Hurricane Bonnie
appears to have promoted recruitment of three species, Chinese tallow (Sapium sebiferum), loblolly pine, and white oak (Fig. 5-3). The first is an exotic invader, the second is a native light-demanding species, and the third is a com- mon tree of intermediate shade tolerance in mesic forests that has shown low recruitment in recent years (Harcombe and Marks 1983; Glitzenstein et al. 1986; Bill 1995).
At the wet site, sapling populations showed dramatic change as well (Fig. 5-3). Small saplings increased by a factor of five to a peak in 1989, declined, and then began to increase again following the pulse of midstory Ameri- can hornbeam death. Large saplings began to increase somewhat later and were still increasing in 1995. Most of the increases were concentrated in a few species: sweetgum, water oak, and American hornbeam for the small saplings and sweetgum, water oak, Chinese tallow, and laurel oak for the large saplings (Fig. 5-3). The increase in Chinese tallow is of particular interest since it is an exotic gap in- vader. It increased by a factor of 30 between 1981 and 1995. It should be noted, however, that the increase in the native dominants, sweetgum (27x) and water oak (16x) was also dramatic.
These increases in saplings at the wet site may be due to a change in the long-term flood pattern (Fig. 5-1); the period 1975-89 was the longest period of low flooding observed since recording began in 1921. The implication is that frequency of long-duration floods strongly controls sapling recruitment in floodplains by limiting regenera- tion to infrequent flood-free intervals and to areas of high light availability in gaps. These large-scale temporal pat- terns are superimposed on year-to-year variation in seed- lings (Streng et al. 1989) and saplings (Hall 1993) caused by flooding. Our results suggest that human action has al- tered the hydrologic regime such that overall structure of the forest will shift towards an increasingly dense shrub layer and possibly towards greater importance of slower-growing, relatively shade-tolerant species in the postdam era when flood frequency is lower. Since upland species (e.g., American beech, sweetbay [Magnolia virginiana], and loblolly pine) are known to occur on levees and other natural high spots in the river floodplain, they may begin to increase as well; such species would be ex- cluded by a normal flood regime (see Jones et al. 1994).
At all three sites, increases in sapling numbers are tied to disturbances in the recent past. At two of the sites (dry and mesic), the disturbance was super-imposed upon a pat- tern of stand recovery from prior logging. Human action appears to have changed natural processes more at the dry site (altered fire regime) and the wet site (altered flood regime) than at the mesic site. Nevertheless, because the disturbances were characteristic for the sites (i.e., fire at the dry site, flooding at the wet site, and a humcane at the mesic site), some general interpretation is warranted. Most important, fire and flood are similar in that they affect

1600 Turk:;;;;;;:; site)
+Large (0.0-4.5 cm dbh) 1
1981 1983 1985 1987 1989 1991 1993 1995 1997
1600 - Wier Woods (mesic site) Neehes Bottom (wet site) Total saplings
+Large (0.0-4.5 cm dbh) 0 , l l l I l l i l i i i l i l l 1981 1983 1985 1987 1989 1991 1993 1995 1997 1981 1983 1985 1987 1989 1991 1993 1995 1997
250 80 Small saplings 1000 - Small saplings $
+I , 200 a 60 800 -- s
150 - r* 40 5 100 S
a V,
50 20 200 7 C
a a
0 0 F - 1981 1983 1985 1987 1989 1991 1993 1995 1997 1981 1983 1985 1987 1989 1991 1993 1995 1997 1981 1983 1985 1987 1989 1991 '1993 1995 1997 g
h, -Sweetgum +Red maple +Holly I +Lobloliy pine +White oak +lmowood +Holly -Sweetgum I - x- Watcr oak - d- -Magnolia +Beech 1
1981 1983 1985 1987 1989 1991 1993 1995 1997 1981 1983 1985 1987 1989 1991 1993 1995 1997 1981 1983 1985 1987 1989 1991 1993 1995 1997
1 -sweetgum a +HOIIY 1 ~ ~ f i t e o a k f atcr croak t-1 1 + ~mnwcai + sweetgum
-X- Watcr oak - d- -Magnolia I [+~ccch - - -X - - Tallow -X- Watcr oak - - - X - - Tallow I
Figure 5-3. Total saplings and density of saplings of selected species at three study sites, 1981-97. Small saplings are individuals between 50 and 140 cm in height. Large saplings are individuals between 0.4 and 4.5 cm dbh.

VULNERABILITY OF COASTAL WETLANDS IN THE SOUTHEASTERN UNITED STATES 53
Table 5-2: Changes over time in relative densities of greater than 1 -year-old woody seedlings (stems less than 50 cm tall) in 100 1 m by 1 m plots at the dry study site. All species having 5 or more stems in any census period are listed.
A. Shade-intolerant species adapted to frequent fire
1980 1981 1982 1983 1984 1995
Wax myrtle Longleaf pine Shortleaf pine Bluejack oak Blackjack oak Deerberry
B. Somewhat less shade-intolerant species adapted to occasional fire
1980 1981 1982 1983 1984 1995
Hickory 2.7 2.8 2.9 2.8 2.4 1.2 Flowering dogwood 6.4 5.6 4.7 5.4 4.4 4.2 Loblolly pine 17.1 13.8 9.1 8.7 27.1 7.7 Southern red oak 4.1 4.7 3.9 4.1 3.6 2.9 Post oak 16.1 13.2 16.2 14.1 9.9 5.6 Sassafras 9.5 9.9 10.5 10.8 9.4 4.4 Farkleberry 0.1 0.0 0.1 0.3 0.2 1 .O
C. Shade tolerant, mostly fire-intolerant species
1980 1981 1982 1983 1984 1995
Red maple American holly Yaupon Sweetgum Southern magnolia Red bay White oak Upland laurel oak Carolina buckthorn
Total Individuals
saplings more strongly than they affect trees, given the relatively high frequency and low intensity of these events in habitats like these in the southeastern United States.
The immediate consequence of intervals without fire or flood was a substantial pulse of recruitment at the two sites. At the dry site, however, the most successful recruits were not current site dominants; this implies future successional change. At the wet site, the recruits were of the dominant species, which implies compositional stability. The differ- ence may be that successional replacement is prevented by soil anoxia for much of the winter at the wet site, which kills seedlings of mesic species, whereas summer drought at the dry site is not so extreme as to kill seedlings of the mesic species. Alternatively, such differences may have to do with dispersal distance (Schmeda and Ellner 1984). The dry site is in a topographically complex upland with mesic
habitats nearby that are a ready source of seeds, whereas the wet site is in a large, homogeneous river bottom- land, which is at some distance from a source of seeds of mesic species.
In contrast to the wet and the dry sites, the mesic site showed only modest fluctuations in sapling populations, in spite of the hurricane. This lesser response to distur- bance is surely related in part to the relatively minor level of damage inflicted by the hurricane, but it may also be influenced by the nature of the mesic upland system. Since neither fire nor flood is commonly part of these systems, a dense and diverse shrub-sapling layer is characteristically present, which will respond to perturbations by acceler- ated growth of preexisting individuals in newly formed gaps rather than by recruitment of a new cohort. Even in the absence of a dense shrub-sapling layer, stand-opening

54 BIOLOGICAL SCIENCE REPORT USGSIBRDIBSR-1998-0002
events would not necessarily change conditions in ways that would favor species from either wetter or drier habi- tats like the long-term changes in fire and flooding at the other two sites. If hurricanes were to become more fre- quent or more severe because of global warming, such a regime would favor mobile, fecund species like loblolly pine or the shade-intolerant, fast-growing species of the wet sites (sweetgum, water oak) and would undoubtedly reverse the successional decline in loblolly pine and water oak that seems imminent for this stand.
The invasion of an exotic woody species, Chinese tal- low, illustrates the strong effect of edaphic conditions in determining invasion potential; Chinese tallow is virtually absent from the dry site, probably because the species is highly moisture-demanding. The Chinese tallow invasion also illustrates the effect of stand structure on the invasibility of a system. Compared to the mesic site, the wet site expe- rienced invasion much earlier because of the open under- story; invasion of the mesic site began only after canopy disruption by the hurricane.
Aside from the effects of perturbations, there were pre- dictable differences in overall rates of seedling and sap- ling recruitment at the three sites. Seedling appearance rates were highest at the wet site, intermediate at the mesic site, and lowest at the dry site, presumably because of a combi- nation of higher fecundity of individuals where moisture is less limiting, as well as higher germination and early survival rates in moister soils. In contrast, small sapling recruitment was highest at the wet site, intermediate at the dry site (but only because of a strong pine pulse), and low- est at the mesic site. The low small sapling recruitment at the mesic site may be attributed to heavy shade from the dense shrub-sapling layer.
These trends imply that the response of vegetation on contrasting sites to climate change would vary because of differences in recruitment. Since many factors are involved in the recruitment process (distance to potential source trees and differences in fecundity, vagility, viability, and seed- ling survivorship), not to mention other processes, the na- ture of the response could be difficult to predict, especially since some of the factors might change in offsetting ways, while other changes would be additive or multiplicative. However, the trends we observed in saplings suggest that the net result may be a reduction in the degree of composi- tional variation across the landscape.
Overall Stand Dynamics and Vegetation Response Time
Only modest changes in tree basal area, density, and species composition were observed at the three sites; these changes were mostly explainable in terms of successional change following logging or alterations in flood or fire regimes. In contrast, the sapling and seedling layers
varied more, apparently in response to recent disturbances, which suggests strong sensitivity to global wanning by way of its effect on the disturbance regime. For the dry stand, autogenic succession is the dominant process, particularly in the subcanopy strata. Nevertheless, the stand may well be sensitive to climate change since the successional pro- cess could be accelerated by increased storm activity which could kill canopy trees and thereby accelerate succession to a mesic, less fire-dependent community type (Glitzenstein and Harcombe 1988; Liu et al. 1997). On the other hand, succession could be reversed by increased drought severity; drought could kill mesic juveniles directly via water stress or indirectly via increased fire frequency (e.g., Glitzenstein et al. 1995). The indirect effects could equal or exceed the magnitude of the direct effects.
For the mesic stand, which may be close to a long-term steady state, the effect of the hurricane on recruitment in- dicates that the stand will also be sensitive to a changing climate. In such communities, one likely effect of global warming would be to increase the disturbance rate and thereby to maintain the importance of loblolly pine, water oak, and white oak, as well as promote invasion by exotic woody species like Chinese tallow. If the decline in Ameri- can beech is somehow related to global warming, the re- sponse of sites like this one may be much greater.
In the wet forest, global change effects are harder to predict, since they might involve increases in frequency and intensity of both floods and droughts. It seems likely that the flooding effect would prevail, however, possibly reversing the changes set in motion by human alteration of the hydrologic regime.
Vegetation can respond to climate either by changes in local abundance caused primarily by differential effects of climate on growth and regeneration (Type A response) or by changes in range limits (Type B response; Webb 1986). Our monitoring results apply to the Type A response re- lated to regeneration. Melillo et al. (1996) cite four forest studies reporting response times of 30-150 years (MacDonald et al. 1993; Mayle and Cwynar 1995; Gear and Huntley 1991 ; Zackrisson et al. 1995). Campbell and McAndrews (1993) cite a successional response in Ontario of dieback with a slow response time of several centuries due to tree longevity. In our study, the response times reported are short (turnover times of 69-108 years) because of rela- tively short life spans, rapid recruitment, and high growth rates. Because of the similarity of vegetation across the south- eastern United States, these response times probably ap- ply to similar stands throughout the region. If a climate change effect were primarily to alter the competitive bal- ance among species by differentially changing growth or recruitment rates, we would expect a slow, gradual vegeta- tion response. Alternatively, if climate change primarily af- fected the disturbance regime a much more rapid response

VULNERABILITY OF COASTAL WETLANDS IN THE SOUTHEASTERN UNITED STATES 55
would be predicted, involving shifts in species composi- tion (greatest shifts on dry sites, intermediate shifts on mesic sites, low shifts on wet sites). These results, based on field data, support the suggestion that southern forests are sen- sitive to climate change (Urban and Shugart 1990), but it is too early to speculate on the magnitude of the im- pact.
Pattern and Process In addition to the general picture of stand dynamics and
the relationship to the flood regime that has developed as part of the long-term study, we have analyzed the fine-scale temporal and spatial patterns of stand dynamics. One ele- ment of this analysis (Hall and Harcombe 1998) examines the interaction of flooding and light availability in deter- mining spatial patterns of tree saplings.
Flood and Shade Tolerance Continuum theory suggests that species will be assorted
along an environmental gradient in an order which reflects their realized niches with respect to the varying environ- mental condition. Where two gradients are present, the expectation is that direct gradient ordination techniques will recover the ordering of species on both. Many authors have assessed either flood tolerance (Teskey and Hinckley 1977; McKnight et al. 1981; Wharton et al. 1982; Mitsch and Gosselink 1986) or shade tolerance (McKnight et al. 1981; Bums and Honkala 1990) for most of the dominant tree species found at the wet site. Thus, at least for those two variables, it is possible to create a model of expecta- tions representing a null hypothesis for the ordering of major tree species along these two gradients.
We took hemispherical photos at the centers of each of 100 20- by 20-m plots in the stand to estimate light avail- ability using SOLARCALC (Chazdon and Field 1987a,b), which is a computerized version of the Anderson (1964) method. Soil texture and nutrients were measured for 100 points across the stand. Values for all environmental vari- ables were estimated for each plot using block kriging (GEO-EAS; Englund and Sparks 1988).
We conducted correspondence analysis (CA), a form of indirect gradient analysis (Hill 1974), on mean sapling abundance over 10 years from 15 randomly located per- manent plots. There were 19 species of woody saplings found in the plots. The mean number of individuals of each species in each plot was the response variable. The CA was used to determine the total amount of variation which could be explained by unconstrained ordination techniques. We determined the number of stable axes using a scaled rank variance (SRV) statistic (Knox and Peet 1989). Ca- nonical correspondence analysis (CCA; Ter Braak 1987; Ter Braak and Prentice 1988), a form of direct gradient analysis, was then used to examine the portion of variation in species composition that could be explained by changes
in the environmental variables. There were eight environ- mental variables available for use in the model either to constrain the axes or as covariables: elevation, weighted percent sky, percent sand, percent clay, available phospho- rus, available iron, available calcium, and available nitrate.
For the indirect gradient analysis (CA), the first four axes accounted for 75% of the total variation. Axis 1 was correlated with elevation (r = -0.95), while Axis 2 was cor- related with percent sky (r = -0.76). Monte-Carlo tests (Ter Braak 1987) showed that both correlations were signifi- cant (p = 0.01 and p = 0.02, respectively).
Comparison of first axis ranking of species with flood tolerance rankings obtained from the literature shows sub- stantial agreement, indicating that elevation is a surrogate for flood tolerance.
In contrast, comparison of second axis ranking with spe- cies shade tolerance rankings obtained from the literature shows little correspondence between position on the light gradient and species shade-tolerance rankings. Several of the most shade-tolerant species (American holly, water-elm [Planera aquatica], and American elm) are placed on the high light end of the light gradient. There are at least two possible explanations for this discrepancy. First, there is some disagreement in the literature about the shade toler- ance of the species listed here (especially laurel oak). How- ever, it is unlikely that significant disagreement extends to all species, especially those considered most shade toler- ant. Second, there may be interactions for some species between shade tolerance and other environmental variables such as flooding or moisture availability.
Our data indicate the existence of such interactions: spe- cies were assorted across a gradient of canopy openness, but not in accordance with their shade tolerance. The in- teractions acted to limit the success of at least some shade-tolerant species in the highly stressful floodplain environment with both frequent flooding and shade. These interactions can be illustrated using a matrix to compare shade-tolerance rankings to position on the light gradient (Table 5-3). The null expectation would be that species should fall primarily along a single diagonal. However, many species were shifted away from the diagonal. Appar- ently, flood tolerance may allow persistence of some spe- cies under lower light conditions than normal, while flood intolerance may limit some normally shade-tolerant spe- cies to higher light conditions where growth is fast enough to allow escape from the flooding hazard (Fulton 1991). The movement of almost all of the shade-tolerant species to higher light conditions suggests that it is difficult to sur- vive both flooding and low light conditions.
Our results support the conclusions of Menges and Waller (1983) that the combination of flooding and low light is so severe that few species can adapt to it. This con- clusion may explain the sparse understory, which is charac- teristic of most southern floodplain forests (Wharton

56 BIOLOGICAL SCIENCE REPORT USGS/BRD/BSR-1998-0002
Table 5-3. Light gradient position of Neches Bottom species compared to expected shade tolerance (from Hall and Harcombe 1998).
Shade tolerance Light Gradient Position (Actual Position) {Predicted position) Low Intermediate High
Tolerant Hackberry
lntermediate Carolina ash Sycamore Blackgum Baldcypress
Red maple American holly American hornbeam Water elm
American elm
Laurel oak Water hickory Overcup oak Basket oak
Intolerant Water oak Sweetgum Cherrybark oak
et al. 1982), as well as the dominance of shade-intolerant species (e.g., sweetgum and water oak) noted in this study. Jones et al. (1995) also suggested that flooding prevents successional replacement of shade-intolerant species by shade-tolerant species. Our results further indicate that light is important in determining within-stand patterns of plant occurrence, as shown previously for herbs (Menges and Waller 1983) and tree seedlings (Streng et al. 1989; Jones and Sharitz 1990; Jones et al. 1995). Species were assorted across a gradient of light availability, but the basis for this assorting was not shade tolerance alone. Instead, the or- dering may reflect species-specific tradeoffs between light requirements and flood tolerance.
Growth Responses One of the goals of this research was to determine
whether sapling growth showed year-to-year variation that might be related to variation in annual rainfall or tempera- ture. The rationale was that strong response to variation in these climate variables at this time scale would be presump- tive evidence that forests of the region would be sensitive to climate change occurring over decades. In this section, we report the results from an analysis of sapling growth at the three study sites from 1980-1994 and the results of a more detailed study of the wet site from 1980-1989 (Hall 1993) for small saplings (50 cm tall to less than 140 cm tall) and large saplings (greater than 0.0 cm dbh to less than 4.5 cm dbh). The climatic variable selected for initial screening was the Palmer Drought Severity Index (PDSI) from Cook et al. (1997).
The overall rate of sapling growth varied significantly among sites (painvise median test); median growth was 5 cm per year at the wet site, 3 cm per year at the mesic site, and 2 cm per year at the dry site. There was no apparent correlation of the annual growth values pooled across sites with annual PDSI (Pearson product-moment correlation
coefficient, r = -0.05), but there was an obvious temporal trend. On the provisional assumption that this trend was related to stand dynamics processes, a nonlinear curve was fitted to the series and residual deviation from this curve was calculated. The residual values had a much higher, though nonsignificant, correlation with PDSI (r = 0.34, p = 0.22). Examination of a graph of pooled residual growth and PDSI (Fig. 5-4) suggests that sapling growth might be related to PDSI, though other sources of variation are also present. When the sites were examined separately (Fig. 5- 5), the relationship was stronger: growth residuals at the wet and dry sites were correlated (r = 0.58, p = 0.02), which strongly supports the suggestion of a climate signal. The intersite correlation appears to have been stronger early in the 15-year period when drought was a factor. Later in the period, some deterioration in the climate relationship seems
Time
Figure 5-4. Pooled residual sapling growth for three study sites compared to Palmer Drought Severity Index, 1980-93.

VULNERABILITY OF COASTAL WETLANDS IN THE SOUTHEASTERN UNITED STATES 57
I I I I I I I I
1980 1982 1984 1986 1988 1990 1992 1994
Year
Figure 5-5. Comparison of median residual sapling growth by site with Palmer Drought Severity Index, 1980-93.
to have occurred. One cause of this deterioration was flood- ing at the wet site which caused saplings there to do poorly. The two lowest-growth years at the wet site (1989 and 199 1) were among the worst flooding years and followed rela- tively dry years (Fig. 5-6). The strength of the wet site-dry site correlation increased when analysis was repeated us- ing only the species found at all three sites (r = 0.70, p = 0.004). It is clear from the analysis that the mesic site was different from the other two sites in its response to climate, possibly because growth there responded more to processes like the hurricane than to annual variation in drought se- verity.
Additional analysis of data from the wet site showed that severe flooding reduced small sapling height increment; the lowest height increment year occurred in 1989, the year
Figure 5-6. Maximum consecutively flooded growing-season days for flats at wet site, 1980-94.
of major growing-season flooding. However, there ap- peared to be both a seasonal effect and thresholds related to sapling size and length of flooding (Hall 1993). The impact of dormant-season flooding was less severe.
There were a few interesting differences among species in median small sapling height growth (Fig. 5-7). Water hickory and American elm exhibited net height growth of below or near zero. This negative net growth suggests that most individuals of these species were not succeeding in the plots, at least over the last 10 years. The rest of the species showed positive median height growth, indicating that most individuals which made it to the sapling size class were succeeding over the period of observation. Chinese tallow, an exotic invader, grew 23 cm per year, more than three times median height growth pooled over all species and years and more than twice the median height growth rate of the next-ranked species (red maple: 9 cm; Median test, T = 19.57, p < 0.001). Differences among the native species were minimal, except that there was a breakpoint between the faster growing oaks and American holly and the slower growing species. It is surprising that the native species did not show more differences in height growth rates, though this result is consistent with the earlier report that tree seedling growth rates differed very little among species (Streng et al. 1989).
Large saplings also showed variation among species in median diameter growth (Fig. 5-8). Again, Chinese tallow grew significantly faster than all the other species (Median test, T = 34.22, p < 0.001). Large saplings of cherrybark oak (Quercus pagoda) and water hickory exhibited greater growth than one might expect, considering their low growth as small saplings; in contrast, red maple and American horn- beam seemed to do relatively worse as large saplings.
To detennine whether growth was faster in and around canopy gaps, we compared sapling growth between the randomly placed permanent sapling plots and plots con- taining sapling patches related to canopy gaps. Median height growth for small saplings in patch plots was 1 cm more than the 7 cm per year found for the random plots (Median test, T = 7.95 12, p = 0.005); large saplings in or around canopy gaps also grew significantly better (Me- dian test, T = 35.1 1, p < 0.001). All but two species showed higher growth in the gap-related patches, either as small or large saplings. Thus, gaps appear to be important to the success of saplings.
We used stepwise linear least-squares regression to model growth as a function of several site variables (per- cent sand, percent clay, relative elevation, and weighted percent sky; details on estimation of environmental vari- ables can be found in Hall 1993). The following predictor variables were also included in the analysis: size of the individual at the beginning of the period of growth, species-specific growth ranking, total density of individuals

58 BIOLOGICAL SCIENCE REPORT USGS/BRD/BSR-1998-0002
Figure 5-7. Box plots of median height growth of small saplings by species at wet site (from Hall 1993). For each boxplot, the white bar represents the median, the light gray bar represents the 95% confidence interval, the dark gray bar and the black outlined box represent the interquartile range, the brackets or whiskers represent 1.5 times the interquartile range, and the empty circles represent outlying data points.
in the quadrat during the year, and days flooded during the year. This mix of variables constant in time (the environ- mental variables and species-specific growth ranking), variables which change depending on which year the indi- viduals grew into the plots (days flooded, density), and variables which are specific to the individual plant (size) may present some pseudoreplication problems, but it is not clear how one might reduce degrees of freedom or cor- rect reported significance levels for this problem. With this caveat, we proceed as if reported significance levels were approximately correct.
The results are significant and slopes of the relation- ships are, for the most part, as expected. Height growth increased with individual size, varied among species, de- clined with the density of other saplings in the same plot, was greater in gaps than under the canopy, and was lower at higher elevations. This latter relationship is the opposite of what one would expect if the primary effects of eleva- tion were associated with flooding or soil waterlogging at low elevations and may indicate that, in years without lengthy flooding, sapling growth is strongly limited at high elevations where moisture stress would be highest.
In addition to the general linear modeling, we used a generalized additive model (GAM) (Hastie and Tibshirani 1986), keeping the significant predictors from the previ- ous analysis as linear (days flooded and percent clay) and specifying that smoothed curves be fit to the variables which showed no linear relationship (percent sky and per- cent sand). Intuitively, a GAM can be understood as an extension of a general linear model wherein the effects are not limited to being linear. In this analysis, the vari- ables of days flooded, percent sky, and percent clay were significant, while percent sand was not. The most interest- ing and interpretable result of the GAM is that it allowed a nonlinear effect of flooding duration on growth to emerge. Growth appeared to decline until the duration of flooding was about 6 months; beyond that, growth was already maximally suppressed. The other two nonlinear relation- ships with weighted percent sky and percent clay had the expected sign (growth increased with increasing percent sky and with increasing percent clay), but the nonlinearities probably represent interaction effects for which we did not test.

VULNERABILITY OF COASTAL WETLANDS IN THE SOUTHEASTERN UNITED STATES 59
0
0
0 0
0 0 0 0 '7
'7 - 0 0 0
0 : H - - - v
0 0 :
. . . . . . . U : LLI
u u : Lj LLI .u 0 0
0
0
0
Figure 5-8. Box plots of median dbh growth of large saplings by species at the wet site (From Hall 1993). See Fig. 5-7 for explanation of box plots.
Tree Ring Analysis Along a Climatic Gradient
Attempts to model and predict effects of climate change on forests typically require assumptions about the rela- tionship of tree growth to climate (Shugart 1984; Solomon 1986; T.W. Doyle, National Wetlands Research Center, Lafayette, Louisiana, personal communication). Unfortu- nately, such assumptions often have little empirical or theo- retical basis and may, in fact, be grossly inaccurate (Shugart 1984; Graumlich 1989; Cook and Cole 1991). The sci- ence of dendrochronology can greatly increase our under- standing of tree growth-climate relationships and thereby improve model predictions (Graumlich 1989; Cook and Cole 1991). In this section, we describe the results of a study of tree-ring growth along a climate gradient in an area which crosses the range boundaries (as defined by Little 1971) of many of the important tree species of the southeastern United States.
The tree-ring study area is defined by a rectangular re- gion in eastern Texas and western Louisiana extending from 28" to 32"N and from 92" to 98"W (Fig. 5-9). In terms of the original vegetation, it extends from a zone of longleaf
pine dominance in eastern Texas, through a zone origi- nally dominated by shortleaf pine, loblolly pine, oaks, and hickory, across an area dominated mostly by oak and
Climate data
- 9 8 - 9 7 - 9 6 - 9 5 - 9 4 - 9 3 - 9 2 - 9 1
Longitude
Figure 5-9. Tree-ring site locations in the Big Thicket region.

60 BIOLOGICAL SCIENCE REPORT USGSIBRDIBSR-1998-0002
hickory, and, finally, across a narrow band of blackland prairie (Tharp 1926, 1939; Bridges and Orzell 1989). The western end is at Bastrop State Park, site of a disjunct stand of loblolly pine and eastern oaks. This site marks the ap- proximate western limit of what is generally recognized as Eastern Deciduous Forest (Braun 1950; Greller 1989). The Big Thicket lies within the east Texas part of the study area.
The study area is characterized by a progressive east-west reduction in precipitation and an associated in- crease in temperature (Fig. 5- lo), which probably accounts for the strong variation in forest vegetation (Tharp 1926; Greller 1989). For the winter season, this gradient is al- most purely east-west, with essentially no trend from south to north. In contrast, the summer rainfall surface is more complex, with a clear south-north decline in rainfall. In all likelihood, the summer rainfall pattern is complicated by intrusions of warm and moist convective air masses from the Gulf of Mexico that dry out as they penetrate progres- sively northward. This mode of moisture delivery is likely to be much less frequent during the cooler winter months. Winter maximum temperature shows a general trend to- wards warmer conditions from east to west and cooler con- ditions from south to north, but there is also considerable local variation. In contrast, summer temperature shows
only a general tendency for warmer conditions from east to west. However, most of this gradient follows a uniform steep increase in maximum temperatures west of 95"W longitude. The pronounced dip in the surface is due to the extreme coastal grid point shown in Fig. 5-9. Presumably, relatively cool sea breezes contribute to this anomaly.
These climate gradients might affect the forests of the Big Thicket region in two ways. First, precipitation ought to become increasingly limiting to tree growth from east to west. In this sense, winter may be the most critical sea- son because it is the time when precipitation is most effec- tive in recharging soil moisture reservoirs. In contrast, much of the summer rainfall will evaporate and will not recharge the soil reservoir. Second, the trend towards warmer sum- mer maximum temperatures from east to west will result in higher potential evaporation demand on the trees and more frequent periods of internal moisture stress. The steep temperature increase might also be significant if a thresh- old effect on evapotranspiration demand is crossed for some tree species.
For this project, 104 annual tree-ring chronologies were developed from 16 tree species (Table 5-4) growing on 38 sites distributed across the region (Fig. 5-9). Ten to twelve trees of a given species were sampled per site, with one increment core extracted per tree. The criteria for selecting
Winter precipitation
.a 3. 36 02
lo cu 26 25
22 20
20 22 25 21 00 32 36 Y 40
Contlmeten
I 1 Summer Precipitation
Winter maximum temperature
Summer maximum temperature
c
,- Dogmas ceblua
Figure 5-10. Surface maps of precipitation and maximum temperature over the Big Thicket region.

VULNERABILITY OF COASTAL WETLANDS IN THE SOUTHEASTERN UNITED STATES 6 1
Table 5-4. Species and basic taxonomy of the 104 tree-ring chronologies.
Tree taxonomy
Family Pinaceae Genus Pinus Loblolly pine Longleaf pine Shortleaf pine Family Taxodiaceae Genus Taxodium Baldcypress Family Fagaceae Genus Quercus Subgenus Leucobalanus White oak Swamp chestnut oak Post oak Overcup oak Subgenus Eryfhrobalanus Southern red oak Water oak Willow oak Laurel oak Shumard oak Blackjack oak Bluejack oak Genus Fagus American beech
Latin name Number
Pinus taeda Pinus palustris Pinus echinata
Taxodiurn distichurn
Quercus alba Quercus rnichauxii Quercus stellata Quercus lyrata
Quercus falcata Quercus nigra Quercus phellos Quercus laurifolia Quercus shurnardii Quercus rnarilandica Quercus incana
Fagus grandifolia
sampling sites were the existence of trees 50 or more years in age of the species needed for the transect in a given general location. Soils, site hydrology, slope aspect, and disturbance history were not considered in the selection of sites. Therefore, while the site selection scheme used here was not statistically random, neither was it biased towards anything but stand age and transect location. Purely ran- dom site selection might well have missed important sites at the western range limits of some species. The annual tree-ring chronologies were developed using standard den- drochronological procedures (Fritts 1976; Cook and Kairiukstis 1990). For each species collection at each site, the ring-width series were checked for cross-dating and overall quality using the computer program COFECHA (Holmes 1982).
A common modeling assumption is that climatic limita- tions to tree growth can be inferred from conditions at range limits (Shugart 1984). Thus, if a range limit for a particu- lar species is characterized by a certain number of drought days or degree days, it is assumed that these conditions represent the physiological limits beyond which the tree cannot grow. If this assumption is correct, trees at the edge of their range should be growing very slowly indeed. As one moves away from the range limit, however, climate improves and the growth of the species in question should increase.
The above assumptions, commonly used in models, have not been conclusively tested (but see Prentice et al. 199 1; Bonan and Sirois 1992). Here, we test whether tree growth at range limits is exceptionally limited. In addition, we test for an effect of distance from range limit on growth. Be- cause model assumptions pertain to potential growth in the absence of competition, we use maximum growth in our analyses rather than average growth. We define maxi- mum growth as the single largest growth ring observed for any individual of a species at a site. Analyses are limited to species with five or more sites.
The assumption that maximum potential tree growth is strongly restricted at range limits is not supported. For four species, maximum growth rates near range limits actually exceeded rangewide means (Table 5-5). For three species, American beech, loblolly pine, and shortleaf pine, the range limit values were somewhat depressed compared to the rangewide means for those species. However, even in those cases, it is hard to argue that a potential diameter growth rate of almost 10 rnrn per year indicates serious climatic stress. The assumption that maximum growth increases with distance from the edge of the range is also not sup- ported (Table 5-3 , except in the case of shortleaf pine. Because these data suggest minimal climatic limitation on tree growth at sites close to the range limits of species, it seems likely that climate effects on seedling establishment may be the critical limiting factor, a conclusion which is consistent with studies of southwestern oaks (Neilson and Wullstein 1983). Clearly, additional experiments to test this hypothesis are warranted.
The 104 annual tree-ring chronologies range from 37 to 739 years in length. From this overall set, we selected for analysis 99 chronologies that covered the common time
Table 5-5. Relationship of maximum ring growth to longitude (OW) for tree species sampled at greater than five sites (n = number . . of samples; r = Pearson produ~t~moment correlation cbefficient; p = Probability level).
Correlation Growth at Percent of statistics range limit mean of
Species n r P (mm) all sites
American beech 9 -.28 .47 7.06
Shortleaf pine 6 -.86 .03 7.05
Longleaf pine 9 -.21 .57 8.80
Loblolly pine 20 -.33 .16 8.83
White oak 1 1 .22 .51 10.67
Southern red oak 9 .02 .95 10.36
Swamp chestnut oak 5 .46 .44 11.18
Water oak 17 .39 .12 18.40

62 BIOLOGICAL SCIENCE REPORT USGS/BRD/BSR-1998-0002
period 1941-1993. Principal components analysis (PCA), a form of multivariate analysis (Cooley and Lohnes 1971; Richman 1986), was employed as a first step in testing for patterns in the tree-ring data. Principal components analy- sis and other ordination techniques are commonly used by vegetation scientists to test for patterns in species associa- tions or plant community relationships in vegetation data. The PCA described herein is analagous, except that the input data are annual tree ring increments rather than mea- surements of species abundance. Thus, the results reveal similarities and differences among tree species in their re- sponses to climate. Though PCA is a common multivari- ate technique, it has never before been employed in tree-ring analysis because the appropriate data set has never before been assembled.
For input data, we used tree-ring indices which sequen- tially removed sources of extraneous variation to focus on year-to-year variability in growth due to climate. Construc- tion of these indices involves two steps (Cook 1985; Fritts and Swetnam 1989). First, long-term, relatively inflexible trend lines are fitted to the individual tree-ring widths and deviations from these fitted lines (residuals) are preserved for analysis. This technique effectively removes gradual
changes in growth due either to intrinsic properties of trees (i.e., all other factors being equal, younger trees grow faster than older trees) or to long-term trends in biotic or abiotic environment (e.g., growth of trees into canopy gaps; see Glitzenstein et al. 1986). These gradual trends, while eco- logically interesting, tend to obscure short-term growth responses related to climate.
The second step in construction of a tree-ring index is autoregressive modeling of the residuals. Autoregression (Box and Jenkins 1976) is analogous to ordinary multiple regression, except that the predictor variables are prior years in a time series. This technique controls for physi- ological effects which may carry over from one year to the next, blurring the influence of climate in any given year (Cook 1985). Autoregressions yield a second set of residuals, which are the final tree-ring indices used in the PCA.
The results of the PCA of annual tree-rings revealed a previously unsuspected pattern, which we call the phylo- genetic effect. It is illustrated by examining the loadings of species' scores on the different PCA factors (Fig. 5- 11). Each PCA factor can be thought of as an independent source of variation in the tree-ring data, analogous to axes
Beech White oak Black oak Pine Beech White oak Black oak Pine
Phylogenetic groups Figure 5-11. Varimax rotated factor loadings for each phylogenetic group on each principal components analysis (PCA) factor. Each of the four sections corresponds to one of the PCA factors. Within each section there is a box plot of the factor loadings for all chronologies (species x sites) within each phylogenetic group (beech, white oak, black oak, pine; see text for further definitions of phylogenetic groups). Each box plot consists of a median value (horizontal line within shaded area), a box containing all measurements from the 25th to the 75th percentiles of all values, and whiskers showing 5th and 95th percentiles.

VULNERABILITY OF COASTAL WETLANDS IN THE SOUTHEASTERN UNITED STATES 63
in an ordination analysis. For Factor 1, scores for the black oak (Erythrobalanus) subgenus are highest (median = 0.54), followed by species of the white oak (Leucobalanus) subgenus (median = 0.32), American beech (median = 0.26), and pines (median = 0.17). Consequently, we call Factor 1 the black oak factor, even though the overlap be- tween the black oaks and white oaks loadings indicates some similarity between the oak subgenera. This overlap is much reduced on Factor 2, which shows the strongest phylogenetic separation. Because pine species load well above the other groups (median = 0.70), we call Factor 2 the pine factor. The beech and white oak chronologies are separate from the black oak and pine chronologies on Fac- tor 3, so we call this the beechlwhite oak factor. No par- ticular phylogenetic group is segregated on Factor 4, and median loadings for all taxonomic groups are low. Factor 4 does have some chronologies that load very highly, how- ever, especially in pines and black oaks. These variations suggest that there may be local, site-related explanations for this factor.
These results suggest that growth responses of species to climatic variation are determined primarily by evolu- tionary rather than ecological relationships. We might have expected a priori that factor loadings would reflect simi- larities among species with similar site requirements, that dry site white oaks would load with dry site black oaks and dry site pines. The lack of clustering has two impor- tant implications for predicting climate effects on forests. First, shifts in seasonal distribution of precipitation might be expected to produce similar compositional changes across a range of sites. The second implication of the phy- logenetic effect for climate change predictions concerns the use of tree-ring indices in stand dynamics modeling (Cook and Cole 1991). The existence of phylogenetically homogenous groupings should greatly simplify the task of modifying these models to reflect climate effects on tree growth.
The differences we found between the oak subgenera in tree-ring growth are consistent with patterns described by Mohler (1990) from vegetation analysis. He demon- strated a tendency for species in the black oak subgenus to occur on the same sites with species in the white oak sub- genus, whereas species within the same subgenera were less likely to occur on the same sites. Mohler argued that his results indicated evolutionary differences between the two subgenera that promote coexistence of species pairs by minimizing interspecific competition. Our tree-ring re- sults suggest that differences in responses to climate may be one factor contributing to that coexistence.
In addition to demonstrating the phylogenetic effect, PCA factor loadings of species groups, when plotted ver- sus longitude, show variation with longitude for the two oak subgenera but not for the pine group as a whole or for American beech (Fig. 5-12). There are, however,
longitudinal trends among pine species (Fig. 5-13). The exact causes of the east-west trends have not yet been iden- tified. The absence of these trends in analysis of the raw ring-width data presented may be due to masking by the larger and more direct effects of competition and distur- bance. Nevertheless, the fact that there are annual incre- ment growth differences among species and species groups in climate response across a climate gradient indicates that climatic change could shift competitive relationships and thereby promote forest change.
Conclusion The results of our long-term studies reveal that Big
Thicket forests are highly variable. Each of the three long-term study plots has undergone shifts in tree species composition during 16-20 years of monitoring. At the dry study site, the changes were relatively easily interpreted in terms of two common regional phenomena: postlogging recovery and fire exclusion. Effects of climatic changes on sites such as this will probably involve interactions be- tween climate and fire regimes. Changes in global climate are likely to influence both within-season timing and in- tensity of fires, even under managed conditions, thus af- fecting forest composition. If fire continues to be excluded from this system, predicted increases in regional drought may aid preserve managers by retarding the invasion of mesic, shade-tolerant species into formerly fire-maintained upland habitats.
Our study of a wet forest revealed disturbing long-term trends in woody plant species composition, particularly in the smaller size classes. Changes in flow patterns from the construction of two upstream dams appear to be favoring species of lower flood tolerance and altering the charac- teristic spatial structure of bottomland forests. Human intervention in the form of altered river flows has increased the variability of the system and may be predisposing this system to uncharacteristic increases of certain tree popu- lations. Changes in regional climate will no doubt further increase this variability by increasing the frequency and intensity of both floods and droughts. An understanding of this variability may be crucial to the success of postharvest regeneration in commercial forestry operations.
At the mesic site, we had an opportunity to directly ob- serve the effects of a hurricane. Even though it caused only a small rise in mortality of canopy trees, this storm had an important impact on forest regeneration processes. Long intervals between canopy opening events gradually reduce understory trees and shrubs, providing opportuni- ties for regeneration of canopy species. Consequently, in- creasing frequency of large storms may maintain uncharac- teristically dense shrub populations, with detrimental con- sequences for canopy tree regeneration. This suppression of tree regeneration, coupled with higher storm-related mortality could result in a decline in the standing biomass

64 BIOLOGICAL SCIENCE REPORT USGS/BRD/BSR-1998-0002
-0 .4 Black oak Other Pine Other Beech White oak Other
1 . 2 , , , I I , , , , 1 1 1 I I I I I I I I
- - - B. Loadings by longitude - - - - - - - - - - - - - - - - - - - - - - -
l I 1 1 t 1 1 1 1 I I I I I I 1 I I I I I I ~
+ Pine
Longitude (W) Figure 5-12. Varimax factor loadings for each of the four phylogenetic groups. Black oak loadings are Factor 1 values for the oak subgenus Erythrobalanus, pine loadings are Factor 2 values for pine species, beech loadings are Factor 3 values for American beech, and White oak loadings are Factor 3 values for the subgenus Leucobalanus.

VULNERABTLITY OF COASTAL WETLANDS IN THE SOUTHEASTERN UNITED STATES 65
Longitude (W) Figure 5-13. Varimax loadings by longitude for pine chronologies.
(i.e., the carbon storage capacity) of southern upland for- ests resulting in increased emissions of CO, to the atmosphere.
An important direct effect of climate is its influence on tree growth. The emerging conclusion is that present day climate variation does produce detectable effects on tree and sapling growth. However, these effects are small and therefore may be secondary to indirect effects of climate change on forests by way of increased frequency and in- tensity of disturbance. A surprising result from the tree ring study suggests that this conclusion applies even close to the southwestern range limit of the tree species and thus implies that climate effects on seedling regeneration may be more important in limiting the ranges of these trees than climate effects on growth.
Direct effects of climate on recruitment and mortality were not detected, though we did find that drought strongly increased seedling mortality in the wet forest (Streng et al. 1989). The absence of effects on trees may be the result of masking by gradual death of trees, by multiple influ- ences on tree death and decline (Harcombe 1987; though see Clinton et al. 1993), or by indirect disturbance effects. Continued collection of these important data over the next
10-20 years will allow more definitive tests of direct cli- mate effects on tree recruitment and mortality. Again, evi- dence from the long-term monitoring and statistical analy- sis of patterns of growth and mortality indicates that cli- mate change will have a stronger effect on forest dynam- ics indirectly by way of more frequent or more intense disturbance than by way of more direct effects on indi- vidual growth or average mortality rates related to an in- crease in temperature or a change in regional moisture balance.
All forest processes vary on a variety of temporal and spatial scales. Growth and survivorship of different tree size classes depend on climatic conditions, soil factors, and competitive relations within the stand. Recruitment depends on the availability of seed sources, light condi- tions in the understory, subtle differences in microsites, and weather events. In this project, we are documenting many of these dependencies. The variety of influences, both internal and external to the system, makes it difficult to assess the effect of changes in boundary conditions such as climate on dynamics at the system level. The mechanis- tic approach to forest dynamics seeks a unified framework of constant relationships and parameters within which

66 BIOLOGICAL SCIENCE REPORT USGS/BRD/BSR-1998-0002
community responses can be predicted and explained. One way to embody this framework is within a simulation model.
Current forest dynamics theory and modeling derived from it are based on the responses of individual trees: how they grow and complete their life-cycles in response to variations in the local environment and how they affect their local environment. Early gap models (Shugart 1984) assumed a direct relationship between range limits of taxa and the growth rates of adult trees that is not supported by available data (Prentice et al. 1991; Bonan and Sirois 1992). Our sites include several taxa growing very close to their range limits for which growth rates are as high as any recorded in the interiors of the geographic ranges. Another error of early gap models is the assumption that the phe- nomenon of shade tolerance is driven entirely by the abil- ity to grow in the shade. Our data, in conjunction with results from other studies (Hall 1993; Kobe et al. 1995),
indicate that the ability to survive suppression is at least as important as growth in determining shade tolerance.
Hence, the results reported here not only identify spe- cific climatic effects on particular life stages or processes, but they also clarify forest dynamics theory, which will lead to better models. The results also reinforce the ratio- nale for modeling: the complexity of the system and of the interactions makes it very difficult to make clear or pre- cise predictions, except that many processes and interac- tions will be influenced by climate change. In followup studies, improved understanding of the mechanisms of forest dynamics should be incorporated into improved simulation models that will allow well-founded extrapola- tions of the effects of climate change. Such models will make it possible to quantitatively determine whether the responses noted here will result in the magnitude of change previously suggested (Urban and Shugart 1990; Nielson et al. 1991).