Chapter 5: Producing Data
47
1 Chapter 5: Producing Data 5.1 Designing Samples 5.2 Designing Experiments 5.3 Simulating Experiments
-
Upload
raja-hatfield -
Category
Documents
-
view
28 -
download
3
description
Chapter 5: Producing Data. 5.1Designing Samples 5.2Designing Experiments 5.3Simulating Experiments. Types of Studies. Observational Study We observe individuals and measure variables of interest, but no attempt is made to affect the outcomes. - PowerPoint PPT Presentation
Transcript of Chapter 5: Producing Data
1
Chapter 5: Producing Data
5.1 Designing Samples
5.2 Designing Experiments
5.3 Simulating Experiments
2
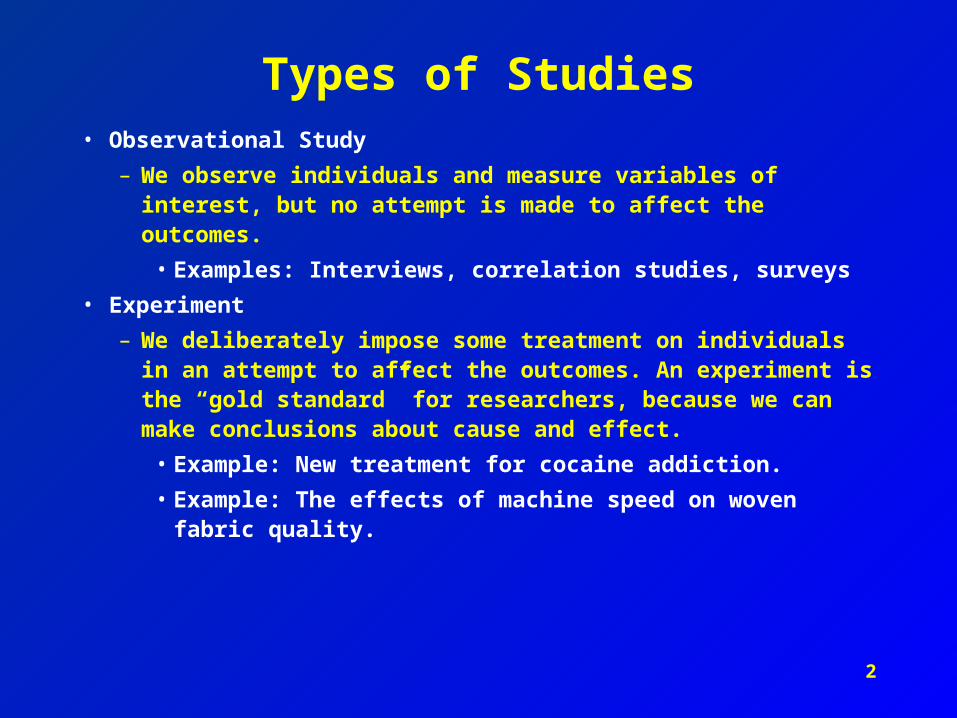
Types of Studies• Observational Study
– We observe individuals and measure variables of interest, but no attempt is made to affect the outcomes.
• Examples: Interviews, correlation studies, surveys
• Experiment
– We deliberately impose some treatment on individuals in an attempt to affect the outcomes. An experiment is the “gold standard” for researchers, because we can make conclusions about cause and effect.
• Example: New treatment for cocaine addiction.
• Example: The effects of machine speed on woven fabric quality.
3
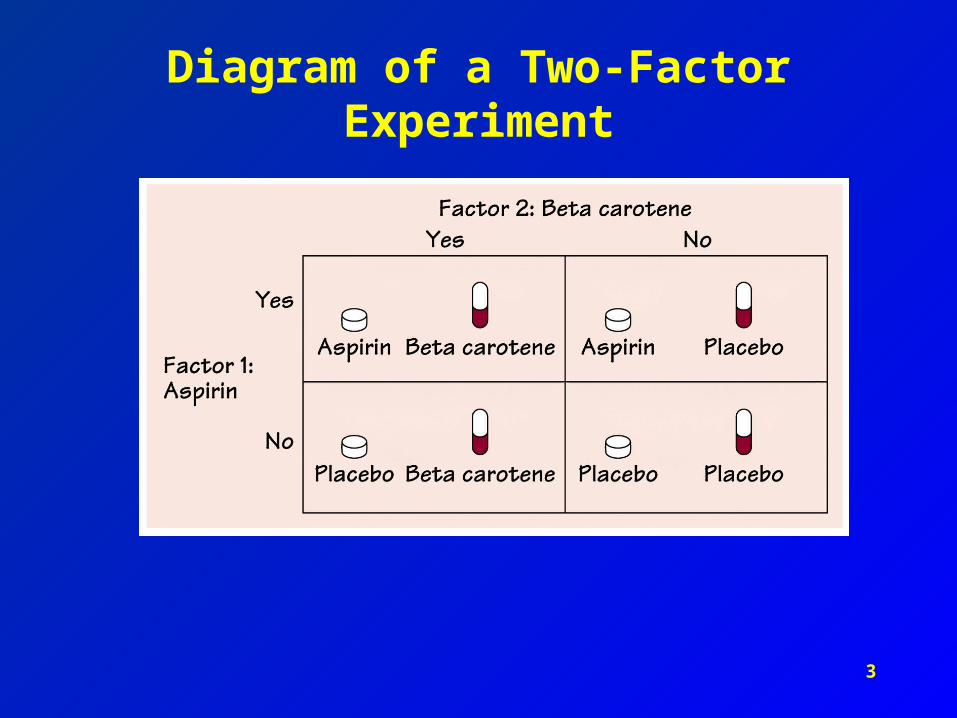
Diagram of a Two-Factor Experiment
4
Populations and Samples
• A population is the entire group of individuals for which we want information.
– Note that this varies for each study.
– “Individuals” can mean people, rats, yarn bobbins, …
• A sample is a part of the population that we actually examine.
– We do this for time and cost reasons, mainly.
5
Poor Sampling Methods and Bias
• Voluntary response sample
• Convenience sampling
• Bias
– The design of a study is biased if it systematically favors certain outcomes.
6
Problems
• 5.2, p. 273
• 5.3, p. 273
• 5.5, p. 273
• 5.7, p. 274
7
Simple Random Sampling
• We have chosen a simple random sample of size n out of a population if each individual had an equal chance of being selected.
– What are some ways to choose a SRS?
• Note: The above statement is true, but in itself is not a complete definition of SRS.
– Reading from BVD text.
– Statement in your text, p. 275.
8
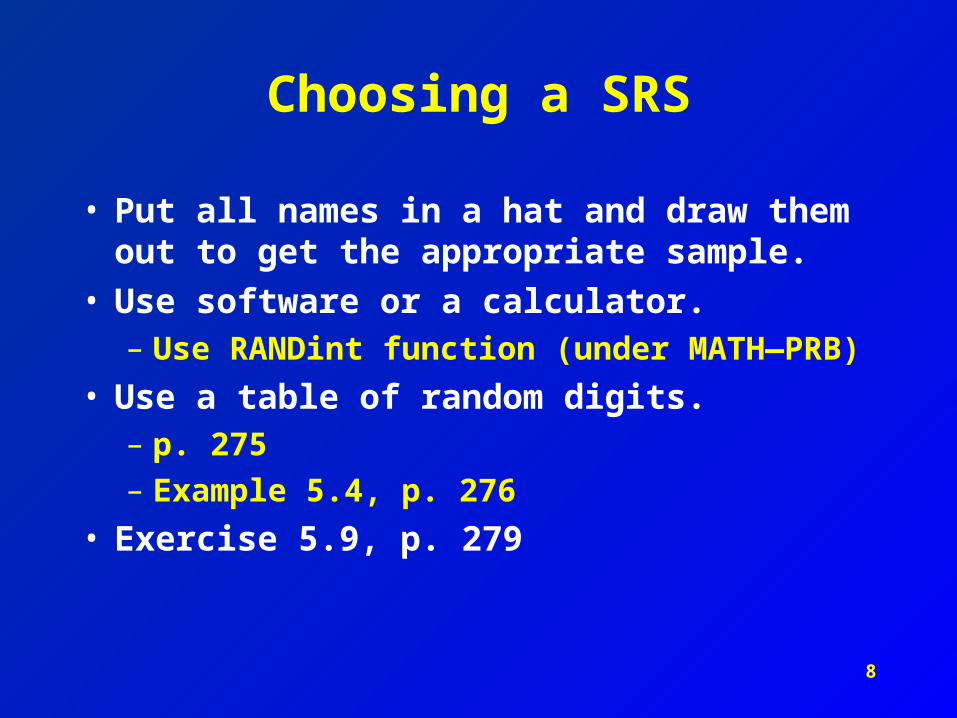
Choosing a SRS
• Put all names in a hat and draw them out to get the appropriate sample.
• Use software or a calculator.– Use RANDint function (under MATH—PRB)
• Use a table of random digits.– p. 275
– Example 5.4, p. 276
• Exercise 5.9, p. 279
9
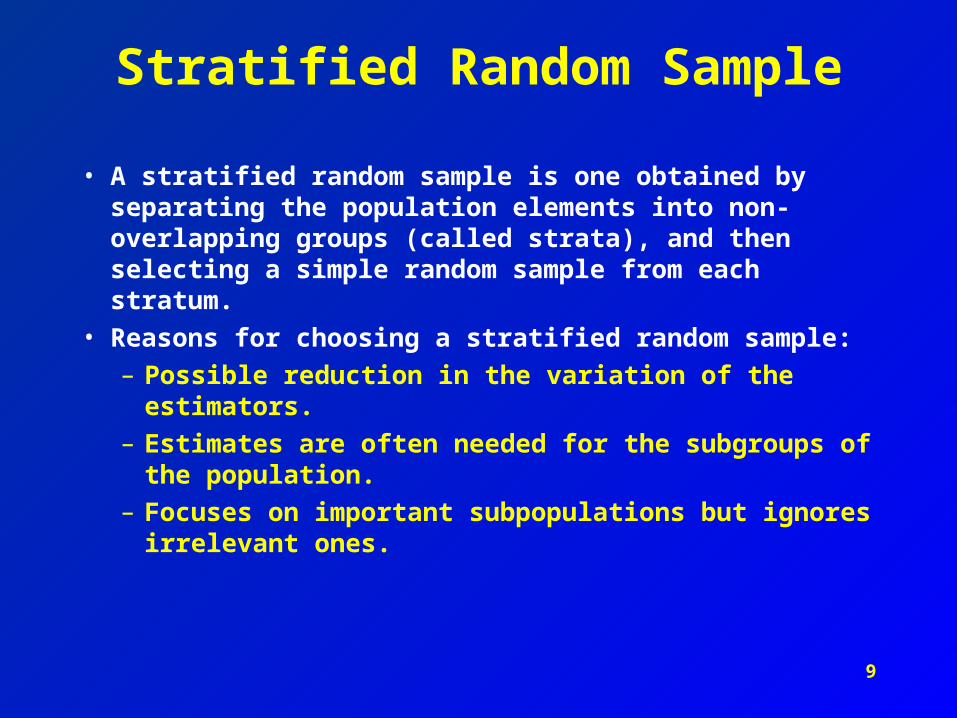
Stratified Random Sample
• A stratified random sample is one obtained by separating the population elements into non-overlapping groups (called strata), and then selecting a simple random sample from each stratum.
• Reasons for choosing a stratified random sample:
– Possible reduction in the variation of the estimators.
– Estimates are often needed for the subgroups of the population.
– Focuses on important subpopulations but ignores irrelevant ones.
10
Example
• A real-world example of using stratified sampling would be for a US political survey. If we wanted the respondents to reflect the diversity of the population of the United States, the researcher would specifically seek to include participants of various minority groups such as race or religion, based on their proportionality to the total population.
11
Disadvantages of Stratified Sampling
• Can be difficult to select relevant stratification variables
• Not useful when there are no homogeneous subgroups
• Can be expensive
• Requires accurate information about the population

12
Weighting the Strata
• Proportionate allocation uses a sampling fraction in each of the strata that is proportional to that of the total population. If the population consist of 60% in the male stratum and 40% in the female stratum, then the relative size of the two samples (one males, one females) should reflect this proportion.
13
Cluster Sampling
• Cluster sampling is generally employed because of cost effectiveness or because no adequate frame (list of sampling units) is available.
• Once the clusters are identified, clusters are chosen at random and each element within the cluster is measured.
14
Cluster Sampling Example
• Suppose we wish to estimate the average income per household in a large city. We might consider using stratified random sampling, but we must be able to determine the strata and also have the sampling frame (that is, the elements). However, we could divide the city into regions such as blocks (the clusters), then select a simple random sample of blocks from the population. This task is easily accomplished by using a frame that lists all city blocks. Then the income of every household within each sampled block could be measured.
15
Cautions About Sample Surveys
• We need an accurate and complete list of the population.
– Else, undercoverage can result.
• Non-response bias
• Wording of questions!
– Ex. 5.7, p. 282
• Sample size must be adequate to make inferences about the population.
– Chapter 10

16
Homework
• Reading: 268-285
• Problems:
– 5.13, p. 283
– 5.17, p. 284
17
Designing a Survey:Things to Consider
• Purpose statement
• Instructions to respondent– Confidentiality, etc.
• Method of administering survey
• Sample size:– All? Some? How do we choose?
• Type of questions
• Number of questions
• Specific wording of questions
18
Exercises, p. 284
• 5.15
• 5.18

19
Section 5.2 Experimental Design
20
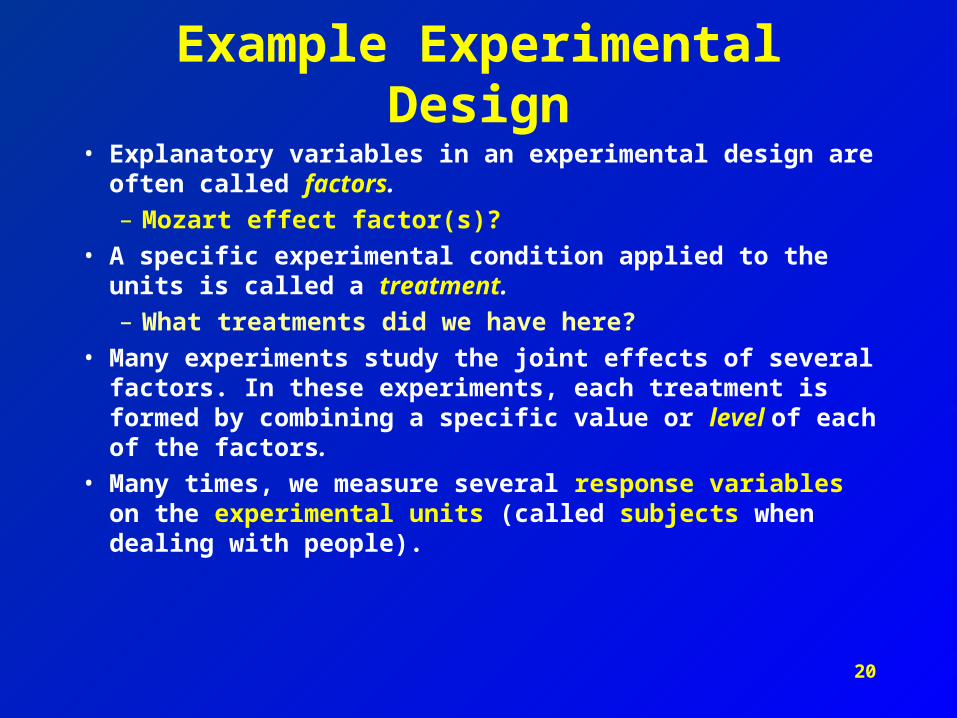
Example Experimental Design
• Explanatory variables in an experimental design are often called factors.
– Mozart effect factor(s)?
• A specific experimental condition applied to the units is called a treatment.
– What treatments did we have here?
• Many experiments study the joint effects of several factors. In these experiments, each treatment is formed by combining a specific value or level of each of the factors.
• Many times, we measure several response variables on the experimental units (called subjects when dealing with people).

21
Diagram of a Two-Factor Experiment
22
Exercises
• 5.32, p. 293
• 5.33, p. 293
23
Benefits of Using Experimental Design
• Experiments can give good evidence for causation.
• Experiments allow us to study the specific factors we are interested in, while controlling the effects of the lurking variables. They also allow us to study the combined effects of several factors, as we saw above.
• Experimental control!
– First basic principle of statistical design of experiments.

24
What is the “placebo effect”?
• http://en.wikipedia.org/wiki/Placebo_effect
• http://www.fda.gov/fdac/features/2000/100_heal.html
25
Placebo Effect
• Example 5.11, p. 292
– Placebo
– Control group
– Comparative experiment

26
Homework
• Reading in section 5.2, pp. 290-300.
27
Problems
• Exercises:
– 5.34, p. 293
– 5.36, p. 294
– 5.39, p. 298
– 5.42, p. 299
28
Randomization
• Systematic differences among the groups of experimental units in a comparative experiment cause bias.
– Textile example
• Randomization is the statistician’s remedy against bias.
– Example 5.12, p. 295

29
Questions about Example 5.12
• Are the two groups of rats guaranteed to be identical?
• Do you think it is wise to include many experimental units?
– We hope that we can have the effects of chance to average out with multiple experimental units.
– Replication!

30
Principles of Experimental Design
• Experimental control
• Randomization
• Replication
31
Exercise 5.38, p. 298
32
Statistical Significance
• Even if we have controlled properly, randomized, and replicated, we can still get differences among our experimental units on our response variables that are caused by chance.
• We use the laws of probability, which give mathematical descriptions of chance behavior, to learn if the treatment effects are larger than we would expect to see if only chance were operating.– If they are larger than to be expected by chance, we call
them statistically significant.
33
Wrapping Up Section 5.2
• Cautions about experimentation
• Double-blind experiment
• Matched pairs designs
• Block designs

34
Treating Each Subject Identically
• When we do a randomized comparative experiment we must take special care to see that each subject (or each experimental unit) is treated identically.
– Is there researcher influence? Did other things not in our control change during the course of the experiment (e.g., ambient conditions, machines, people, etc.)?
• Double-blind experiment
– Gold standard in medical research
– 5.43, p. 303
35
Lack of Realism
• Examples 5.14 and 5.15, p. 300
• Subjects being monitored/experimented on may or may not be like the population.
36
Experimental Control
• Definition of experimental control:
– Taking account of extraneous variables in the experimental design, most simply by the use of equivalent groups for comparison.
• How can we, as researchers, achieve experimental control?
37
Matched Pairs Designs
• A matched pairs design helps in experimental control.
• See Example 14 from handout:
– Moore, David S. (1991). Statistics: Concepts and controversies (3rd ed.). W.H. Freeman: New York.
38
Block Designs
• Example 15, p. 108 in:
– Moore, David S. (1991). Statistics: Concepts and controversies (3rd ed.). W.H. Freeman: New York.
• Blocks are a way of holding fixed an extraneous variable that would otherwise cause large variations in the experimental results.
• Note: Matched pairs designs are one type of block design.

39
Block Design Example*
• An agronomist wishes to compare the yield of five corn varieties. The field in which the experiment will be carried out increases in fertility from north to south. The agronomist divides the field into 30 plots of equal size, and wants to employ a randomized complete block design.
• Identify the experimental units, the treatments, and the blocks. Describe the arrangement of the randomized complete block design, and perform the appropriate randomization.
* Moore, David S. (1991). Statistics: Concepts and controversies (3rd ed.). W.H. Freeman: New York.
40
Problems
• From the handout (Moore):
– p. 112: 2.36, 2.37, 2.38
41
Additional 5.2 Questions
• Problems:
– 5.44, p. 303
– 5.46, p. 304
– 5.49, p. 306
– 5.53, p. 307
42
5.3 Simulating Experiments
• We can use technology to simulate what might happen if an experiment were actually carried out.– TI-83/84/89 random number generator
– We can also use dice or coins or cards, though these methods are less efficient.
• Simulation is an effective tool for finding likelihoods of complex results once we have a trustworthy model.
43
Monte Carlo Methods
• http://en.wikipedia.org/wiki/Monte_Carlo_methods

44
Example 5.21, p. 310
• Simulation steps:– 1. Describe the experiment– 2. State the assumptions
• E.g., likelihood of an event occurring; independence of events.
• Independence—result of one trial does not affect the result of another (e.g., coin toss)
– 3. Assign digits to represent outcomes.• Change: 0-4 heads; 5-9 tails
– 4. Simulate many repetitions.• Each group of 2 simulate 5 reps, where a rep is 10 flips.
– 5. Estimated probability?
45
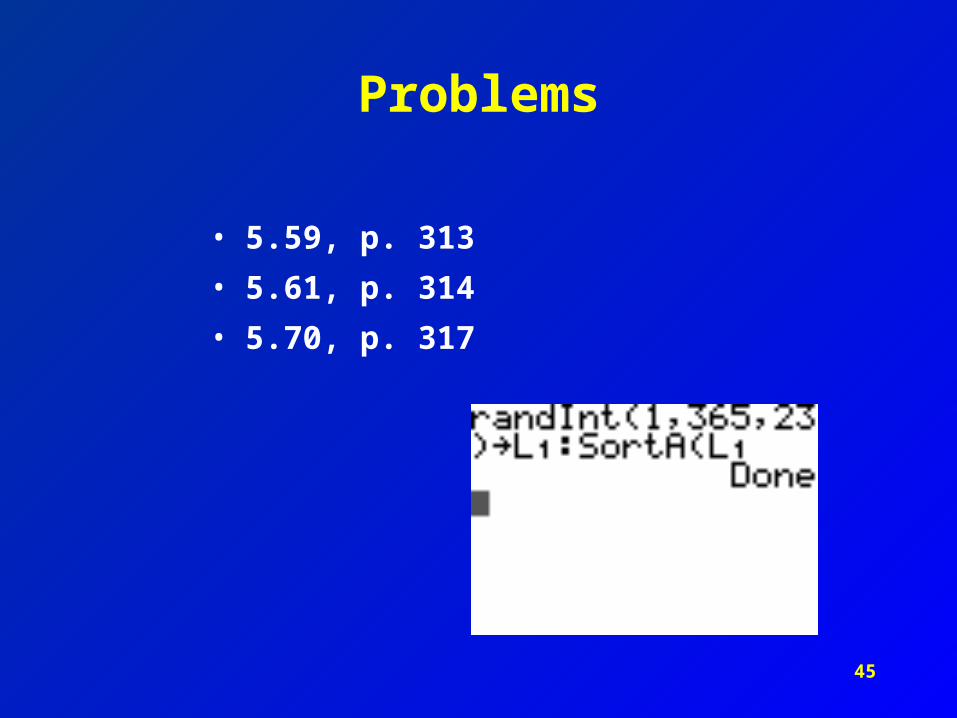
Problems
• 5.59, p. 313
• 5.61, p. 314
• 5.70, p. 317
46
Homework
• Simulation problems, pp. 314-316:
– 5.62, 5.65
• Chapter 5 Test on Monday
47
Review Problems
• 5.74, 5.77, 5.79, 5.87
– pp. 319-323