Chapter 5 Pattern of forest fragmentation in...
18
86 Chapter 5 Pattern of forest fragmentation in Khangchendzonga Biosphere Reserve 5.1 Introduction Fragmentation of continuous forests into smaller patches has serious consequences on the survival of species and ecosystems. Fragmentation alters microenvironment and increases the vulnerability of the forest communities (Lovejoy et al. 1984, 1986; Lord & Norton 1990; Robinson et al. 1992; Matlack 1994). As forest landscapes become increasingly fragmented, populations of forest species are reduced, dispersal and migration patterns are interrupted, ecosystem inputs and outputs are altered, and previously isolated core habitats are exposed to external conditions, all of which result in a progressive erosion of biological diversity (Terborgh & Winter 1980; Tilman et al. 1994). Forest fragmentation is a dynamic process in which the habitat is progressively reduced into smaller patches that becomes more isolated and increasingly affected by edge effects (Forman & Godron 1986; Reed et al. 1996; Franklin 2001; McGarigal 2002). The fragments of irregular shape tend to have increased edge lengths (Echeverria et al. 2007) and therefore, total species richness in smaller fragments is significantly lower than the larger ones (Metzger et al. 1997). Thus, conversion of continuous forests into forest fragments and large fragments into smaller fragments has been described as the most important factor of species and ecosystem loss in tropics (Turner 1996). Forests may be fragmented by anthropogenic or natural activities or events, such as road construction, logging, conversion to agricultural land, and wildfire. The size of the forest fragment is a function of causes of disturbance, history of forest and disturbance, disturbance intensity and frequency, and often forest management interventions. Changes in land use and land cover could be an effective indicator of forest fragmentation. Land use refers to man’s activities on land, whereas land cover denotes natural vegetation cover, water bodies etc. Because of conversion of forest lands into
Transcript of Chapter 5 Pattern of forest fragmentation in...

86
Chapter 5 Pattern of forest fragmentation in Khangchendzonga Biosphere Reserve 5.1 Introduction Fragmentation of continuous forests into smaller patches has serious consequences on the
survival of species and ecosystems. Fragmentation alters microenvironment and increases
the vulnerability of the forest communities (Lovejoy et al. 1984, 1986; Lord & Norton
1990; Robinson et al. 1992; Matlack 1994). As forest landscapes become increasingly
fragmented, populations of forest species are reduced, dispersal and migration patterns
are interrupted, ecosystem inputs and outputs are altered, and previously isolated core
habitats are exposed to external conditions, all of which result in a progressive erosion of
biological diversity (Terborgh & Winter 1980; Tilman et al. 1994). Forest fragmentation
is a dynamic process in which the habitat is progressively reduced into smaller patches
that becomes more isolated and increasingly affected by edge effects (Forman & Godron
1986; Reed et al. 1996; Franklin 2001; McGarigal 2002). The fragments of irregular
shape tend to have increased edge lengths (Echeverria et al. 2007) and therefore, total
species richness in smaller fragments is significantly lower than the larger ones (Metzger
et al. 1997). Thus, conversion of continuous forests into forest fragments and large
fragments into smaller fragments has been described as the most important factor of
species and ecosystem loss in tropics (Turner 1996).
Forests may be fragmented by anthropogenic or natural activities or events, such
as road construction, logging, conversion to agricultural land, and wildfire. The size of
the forest fragment is a function of causes of disturbance, history of forest and
disturbance, disturbance intensity and frequency, and often forest management
interventions. Changes in land use and land cover could be an effective indicator of forest
fragmentation. Land use refers to man’s activities on land, whereas land cover denotes
natural vegetation cover, water bodies etc. Because of conversion of forest lands into

87
croplands and pastures, and deforestation, reforestation and afforestation activities, both
land use and land cover change in a forested landscape (Kilie et al. 2004). Forest
fragmentation due to land use changes is considered to be the most important reason for
biodiversity decline in forest ecosystems (Kilie et al. 2004; Matsushita et al. 2006). The
ecological consequences of fragmentation may differ depending on the fragmentation
patterns, i.e. spatial configuration imposed on a landscape, and their temporal and spatial
variations (Echeverria et al. 2006; Cayuela et al. 2006). Therefore, an understanding of
the temporal and spatial patterns of fragmentation and its impact on populations is a
prerequisite for land use and biodiversity management in any landscape.
Khangchendzonga Biosphere Reserve (KBR) in Eastern Himalayas, Sikkim is
facing the increasing incidences of cattle grazing, landslide, forest fire and wind-throw.
All these disturbances have brought about discontinuity in forest cover in many parts of
the Biosphere Reserve, thereby fragmenting the natural landscape as well as habitats of
several plant species. However, no quantitative data on fragmentation pattern,
fragmentation dynamics and causes of fragmentation is available for KBR. Therefore,
this chapter has been designed (i) to study the spatial and temporal patterns of forest
fragmentation, and (ii) to analyze the causes and intensity of disturbances causing forest
fragmentation. The consequences of the forest fragmentation on plant species populations
have been presented in the next chapter.
5.2 Methods
Fragment spatial variables
Fragment size, and isolation of forest fragments were evaluated to study forest
fragmentation in KBR. Both the attributes were estimated on ArcView 3.2 platform using
the Spatial Analyst 2.0 extension (ESRI 1999). For estimating Fragment size (FS), the
surface area (ha) of the fragment was calculated (McGarigal & Marks 1994).

88
Isolation of forest fragments was examined in terms of their proximity to
surrounding fragments. Isolation Index (II; adapted from Forman 1997 & Cook 2002):
where II = Isolation Index, N = all neighbouring fragments within a radius of 1 km from
the focal fragment; dij = distance (patch i and neighbouring patch j). Higher II values
indicate higher isolation.
Land use and land cover mapping
The land use and land cover of the KBR was mapped using multi-dated satellite
imageries and through extensive ground truthing for each land use type following
stratified random sampling method. Survey of India (SOI) topographical maps were used
for geocoding the imageries. The satellite images used in this study are Landsat
Multispectral Scanner (MSS) imagery of 1999, Landsat Thematic Mapper (TM) imagery
of 2002 and Indian Remote Sensing Satellite (IRS) 1D LISS III imagery of 2008. The
satellite images were rectified or geometrically corrected using Ground Controlled Points
(GCPs) obtained from topographical sheets and the GPS points collected from the field
survey. Points such as intersection of the roads, river junctions and permanent
establishments were identified on the topographical sheets as GCPs. By using polynomial
equations the scene was geometrically corrected and geo-referenced using a UTM
(Universal Transverse Mercator) projection system. The spheroid and datum used were
WGS 84 and the UTM Zone 45N. The pixels of the satellite images were re-sampled
using a maximum likelihood algorithm and the study area was extracted from the scene
using a digitized state boundary, Biosphere Reserve boundary, buffer area boundary and
core area boundary from the Survey of India topographical sheets. Sub-pixel image to
map accuracy was achieved through repeated attempts. Histogram matching was done to
correct the radiometric differences, when present.

89
Supervised digital image classification method was carried out to delineate
different land uses viz., dense forests, open forests, barren land, meadow, snow cover
area, glacier beds and water bodies. Supervised method of classification can be defined
normally as the process of samples of unknown identity and are those pixels located
within the training sites. A brief description of each of the land cover classes is given in
Table 5.1.
In this type of classification, spectral signatures are developed from specified
locations in the image. These specific locations are given a generic name ‘training sites’
and are defined. These training sets help in developing the outline areas. Multiple
polygons are created for each land category to delineate relevant land use type. These
signatures will then be used to classify all pixels in the scene. Sufficient Ground
Controlled Points (GCP) were taken to confirm the different land use types. Nearest
Neighbourhood Analysis was done for post classification smoothening. The steps
followed for classification have been summarised in figure 5.1.
Table 5.1. Land cover classes of KBR.
Land cover classes Description Barren land Soil less than 1 cm in thickness, devoid of any vegetations/exposed rocks Snow/glacier Huge mass of ice originating from an accumulation of snow Meadows Mainly the high elevational alpine meadow/pasture land Open forests Interrupted forest due to forest gaps, whose canopy cover is less than 10% Dense forests Uninterrupted forest cover, whose canopy cover is greater than 10% Water bodies Lakes/rivers/streams/wet lands

90
Figure 5.1. Flow chart for studying land use/ land covers changes and fragment dynamics in KBR.
Collection of Ground Control Points for fragmentation studies
KBR was extensively surveyed for locating the forest fragments. Twenty five fragments
were located in the KBR spread over three forest types. One fragment was located in
Lower montane forests, 14 in Upper montane and 10 in Montane forests. With the help of
a Garmin Global Positioning System (GARMIN model Map 76), geographical
coordinates for each of these 25 fragments were collected (Table 5.2) and mapped. The
changes in forest fragmentation pattern was studied by comparing the time series data i.e.
1999-Landsat (MSS) 2002-Landsat (TM) 2008-IRS 1D LISS III
Georeferencing/registration
Digitize Sikkim & KBR
Scan
SIKKIM TOPOGRAPHIC SHEETS
Geometrical correction/georeferencing (UTM Projection System, Spheriod/Datum-WGS 1984, UTM Zone 45N)
Overlaying of layers
Extract Sikkim and KBR from imageries
Supervise for LULC and forest fragments
Identify temporal change and land cover Identify isolated forest patches
Analysis

91
imageries of 1999, 2002 and 2008 as described in the earlier section. Visual interpretation
technique was used for mapping the fragment locations and sizes in the entire KBR.
Table 5.2. Characteristics of the 25 forest fragments in Khangchendzonga Biosphere Reserve, Sikkim.
Fragment number (FF)
Aspect Slope (°)
Elevational range (m)
GPS Coordinate (at the centre of fragment) Latitude (N) Longitude (E)
FF1 South 10-15 2525-2550 27°22.020’ 88°06.650’ FF2 East 10-25 2560-2565 27°22.356’ 88°06.667’ FF3 East 15-30 2740-2770 27°22.457’ 88°06.450’ FF4 East 10-20 2800-2900 27°22.500’ 88°06.249’ FF5 South-East 30-50 3018-3600 27°22.675’ 88°05.850’ FF6 South-east 5-20 3455-3530 27°22.951’ 88°05.300’ FF7 South-west 10-20 3500-3570 27°23.249’ 88°05.130’ FF8 South-west 10-25 3485-3500 27°23.352’ 88°05.010’ FF9 West 20-40 3480-3600 27°23.528’ 88°04.921’ FF10 South-west 10-35 3530-3570 27°23.463’ 88°04.775’ FF11 South-west 10-45 3584-3700 27°23.600’ 88°04.575’ FF12 South 20-40 3700-3855 27°23.415’ 88°05.685’ FF13 South-east 10-20 2545-2552 27°25.657’ 88°11.288’ FF14 East 10-35 2709-2725 27°25.705’ 88°11.135’ FF15 South 10-40 2900-2930 27°25.850’ 88°10.950’ FF16 South 15-20 2940-2985 27°25.974’ 88°10.826’ FF17 South-east 10-15 3283-3290 27°26.730’ 88°10.770’ FF18 North-east 5-10 3800-3840 27°27.025’ 88°05.320’ FF19 South-east 15-20 3770-3790 27°27.210’ 88°05.325’ FF20 West 20-25 3830-3930 27°27.260’ 88°05.630’ FF21 South 25-35 3125-3139 27°46.350’ 88°32.600’ FF22 East 30-40 3088-3117 27°46.110’ 88°32.565’ FF23 South 30-45 1700-1760 27°19.420’ 88°09.672’ FF24 South-west 30-40 3250-3300 27°47.22’ 88°33.04’ FF25 South-west 30-45 3179-3380 27°46.65’ 88°32.97’
Changes in forest fragments
An annual fragment creation rate was calculated using the following formula (Puyravaud 2003):
where, P is percentage of forest loss per year, and A1 and A2 are the amount of forest cover/area under fragments at time t1 and t2, respectively.

92
Causes of forest fragmentation
Grazing activity, NTFPs cultivation and extraction, taungya plantation systems, where
crops were grown between rows of trees during early ages of plantation, and wild fire and
landslides were the main causes of disturbance causing forest fragmentation in KBR. The
causes of fragmentation for each of the 25 fragments, and the occurrence and relative frequency
of disturbance related to these 25 fragments in KBR were studied in detail pertaining to the period
1999-2008. Data on the intensity and extent of disturbance within each forest fragment were
based on site inspection and information obtained from the interviews of the local people.
Interviews from the local residents, cattle herders, and people living in the buffer zone generated
extremely useful information and strengthened the ground truth data gathered from the field
study.
All the disturbance factors were identified in the field and were given ‘-’ score if that
particular disturbance factor (e.g. NTFP collection) was absent in a given year from all the 25
fragments and ‘+’ score if the factor was present during that particular year in any of the 25
fragments. The total score for a particular causative factor over the period 1999-2008 was thus
calculated. Depending on the total presence/absence score of a particular causative factor across
the ten years period, frequency of occurrence of a particular disturbance causing factor was
obtained by dividing the score with the total number of disturbance causing factors i.e. 12. The
relative frequency of a causative factor thus obtained was finally expressed in percentage.
Categorisation of intensity of disturbance as ‘high’ ‘low’ and ‘medium’ was done based
on the impacts of 12 factors of disturbance on fragments during the survey. Numbers of
disturbance factors affecting each fragment were also noted in order to differentiate the severity
of disturbance in different fragments.

93
5.3 Results
Fragment spatial variables
The size of 25 fragments located for detailed ground level studies ranged between 0.1 and 72.2
ha. The mean size of these 25 fragments was 9.3 ± 0.5 ha (SE). Values of isolation index ranged
from 0.01 to 8.1 and the mean value being 0.51 ± 0.3 (SE) (Table 5.3).
Table 5.3. Spatial variables for the 25 fragments in KBR.
Fragment number
Fragment size (area in km2)
Isolation index
FF1 0.02 0.2 FF2 0.03 0.5 FF3 0.04 0.8 FF4 0.05 1.2 FF5 0.06 1.5 FF6 0.07 1.8 FF7 0.08 2.2 FF8 0.09 2.5 FF9 0.10 2.8 FF10 0.11 3.2 FF11 0.12 3.5 FF12 0.13 3.8 FF13 0.14 4.2 FF14 0.15 4.5 FF15 0.16 4.8 FF16 0.17 5.2 FF17 0.18 5.5 FF18 0.19 5.8 FF19 0.20 6.2 FF20 0.21 6.5 FF21 0.22 6.8 FF22 0.23 7.2 FF23 0.24 7.5 FF24 0.72 7.8 FF25 0.72 8.2
Decadal land use changes during 1999-2008
Land use/land cover maps for 1999, 2002 and 2008 of KBR clearly differentiated various land
use/cover types. Across the years, major portion of land use was dominated by dense forests
(Figure 5.2). Lower montane and Montane forests in KBR were distinguishable.

94
Figure 5.2. Temporal changes in land use and land cover in KBR during 1999-2008.
(Figure 5.3). Areas under dense forests, lakes (water bodies), and snow cover remained
more or less same and did not show any remarkable changes during the study period.
Barren land, devoid of any vegetation covers and characterised by stony rocky-lands
increased during the study period by 5% (132.6 km2). The open forest areas also
increased by 92.6 km2 during the study period. Contrastingly, glacier beds and meadows
that covered 832 km2 in 1999, decreased to 603.3 km2 in 2008 (Table 5.4 and Figure 5.2).
Table 5.4. Land use changes in KBR during 1999 – 2008.
Area (km2) Net change (km2) Land use classes 1999 2002 2008 1999-2002 2002-2008 Barren land 600.6 608.4 475.8 -7.8 132.6 Snow 254.8 254.8 228.8 0 26 Meadow 309.4 299 345.8 10.4 -46.8 Open forests 241.8 234 137.8 7.8 96.2 Dense forests 873.6 894.4 886.6 -20.8 7.8 Glacier beds 312 304.2 486.2 7.8 -182 Water bodies 2.6 2.6 36.4 0 -33.8
Forest fragmentation dynamics during 1999-2008
Forest fragmentation pattern during the ten years of study revealed that there was an
increase in number of smaller fragments (Figure 5.4). The number of fragments in 1999
was 875, which reduced to 533 in 2002. However, in 2008, it increased to 615. The
number of forest fragments < 1 ha during 1999 was 515 (112 ha), which decreased to 295
(86.3 ha) in 2002 but again increased in 2008 to 341 (108.5 ha) fragments. Forest

95
fragments in 1-50 ha size class were also more in 1999 with 350 fragments covering an area
of 2420.9 ha; while in 2002, it was 231 fragments, covering an area of 1668.7 ha. It increased to
267 fragments with 1764 ha of area by 2008. Forest fragments larger than 50 ha size class were
only 10 (1368.6 ha) in 1999, which decreased to seven fragments each in 2002 and 2008, having
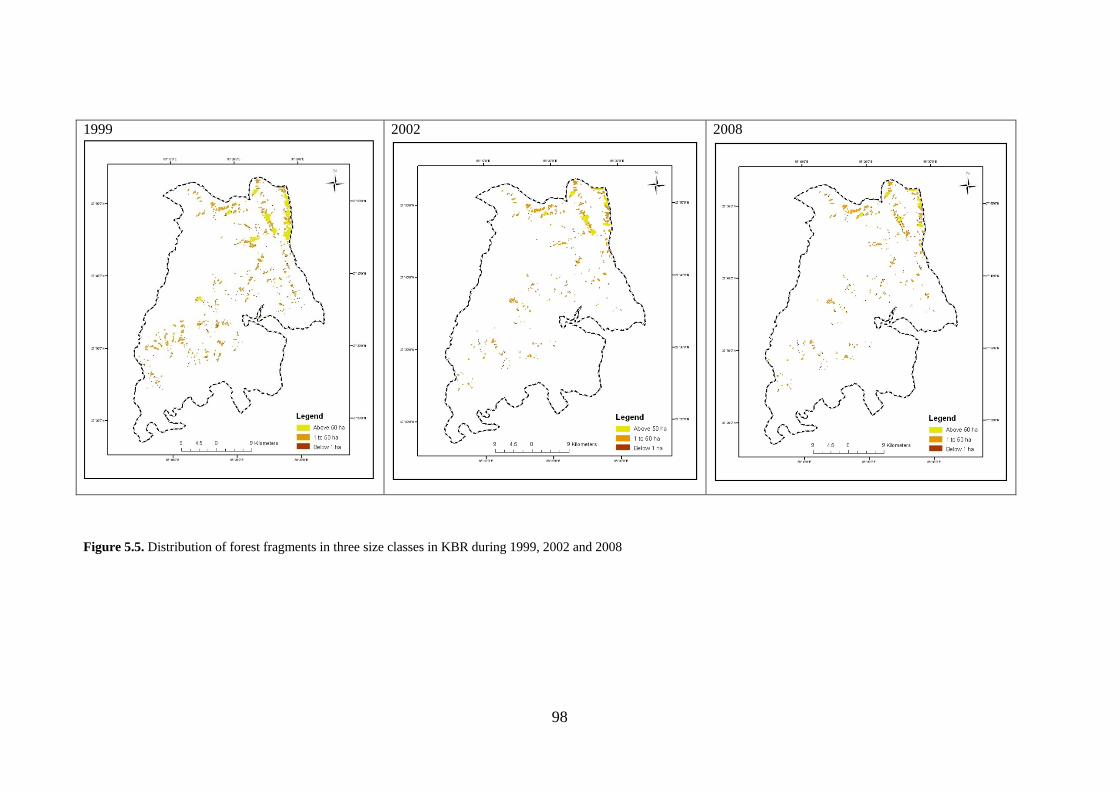
an area of 688.9 ha and 517.5 ha respectively (Figure 5.5). During 1999, 51.3% of the forest area
was in smaller fragments between 0-1 ha; 47.5% in medium size fragments and 1.1% in large
fragments. By 2008, the number of fragments under smaller patches decreased to 40.8%, while,
the medium size fragments increased to 58% and larger fragments remain stable. During the
whole study period, the average annual fragmentation rate was 0.7 ha year−1, equivalent to
0.007%. The mean fragment size decreased from 4.4 ha in 1999 to 3.9 ha in 2008 (Table 5.5).
This decline in mean patch size was associated with decrease in patch density and a substantial
reduction in the size of the large forest fragments during the study period.
Table 5.5. Fragment dynamics in KBR during 1999-2008.
Fragment size (ha) No. of fragments(Area in ha) Mean fragment size (ha)
Fragment density (No. of fragments/100 ha)
1999 2002 2008 1999 2002 2008 1999 2002 2008
<1 515(112) 295 (86.3) 341(108.5) 0.2 0.4 0.4 0.173 0.088 0.097
1-50 350(2420.9) 231(1668.7) 267(1764) 5.8 5.5 5.0 0.160 0.114 0.137
>50 10(1368.6) 7(688.9) 7(517.5) 136.9 98.4 73.9 0.004 0.003 0.003
Total 875(3901.6) 533(2443.9) 615(2390) 4.4 4.5 3.9 0.337 0.205 0.237

96
1
2
3
Figure 5.3. FCC depicting the land use/landcover status of the KBR during 1999 (1), 2002 (2) and 2008 (3).

97
Figure 5.4. Pattern of forest fragmentation in KBR.
98
1999 2002 2008
Figure 5.5. Distribution of forest fragments in three size classes in KBR during 1999, 2002 and 2008
99
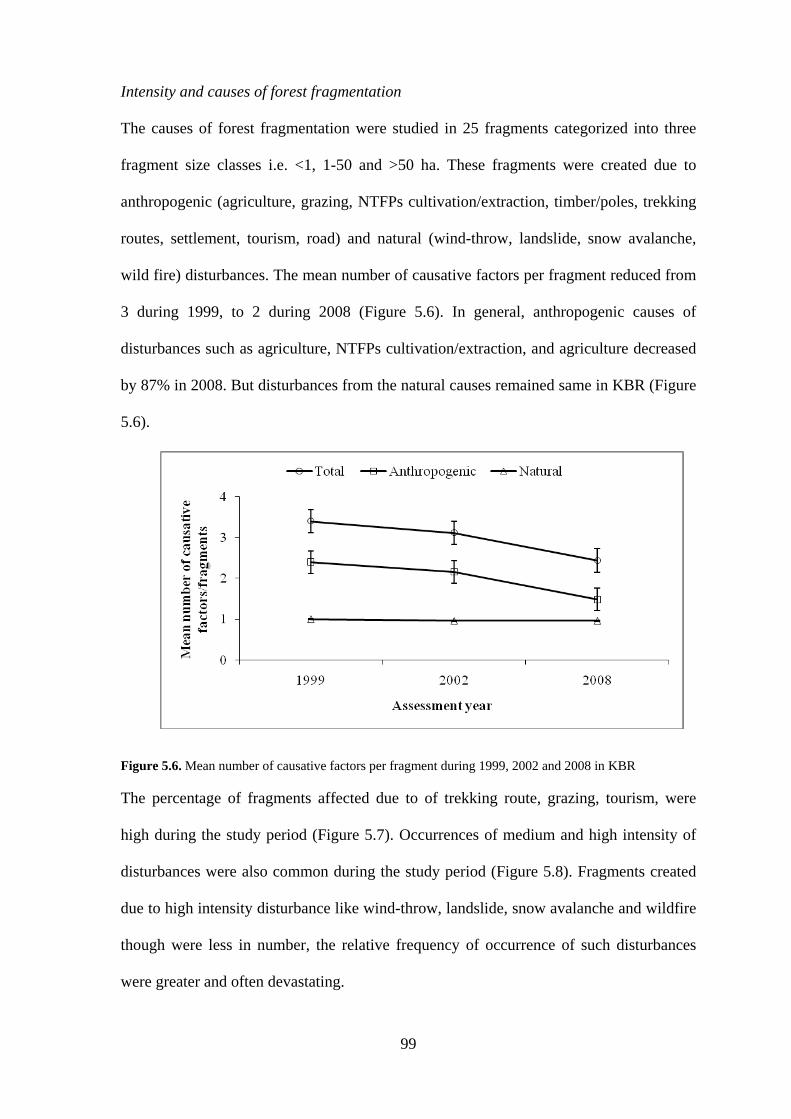
Intensity and causes of forest fragmentation
The causes of forest fragmentation were studied in 25 fragments categorized into three
fragment size classes i.e. <1, 1-50 and >50 ha. These fragments were created due to
anthropogenic (agriculture, grazing, NTFPs cultivation/extraction, timber/poles, trekking
routes, settlement, tourism, road) and natural (wind-throw, landslide, snow avalanche,
wild fire) disturbances. The mean number of causative factors per fragment reduced from
3 during 1999, to 2 during 2008 (Figure 5.6). In general, anthropogenic causes of
disturbances such as agriculture, NTFPs cultivation/extraction, and agriculture decreased
by 87% in 2008. But disturbances from the natural causes remained same in KBR (Figure
5.6).
Figure 5.6. Mean number of causative factors per fragment during 1999, 2002 and 2008 in KBR
The percentage of fragments affected due to of trekking route, grazing, tourism, were
high during the study period (Figure 5.7). Occurrences of medium and high intensity of
disturbances were also common during the study period (Figure 5.8). Fragments created
due to high intensity disturbance like wind-throw, landslide, snow avalanche and wildfire
though were less in number, the relative frequency of occurrence of such disturbances
were greater and often devastating.

100
Figure 5.7. Percentage of fragments affected by various causative factors.
Figure 5.8. Relative frequency of occurrence of various causative factors of disturbance and their intensity
in 25 fragments of KBR during 1999-2008. 5.4 Discussion
The results of the study on temporal change in forest fragmentation pattern in KBR
helped in detecting the type of change, location of change, and quantifying the changes
taking place in KBR. Land cover changes over the study period show conversion of forest
category into other classes thereby fragmenting the natural forest cover. Results from the
imageries confirm decrease in meadow and open forest areas during the study period,
101
which might be attributed to extensive grazing by cattle and human disturbances
especially in the high elevational belt forest in the past. The decrease in glacier beds on
other hand might be related to global climate change phenomena.
Forest fragmentation did not occur as continuous process. The pattern and degree
of fragmentation were functions of topology, climatic condition and production activities.
In the present study, the forest fragmentation was more during 1999 than in the
subsequent time series. Analysis was successful in creating a temporal profile of forest
fragmentation for KBR. As evident from the imageries, there has been discontinuity in
the formation of forest fragments. On average, 674 (± 103.1) fragments were present in
the KBR during the study period and major portion of fragments were in the smallest size
classes (< 1 ha). The number of forest fragments during the last decade (1999 Landsat
imagery) was at its peak and declined towards 2008. Average annual fragmentation in the
KBR was 0.007%, which is comparatively less than others studies around the world.
Keles et al. (2008) in their study at Trabzon province reported higher annual rate of forest
fragmentation (0.41%), compared to the present finding in KBR. However, Li et al.
(2009) in their study in Alabama forest have shown that the rate of forest loss may go as
high as 2% annually.
In the higher size classes, fragments were negligible. Lesser number of fragments
in higher size classes will have significant effect on the response of some species in the
study area. Whereas, abundance of large number of forests fragments in lower size class
might be due to landslide, a universal phenomenon in the mountain ecosystem, and hilly
areas of Sikkim. There had been events of heavy mud avalanches in 1995, which affected
the whole state of Sikkim, which might have created the forest fragments. The prevalence
of poor soil conditions, and increasing poverty due to absence of alternative economic
options might have also contributed to forests fragmentation in the KBR.

102
The reduction in the number of forest fragments in KBR during the study period
might be due to: (i) complete disappearance of a certain number of forest fragments
converting them into continuous forest blanks, and (ii) merger of forest fragments with
main continuous forests through regeneration, especially in the montane and upper
montane forest matrix (Figure 5.9).
Figure 5.9. Regeneration of Silver fir (Abies densa) following disturbance due to fire in KBR.
The former factor contributed more to the reduction of forest fragments in KBR.
In effect, smaller fragments are bound to disappear faster than medium or large patches.
On the positive side therefore, it is noteworthy that the proportion of medium fragments
are higher than smaller fragments. This opens up prospects for reclaiming back forest
fragments into the main forests.
The increase in fragmentation is related either to natural or anthropogenic sources
(Wade et al. 2003; Geist & Lambin 2001). The forest fragmented by anthropogenic
factors is at higher risk of further fragmentation or removal than forest fragmented by
natural causes. Identifying only human-cause of forest fragmentation may be a useful tool
for policy and decision makers, allowing for improved risk assessments and better
targeting of areas for protection or remediation.

103
Ranking of disturbance parameters according to its visually observed intensity
although seems arbitrary, it does characterize various disturbances that took place during
the study period. At the forest scale, pattern of disturbance may be strongly influenced by
topography, pre-existence of matured forests, time since past disturbance and location in
the study sites. But fragmentation due to chronic age old and low intensity disturbances
like illegal transboundary grazing and trekking routes have substantially contributed to
the creation of forest fragments in KBR.
Cayuela et al. (2006) examined the clearance and fragmentation of tropical
montane forests in the Highlands of Chiapas, Mexico using Landsat imagery from 1975,
1990 and 2000 and observed an increasing rate of fragmentation over this region.
Echeverria et al. (2006) focused on the rapid deforestation and fragmentation of Chilean
temperate forests and they also reported an increasing fragmentation over 25 years (1975,
1990 and 2000). In the current analysis, forest fragmentation was greater in 1999. The
study revealed a decelerated rate of forest fragmentation in KBR over the time period
1999-2008. As far as forest cover is concerned, the level of disturbance was not so severe
and therefore no remarkable change in the dense forest area was observed during the
study period. The decreasing trend in disturbance level and fragment formation with time
in KBR might be attributed to strict rules and regulations enforced by state forest
department on forest grazing, imparting awareness and knowledge on forestry to local
people living in the fringe areas of KBR and also protection measures taken by some
local bodies, NGOs (KCC, Himal Rakshak, etc) to safeguard the ecosystems of KBR.
The relationship between forest fragmentation and forest disturbances is important
to facilitate future forest landscape management and monitoring actions. The present
work has provided useful information to local land use/KBR managers for developing
ecologically sustainable forest management strategies and biodiversity conservation
practices.