Chapter 5: Monitoring and Evalua- tion - World...
15
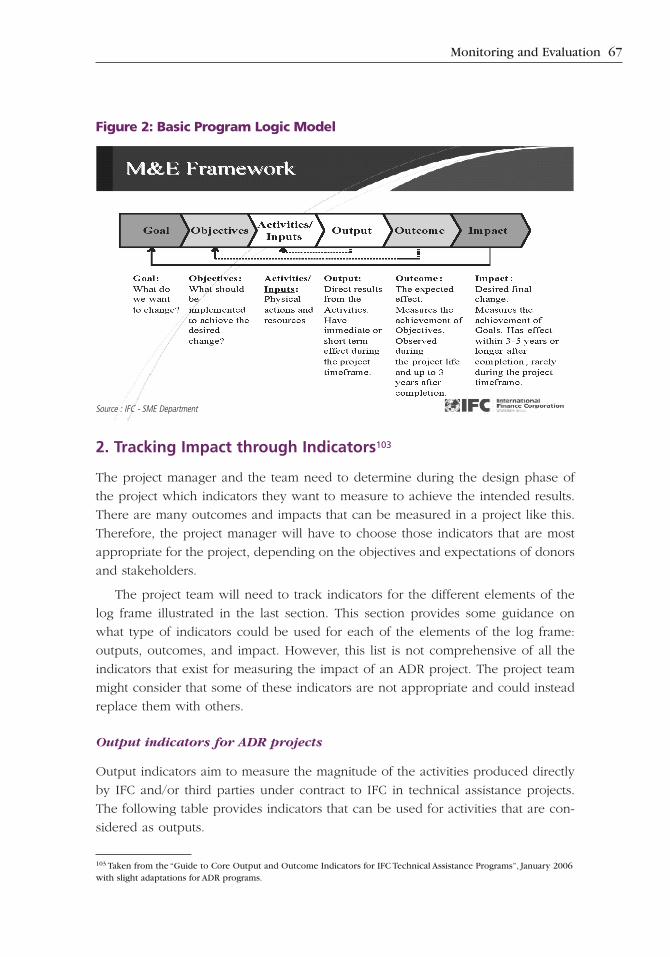
Chapter 5: Monitoring and Evalua- tion 1. What to Measure? It is essential for the success of any ADR program to set performance targets and to measure them. The project manager will need to make sure that performance is measured from the very inception of the project to make sure that performance tar- gets are met after the implementation. The monitoring of the project and the per- formance will serve as a reporting tool to the implementing institution, donors, the government, and main stakeholders that will give recognition to the work and to the reform. Unless there are tangible results to show, there will be no recognition to the project, no matter how much work the project manager and his/her team have done. This is why monitoring the impact is certainly the most important part of the project. The IFC has developed a monitoring and evaluation methodology that is some- what standard for all technical assistance projects. 102 There are obviously differ- ences in the indicators that are used for each type of project, but the methodology to collect results is standard. Indicators are derived from program logic models. These models describe the sequences of cause and effect relationships that link IFC program activities to intended impacts. Each model has five basic components as illustrated in Figure 2. Inputs refer to the resources used in program activities. Activities are the actions taken or work performed in particular projects using specified inputs. IFC technical assistance projects include activities such as assessments, advisory services, training, and public awareness campaigns. These activities are intended to result in outputs such as reports, advice, training events, and media coverage. In turn, these outputs are expected to yield certain outcomes in terms of changes in knowledge, behav- ior, and performance among beneficiaries in the target population. Finally, it is anticipated that programs will generate development impacts including higher pro- ductivity, greater income, and economic growth. 102 See “Guide to Core Output and Outcome Indicators for IFC Technical Assistance Programs”, January 2006.
Transcript of Chapter 5: Monitoring and Evalua- tion - World...

Chapter 5: Monitoring and Evalua-tion 1. What to Measure?
It is essential for the success of any ADR program to set performance targets and to
measure them. The project manager will need to make sure that performance is
measured from the very inception of the project to make sure that performance tar-
gets are met after the implementation. The monitoring of the project and the per-
formance will serve as a reporting tool to the implementing institution, donors, the
government, and main stakeholders that will give recognition to the work and to
the reform. Unless there are tangible results to show, there will be no recognition
to the project, no matter how much work the project manager and his/her team
have done. This is why monitoring the impact is certainly the most important part
of the project.
The IFC has developed a monitoring and evaluation methodology that is some-
what standard for all technical assistance projects.102 There are obviously differ-
ences in the indicators that are used for each type of project, but the methodology
to collect results is standard. Indicators are derived from program logic models.
These models describe the sequences of cause and effect relationships that link IFC
program activities to intended impacts. Each model has five basic components as
illustrated in Figure 2.
Inputs refer to the resources used in program activities. Activities are the actions
taken or work performed in particular projects using specified inputs. IFC technical
assistance projects include activities such as assessments, advisory services, training,
and public awareness campaigns. These activities are intended to result in outputs
such as reports, advice, training events, and media coverage. In turn, these outputs
are expected to yield certain outcomes in terms of changes in knowledge, behav-
ior, and performance among beneficiaries in the target population. Finally, it is
anticipated that programs will generate development impacts including higher pro-
ductivity, greater income, and economic growth.
102 See “Guide to Core Output and Outcome Indicators for IFC Technical Assistance Programs”, January 2006.
Monitoring and Evaluation 67
2. Tracking Impact through Indicators103
The project manager and the team need to determine during the design phase of
the project which indicators they want to measure to achieve the intended results.
There are many outcomes and impacts that can be measured in a project like this.
Therefore, the project manager will have to choose those indicators that are most
appropriate for the project, depending on the objectives and expectations of donors
and stakeholders.
The project team will need to track indicators for the different elements of the
log frame illustrated in the last section. This section provides some guidance on
what type of indicators could be used for each of the elements of the log frame:
outputs, outcomes, and impact. However, this list is not comprehensive of all the
indicators that exist for measuring the impact of an ADR project. The project team
might consider that some of these indicators are not appropriate and could instead
replace them with others.
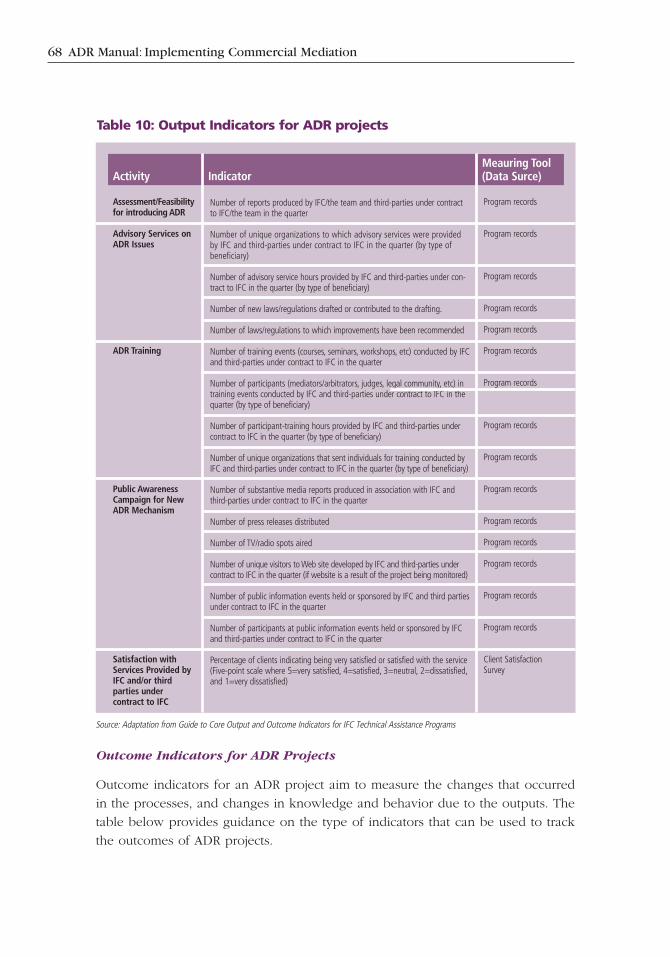
Output indicators for ADR projects
Output indicators aim to measure the magnitude of the activities produced directly
by IFC and/or third parties under contract to IFC in technical assistance projects.
The following table provides indicators that can be used for activities that are con-
sidered as outputs.
103 Taken from the “Guide to Core Output and Outcome Indicators for IFC Technical Assistance Programs”, January 2006with slight adaptations for ADR programs.
Source : IFC - SME Department
Figure 2: Basic Program Logic Model
68 ADR Manual: Implementing Commercial Mediation
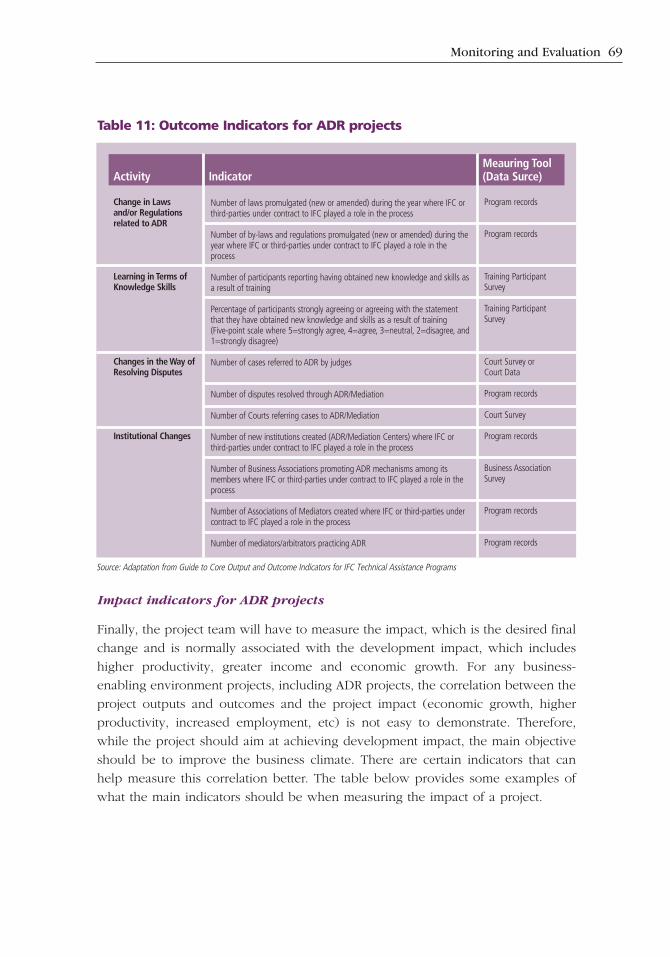
Outcome Indicators for ADR Projects
Outcome indicators for an ADR project aim to measure the changes that occurred
in the processes, and changes in knowledge and behavior due to the outputs. The
table below provides guidance on the type of indicators that can be used to track
the outcomes of ADR projects.
Table 10: Output Indicators for ADR projects
Activity Indicator
Assessment/Feasibilityfor introducing ADR
Advisory Services onADR Issues
ADR Training
Public AwarenessCampaign for NewADR Mechanism
Satisfaction withServices Provided byIFC and/or third parties under contract to IFC
Number of reports produced by IFC/the team and third-parties under contractto IFC/the team in the quarter
Number of unique organizations to which advisory services were providedby IFC and third-parties under contract to IFC in the quarter (by type of beneficiary)
Number of advisory service hours provided by IFC and third-parties under con-tract to IFC in the quarter (by type of beneficiary)
Number of new laws/regulations drafted or contributed to the drafting.
Number of laws/regulations to which improvements have been recommended
Number of training events (courses, seminars, workshops, etc) conducted by IFCand third-parties under contract to IFC in the quarter
Number of participants (mediators/arbitrators, judges, legal community, etc) intraining events conducted by IFC and third-parties under contract to IFC in thequarter (by type of beneficiary)
Number of participant-training hours provided by IFC and third-parties undercontract to IFC in the quarter (by type of beneficiary)
Number of unique organizations that sent individuals for training conducted byIFC and third-parties under contract to IFC in the quarter (by type of beneficiary)
Number of substantive media reports produced in association with IFC andthird-parties under contract to IFC in the quarter
Number of press releases distributed
Number of TV/radio spots aired
Number of unique visitors to Web site developed by IFC and third-parties undercontract to IFC in the quarter (if website is a result of the project being monitored)
Number of public information events held or sponsored by IFC and third partiesunder contract to IFC in the quarter
Number of participants at public information events held or sponsored by IFCand third-parties under contract to IFC in the quarter
Percentage of clients indicating being very satisfied or satisfied with the service(Five-point scale where 5=very satisfied, 4=satisfied, 3=neutral, 2=dissatisfied,and 1=very dissatisfied)
Program records
Program records
Program records
Program records
Program records
Program records
Program records
Program records
Program records
Program records
Program records
Program records
Program records
Program records
Program records
Client SatisfactionSurvey
Meauring Tool(Data Surce)
Source: Adaptation from Guide to Core Output and Outcome Indicators for IFC Technical Assistance Programs
Monitoring and Evaluation 69
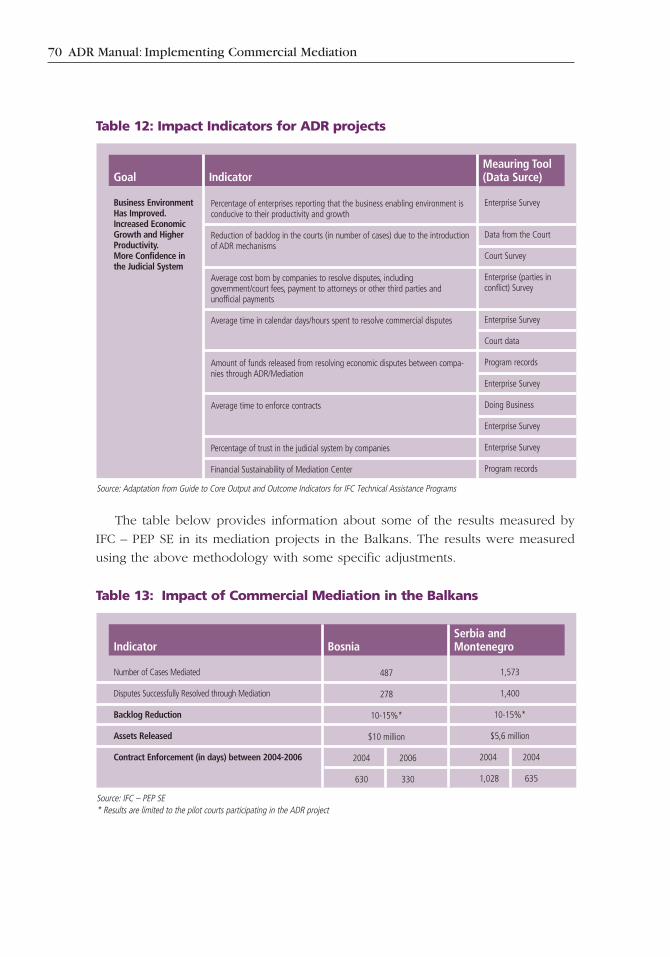
Impact indicators for ADR projects
Finally, the project team will have to measure the impact, which is the desired final
change and is normally associated with the development impact, which includes
higher productivity, greater income and economic growth. For any business-
enabling environment projects, including ADR projects, the correlation between the
project outputs and outcomes and the project impact (economic growth, higher
productivity, increased employment, etc) is not easy to demonstrate. Therefore,
while the project should aim at achieving development impact, the main objective
should be to improve the business climate. There are certain indicators that can
help measure this correlation better. The table below provides some examples of
what the main indicators should be when measuring the impact of a project.
Table 11: Outcome Indicators for ADR projects
Activity Indicator
Change in Lawsand/or Regulationsrelated to ADR
Learning in Terms ofKnowledge Skills
Changes in the Way ofResolving Disputes
Institutional Changes
Number of laws promulgated (new or amended) during the year where IFC orthird-parties under contract to IFC played a role in the process
Number of by-laws and regulations promulgated (new or amended) during theyear where IFC or third-parties under contract to IFC played a role in theprocess
Number of participants reporting having obtained new knowledge and skills asa result of training
Percentage of participants strongly agreeing or agreeing with the statementthat they have obtained new knowledge and skills as a result of training (Five-point scale where 5=strongly agree, 4=agree, 3=neutral, 2=disagree, and1=strongly disagree)
Number of cases referred to ADR by judges
Number of disputes resolved through ADR/Mediation
Number of Courts referring cases to ADR/Mediation
Number of new institutions created (ADR/Mediation Centers) where IFC orthird-parties under contract to IFC played a role in the process
Number of Business Associations promoting ADR mechanisms among its members where IFC or third-parties under contract to IFC played a role in theprocess
Number of Associations of Mediators created where IFC or third-parties undercontract to IFC played a role in the process
Number of mediators/arbitrators practicing ADR
Program records
Program records
Training ParticipantSurvey
Training ParticipantSurvey
Court Survey or Court Data
Program records
Court Survey
Program records
Business AssociationSurvey
Program records
Program records
Meauring Tool(Data Surce)
Source: Adaptation from Guide to Core Output and Outcome Indicators for IFC Technical Assistance Programs
70 ADR Manual: Implementing Commercial Mediation
The table below provides information about some of the results measured by
IFC – PEP SE in its mediation projects in the Balkans. The results were measured
using the above methodology with some specific adjustments.
Table 12: Impact Indicators for ADR projects
Goal Indicator
Business EnvironmentHas Improved.Increased EconomicGrowth and HigherProductivity.More Confidence inthe Judicial System
Percentage of enterprises reporting that the business enabling environment isconducive to their productivity and growth
Reduction of backlog in the courts (in number of cases) due to the introductionof ADR mechanisms
Average cost born by companies to resolve disputes, includinggovernment/court fees, payment to attorneys or other third parties and unofficial payments
Average time in calendar days/hours spent to resolve commercial disputes
Amount of funds released from resolving economic disputes between compa-nies through ADR/Mediation
Average time to enforce contracts
Percentage of trust in the judicial system by companies
Financial Sustainability of Mediation Center
Enterprise Survey
Data from the Court
Court Survey
Enterprise (parties inconflict) Survey
Enterprise Survey
Court data
Program records
Enterprise Survey
Doing Business
Enterprise Survey
Enterprise Survey
Program records
Meauring Tool(Data Surce)
Source: Adaptation from Guide to Core Output and Outcome Indicators for IFC Technical Assistance Programs
Table 13: Impact of Commercial Mediation in the Balkans
Indicator Bosnia
Number of Cases Mediated
Disputes Successfully Resolved through Mediation
Backlog Reduction
Assets Released
Contract Enforcement (in days) between 2004-2006
487
278
10-15%*
$10 million
2004 2006
630 330
1,573
1,400
10-15%*
$5,6 million
2004 2004
1,028 635
Serbia andMontenegro
Source: IFC – PEP SE* Results are limited to the pilot courts participating in the ADR project

Monitoring and Evaluation 71
3. When to Measure?
There are three specific points in time where a measurement of performance indi-
cators should be made throughout the ADR/mediation reform project. The first
stage is at the diagnosis phase when the assessment of ADR systems is being made.
The second measurement exercise should occur when results can or should be
expected (e.g. 6 months) following the implementation of project. This measure-
ment is intended to determine whether the reform introduced has actually resulted
in improvements. The third measurement serves an audit function and may occur
12 to 18 months following implementation of the project. This audit is intended to
ascertain whether there has been any deterioration in performance since the com-
pletion of the reform initiative.
During the Diagnosis or Design Phase, the project team will need to ensure that
performance is measured from the very inception of the initiative to guarantee that
performance targets are met. Without accurately recording data, the project team
will not be able to determine whether the introduction of ADR/mediation has met
its goals. To determine whether a reform process has been successful, it is neces-
sary to conduct an evaluation, essentially taking “before” and “after” snapshots of
performance. To do this, the diagnostic phase should include a benchmarking exer-
cise to capture performance indicators prior to the process design.
As mentioned previously, “faster and cheaper resolution of disputes,” “amount
of funds released,” “reduction of backlog,” and a “better business environment” are
obvious candidates for being the main indicators to measure, but there are no uni-
formly defined performance indicators for ADR. The previous table with the indi-
cators will help the project team in determining which indicators are more impor-
tant for the team to measure, depending on the objectives of the project.
Normally, the reform team should undertake baseline surveys in the design
phase to obtain statistics regarding these indicators. These baseline indicators will
be used then to compare results after the reform process.
Measurement of performance indicators is also important when the evaluation
process takes shape shortly after the reform process is completed. This evaluation
phase begins with a Post-Initiative Assessment Report, which examines and docu-
ments the initiative’s outcomes, whether the original objectives were met, and
how effective the management practices were in keeping the project on track. A
timely and comprehensive Post-Initiative Assessment Report will identify ongoing
issues to monitor, as well as provide some “lessons learned” to assist judges and
mediators in planning and managing future reform process or making simple
adjustments. Consideration should be given to using an objective third party to
prepare the report.
72 ADR Manual: Implementing Commercial Mediation
The preparation of this report should occur within an appropriate period of time
following the implementation of the reforms (e.g. six months). Again, in keeping
with extending acceptance of the initiative as broadly as possible, stakeholders
should be consulted as to their experience with the newly established dispute res-
olution system. Interviews and client surveys are two tools to consider when gaug-
ing views on the revised process.
In addition to formal reviews, the project team should observe the implementa-
tion of the initiative on a day-to-day basis to determine whether any fine-tuning of
the process may be required. Judges and mediators may notice that minor adjust-
ments are required in the performance of day-to-day operations. If, however, struc-
tural issues arise that were not anticipated in the planning stage, then a formal
review of the initiative should be conducted at the earliest possible time to address
and resolve the issues.
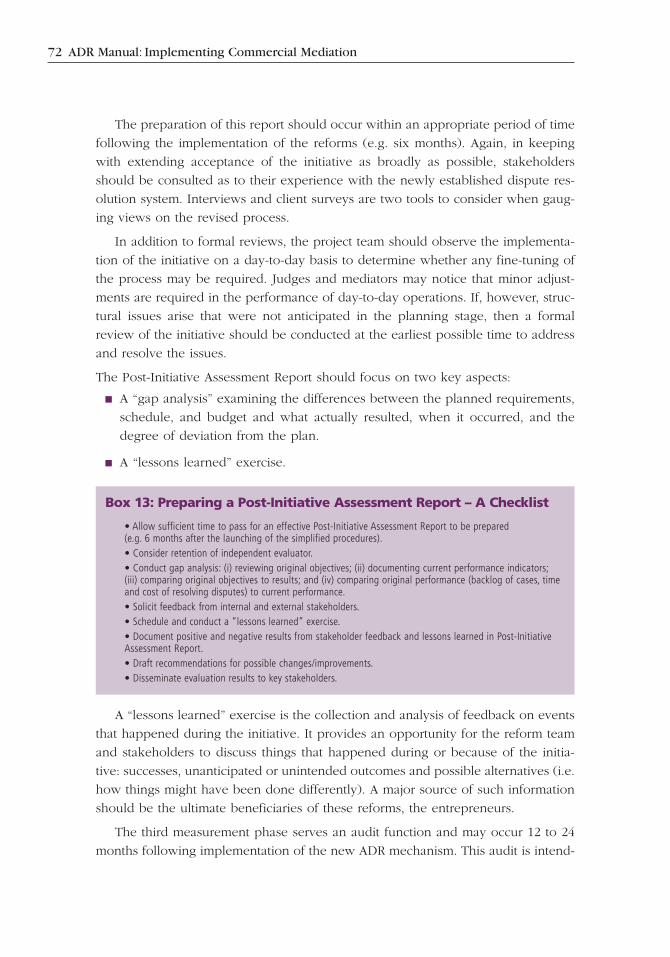
The Post-Initiative Assessment Report should focus on two key aspects:
n A “gap analysis” examining the differences between the planned requirements,
schedule, and budget and what actually resulted, when it occurred, and the
degree of deviation from the plan.
n A “lessons learned” exercise.
A “lessons learned” exercise is the collection and analysis of feedback on events
that happened during the initiative. It provides an opportunity for the reform team
and stakeholders to discuss things that happened during or because of the initia-
tive: successes, unanticipated or unintended outcomes and possible alternatives (i.e.
how things might have been done differently). A major source of such information
should be the ultimate beneficiaries of these reforms, the entrepreneurs.
The third measurement phase serves an audit function and may occur 12 to 24
months following implementation of the new ADR mechanism. This audit is intend-
Box 13: Preparing a Post-Initiative Assessment Report – A Checklist
• Allow sufficient time to pass for an effective Post-Initiative Assessment Report to be prepared (e.g. 6 months after the launching of the simplified procedures).• Consider retention of independent evaluator.• Conduct gap analysis: (i) reviewing original objectives; (ii) documenting current performance indicators;(iii) comparing original objectives to results; and (iv) comparing original performance (backlog of cases, timeand cost of resolving disputes) to current performance.• Solicit feedback from internal and external stakeholders.• Schedule and conduct a “lessons learned” exercise.• Document positive and negative results from stakeholder feedback and lessons learned in Post-InitiativeAssessment Report.• Draft recommendations for possible changes/improvements.• Disseminate evaluation results to key stakeholders.
Monitoring and Evaluation 73
ed to ascertain whether there has been any deterioration in performance since the
completion of the reform initiative. Obviously the indicators used in the design
phase will be compared with what the indicators show 1 or 2 years after the reform
was completed. This evaluation should be undertaken every year as a form of keep-
ing track of the impact of reform over time.
4. How to Measure? Monitoring Tools and Data Collection104
Successful measurement depends on the quality of data collected through program
records, surveys, and secondary sources. Data should be collected in a consistent
manner using agreed definitions and procedures, and stored in appropriate com-
puter databases to facilitate data access, analysis and reporting.
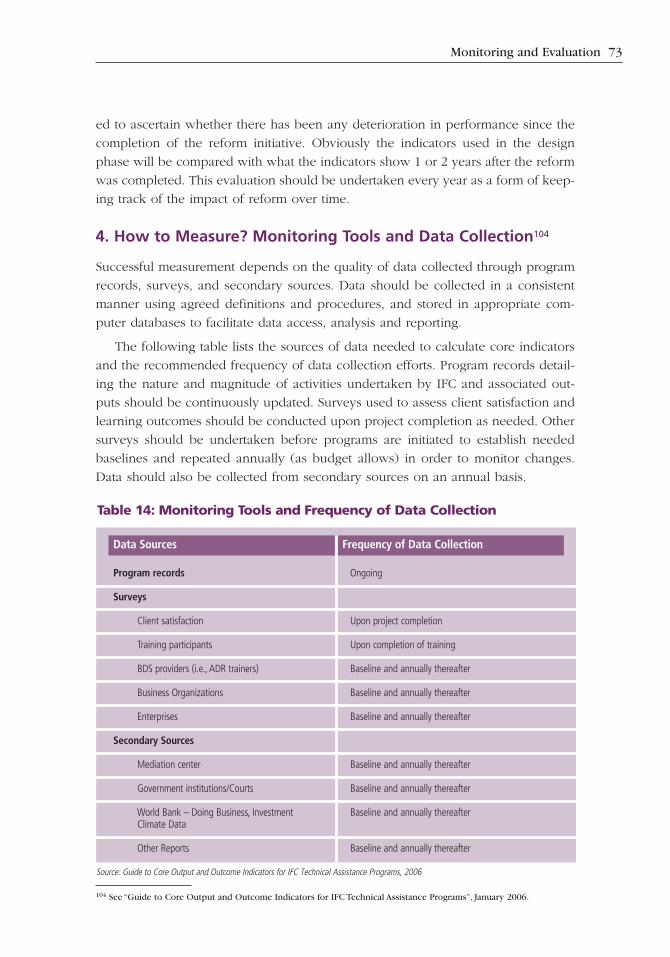
The following table lists the sources of data needed to calculate core indicators
and the recommended frequency of data collection efforts. Program records detail-
ing the nature and magnitude of activities undertaken by IFC and associated out-
puts should be continuously updated. Surveys used to assess client satisfaction and
learning outcomes should be conducted upon project completion as needed. Other
surveys should be undertaken before programs are initiated to establish needed
baselines and repeated annually (as budget allows) in order to monitor changes.
Data should also be collected from secondary sources on an annual basis.
104 See “Guide to Core Output and Outcome Indicators for IFC Technical Assistance Programs”, January 2006.
Table 14: Monitoring Tools and Frequency of Data Collection
Data Sources Frequency of Data Collection
Program records
Surveys
Client satisfaction
Training participants
BDS providers (i.e., ADR trainers)
Business Organizations
Enterprises
Secondary Sources
Mediation center
Government institutions/Courts
World Bank – Doing Business, Investment Climate Data
Other Reports
Ongoing
Upon project completion
Upon completion of training
Baseline and annually thereafter
Baseline and annually thereafter
Baseline and annually thereafter
Baseline and annually thereafter
Baseline and annually thereafter
Baseline and annually thereafter
Baseline and annually thereafter
Source: Guide to Core Output and Outcome Indicators for IFC Technical Assistance Programs, 2006
74 ADR Manual: Implementing Commercial Mediation
Program records. The project teams should maintain complete and accurate
records. This should include data on the characteristics of organizations receiving
technical assistance from IFC or third parties under contract to the IFC, including
intermediaries and private enterprises. It should also include data on particular proj-
ects, including the type of activity (assessment, advisory services, training and infor-
mation dissemination), participants, service providers, date of initiation and comple-
tion, and budget expenditures.
Surveys. As noted above, the project teams will need to conduct a variety of sur-
veys to collect requisite data. To ensure the quality of data, the following proce-
dures are recommended:
n Questionnaires. Project managers should use instruments that contain questions
needed to obtain data required for relevant indicators. Questions should be
worded in the same manner with any translations checked to ensure that mean-
ings have not been altered inadvertently. (This will require the development of
standard survey instruments.)
n Sampling. The goal is to have a sample that is representative of the population
and therefore can be used to make valid generalizations. Unless a census is
appropriate, project managers should survey a random sample of organizations
drawn from the appropriate set of program participants or the target population
as a whole. A random sample is where each entity in the sample frame has a
known and independent probability of being selected for the sample. The size
of the sample should be large enough to provide sufficient statistical power.
Although there are no formal standards for statistical power, project teams
should aim to draw a sample that would provide a power of 0.8 or greater.
n Administration. Given the nature of the information sought, most surveys
should be administered in person (as opposed to mail or telephone) with a
strict promise to protect the confidentiality of the respondents and their
responses. Field personnel should be trained to conduct the surveys. All survey
should seek to achieve a high response rate (at least 60 percent) to reduce
potential response bias. To help ensure a high response rate, the project team
should obtain the commitment of participants to respond to surveys as a con-
dition of program participation.
n Data entry. The team should establish specific procedures for dealing with com-
pleted surveys. This includes tracking responses so that individuals failing to
respond initially can be contacted and encouraged to complete the question-
naire. The quality of data entry should be verified by checking all or a sample
of questionnaires for accuracy and by carefully examining data for responses
that are not consistent. All questionable entries should be checked for problems
and verified. Original copies of written questionnaires should be kept on file.

Monitoring and Evaluation 75
n Survey schedule. March is generally a good time to administer surveys to busi-
nesses because it allows sufficient time for companies to close their books after
the end of the fiscal year. (Most fiscal years end December 31st.)
Secondary sources. Data required to calculate certain indicators will need to be
obtained from secondary sources such as government institutions, courts, and sur-
veys conducted by multilateral organizations (WB, International Monetary Fund)
and other donor organizations. The project team will need to work with these
organizations to ensure that data are accurate and provided in a consistent manner.
Chapter 6: Key Challenges andLessons Learned1. Critical Challenges in the Implementation of a Mediation Project
1. Creating demand (awareness of demand) and attracting quality cases
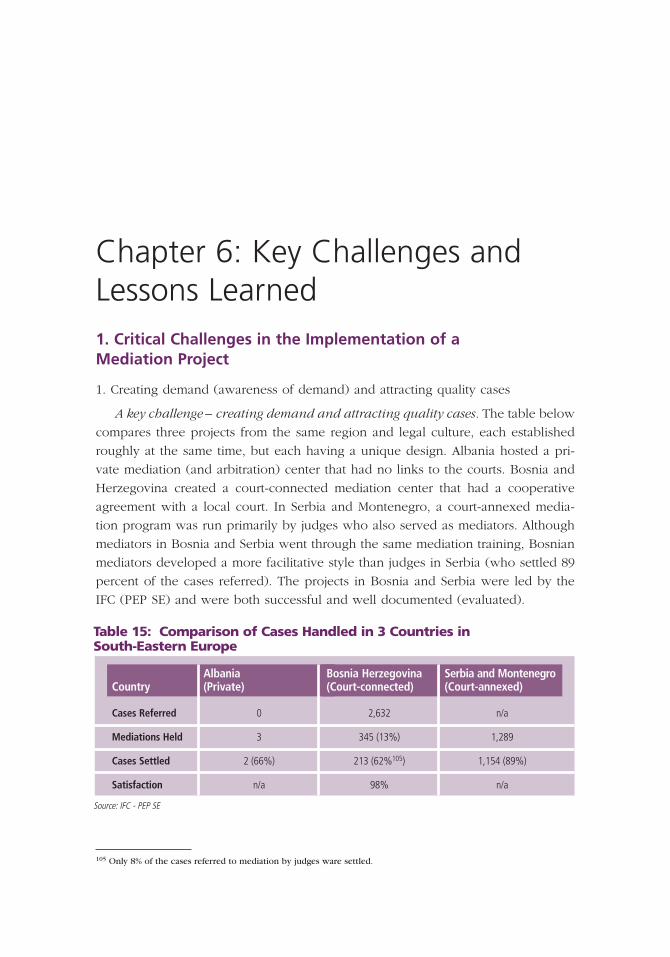
A key challenge – creating demand and attracting quality cases. The table below
compares three projects from the same region and legal culture, each established
roughly at the same time, but each having a unique design. Albania hosted a pri-
vate mediation (and arbitration) center that had no links to the courts. Bosnia and
Herzegovina created a court-connected mediation center that had a cooperative
agreement with a local court. In Serbia and Montenegro, a court-annexed media-
tion program was run primarily by judges who also served as mediators. Although
mediators in Bosnia and Serbia went through the same mediation training, Bosnian
mediators developed a more facilitative style than judges in Serbia (who settled 89
percent of the cases referred). The projects in Bosnia and Serbia were led by the
IFC (PEP SE) and were both successful and well documented (evaluated).
Table 15: Comparison of Cases Handled in 3 Countries in South-Eastern Europe
CountryAlbania(Private)
Cases Referred
Mediations Held
Cases Settled
Satisfaction
0
3
2 (66%)
n/a
2,632
345 (13%)
213 (62%105)
98%
n/a
1,289
1,154 (89%)
n/a
Bosnia Herzegovina(Court-connected)
Serbia and Montenegro(Court-annexed)
Source: IFC - PEP SE
105 Only 8% of the cases referred to mediation by judges ware settled.
Key Challenges and Lessons Learned 77
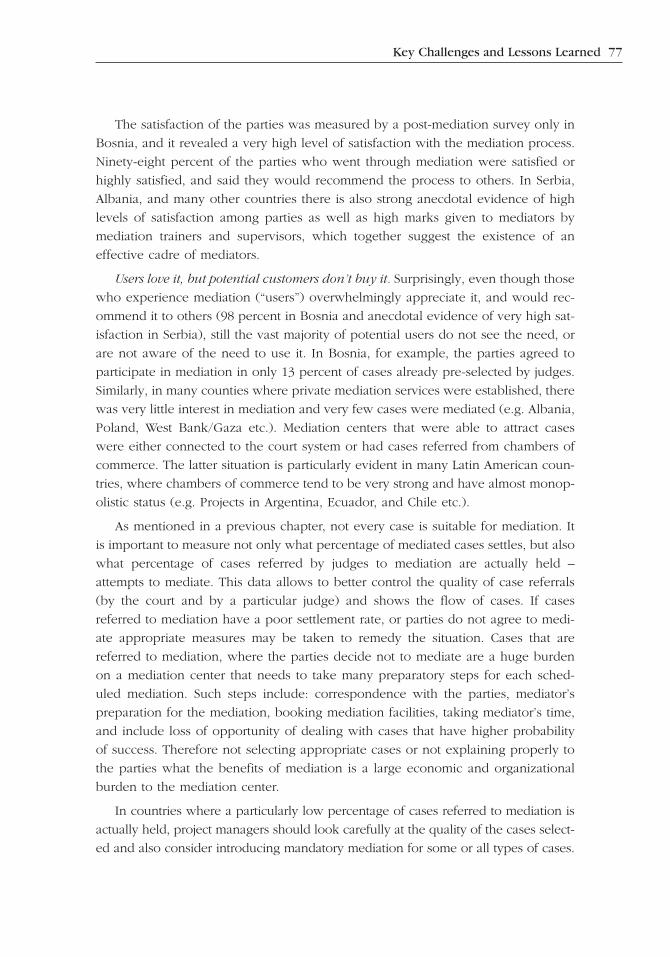
The satisfaction of the parties was measured by a post-mediation survey only in
Bosnia, and it revealed a very high level of satisfaction with the mediation process.
Ninety-eight percent of the parties who went through mediation were satisfied or
highly satisfied, and said they would recommend the process to others. In Serbia,
Albania, and many other countries there is also strong anecdotal evidence of high
levels of satisfaction among parties as well as high marks given to mediators by
mediation trainers and supervisors, which together suggest the existence of an
effective cadre of mediators.
Users love it, but potential customers don’t buy it. Surprisingly, even though those
who experience mediation (“users”) overwhelmingly appreciate it, and would rec-
ommend it to others (98 percent in Bosnia and anecdotal evidence of very high sat-
isfaction in Serbia), still the vast majority of potential users do not see the need, or
are not aware of the need to use it. In Bosnia, for example, the parties agreed to
participate in mediation in only 13 percent of cases already pre-selected by judges.
Similarly, in many counties where private mediation services were established, there
was very little interest in mediation and very few cases were mediated (e.g. Albania,
Poland, West Bank/Gaza etc.). Mediation centers that were able to attract cases
were either connected to the court system or had cases referred from chambers of
commerce. The latter situation is particularly evident in many Latin American coun-
tries, where chambers of commerce tend to be very strong and have almost monop-
olistic status (e.g. Projects in Argentina, Ecuador, and Chile etc.).
As mentioned in a previous chapter, not every case is suitable for mediation. It
is important to measure not only what percentage of mediated cases settles, but also
what percentage of cases referred by judges to mediation are actually held –
attempts to mediate. This data allows to better control the quality of case referrals
(by the court and by a particular judge) and shows the flow of cases. If cases
referred to mediation have a poor settlement rate, or parties do not agree to medi-
ate appropriate measures may be taken to remedy the situation. Cases that are
referred to mediation, where the parties decide not to mediate are a huge burden
on a mediation center that needs to take many preparatory steps for each sched-
uled mediation. Such steps include: correspondence with the parties, mediator’s
preparation for the mediation, booking mediation facilities, taking mediator’s time,
and include loss of opportunity of dealing with cases that have higher probability
of success. Therefore not selecting appropriate cases or not explaining properly to
the parties what the benefits of mediation is a large economic and organizational
burden to the mediation center.
In countries where a particularly low percentage of cases referred to mediation is
actually held, project managers should look carefully at the quality of the cases select-
ed and also consider introducing mandatory mediation for some or all types of cases.
78 ADR Manual: Implementing Commercial Mediation
Generally, mediation projects achieve a high quality of (mediation) services sup-
plied. Mediators are well trained, centers work well, and the parties are generally
satisfied with the services provided. The biggest problem in most countries is the
demand, or rather low perceived demand for mediation services and low number
of quality cases to mediate. Thus, in designing and executing the project, more
attention and resources should be directed at creating greater incentives to partici-
pate in mediation, selecting appropriate cases, informing parties of potential bene-
fits and limited risks of mediation, and other approaches that might increase
demand for mediation.
2. Exit strategy and sustainability of the project
When designing the implementation of an ADR/mediation project, donors
should also consider what is going to be their exit strategy and the long-term sus-
tainability of the project. Improving the business-enabling environment in emerging
markets usually requires that the donor finances the first two or three years of the
reform project. Cost recovery in these types of project is usually a challenge, since
most governments are not able to co-finance the reform process. Therefore, it is
appropriate for the donor to finance the costs associated with the project at least
for the first two or three years.
However, the project should be designed bearing in mind that after a specific
period, the donor resources will decrease up to a point when there won’t be any
financial support for the project. Therefore, it is critical to design an exit strategy
and a plan for the financial sustainability of the project once the donor has exited
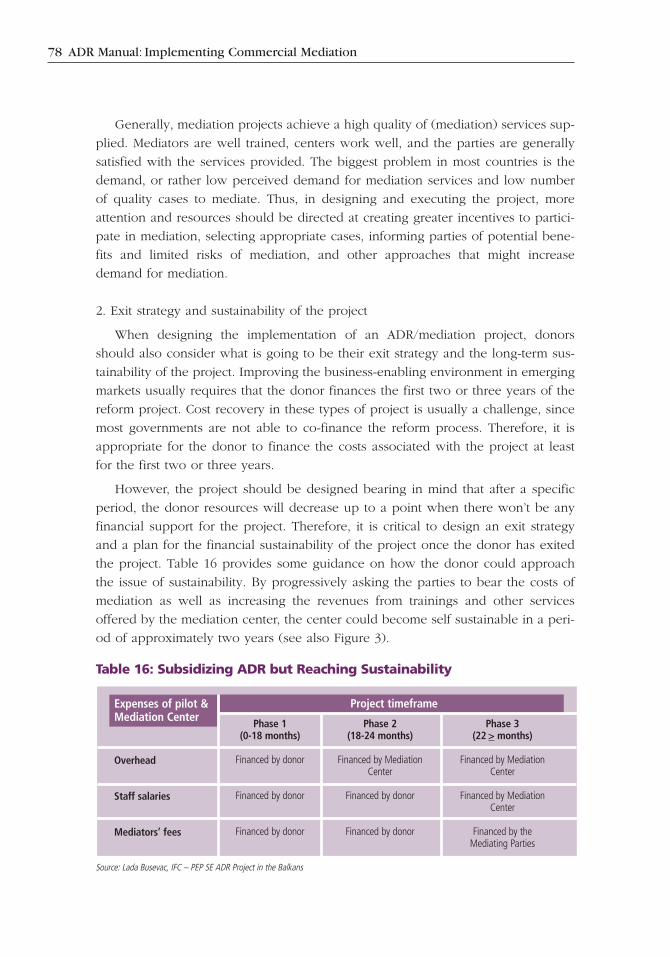
the project. Table 16 provides some guidance on how the donor could approach
the issue of sustainability. By progressively asking the parties to bear the costs of
mediation as well as increasing the revenues from trainings and other services
offered by the mediation center, the center could become self sustainable in a peri-
od of approximately two years (see also Figure 3).
Table 16: Subsidizing ADR but Reaching Sustainability
Expenses of pilot &Mediation Center
Project timeframe
Overhead
Staff salaries
Mediators’ fees
Phase 1 (0-18 months)
Financed by donor
Financed by donor
Financed by donor
Phase 2 (18-24 months)
Financed by MediationCenter
Financed by donor
Financed by donor
Phase 3 (22 > months)
Financed by MediationCenter
Financed by MediationCenter
Financed by the Mediating Parties
Source: Lada Busevac, IFC – PEP SE ADR Project in the Balkans

Key Challenges and Lessons Learned 79
As for the exit strategy that would build in the future sustainability of the proj-
ect, donors could establish certain parameters at the beginning of the project by:
n building awareness and creating demand through pilot initiatives,
n collecting subsidized fees throughout the entire pilot project life (the amount of
the fees will depend on the specific country), and
n gradually reducing financing and transferring financial responsibility to a com-
mitted local partner.
2. Key Lessons for Developing a Sustainable Mediation Program
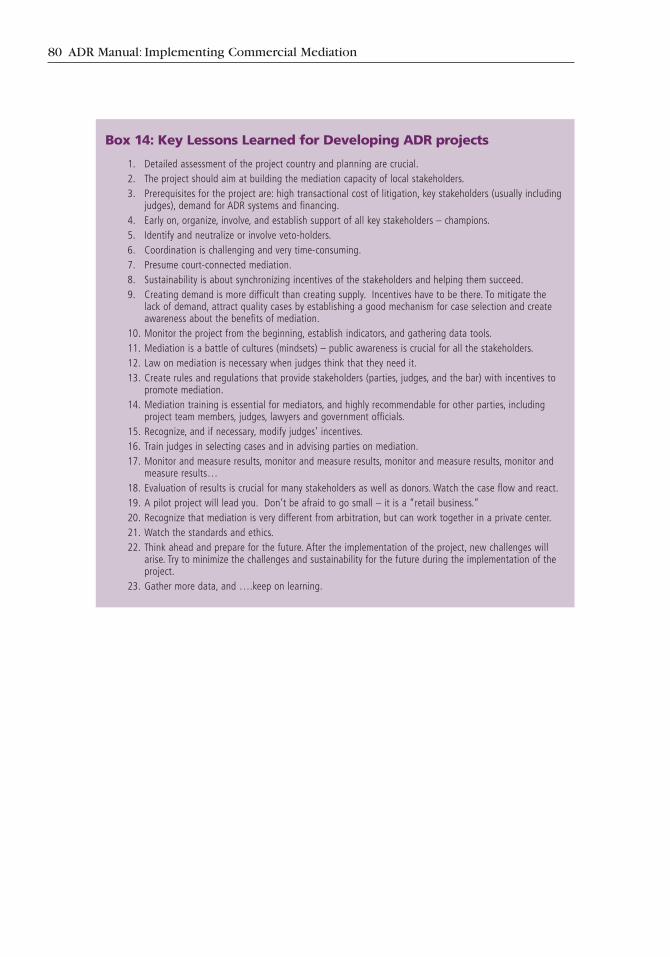
The following table provides a number of lessons drawn by ADR practitioners and
project managers, and could serve as a checklist of things that should be carefully
considered when introducing ADR systems in a given country.
Source: Lada Busevac, IFC PEP SE ADR Project in the Balkans
Figure 3: IFC's Sustainable ADR Model in the Balkans
80 ADR Manual: Implementing Commercial Mediation
Box 14: Key Lessons Learned for Developing ADR projects
1. Detailed assessment of the project country and planning are crucial.2. The project should aim at building the mediation capacity of local stakeholders.3. Prerequisites for the project are: high transactional cost of litigation, key stakeholders (usually including
judges), demand for ADR systems and financing.4. Early on, organize, involve, and establish support of all key stakeholders – champions.5. Identify and neutralize or involve veto-holders.6. Coordination is challenging and very time-consuming.7. Presume court-connected mediation.8. Sustainability is about synchronizing incentives of the stakeholders and helping them succeed.9. Creating demand is more difficult than creating supply. Incentives have to be there. To mitigate the
lack of demand, attract quality cases by establishing a good mechanism for case selection and createawareness about the benefits of mediation.
10. Monitor the project from the beginning, establish indicators, and gathering data tools.11. Mediation is a battle of cultures (mindsets) – public awareness is crucial for all the stakeholders.12. Law on mediation is necessary when judges think that they need it.13. Create rules and regulations that provide stakeholders (parties, judges, and the bar) with incentives to
promote mediation.14. Mediation training is essential for mediators, and highly recommendable for other parties, including
project team members, judges, lawyers and government officials.15. Recognize, and if necessary, modify judges’ incentives.16. Train judges in selecting cases and in advising parties on mediation.17. Monitor and measure results, monitor and measure results, monitor and measure results, monitor and
measure results… 18. Evaluation of results is crucial for many stakeholders as well as donors. Watch the case flow and react.19. A pilot project will lead you. Don’t be afraid to go small – it is a “retail business.”20. Recognize that mediation is very different from arbitration, but can work together in a private center.21. Watch the standards and ethics.22. Think ahead and prepare for the future. After the implementation of the project, new challenges will
arise. Try to minimize the challenges and sustainability for the future during the implementation of theproject.
23. Gather more data, and ….keep on learning.