CHAPTER 5 METHODS FOR THE ANALYSIS OF VALSARTAN...
43
140 CHAPTER 5 METHODS FOR THE ANALYSIS OF VALSARTAN 5.1 Introduction Angiotension II receptor blockers (ARBs) is a very potent chemical that causes muscle surroundings blood vessels to contract, thereby contraction of blood vessels. This contraction increases the pressure within the vessels and can cause high blood pressure (hypertension), ARBs are medications that block the action of angiotension II receptors on blood vessels, resulting in enlarge of blood vessels (dilate) and reduces blood pressure. Reduced blood pressure makes it easier for the heart to pump blood and can improve heart failure. These medicines also increase the release of water and salt (sodium) to the urine, which in turn lowers blood pressure as well. ARBs also act directly on the hormones that regulate sodium and water balance. ARBs can be used to treat coronary artery disease or heart failure. In some peoples who cannot tolerate angiotensin-converting-enzyme inhibitor (ACE) or who have kidney disease from diabetes. 5.2 Drug profile and Literature review Valsartan (VRT) Valsartan is a new potent, highly selective and orally active anti hypertensive drug belonging to the family of angiotension II type 1-receptor antagonists [1]. Valsartan has much greater affinity (about 20000 fold) for the angiotension II type 1 (AT1) receptor for the angiotension II type 2 (AT2) receptor, thereby relaxing blood vessels and causing them to widen, which lowers blood pressure and improves blood flow. Valsartan is rapidly absorbed after oral administration. Plasma levels peak 2-4 h after oral and then decline with a terminal half-life reported in various studies in the range of 6–9 h. Peak plasma concentration (Cmax) of 1.64 mg/L occurred after oral administration of a single 80 mg dose of valsartan. A higher dose (200 mg) produced a proportionately higher Cmax (3.46 mg/L) at a similar time post-dose.
Transcript of CHAPTER 5 METHODS FOR THE ANALYSIS OF VALSARTAN...

140
CHAPTER 5
METHODS FOR THE ANALYSIS OF VALSARTAN
5.1 Introduction
Angiotension II receptor blockers (ARBs) is a very potent chemical that causes
muscle surroundings blood vessels to contract, thereby contraction of blood vessels.
This contraction increases the pressure within the vessels and can cause high blood
pressure (hypertension), ARBs are medications that block the action of angiotension II
receptors on blood vessels, resulting in enlarge of blood vessels (dilate) and reduces
blood pressure. Reduced blood pressure makes it easier for the heart to pump blood
and can improve heart failure. These medicines also increase the release of water and
salt (sodium) to the urine, which in turn lowers blood pressure as well. ARBs also act
directly on the hormones that regulate sodium and water balance.
ARBs can be used to treat coronary artery disease or heart failure. In some
peoples who cannot tolerate angiotensin-converting-enzyme inhibitor (ACE) or who
have kidney disease from diabetes.
5.2 Drug profile and Literature review
Valsartan (VRT)
Valsartan is a new potent, highly selective and orally active anti hypertensive
drug belonging to the family of angiotension II type 1-receptor antagonists [1].
Valsartan has much greater affinity (about 20000 fold) for the angiotension II type 1
(AT1) receptor for the angiotension II type 2 (AT2) receptor, thereby relaxing blood
vessels and causing them to widen, which lowers blood pressure and improves blood
flow. Valsartan is rapidly absorbed after oral administration. Plasma levels peak 2-4 h
after oral and then decline with a terminal half-life reported in various studies in the
range of 6–9 h. Peak plasma concentration (Cmax) of 1.64 mg/L occurred after oral
administration of a single 80 mg dose of valsartan. A higher dose (200 mg) produced
a proportionately higher Cmax (3.46 mg/L) at a similar time post-dose.
141
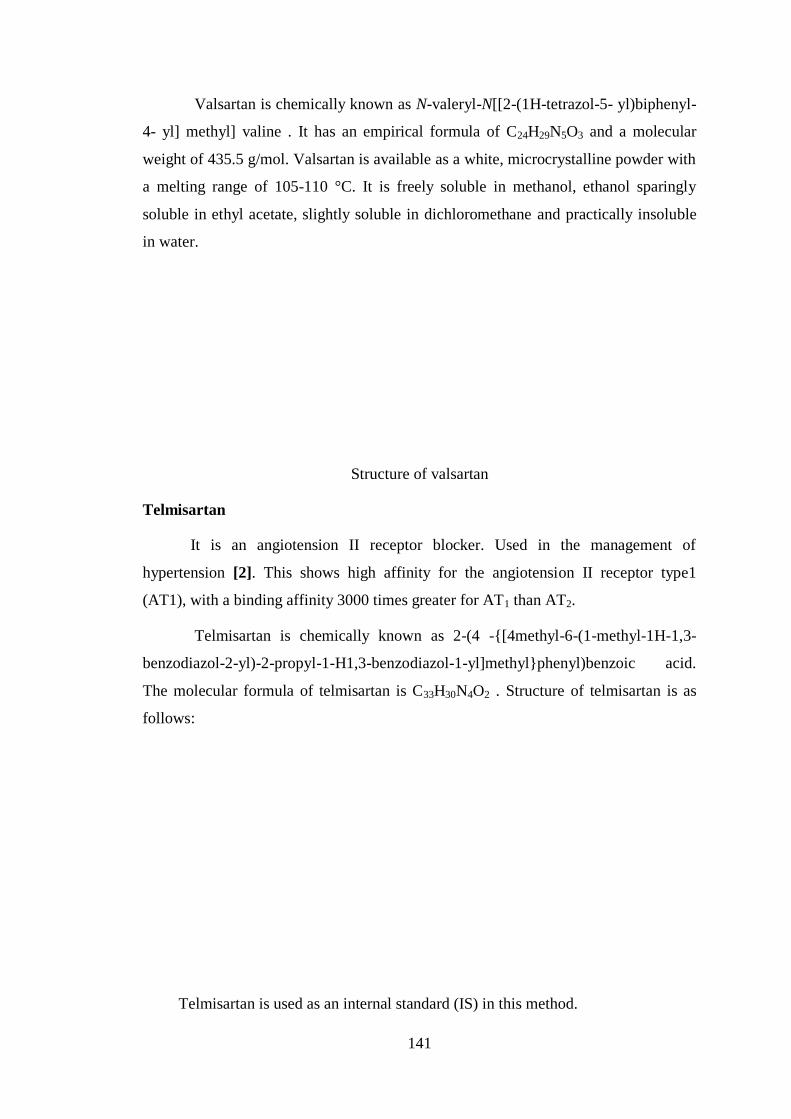
Valsartan is chemically known as N-valeryl-N[[2-(1H-tetrazol-5- yl)biphenyl-
4- yl] methyl] valine . It has an empirical formula of C24H29N5O3 and a molecular
weight of 435.5 g/mol. Valsartan is available as a white, microcrystalline powder with
a melting range of 105-110 °C. It is freely soluble in methanol, ethanol sparingly
soluble in ethyl acetate, slightly soluble in dichloromethane and practically insoluble
in water.
Structure of valsartan
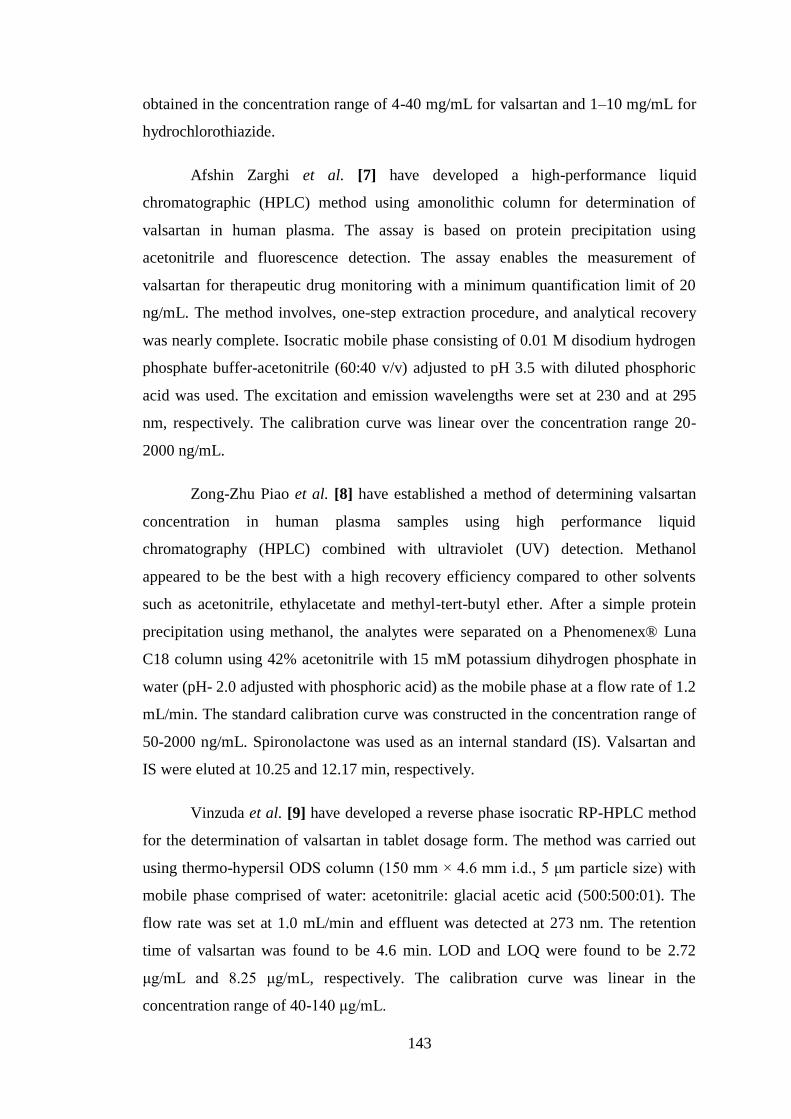
Telmisartan
It is an angiotension II receptor blocker. Used in the management of
hypertension [2]. This shows high affinity for the angiotension II receptor type1
(AT1), with a binding affinity 3000 times greater for AT1 than AT2.
Telmisartan is chemically known as 2-(4 -{[4methyl-6-(1-methyl-1H-1,3-
benzodiazol-2-yl)-2-propyl-1-H1,3-benzodiazol-1-yl]methyl}phenyl)benzoic acid.
The molecular formula of telmisartan is C33H30N4O2 . Structure of telmisartan is as
follows:
Telmisartan is used as an internal standard (IS) in this method.

142
Literature review
Chromatographic methods
Parambi et al. [3] have explained a HPLC method for the quantitation of
valsartan in tablet dosage form on a C18 column (250 x 4.6 mm) using a mobile phase
consisting of ammonium dihydrogen phosphate buffer: methanol (33.5:66.5) adjusted
to pH3 with formic acid at a flow rate of 1.0 mL/min and detection was performed at
265 nm. The retention time of valsartan was found to be at 11.9 min.
Chitlange et al. [4] have employed a RP-HPLC method for simultaneous
estimation of amlodipine besylate (AMLB) and valsartan (VAT) on RP C-18 column
(Kromasil, 250 x 4.6 mm) using acetonitrile: phosphate buffer (0.02M, pH 3.0),
(56:44 v/v) as mobile phase at a flow rate of 1.0 mL/min and the detection wavelength
was at 234 nm. The retention time for AMLB and VAT was found to be 3.07 and 6.20
min, respectively.
Prasad et al. [5] have developed stability indicating and validated RP-HPLC
method for the simultaneous estimation of valsartan (VAL) and amlodipine (AML) in
their combined dosage form. Water’s HPLC equipped with UV-visible and diode
array detectors, column used was XTerra® RP8, 5 μm, 100 mm × 4.6 mm i.d., at 30
°C. Mobile phase was consisting of 0.05M ammonium acetate and 0.5% TEA buffer
having pH 5.5 and in the ratio of 68:32 v/v at a flow rate of 1.0 mL/ min, and UV
detection was carried out at 238 nm and at 271 nm for AML and VAL, respectively.
VAL, AML and in their combined dosage form were exposed to thermal, photolytic,
oxidative and acid-base hydrolytic stress conditions; the stressed samples were
analyzed by the proposed method. The retention time of valsartan and amlodipine
were 1.98 and 4.03 min, respectively. The method was found linear over the range of
1-20 μg/mL for amlodipine and 1.6-240 μg/mL for valsartan.
Jothieswari et al. [6] have described a reverse phase high performance liquid
chromatographic method for the simultaneous estimation of valsartan and
hydrochlorothiazide in bulk and in pharmaceutical formulations using RP-C18
column. The mobile phase (acetonitrile: methanol: 50 mM phosphate buffer adjusted
to pH 3 with orthophosphoric acid) was pumped at a flow rate of 1.0 mL/ min in the
ratio of 20: 50: 30%v/v and the eluents were monitored at 250 nm. Linearity was
143
obtained in the concentration range of 4-40 mg/mL for valsartan and 1–10 mg/mL for
hydrochlorothiazide.
Afshin Zarghi et al. [7] have developed a high-performance liquid
chromatographic (HPLC) method using amonolithic column for determination of
valsartan in human plasma. The assay is based on protein precipitation using
acetonitrile and fluorescence detection. The assay enables the measurement of
valsartan for therapeutic drug monitoring with a minimum quantification limit of 20
ng/mL. The method involves, one-step extraction procedure, and analytical recovery
was nearly complete. Isocratic mobile phase consisting of 0.01 M disodium hydrogen
phosphate buffer-acetonitrile (60:40 v/v) adjusted to pH 3.5 with diluted phosphoric
acid was used. The excitation and emission wavelengths were set at 230 and at 295
nm, respectively. The calibration curve was linear over the concentration range 20-
2000 ng/mL.
Zong-Zhu Piao et al. [8] have established a method of determining valsartan
concentration in human plasma samples using high performance liquid
chromatography (HPLC) combined with ultraviolet (UV) detection. Methanol
appeared to be the best with a high recovery efficiency compared to other solvents
such as acetonitrile, ethylacetate and methyl-tert-butyl ether. After a simple protein
precipitation using methanol, the analytes were separated on a Phenomenex® Luna
C18 column using 42% acetonitrile with 15 mM potassium dihydrogen phosphate in
water (pH- 2.0 adjusted with phosphoric acid) as the mobile phase at a flow rate of 1.2
mL/min. The standard calibration curve was constructed in the concentration range of
50-2000 ng/mL. Spironolactone was used as an internal standard (IS). Valsartan and
IS were eluted at 10.25 and 12.17 min, respectively.
Vinzuda et al. [9] have developed a reverse phase isocratic RP-HPLC method
for the determination of valsartan in tablet dosage form. The method was carried out
using thermo-hypersil ODS column (150 mm × 4.6 mm i.d., 5 μm particle size) with
mobile phase comprised of water: acetonitrile: glacial acetic acid (500:500:01). The
flow rate was set at 1.0 mL/min and effluent was detected at 273 nm. The retention
time of valsartan was found to be 4.6 min. LOD and LOQ were found to be 2.72
μg/mL and 8.25 μg/mL, respectively. The calibration curve was linear in the
concentration range of 40-140 μg/mL.

144
Ramakrishna Yadav et al. [10] have reported a high performance liquid
chromatography (RP-HPLC) method for the simultaneous estimation of valsartan and
hydrochlorothiazide in tablets. The separation was achieved on Hypersil C18 column
(250 cm length, 4.6 mm internal diameter and 5 μm particle size) with a mobile phase
having a fixed composition of acetonitrile: 0.1M-ammonium acetate buffer in the ratio
of 55:45 v/v and at a flow rate was 1.0 mL/min. The effluent was monitored with UV
detector at 254 nm. The retention times for valsartan and hydrochlorothiazide were
found to be 2.38 and 2.97 min., respectively. The linearity range for valsartan and
hydrochlorothiazide were 32-160 and 5-25 μg/mL, respectively.
Manoranjani et al. [11] have described a HPLC method for the assay of
valsartan in tablet dosage form. Isocratic elution at a flow rate of 1mL/min was
employed on asymmetry C18 column at ambient temperature. The mobile phase
consisted of methanol: water: THF 60:35:05(v/v/v). The uv detection wavelength was
at 269 nm. Linearity was observed in concentration range of 10-35 ppm. The retention
time for valsartan was 4.6 min.
A validated and stability indicating RP-HPLC method [12] was reported in
literature for the simultaneous estimation of valsartan (VAL) and amlodipine (AML)
in their combined dosage form. Column used was XTerra® RP18, mobile phase was
consisted a mixture of solution A (1000 mL water + 0.2 mL trifluoro acetic acid) and
solution B (water:acetonitrile: trifluoro acetic acid, 400:600:1, v/v/v) with flow rate of
1.5 mL/ min and UV detection was carried out at 237 and at 265 nm for AML and
VAL, respectively. The described method was linear over the range of 1.6-240 μg/mL
and 1-30 μg/mL for VAL and AML, respectively.
UV spectrophotometric methods
First-derivative ultraviolet spectrophotometric and high-performance liquid
chromatographic (HPLC) methods [13] were used to determine valsartan and
hydrochlorothiazide simultaneously in a combined pharmaceutical dosage forms. The
derivative procedure was based on the linear relationship between the drug
concentration and the first derivative amplitudes sat 270.6 and 335 nm for valsartan
and hydrochlorothiazide, respectively. The calibration graphs were linear in the range
of 12.0–36.1g/mL for valsartan and 4.0–12.1 g/mL for hydrochlorothiazide.

145
Furthermore, a high performance liquid chromatographic procedure with ultraviolet
detection at 225 nm was developed for a comparison method. For the HPLC
procedure, a reversed phase column with a mobile phase of 0.02 M phosphate buffer
(pH 3.2)-acetonitrile (55: 45; v/v) was used to separate for valsartan and
hydrochlorothiazide. The plot of peak area ratio of each drug to the internal standard
versus the respective concentrations of valsartan and hydrochlorothiazide were found
to be linear in the range of 0.06–1.8 and 0.07–0.5 g/mL, respectively.
Sevgi Tatar et al. [14] have described UV- and second derivative-
spectrophotometric and high-performance liquid chromatographic methods for the
determination of valsartan in pharmaceutical formulation. For the first method, UV-
spectrophotometry, standard solutions were measured at 205.6 nm. The linearity range
was found to be 2.0–10.0g/mL in ethanol with a correlation coefficient (r=0.9997).
For the second method, the distances between two extremum values (peak-to-peak
amplitudes) at 221.6 and 231.2 nm were measured in the second order derivative-
spectra of standard solutions. The third method was based on high-performance liquid
chromatography on C18 column using acetonitrile, phosphate buffer as a mobile
phase and losartan was used as an internal standard. Detection was carried out at 265
nm with a UV-detector. The assay was linear over the concentration range at 1.0–5.0
µg/mL.
Meyyanathan and coworkers [15] have explained two UV spectrophotometric
methods, simultaneous equation method and Q-value analysis method for the
simultaneous estimation of nebivolol hydrochloride and valsartan used as
cardiovascular drugs available in capsule dosage form and nebivolol hydrochloride
with hydrochlorothiazide used as antihistaminic H blocker available in tablet dosage
form. The methods are based on the measurement of the absorbance of nebivolol
hydrochloride and hydrochlorothiazide at 270.4, 280.2 and 270 nm for nebivolol HCl
and valsartan at 246.6, 280.2 and 275 nm, respectively. These methods were obeyed
Beer's law in the concentration range of 0.5 - 2.5 μg/mL for nebivolol HCl, 1.0–20
μg/mL for valsartan 1.0–3.0 μg/mL for hydrochlorothiazide.
Gupta et al. [16] have described two UV spectrophotometric methods for the
estimation of valsartan (VRT) in bulk and in tablet dosage form. Calibration graphs
146
were found to be linear (r=0.999) over the concentration range of 10-50 μg/mL. Both
the methods can be adopted in its routine analysis.
Deshpande et al. [17] have developed two UV spectrophotometric methods for
the estimation of valsartan and hydrochlorothiazide in pharmaceutical formulation.
Method I-Absorption ratio method (Q-analysis) using two wavelengths, 265 nm (iso
bestic point at which both the drugs exhibit absorbance) 249 nm (λmax of valsartan)
and Method II- area under curve method. For the second method area under the curve
in the range of 249 -259 nm and 261-281 nm was selected for the analysis of valsartan
and hydrochlorothiazide respectively. Linearity for detector response was observed in
the concentration range of 2-24 µg/mL and 2-14 µg/mL for valsartan and
hydrochlorothiazide, respectively.
An extraction-free spectrophotometric method for the simultaneous estimation
of valsartan and ezetimibe in pharmaceuticals using acidic dyes, namely,
bromophenol blue (BPB) and bromocresol green (BCG) was reported [18]. The
method was based on selective ion-pair formation between valsartan and the acidic
dyes. The yellow coloured ion-pair induces a bathochromic shift in the spectrum with
maximum absorbance at 425 and 428 nm for BPB and BCG, respectively. With BPB,
the ion-pair was formed obeyed Beer`s law in the ranges 5-40 and 1–50 μg/mL for
valsartan and ezetimibe, respectively.
Nevin Erk [19] has developed two methods using two different techniques for
the simultaneous determination of valsartan and hydrochlorothiazide in
pharmaceutical dosage forms. The first method, based on compensation technique is
presented for the derivative spectrophotometric determination of binary mixtures with
overlapping spectra. By using ratios of the derivative maxima or the derivative
minimum, the exact compensation of either component in the mixture can be
achieved, followed by its determination. The second method, differential derivative
spectrophotometry, comprised of measurement of the difference absorptivities
derivatized in the first order (_D1) of a solution in methanol at wavelengths of 227.8
and 276.5 nm, respectively.
Erdal Dinc et al. [20] have explained a new signal processing approach based
on continuous wavelength transform (CWT) was proposed for the simultaneous

147
spectrophotometric determination of valsartan and amlodipine in tablets without
making use of any chemical separation procedure. After the CWT method was applied
to the analyzed spectra, the results plotted in wavelength domain. Several CWT
families were tested and Daubechie10 (db10-CWT) and D Meyer (dmey-CWT) were
found suitable for the determination of VRT and AML. The procedure of the CWT
family was based on the recovery results of signal analysis. Linear calibration ranges
were considered as 2-42 g/mL for VRT and 2-32 g/mL for AML, respectively. The
validation treatments for the proposed CWT methods were performed by analyzing
various synthetic mixtures and using the standard addition technique.
Nashwah [21] has developed a spectrophotometric method for simultaneous
determination of amlodipine (AML) and valsartan (VRT) without previous separation.
In this method, amlodipine in methanolic solution was determined using zero order
UV spectrophotometry by measuring its absorbance at 360.5 nm without any
interference from valsartan. Valsartan spectrum in zero order is totally overlapped
with that of amlodipine. First, second and third derivative could not resolve the
overlapped peaks. The first derivative of the ratio spectra technique was applied for
the measurement of valsartan. The ratio spectrum was obtained by dividing the
absorption spectrum of the mixture by that of amlodipine, so that the concentration of
valsartan could be determined from the first derivative of the ratio spectrum at 290
nm. Quantification limits of amlodipine and valsartan were 10–80 g/mL and 20–180
g/mL, respectively.
Gaikwad et al. [22] have explained a high-performance thin-layer
chromatographic (HPTLC) method for the simultaneous determination of ramipril and
valsartan in capsules. Identification and determination were performed on 10 cm × 10
cm aluminum-backed TLC plates, coated with 0.2 mm layers of silica gel 60F254,
previously washed with methanol using ethyl acetate : chloroform: glacial acetic acid,
(8:2:0.2, v/v) as mobile phase. Detection was carried out densitometrically using UV
detector at 220 nm. The Rf values were 0.15 for ramipril and 0.49 for valsartan. The
linear response for ramipril and valsartan was observed over 800–4000 ng/spot (r =
0.9933) and 800–4000 ng/spot (r = 0.9906), respectively.
Kadam et al. [23] have developed a high-performance thin-layer
chromatographic (HPTLC) method for simultaneous analysis of valsartan and
148
hydrochlorothiazide in tablet formulations. Standard and sample solutions of valsartan
and hydrochlorothiazide were applied to pre coated silica gel G 60 F254 HPTLC
plates and the plates were developed with chloroform–ethyl acetate–acetic acid,
5:5:0.2 (v/v), as mobile phase. UV detection was performed densitometrically at 248
nm. The retention factors of valsartan and hydrochlorothiazide were 0.27 and 0.56,
respectively. The linear range was 800–5600 ng per spot for valsartan and 125–875 ng
per spot for hydrochlorothiazide.
Hiten Janardan shah et al. [24] have proposed LC-MS/MS method for
simultaneous analysis of valsartan (VAL) and hydrochlorothiazide (HCTZ) in human
plasma. VAL and HCTZ were chromatographed on a C8 column with 75:15:10
actonitrile-methanol-0.001% aqueous ammonia as mobile phase. The samples were
extracted from solid phase extraction.
Ramani et al. [25] have described the simultaneous determination of three
drugs namely simvastatin, amlodipine and valsartan in 500 µL plasma. The total run
time involved 2.8 min. This was achieved with a mobile phase consisting of 0.02M
ammonium formate (pH4.5):acetonitrile (20:80) at a flow rate of 0.5 mL/min. on an
X-terra C18 column. The range of concentration validated of valsartan was 0.5-50
ng/mL.
Senthamil Selvan et al. [26] have described the fixed dose combination of
nebivolol and valsartan in human plasma by LC-MS/MS. These two drugs were
extracted from plasma using acetonitrile and separated on a C18 column. The mobile
phase consisting of acetonitrile and 0.05 mM formic acid (50:50v/v, pH3.5) was
delivered at a flow rate of 0.25 mL/min. The linearity was obtained over the
concentration range of 1.0-2000 ng/mL for valsartan.
A LC-MS/MS method [27] was described by Xiaoling Hu et al. for the
simultaneous quantification of benazepril, gliclazide and valsartan in human plasma.
Chromatographic separation was performed on a Shim-pack VP-ODS C18 column
(250 x2.0mm i.d., 5µm) using methanol-0.05% formic acid (90:10,v/v) as mobile
phase. Lower limit of quantification of valsartan was 20 ng/mL.
Nozomu Koseki et al. [28] have developed an LC-MS/MS method for
valsartan using solid phase extraction in an Empore high performance extraction disk
149
plate, universal resin 96-well formate. Calibration range of the method was 2-2000
ng/mL.
Arbinda Patnaik et al. [29] have developed an HPLC method for valsartan in
tablet dosage forms, Microbondapak column was used and mobile phase was
consisted of methanol and phosphate buffer pH-3 (65:35). Total run time was found to
be 20 min and linearity of the concentration range was 10-100µg/mL.
From the above literature survey, it is found that, only few LC-MS/MS and
spectrophotometric methods are available for the determination of valsartan. The
reported spectrophotometric and chromatographic methods are less sensitive and also
having some deficiencies in their methods. In order to overcome these short comings,
the author has presented a simple spectrophotometric method for the determination of
valsartan using p-chloranilic acid as a π-acceptor in the Section 5A, and a sensitive
LC-MS/MS method for its determination in human plasma is described in Section 5B.
150
Section 5A
Spectrophotometric determination of valsartan using p-chloranilic acid as π-
acceptor in pure and in dosage forms
5A.1. Reagent profile
p-Chloranilic acid (PCA)
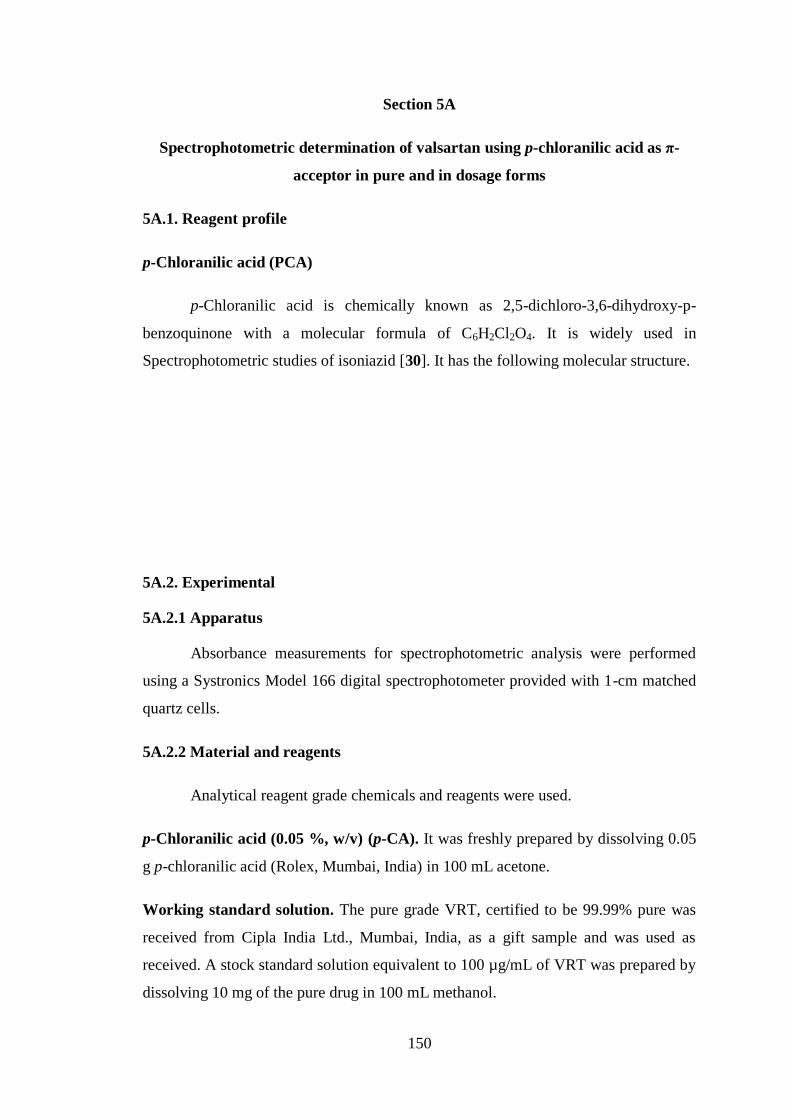
p-Chloranilic acid is chemically known as 2,5-dichloro-3,6-dihydroxy-p-
benzoquinone with a molecular formula of C6H2Cl2O4. It is widely used in
Spectrophotometric studies of isoniazid [30]. It has the following molecular structure.
5A.2. Experimental
5A.2.1 Apparatus
Absorbance measurements for spectrophotometric analysis were performed
using a Systronics Model 166 digital spectrophotometer provided with 1-cm matched
quartz cells.
5A.2.2 Material and reagents
Analytical reagent grade chemicals and reagents were used.
p-Chloranilic acid (0.05 %, w/v) (p-CA). It was freshly prepared by dissolving 0.05
g p-chloranilic acid (Rolex, Mumbai, India) in 100 mL acetone.
Working standard solution. The pure grade VRT, certified to be 99.99% pure was
received from Cipla India Ltd., Mumbai, India, as a gift sample and was used as
received. A stock standard solution equivalent to 100 µg/mL of VRT was prepared by
dissolving 10 mg of the pure drug in 100 mL methanol.
151
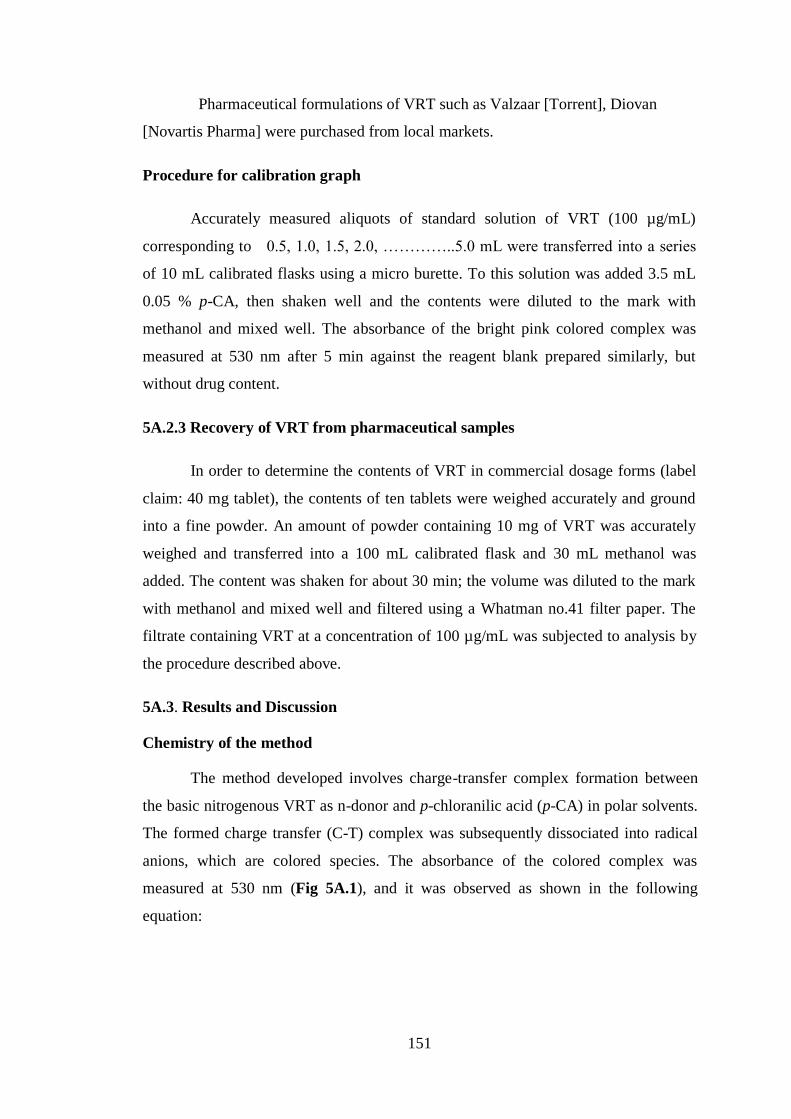
Pharmaceutical formulations of VRT such as Valzaar [Torrent], Diovan
[Novartis Pharma] were purchased from local markets.
Procedure for calibration graph
Accurately measured aliquots of standard solution of VRT (100 µg/mL)
corresponding to 0.5, 1.0, 1.5, 2.0, …………..5.0 mL were transferred into a series
of 10 mL calibrated flasks using a micro burette. To this solution was added 3.5 mL
0.05 % p-CA, then shaken well and the contents were diluted to the mark with
methanol and mixed well. The absorbance of the bright pink colored complex was
measured at 530 nm after 5 min against the reagent blank prepared similarly, but
without drug content.
5A.2.3 Recovery of VRT from pharmaceutical samples
In order to determine the contents of VRT in commercial dosage forms (label
claim: 40 mg tablet), the contents of ten tablets were weighed accurately and ground
into a fine powder. An amount of powder containing 10 mg of VRT was accurately
weighed and transferred into a 100 mL calibrated flask and 30 mL methanol was
added. The content was shaken for about 30 min; the volume was diluted to the mark
with methanol and mixed well and filtered using a Whatman no.41 filter paper. The
filtrate containing VRT at a concentration of 100 µg/mL was subjected to analysis by
the procedure described above.
5A.3. Results and Discussion
Chemistry of the method
The method developed involves charge-transfer complex formation between
the basic nitrogenous VRT as n-donor and p-chloranilic acid (p-CA) in polar solvents.
The formed charge transfer (C-T) complex was subsequently dissociated into radical
anions, which are colored species. The absorbance of the colored complex was
measured at 530 nm (Fig 5A.1), and it was observed as shown in the following
equation:
152
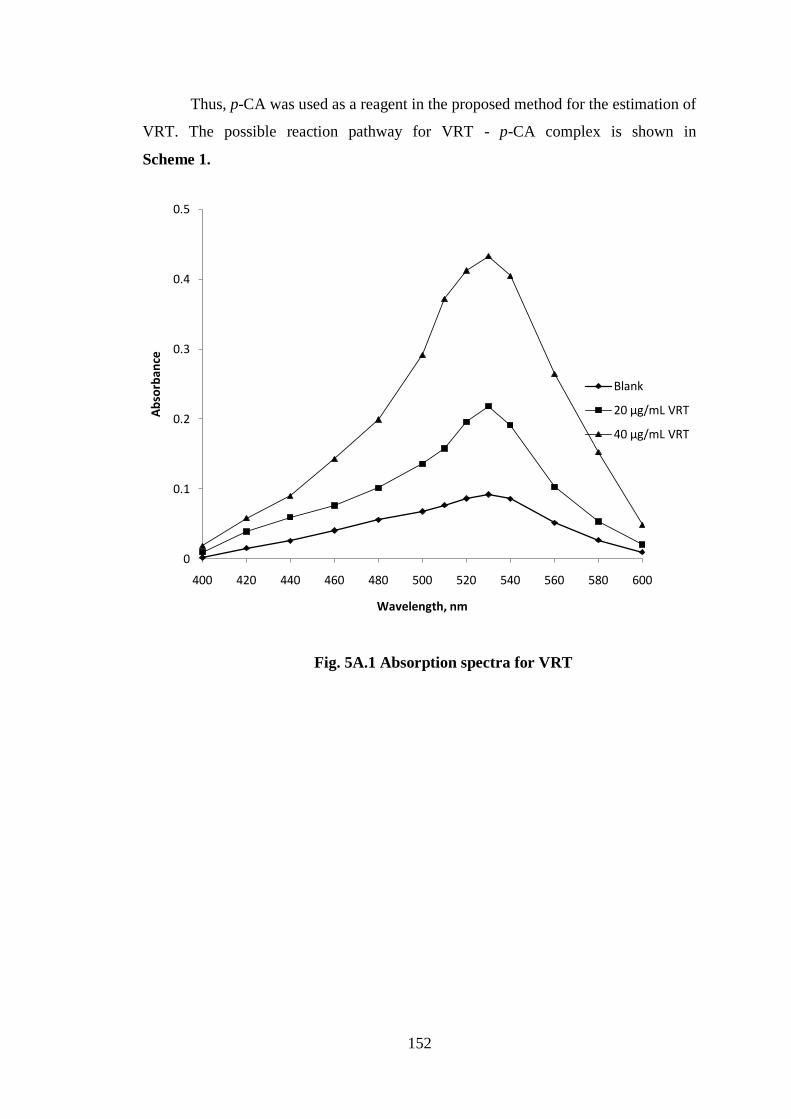
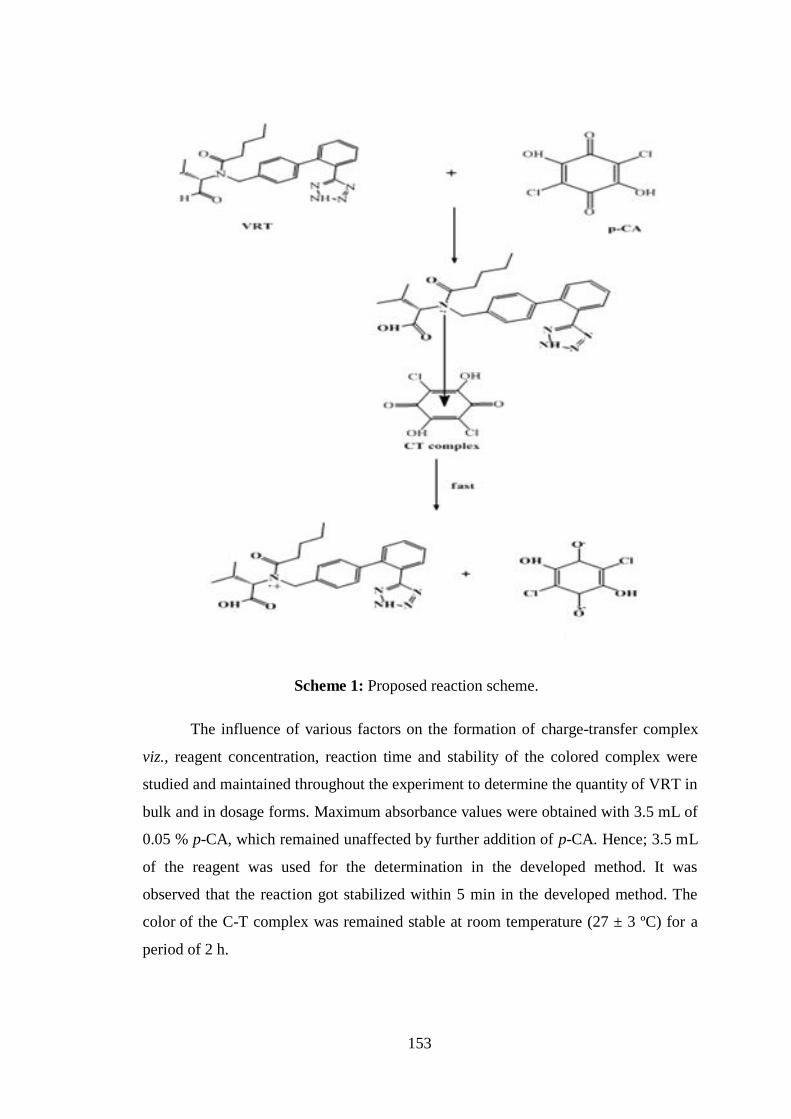
Thus, p-CA was used as a reagent in the proposed method for the estimation of
VRT. The possible reaction pathway for VRT - p-CA complex is shown in
Scheme 1.
Fig. 5A.1 Absorption spectra for VRT
0
0.1
0.2
0.3
0.4
0.5
400 420 440 460 480 500 520 540 560 580 600
Ab
sorb
ance
Wavelength, nm
Blank
20 µg/mL VRT
40 µg/mL VRT
153
Scheme 1: Proposed reaction scheme.
The influence of various factors on the formation of charge-transfer complex
viz., reagent concentration, reaction time and stability of the colored complex were
studied and maintained throughout the experiment to determine the quantity of VRT in
bulk and in dosage forms. Maximum absorbance values were obtained with 3.5 mL of
0.05 % p-CA, which remained unaffected by further addition of p-CA. Hence; 3.5 mL
of the reagent was used for the determination in the developed method. It was
observed that the reaction got stabilized within 5 min in the developed method. The
color of the C-T complex was remained stable at room temperature (27 ± 3 ºC) for a
period of 2 h.

154
5A.4 Method validation
The developed method was validated in terms of linearity and sensitivity, limit
of detection (LOD) and limit of quantitation (LOQ), precision, accuracy, selectivity
and recovery following the ICH guidelines [31].
5A.4.1 Linearity, sensitivity, limits of detection and quantitation
A calibration graph was constructed using the absorbance values against the
concentration of VRT in the ranges 5-50 µg/mL at 530 nm (Fig.5A.2). Under the
optimum experimental conditions, a linear relationship existed between the
absorbance and concentration of the drug. The regression analysis of the calibration
curve using the method of least squares was made to calculate the slope (b), intercept
(a) and correlation co-efficient (r) values are presented in Table 5A.1. The optical
characteristics such as absorption maxima, Beer’s law limit, molar absorptivity and
Sandell’s sensitivity values are also given in Table 5A.1.
Fig 5A.2 Calibration curve of VRT
The limit of detection (LOD) and limit of quantification (LOQ) were calculated
as per ICH guidelines [30] using the following equations:
LOD and LOQ
0
0.1
0.2
0.3
0.4
0.5
0.6
0 10 20 30 40 50
Ab
sorb
ance
conc. in μg/mL
155
where σ is the standard deviation (n=5) of reagent blank determination and
s is the slope of the calibration curve.
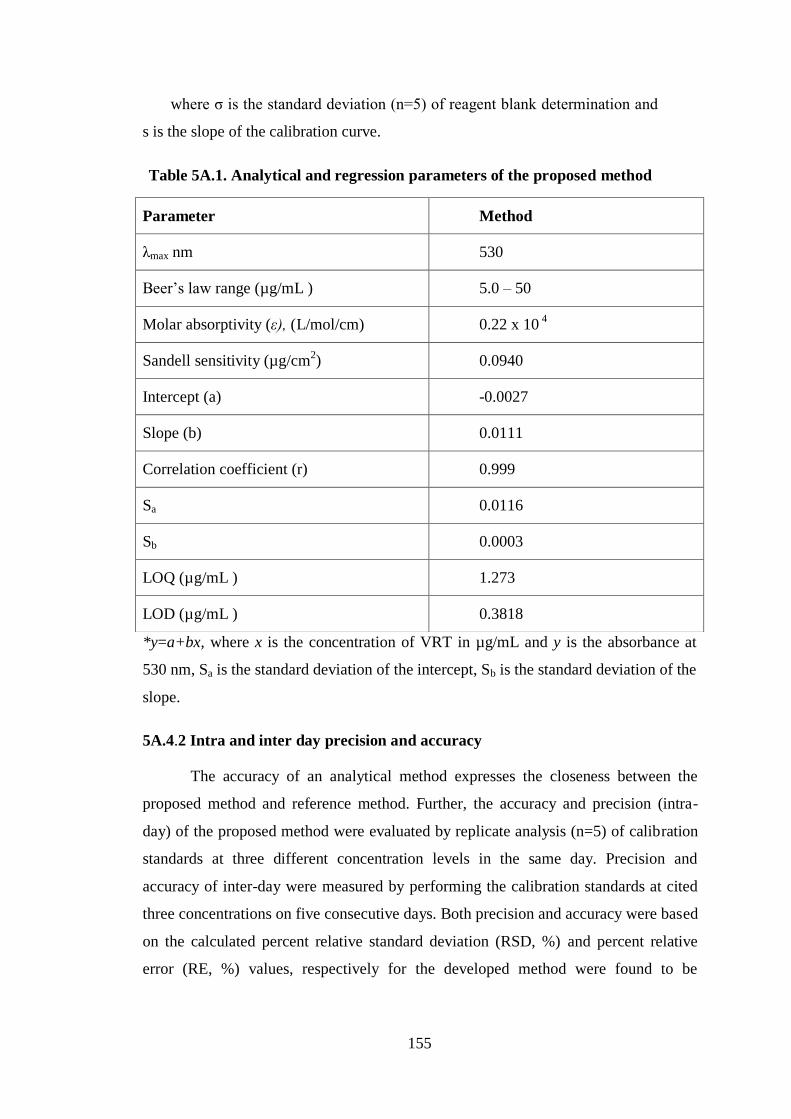
Table 5A.1. Analytical and regression parameters of the proposed method
*y=a+bx, where x is the concentration of VRT in µg/mL and y is the absorbance at
530 nm, Sa is the standard deviation of the intercept, Sb is the standard deviation of the
slope.
5A.4.2 Intra and inter day precision and accuracy
The accuracy of an analytical method expresses the closeness between the
proposed method and reference method. Further, the accuracy and precision (intra-
day) of the proposed method were evaluated by replicate analysis (n=5) of calibration
standards at three different concentration levels in the same day. Precision and
accuracy of inter-day were measured by performing the calibration standards at cited
three concentrations on five consecutive days. Both precision and accuracy were based
on the calculated percent relative standard deviation (RSD, %) and percent relative
error (RE, %) values, respectively for the developed method were found to be
Parameter Method
λmax nm 530
Beer’s law range (µg/mL ) 5.0 – 50
Molar absorptivity (ε), (L/mol/cm) 0.22 x 10 4
Sandell sensitivity (µg/cm2) 0.0940
Intercept (a) -0.0027
Slope (b) 0.0111
Correlation coefficient (r) 0.999
Sa 0.0116
Sb 0.0003
LOQ (µg/mL ) 1.273
LOD (µg/mL ) 0.3818

156
satisfactory. The analytical results obtained from this investigation are summarized in
Table 5A.2.
Table 5A.2. Evaluation of intra-day and inter-day accuracy and precision results
Intra-day a
VRT
taken,
µg/mL
VRT found c,
µg/mL
Precision d
(RSD %)
Accuracy e
(RE %)
Method
10 9.93±0.10 1.02 0.66
20 19.84±0.06 0.30 0.17
40 40.07±0.33 0.83 0.18
Method
Inter-day b
10 9.97±0.25 2.50 0.21
20 19.84±0.13 0.63 0.81
40 39.79±0.29 0.74 0.52
Mean value of five determinations, b. Mean value of five determinations, c.
Mean value of three determinations, d. Relative standard deviation (%), e. Bias%:
(Found-taken/taken)×100.
5A.5 Application to analysis of pharmaceutical samples
The validity of the proposed method was ascertained by the statistical
comparison of the results obtained by a reference method [29] with the proposed
method by applying Student’s t-test for accuracy and F-test for precision in some
commercial formulations. The results were compared with those of the reported
method. Statistical analysis of the results using the Student’s t- and F-tests revealed no
significant difference between the reported method at the 95% confidence level with
respect to accuracy and precision (Table5A 3).
157
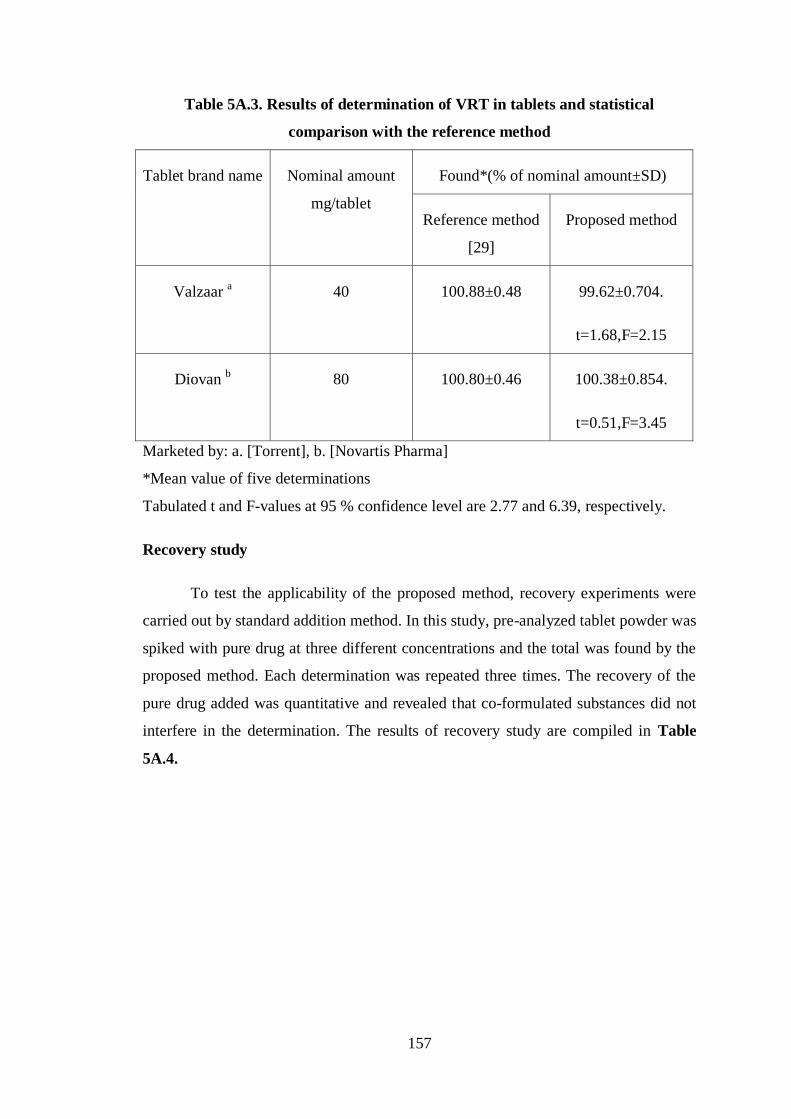
Table 5A.3. Results of determination of VRT in tablets and statistical
comparison with the reference method
Tablet brand name Nominal amount
mg/tablet
Found*(% of nominal amount±SD)
Reference method
[29]
Proposed method
Valzaar a 40 100.88±0.48 99.62±0.704.
t=1.68,F=2.15
Diovan b 80 100.80±0.46 100.38±0.854.
t=0.51,F=3.45
Marketed by: a. [Torrent], b. [Novartis Pharma]
*Mean value of five determinations
Tabulated t and F-values at 95 % confidence level are 2.77 and 6.39, respectively.
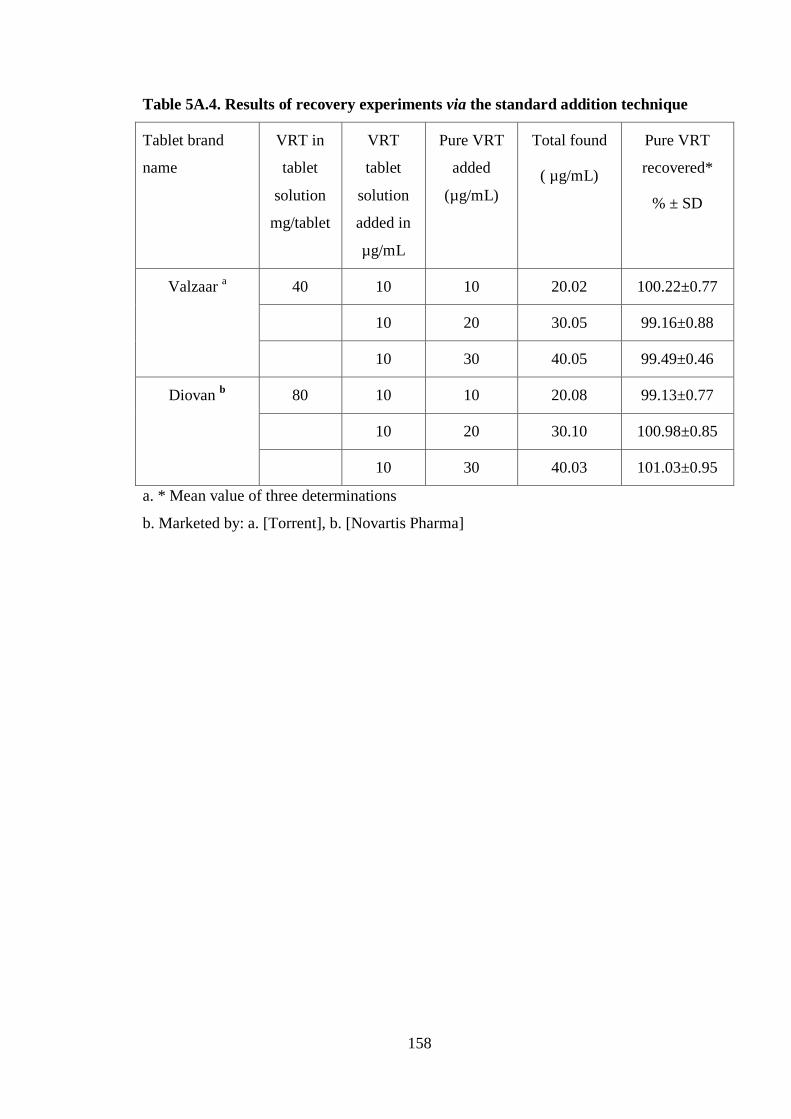
Recovery study
To test the applicability of the proposed method, recovery experiments were
carried out by standard addition method. In this study, pre-analyzed tablet powder was
spiked with pure drug at three different concentrations and the total was found by the
proposed method. Each determination was repeated three times. The recovery of the
pure drug added was quantitative and revealed that co-formulated substances did not
interfere in the determination. The results of recovery study are compiled in Table
5A.4.
158
Table 5A.4. Results of recovery experiments via the standard addition technique
Tablet brand
name
VRT in
tablet
solution
mg/tablet
VRT
tablet
solution
added in
µg/mL
Pure VRT
added
(µg/mL)
Total found
( µg/mL)
Pure VRT
recovered*
% ± SD
Valzaar a 40 10 10 20.02 100.22±0.77
10 20 30.05 99.16±0.88
10 30 40.05 99.49±0.46
Diovan b 80 10 10 20.08 99.13±0.77
10 20 30.10 100.98±0.85
10 30 40.03 101.03±0.95
a. * Mean value of three determinations
b. Marketed by: a. [Torrent], b. [Novartis Pharma]
159
Section-5B
Rapid Determination of Valsartan Using LC–MS/MS in Human Plasma and
Application to Pharmacokinetics
5B.1 Introduction
In this section, the author has described LC-MS/MS method for the analysis of
VRT in human plasma.
5B.2.Experimental
5B.2.1 Materials and Reagents
Valsartan, obtained from Clearsynth Labs (P) LTD Andheri-West, Mumbai.
purity 99.46% (by HPLC). Telmisartan (internal standard) was purchased from Vivan
Life Sciences (P) Ltd, (Thane-West, Mumbai). Sodium acetate (Sigma, St. Louis,
MO, USA). HPLC-grade acetonitrile (JT Baker (Phillipsburg, NJ, USA), and all the
other chemicals and solvents were of the highest analytical grade were used.
Ammonium acetate was obtained from (Fluka Switzerland)
20 mM ammonium acetate (pH-3.8): Dissolved 1.568 g of ammonium acetate in
1000 mL of water and the pH was adjusted to 3.8±0.1 using formic acid. It was
sonicated before use.
Mobile phase [20 mM ammonium acetate (pH3.8) and acetonitrile (10:90, v/v)]: It
was prepared by mixing 100 mL 20 mM ammonium acetate (pH -3.8) and 900 mL of
acetonitrile in a 1000 mL reagent bottle, mixed well and filter through 0.2 µm filter
paper. It was degassed by sonication before use.
Sodium acetate (2mM): It was prepared by dissolving 15 mg of sodium acetate in a
100 mL volumetric flask using water. It was sonicated and was used as an extraction
buffer.
Methanol: water: 50:50, v/v (diluent): Appropriate volume of methanol was diluted
in a milli-Q water and mixed well. It was used as a diluent.

160
Standard solutions of valsartan and telmisartan
Accurately weighed 100 mg of pure valsartan was dissolved in and diluted to
mark in a 100 mL volumetric flask with methanol. The standard solutions of valsartan
were serially diluted with methanol: water (1:1v/v) to get a concentration of 0.04,
0.09, 9.3, 23.18, 57.93, 144.8, 362.0 and 452.5 µg/mL for valsartan. An internal
standard telmisartan was prepared similarly, and it was diluted to get 2 ng/mL using
methanol:water: 1:1v/v. These solutions were stored in a freezer until analysis.
5B.2.2 Operating conditions
Column : Thermo hypersil keystone Beta basic-8, (2.1
mm. 50 mm, 3µ).
Mobile phase : acetonitrile and 20 mM ammonium acetate
containing 0.1% formic acid (pH = 3.8) (90:10,
v/v),
Column oven temperature : 40 °C
Flow rate : 0.3 mL/min (without splitter mode)
Auto sampler tray temperature : 10 °C
Injection volume : 5 µL
Mode of ionization : positive ion mode
Total run time : 2.0 min.
MS/MS operating condition
Source temperature : 500 °C
Nebulizer : 9.0 psi
Curtain gas : 8.0 psi
IS voltage : 5000 V
CAD gas : 4 psi
DP (declustering potential) : 50eV
FP (focusing potential) : 200eV
EP (Exit potential) : 10 eV
CE (collision energy : 50 eV
CXP (collision exit potential) : 3 eV
161
5B.2.3 Procedure for the preparation of calibration curve and assay samples
The calibration curve for valsartan was prepared in human plasma at eight
concentration levels of 0.93, 1.9, 185.37, 463.41, 1158.53, 2896.34, 7240.86, and
9051.08 ng/mL. Quality control samples were also prepared in human plasma at the
following concentrations 2.449, 3711.0 and 7136.54 ng/mL (low, middle and high
level concentrations) respectively. All calibration samples were prepared by the
addition of 100 µL of stock solutions to 5.0 mL of pooled plasma taken from
volunteers and mixed well. Similarly, QC- samples were prepared by adding 500 µL
of stock solutions to 25.0 mL of pooled plasma, and then treated by following the
sample preparation procedure as indicated in Section 5B.2.4.
5B.2.4. Extraction procedure (sample pretreatment)
A volume of 200 µL plasma sample was transferred to polypropylene vials to
which internal standard (50 µL, 2 ng/mL) and 50 µL of sodium acetate (2mM) were
added,then vortex to mixing and extract the sample with 2.5 mL of ethyl acetate and
vortex-mixed for10 min. The samples were centrifuged at 4000 rpm for 5 min. The
organic phase was transferred to glass vials and the solvent was evaporated to dryness
at 40 °C under a stream of nitrogen. The residue was redissolved in 500 µL of mobile
phase of which 400 µL was transferred into 1000 µL glass vials and placed in the
autosampler for analysis. The injection volume was 5 µL.
5B.3. Bio-analytical Method validation
Quantitation was based on the relationship between VRT peak areas and I.S.
peak areas. Selectivity was evaluated by extracting plasma samples from six different
sources, recoveries of VRT at the three QC concentrations (2.5, 3711.0, 7136.5
ng/mL) and I.S. at 2 ng/mL were determined by comparing peak areas of spiked
plasma samples with the peak area in mobile phase prepared with the same nominal
concentration. For precision (as relative standard deviation, R.S.D.) and accuracy (the
accuracy as the percentage of deviation between nominal measured concentrations.)
studies, samples were prepared at three QC with 6 replicates each, and were analysed
in the same day (intra-day precision and accuracy), and analysed in 3 consecutive
days (inter-day precision and accuracy). The stability of the plasma samples was also
evaluated during method validation. The stability of VRT was evaluated in post-
162
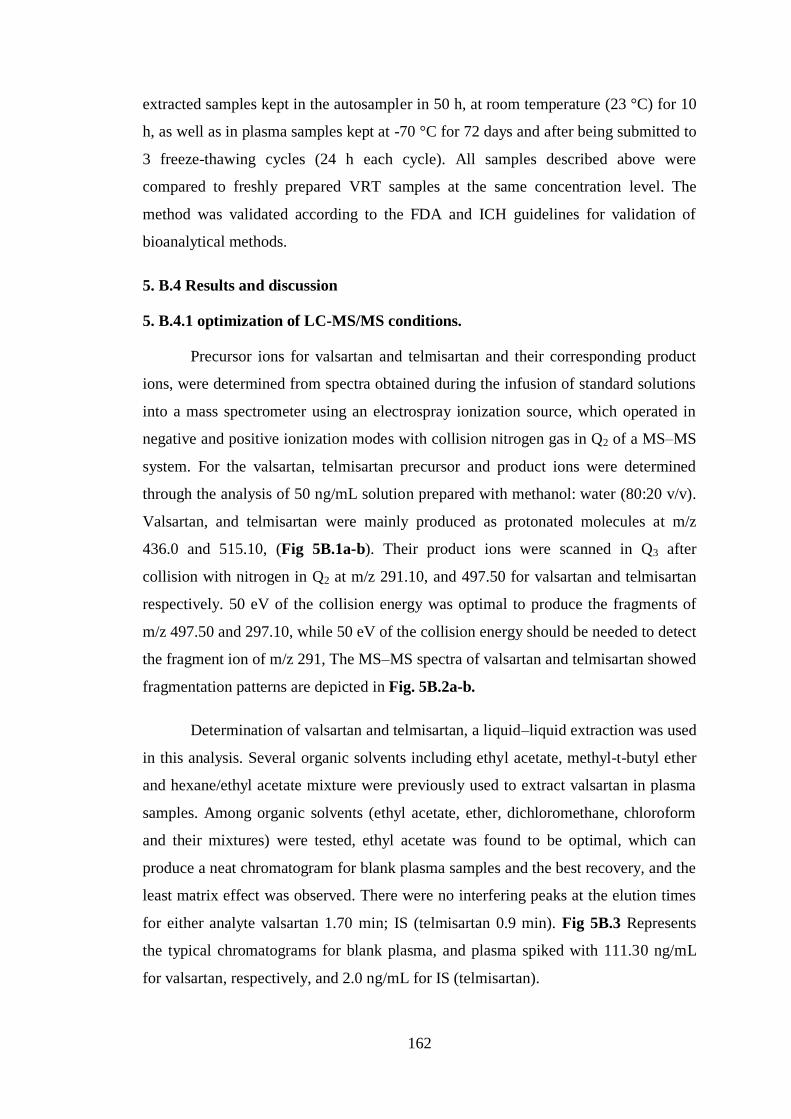
extracted samples kept in the autosampler in 50 h, at room temperature (23 °C) for 10
h, as well as in plasma samples kept at -70 °C for 72 days and after being submitted to
3 freeze-thawing cycles (24 h each cycle). All samples described above were
compared to freshly prepared VRT samples at the same concentration level. The
method was validated according to the FDA and ICH guidelines for validation of
bioanalytical methods.
5. B.4 Results and discussion
5. B.4.1 optimization of LC-MS/MS conditions.
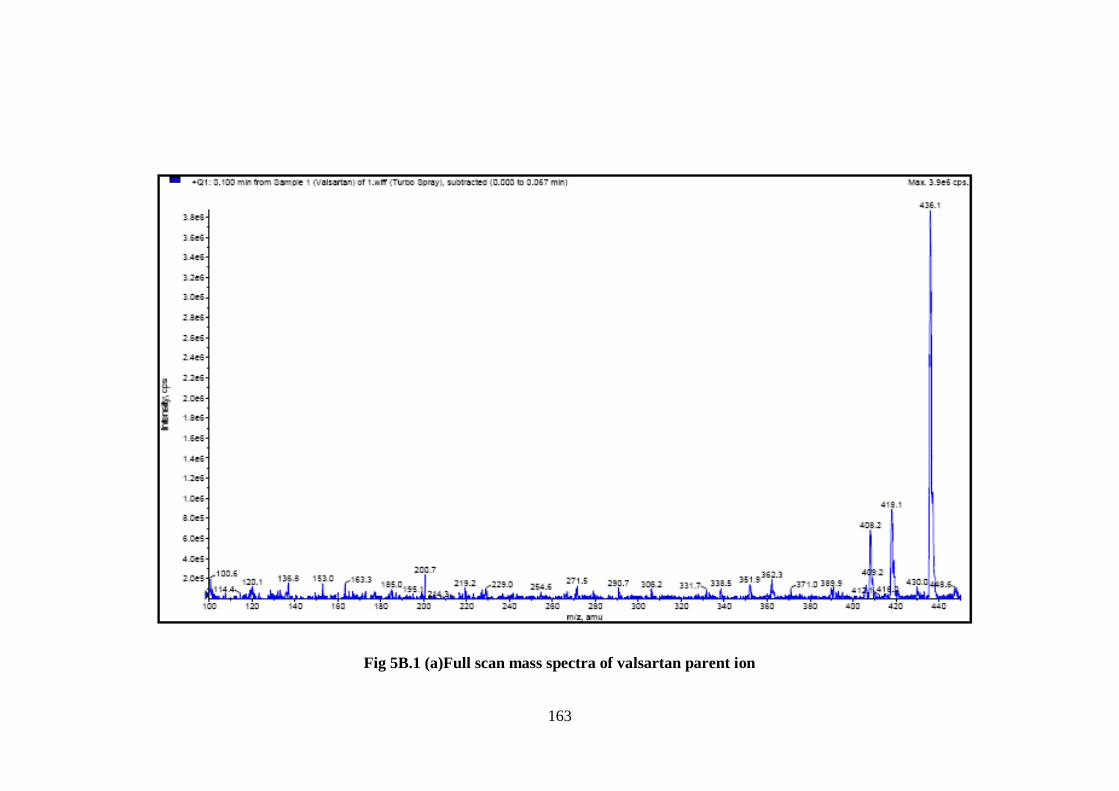
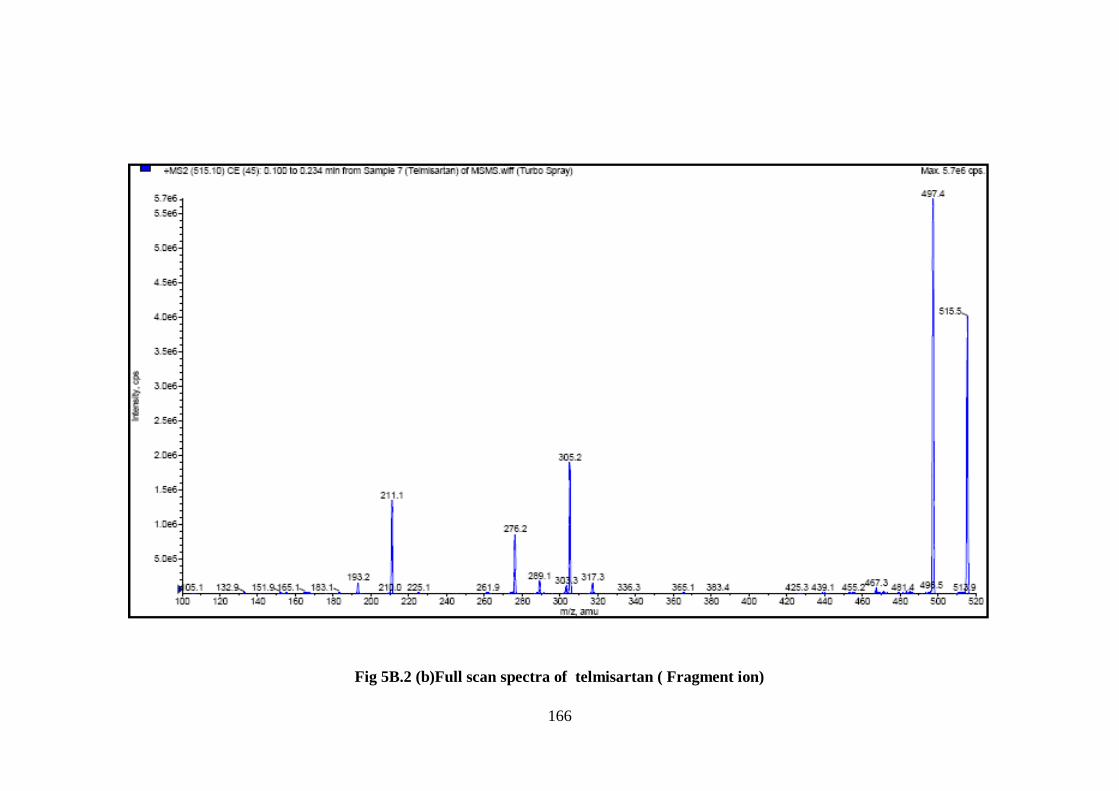
Precursor ions for valsartan and telmisartan and their corresponding product
ions, were determined from spectra obtained during the infusion of standard solutions
into a mass spectrometer using an electrospray ionization source, which operated in
negative and positive ionization modes with collision nitrogen gas in Q2 of a MS–MS
system. For the valsartan, telmisartan precursor and product ions were determined
through the analysis of 50 ng/mL solution prepared with methanol: water (80:20 v/v).
Valsartan, and telmisartan were mainly produced as protonated molecules at m/z
436.0 and 515.10, (Fig 5B.1a-b). Their product ions were scanned in Q3 after
collision with nitrogen in Q2 at m/z 291.10, and 497.50 for valsartan and telmisartan
respectively. 50 eV of the collision energy was optimal to produce the fragments of
m/z 497.50 and 297.10, while 50 eV of the collision energy should be needed to detect
the fragment ion of m/z 291, The MS–MS spectra of valsartan and telmisartan showed
fragmentation patterns are depicted in Fig. 5B.2a-b.
Determination of valsartan and telmisartan, a liquid–liquid extraction was used
in this analysis. Several organic solvents including ethyl acetate, methyl-t-butyl ether
and hexane/ethyl acetate mixture were previously used to extract valsartan in plasma
samples. Among organic solvents (ethyl acetate, ether, dichloromethane, chloroform
and their mixtures) were tested, ethyl acetate was found to be optimal, which can
produce a neat chromatogram for blank plasma samples and the best recovery, and the
least matrix effect was observed. There were no interfering peaks at the elution times
for either analyte valsartan 1.70 min; IS (telmisartan 0.9 min). Fig 5B.3 Represents
the typical chromatograms for blank plasma, and plasma spiked with 111.30 ng/mL
for valsartan, respectively, and 2.0 ng/mL for IS (telmisartan).
163
Fig 5B.1 (a)Full scan mass spectra of valsartan parent ion

164
Fig 5B.1 (b) Full scan mass spectra of telmisartan parent ion

165
Fig 5B.2 (a)Full scan spectra of valsartan ( Fragment ion)
166
Fig 5B.2 (b)Full scan spectra of telmisartan ( Fragment ion)
167
A reversed-phase column such as Thermo hypersil keystone Beta basic-8,
(2.1 mm. 50 mm, 3µ) with an isocratic mobile phase consisting of acetonitrile and
20 mM ammonium acetate containing 0.1% formic acid (pH = 3.8) (90:10, v/v) was
used. The mobile phase was eluted using a Perkin Elmer 018444Y model LC at 0.30
mL/min. The turbo ion spray interface was operated in the positive ion mode at
5,500 V. The operating conditions were optimized by flow injection of a analyte and
were determined as follows: nebulizing gas flow, 9.0 L/min turbo ions pray gas
flow, 8L/min, curtain gas flow, 1.44 L/min, and source temperature 500 °C. The
mass transition used for valsartan and its IS were m/z 436.00>291.10 and
515.10>497.50, respectively. Quadrupoles Q1 and Q3 were set on unit resolution.
The analytical data were processed by Analyst software (version 4.1.2).
5. B.5. Method validation
5. B.5.1. Selectivity and specificity
Selectivity testing with blank plasma from six different individuals never
resulted in interfering signals. The six blanks screened (n=6) and LLOQ spiked for
corresponding plasma lots. A chromatogram of an extracted blank plasma sample
(Fig, 5B.3) and a representative chromatogram of extracted calibration sample at the
lowest limit of quantification (LOQ) (5B.4), IS spiked to blank plasma (5B.5 ) and
extracted high QC sample (5B.6), respectively are given here.

168
Fig, 5B.3. Chromatogram of an extracted blank plasma sample
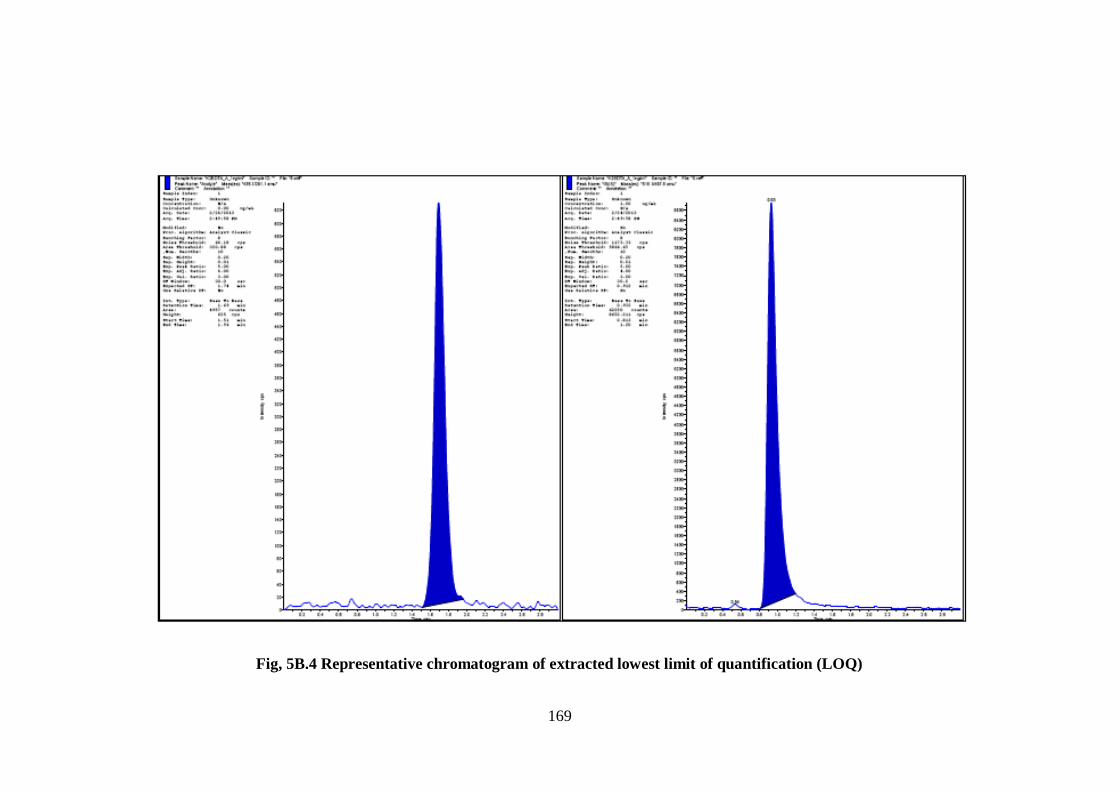
169
Fig, 5B.4 Representative chromatogram of extracted lowest limit of quantification (LOQ)

170
Fig, 5B.5 Representative chromatogram of IS spiked to blank plasma

171
Fig, 5B.6 extracted high QC sample of valsartan and IS

172
5. B.5.2. Linearity and lower limit of quantification
The linear regression of the peak area ratios versus concentration was fitted
over the concentration range of 0.9- 9051.08 ng/mL for vlsaratan in human plasma
with a correlation coefficient r =0.999
The lower limit of quantification (LLOQ) for valsartan was 0.9 ng/mL at a
signal-to-noise (S/N) ratio of 10. This sensitivity was enough to apply for
pharmacokinetic studies of valsartan after its oral administration.
5. B.5.3. Precision and accuracy
The intra- and inter-day precision and accuracy of the method developed are
listed in Table 5B.1. The coefficients of variation of the precision of the intra- and
inter-day validation were less than 0.56 and 5.88 %, respectively. The accuracy of the
method was 91.05–99.33 %. The inter-assay precision and accuracy were determined
by analyzing three calibration curves with quality control samples at four
concentration levels on 3 different days. The intra assay precision and accuracy were
determined by analyzing six replicates of the LOQ samples, and quality control
samples at three concentration levels were extracted on the same day. Detailed results
of intra-assay precision and accuracy are listed in Table 5B.1.
Table 5B.1 Intra-day and inter-day precision and accuracy for QC samples
Nominal
concentration
(ng/mL)
Within run (n=6) %
Recovery*
Between run (n=24) % Recovery*
Measured concentration
(ng/mL).
Mean ± SD (RSD)
Measured concentration
(ng/mL).
Mean± SD (RSD)
0.93
2.50
3711.00
7136.54
0.84 ± 0.01 (1.16 %)
2.41 ± 0.05 (1.92 %)
3673.40 ± 44.02 (1.20 %)
7088.92 ± 39.63 (0.56 %)
91.05
98.41
98.99
99.33
0.88 ± 0.03 (3.19 %)
2.32 ± 0.07 (3.0 %)
3565.67 ± 159.09 (4.46 %)
6825.70 ± 401.75 (5.88 %)
95.14
94.73
96.08
95.64
*Average of six determinations

173
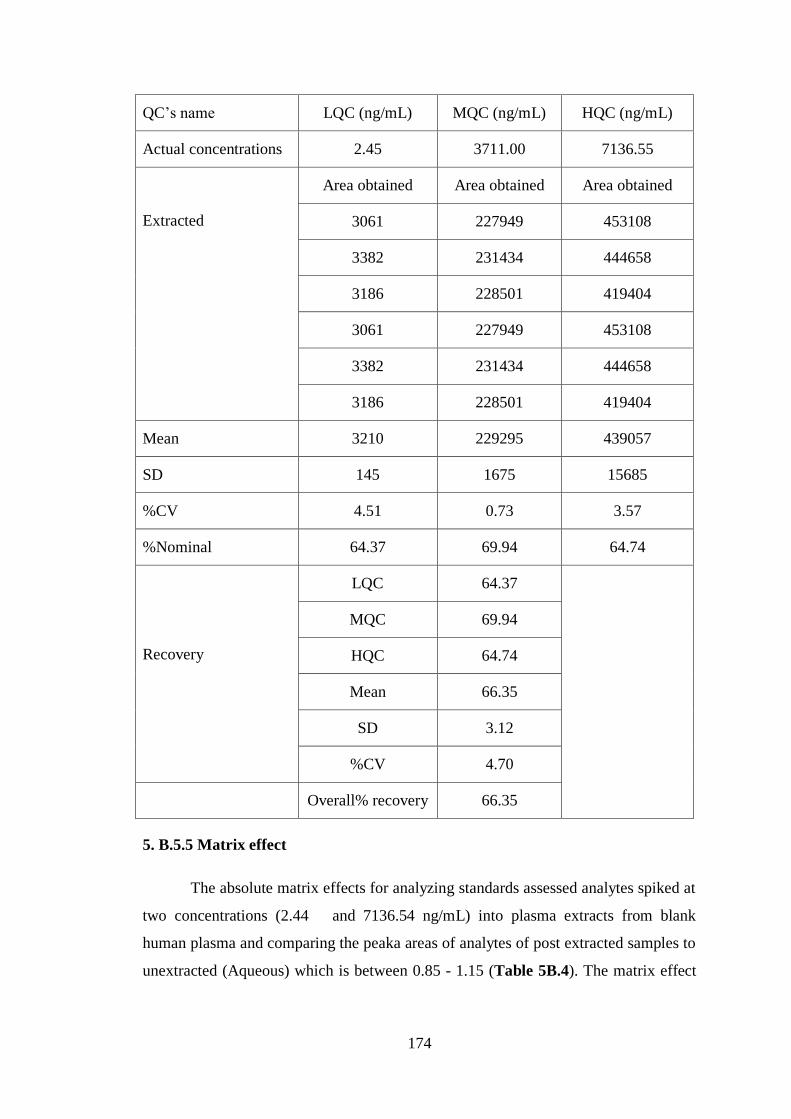
5. B.5.4 Recovery
The extraction recoveries were greater than 66 % of spiked valsartan and its IS
(Table 5B.2). The absolute recovery of valsartan was assessed by comparing the peak
area of extracted QC samples in six replicates at each level (at low, mid and high
range) to aqueous QCs prepared in solutions at the same concentration levels.
Concentration of six replicates at each level was 2.45, 3711.0 and 7136.55 ng/mL.
The overall recovery of valsartan was 66 %. Recovery of the internal standard
telmisartan was 68.0%.
Table 5B.2 Recovery of valsartan of all three levels
QC’s name LQC (ng/mL) MQC (ng/mL) HQC (ng/mL)
Actual concentrations 2.45 3711.00 7136.55
Unextracted
(Aqueous)
Area obtained Area obtained Area obtained
5021 337882 705613
4809 328921 661512
5128 316690 667508
5021 337882 705613
4809 328921 661512
5128 316690 667508
Mean 4986 327831 678211
SD 145 9515 21394
%CV 2.91 2.90 3.15
%Nominal 100.00 100.00 100.00
174
5. B.5.5 Matrix effect
The absolute matrix effects for analyzing standards assessed analytes spiked at
two concentrations (2.44 and 7136.54 ng/mL) into plasma extracts from blank
human plasma and comparing the peaka areas of analytes of post extracted samples to
unextracted (Aqueous) which is between 0.85 - 1.15 (Table 5B.4). The matrix effect
QC’s name LQC (ng/mL) MQC (ng/mL) HQC (ng/mL)
Actual concentrations 2.45 3711.00 7136.55
Extracted
Area obtained Area obtained Area obtained
3061 227949 453108
3382 231434 444658
3186 228501 419404
3061 227949 453108
3382 231434 444658
3186 228501 419404
Mean 3210 229295 439057
SD 145 1675 15685
%CV 4.51 0.73 3.57
%Nominal 64.37 69.94 64.74
Recovery
LQC 64.37
MQC 69.94
HQC 64.74
Mean 66.35
SD 3.12
%CV 4.70
Overall% recovery 66.35

175
was evaluated for analyte and IS. There is no suppression or enhancement to analyte
or IS.
Table 5B.4 Results of the matrix factor of analyte and IS
Analyte peak area Internal standard peak area
Sample LQC HQC LQC HQC
Aqueous
sample(un
extracted)
5151 815521 431584 432645
5025 771111 422591 433945
4998 789958 427040 432943
5091 755891 426129 434859
4989 800151 425173 441945
5056 757221 424236 434956
Mean 5051 781642 426126 435216
Analyte peak area Internal standard peak area
Sample LQC HQC LQC HQC
Post extracted
samples
4951 779632 403791 427003
4895 780520 372910 432259
5021 788819 399772 435846
5001 766991 414757 430455
4999 779192 416724 435432
4856 767668 407127 433496
176
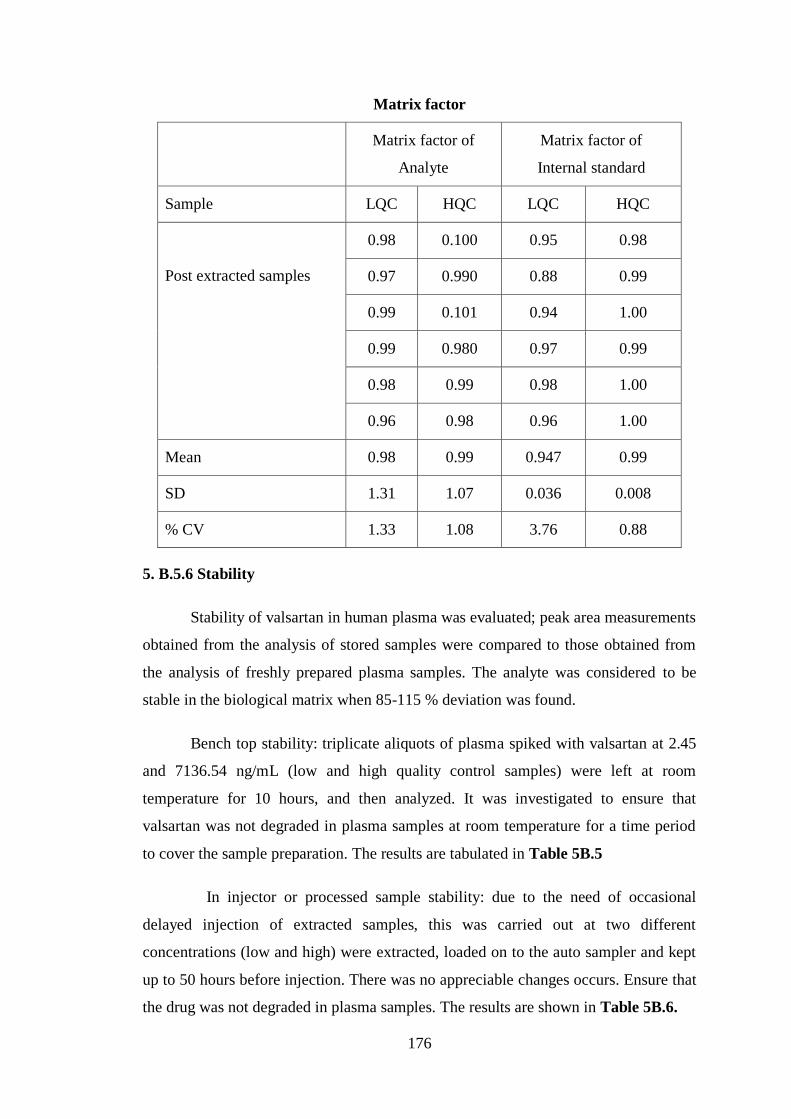
Matrix factor
Matrix factor of
Analyte
Matrix factor of
Internal standard
Sample LQC HQC LQC HQC
Post extracted samples
0.98 0.100 0.95 0.98
0.97 0.990 0.88 0.99
0.99 0.101 0.94 1.00
0.99 0.980 0.97 0.99
0.98 0.99 0.98 1.00
0.96 0.98 0.96 1.00
Mean 0.98 0.99 0.947 0.99
SD 1.31 1.07 0.036 0.008
% CV 1.33 1.08 3.76 0.88
5. B.5.6 Stability
Stability of valsartan in human plasma was evaluated; peak area measurements
obtained from the analysis of stored samples were compared to those obtained from
the analysis of freshly prepared plasma samples. The analyte was considered to be
stable in the biological matrix when 85-115 % deviation was found.
Bench top stability: triplicate aliquots of plasma spiked with valsartan at 2.45
and 7136.54 ng/mL (low and high quality control samples) were left at room
temperature for 10 hours, and then analyzed. It was investigated to ensure that
valsartan was not degraded in plasma samples at room temperature for a time period
to cover the sample preparation. The results are tabulated in Table 5B.5
In injector or processed sample stability: due to the need of occasional
delayed injection of extracted samples, this was carried out at two different
concentrations (low and high) were extracted, loaded on to the auto sampler and kept
up to 50 hours before injection. There was no appreciable changes occurs. Ensure that
the drug was not degraded in plasma samples. The results are shown in Table 5B.6.

177
Freeze thaw stability: This stability was carried out at two concentrations
(low and high). And it was assessed by exposing them to three freeze thaw cycles,
each cycle consists of removing the QC samples from the freezer, thawing them
unassisted to room temperature, kept at room temperature up to thawing i.e 1.0 h and
re-freezing about -70 °C even thaw and freeze, no changes were found in the analysis.
The results are given in Table 5B.7.
Table 5B.5 results of bench top stability of VRT
HQC(7136.543 ng/mL) LQC(2.449 ng/mL)
Bench top stability
7090.21 2.322
7055.15 2.350
7082.33 2.289
7100.59 2.305
7058.44 2.241
7012.43 2.282
Mean 7066.53 2.30
Nominal value (ng/mL) 7136.543 2.449
% Change -0.98 -6.08
Table 5B.6 Results of in-injector stability of VRT
HQC(7136.543 ng/mL) LQC(2.449 ng/mL)
In-injector stability
7011.21 2.298
7034.99 2.287
7091.52 2.198
7052.77 2.199
7018.46 2.232
7052.48 2.205
Mean 7043.57 2.24
Nominal value (ng/mL) 7136.543 2.449
% Change -1.30 -8.53
178
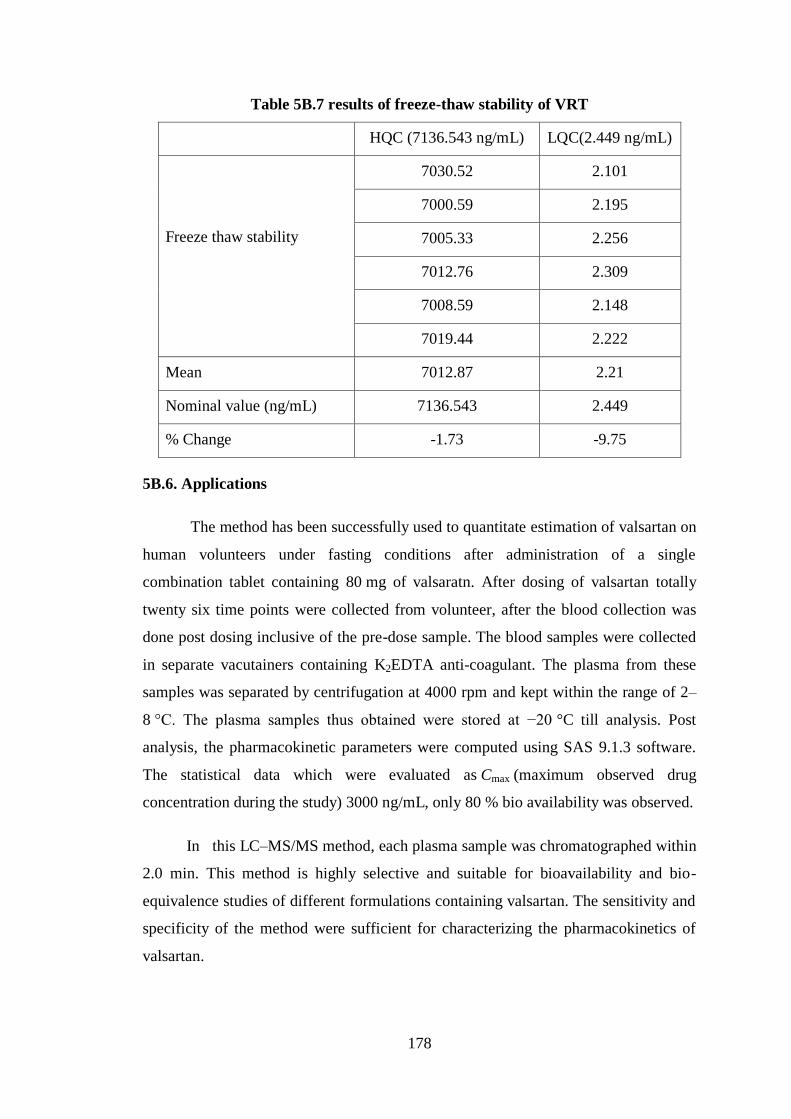
Table 5B.7 results of freeze-thaw stability of VRT
HQC (7136.543 ng/mL) LQC(2.449 ng/mL)
Freeze thaw stability
7030.52 2.101
7000.59 2.195
7005.33 2.256
7012.76 2.309
7008.59 2.148
7019.44 2.222
Mean 7012.87 2.21
Nominal value (ng/mL) 7136.543 2.449
% Change -1.73 -9.75
5B.6. Applications
The method has been successfully used to quantitate estimation of valsartan on
human volunteers under fasting conditions after administration of a single
combination tablet containing 80 mg of valsaratn. After dosing of valsartan totally
twenty six time points were collected from volunteer, after the blood collection was
done post dosing inclusive of the pre-dose sample. The blood samples were collected
in separate vacutainers containing K2EDTA anti-coagulant. The plasma from these
samples was separated by centrifugation at 4000 rpm and kept within the range of 2–
8 °C. The plasma samples thus obtained were stored at −20 °C till analysis. Post
analysis, the pharmacokinetic parameters were computed using SAS 9.1.3 software.
The statistical data which were evaluated as Cmax (maximum observed drug
concentration during the study) 3000 ng/mL, only 80 % bio availability was observed.
In this LC–MS/MS method, each plasma sample was chromatographed within
2.0 min. This method is highly selective and suitable for bioavailability and bio-
equivalence studies of different formulations containing valsartan. The sensitivity and
specificity of the method were sufficient for characterizing the pharmacokinetics of
valsartan.
179
Conclusion
There are several methods are available for the analysis of antihypertensive
drugs, (angiotension II receptor antagonist). The method developed is simple,
extraction free and cost-effective method. The uses of p-chloranilic acid are easily
available and cheaper than other reagents, which are used in the existing methods. The
method did not require any extraction or heating steps for the color development. The
color of the C-T complex remained stable at room temperature (27 ± 3 ºC) for 2 h.
The proposed method is simple and sensitive and in addition, the method has wider
linear dynamic range with good accuracy and precision that could be applied for the
determination of valsartan in bulk drug and dosage forms.
In section -5A the developed LC-MS/MS procedure for the valsartan using
human plasma is simple, sensitive, inexpensive, accurate and more precise than other
instrumental methods. The methods developed are compared with reported methods
and are presented in Table 5B.8. The proposed procedures offer the advantage of
simple extraction solvents used for extraction of sample, and total run time 2.0 min
per sample.

180
Table 5B.8: Comparison of proposed methods with some of the reported
spectrophotometric and LC-MS/MS methods
S.l.No Reagents Beer’s Law
limit (µg/mL)
Remarks Ref
1 bromophenol blue
bromocresol green
5 – 40
1 – 50
Costly reagents used [18]
2 LC-MS/MS-method
Sample extraction from
SPE technique
- Cost is more [24]
3 LC-MS/MS-method
500µLplasma used. Total
run time was 2.8 min.
0.5-50 ng/mL Sample consumption
more and run time also
2.8 min.
[26]
4 LC-MS/MS-method
Sample extract from
precipitation.
1.0-2000
ng/mL
Less sensitive. In
precipitation method
sample cleanup is not
good enough compared
to liquid-liquid or SPE
extractions
[27]
5 LC-MS/MS-method
TBME as extraction
solvent. Runtime 2.3 min
- Carcinogenic extraction
solvent used. run time
also more.
[28]
6 LC-MS/MS-method LLOQ-20
ng/mL.
Less sensitive [29]
7 LC-MS/MS-method. solid
phase extraction
2-2000 ng/mL Less sensitive. Cost is
more for SPE method.
[30]
8 (a) LC-MS/MS-method.
Ethyl acetate (100%) used
as extraction solvent. Run
time is 2.0 min
(b) p-chloranilic acid
(a) 0.9-
9051ng/mL.
(b) 5.0 – 50
µg/mL
(a) 0.2 mL plasma is
sufficient to get good
response. Run time is 2.0
min.
(b) Extraction free and
cheap reagent used.
Proposed
methods
181
Reference
[1]. Mehtap Saydam, Sevgi Takka, J. Pharm. Sci, 2007, 32, 185.
[2]. S.C. Benson, H. Pershdesingh, P. Desai, Scientific contributions,2004, 43, 993.
[3]. D.G.T. Parambi , M. Mathew, V. Ganesan. J. Appl. Pharm. Sci., 2011, 1, 97.
[4]. S.S Chitlange, K. Bagri and D.M.Sakarkar. As. J. Res. Chem., 2008, 1, 15.
[5]. C.V.N. Prasad, Ch.S. Kumari, J.S. Ramulu, Inter. J. Res. Pharm and Chem.,
2011, 1, 102
[6]. D. Jothieswari, D. Priya, S. Brito Raj, E. Mohanambal, S. Wasim Raja, Inter. J
Novel Tren. In Pharm. Sci., 2011, 1,18
[7]. A. Zarghi , A. Shafaati, S.M. Foroutan, H. Movahed , Sci. Pharm., 2008,76,
439.
[8]. Zong-Zhu Piao, Eung-Seok Lee, H.T.T. Tran, Beom-Jin Lee. Arch. Pharm.
Res., 2008, 31, 1055.
[9]. D.U. Vinzuda, G.U. Sailor, N.R. Sheth, Intern. J. Chem Tech. 2010, 2, 1461.
[10]. B.R. Yadav, M. Moinuddin, R. Battu, G. Samanthula, J. Anal. Chem., 2012, 2,
14
[11]. M. Manoranjani, T. Bhagyakumar. Intern. J. Sci. Innov. and Discov., 2011, 1,
101.
[12]. B. S. Patel, G. Bharat, Chaudhari, K. M. Buch, A. B. Patel, Intern. J. Chem Tech
Res.. 2009, 1, 1257.
[13]. S. Edam, A. Altınay , N. G. Goger , S. A. Ozkan, Z. Senturk, J. Pharm. Biomed.
Anal., 2011, 25, 1009.
[14]. S. Tatar, S. Saglk, J. Pharm. Biomed. Anal., 2002, 30, 371
[15]. S. N. Meyyanathan, A. S. Birajdar, B. Suresh, Indian J .Pharm Educ. 2010, 2,
44.
[16]. K. R. Gupta, A. R. Wadodkar, S. G. Wadodkar. Intern. J. Chem Tech Res.,
2010, 2, 985.
182
[17]. M. M. Deshpande, M. P. Mahajan. S. D. Sawant. Intern. J Pharm. Sci. Res.,
2012, 3, 2.
[18]. S. Ramachandran, B. K. Mandal, G. Navalgund, Trop. J. Pharm. Res., 2011, 10, 809.
[19]. N. Erk . Anal. Lett., 2002, 35, 283.
[20]. Erdaldinc, D. Baleanu. Rev. Chim. (Bucureti), 2010, 61, 290
[21]. N. G. Mohamed . Anal. Chem. Insig., 2011, 6, 53.
[22]. G. A. Va, R. V. Ga, Shivakumar, D. G Ya, T. H La, Indo-Global J. Pharm. Sci.,
2011, 1, 99.
[23]. B. R. Kadam, S. B. Bari, Acta Chromat, 2007, 18, 25.
[24]. H. J. Shah, N. B. Kataria, G. Subbaiah, C. N. Patel, Chromatographia, 2009, 69,
1055.
[25]. A.V. Ramani, P. Sengupta, R. Mullangi, Biomed Chromatogr, 2009, 23, 615.
[26]. P. S. Selvan, K. V. Gowda, U. Mandal, W. D. S. Solomon, T. K. Pal. J. Pharm.
Biomed. Anal., 2009, 49, 780.
[27]. X. Hu, Y. Zheng, J. Sun, L. Shang, G. Wang, H. Zhang, Chromatographia.
2009, 69, 843.
[28]. N. Koseki, H. Kawashita, H. Hara, M. Niina, M. Tanaka, R. Kawai, Y. Nagae,
N. Masuda, J Pharm. Biomed. Anal,2007. 11, 1769
[29]. A. Patnaik, M. Shetty, S. Sahoo, D. K. Nayak, S. K. Veliyath, Intern. J. Pharm.
Sci., 2010, 2, 43.
[30]. S. B. Chattaraj, K. Sharma, A. Chakraborthy, S. C. Lahiri. Spectrochim. acta A,
2012, 95, 637.
[31]. International Conference On Harmonization of Technical Requirements for
Registration of Pharmaceuticals for Human Use, ICH Harmonised Tripartite
Guideline, Validation of Analytical Procedures: Text and Methodology Q2(R
1), Complementary Guideline on Methodology, dated 06 November 1996,
incorporated in November 2005, London.