Chapter 5 Isolation and characterization of phytoconstituents...
41
70 Chapter 5 Isolation and characterization of phytoconstituents from seeds of B. juncea Section I: Pharmacognosy and physicochemical analysis 5.1 Introduction Brassica vegetables are known to be very nutritive, providing nutrients and health-promoting phytochemicals such as vitamins, carotenoids, fiber, soluble sugars, minerals, glucosinolates and phenolic compounds (Soengas et al. 2011). The beneficial effects of Brassica vegetables on health improvement have been partly attributed to their complex mixture of phytochemicals possessing antioxidant activity. Thus, the purpose of extraction was to isolate phytoconstituents from seeds responsible for maximum antioxidant activity. The broad spectrum of beneficial effects of the seeds observed in the earlier studies on B. juncea studies warrants further exploration of B. juncea seeds as a potential source for obtaining pharmacologically standardized phytotherapeutics, that could be potentially useful.
Transcript of Chapter 5 Isolation and characterization of phytoconstituents...

70
Chapter 5
Isolation and characterization of
phytoconstituents from seeds of B. juncea
Section I: Pharmacognosy and
physicochemical analysis
5.1 Introduction
Brassica vegetables are known to be very nutritive, providing nutrients and
health-promoting phytochemicals such as vitamins, carotenoids, fiber, soluble sugars,
minerals, glucosinolates and phenolic compounds (Soengas et al. 2011). The
beneficial effects of Brassica vegetables on health improvement have been partly
attributed to their complex mixture of phytochemicals possessing antioxidant activity.
Thus, the purpose of extraction was to isolate phytoconstituents from seeds
responsible for maximum antioxidant activity. The broad spectrum of beneficial
effects of the seeds observed in the earlier studies on B. juncea studies warrants
further exploration of B. juncea seeds as a potential source for obtaining
pharmacologically standardized phytotherapeutics, that could be potentially useful.

71
The present study is one such attempt to rationalize the existing knowledge within the
framework of modern science principles, practices and the techniques. The flowchart
of the study is shown in the.
5.2 Materials and methods
5.2.1 Chemicals and reagents
The solvents used in the study include n-hexane, chloroform, ethyl acetate, toluene,
glacial acetic acid and methanol. They were of HPLC grade and purchased from
Thermo Fisher Scientific India Pvt. Ltd (Mumbai, India). L-ascorbic acid, gallic acid
pure, colchicine extra pure and N-acetyl glucosamine extra pure were purchased from
Sisco Research Laboratories (Mumbai, Inida); vitamin E ((±)-a-tocopherol, liquid)
from Himedia Laboratories (Mumbai, India); (+)-catechin from Natural remedies
(Banglore, India); Vanillin (99% purlss for synthesis) from Spectrochem Pvt Ltd,
(Mumbai, India) and bovine serum albumin (lyophilized powder, crystallized, ≥96%
GE), (-)-sinigrin hydrate (≥99.0% TLC) and quercetin (≥95% HPLC) were purchased
from Sigma Aldrich corporation (St. Louis, United States). DPPH was purchased
from Sigma Aldrich corporation (St. Louis, United States).
5.2.2 Sample collection and identification
The dried seeds of B. juncea were procured from the local departmental store
packaged in vacuum tight polythene bags and authenticated at Agharkar Research
Institute, Pune, India (voucher specimen number S-158, Annex I).
72
5.2.3 Macroscopic and microscopic analysis
The macroscopic characters of the seeds were studied with reference to evaluating
organoleptic characteristics (Evans et al. 2002). For microscopic examination, the
seeds were taken and thin sections were cut with a sharp blade. The specimens were
stained with pholorglucinol (1% w/v in ethanol) and mounted with glycerol. The
photographs of the seeds and its morphology are presented in results.
5.2.4 Physicochemical Characterization
The physicochemical characterization of the seeds of B. juncea was carried out as per
the Ayurvedic Pharmacopoeia of India (The Ayurvedic Pharmacopoeia of India
1999).
Loss on drying
A clean crucible was dried to a constant weight in air-circulated oven at 105°C. 2 g of
the seed powder was placed in the crucible and dried in the oven at 105°C to constant
weight for 2 h. The crucible and its contents were cooled in a desiccator and weighed.
The moisture content was calculated and expressed in percentage.
Determination of ash content
Total ash content
A crucible was pre-heated in a muffle furnace at 450°C, cooled in desiccator and
weighed. 2 g of the seed powder was transferred into the crucible and re-weighed. The
crucible and its content was kept in the muffle furnace at 450°C till white ash was
obtained after eighteen hours. Ash contents were determined by weighing the crucible
and difference was determined.

73
Water soluble ash value
The total ash was dissolved in 25 ml water and filtered through the ashless filter paper
(Whatman No. 41) to collect the water insoluble matter. It was ignited in an electric
furnace at 450°C in silica crucible till reached a constant value. The weight of
insoluble matter was subtracted from the weight of the total ash to indicate the weight
of water soluble ash.
Acid insoluble ash value
Total ash obtained was heated with addition of 25 ml of dilute HCl for 10 min. It was
filtered in an ashless filter paper and the residue was ignited in the furnace to get a
constant weight.
Determination of extractive values
Water soluble extractive value
4 gm of powder sample was macerated with 100 ml of distilled water in a glass
stopper closed flask for 6 hours. It was shaken frequently and allowed to stand for 18
hours. It was then filtered rapidly. 25 ml of filtrate was taken in a china dish,
evaporated to dryness on a water bath. The residue was weighed and the percentage of
water soluble extractive value was calculated with reference to the powder sample
taken initially.
Alcohol soluble extractive and ether soluble extractive values
To determine the alcohol soluble extractive and ether soluble extractive value, the
similar procedure was followed, using alcohol and ether respectively instead of water.

74
5.3 Results
5.3.1 Mustard seeds showed characteristic morphology
The morphological characteristics of mustard seeds authenticated the plant illustrating
characteristic features. Seeds were reddish brown, 0.9-1 mm in diameter and bitter in
taste with characteristic pungent smell when crushed. The microscopic examination of
transverse section demonstrated certain specific characteristics of oil seeds. The testa
was dark reddish-brown to yellow and minutely pitted with the cells of the outer
epidermis containing mucilage. The embryo was oily and yellow in color, containing
two cotyledons folded against their midribs to enclose the radicals (Figure 5.1).
5.3.2 Physicochemical properties of mustard seeds
Further, the results obtained for the ash values and extractive values determined by
methods described in Ayurvedic Pharmacopeia, can be used for the quality control
purposes for mustard seeds, in various pharmacological interventions. The mean,
range and standard error values of ash contents and extractive values of Brassica
juncea seeds that resulted from analyses, are summarized in Table 5.1. The moisture
content of the seeds was also determined and found to be less than 2.1% which is
animportant quality control parameter indicating the stability and the susceptibility to
bacterial and fungal contamination.

75
Figure 5.1 Microscopic examination of mustard seed sections stained with
phloroglucinol (100×)
(a) Mustard seeds, (b) seed coat (Sc) and cotyledon (Ct), (c) transverse section of seeds
passing through seed coat (Sc); testa (Te); palisade cells (Ps); and tegmen (Tg), (d) release of
mucilage (Mu), (e) parenchyma cells (Pc) and oil globules (B) with the inset (ei) showing
isolated oil globules (Ai), T. S. of seeds showing cotyledons (A); outer epidermis (Oe); inner
epidermis and (Ie) radical (Rd).

76
Table 5.1 Ash and extractive values of B. juncea seeds
Constituent Content (%)
Mean ± SE Range
Total ash 4.56 ± 0.14 4.42 – 4.7
Water-soluble ash 1.05 ± 0.01 1.04 – 1.06
Acid-insoluble ash 3.61 ± 0.11 3.5 – 3.72
Water-soluble extractives 5.21 ± 0.15 5.06 – 5.36
Alcohol-soluble extractives 9.43 ± 1.2 8.23 – 10.63
Ether-soluble extractives 25.7 ± 3.2 22.5 – 27.9

77
Section II: Extraction and characterization of
phytoconstituents
5.4 Introduction
The premier steps to utilize the biologically active compound from plant resources are
extraction, pharmacological screening, isolation and characterization of bioactive
compound, toxicological evaluation and clinical evaluation. Extraction is the crucial
first step in the analysis of medicinal plants, because it is necessary to extract the
desired chemical components from the plant materials for further separation and
characterization. As the target compounds may be non-polar to polar and thermally
labile, the suitability of the methods of extraction must be considered. Various
methods, such as sonification, heating under reflux, soxhlet extraction and others are
commonly used (Sasidharan et al. 2011).
5.5 Methods
5.5.1 Preparation of plant extracts
Cold maceration
For the extraction by cold maceration, to 15 g mechanically grind plant powder
(coarse particles), 90 ml of solvent was added and kept on rotary shaker at 120 rpm/6
h at 28°C. After extraction, the extracts were filtered through filter paper (Whatman
No. 1) and the filtrate was concentrated by solvent evaporation under reduced

78
pressure using Equitron rotovap (Medica Instruments Mgf. Ltd., Mumbai, India). The
condensed extract was then dried further in a pre-weighed silica crucible in hot air
oven at 45°C till constant weight; the yield was recorded and stored in glass vials in a
desiccator till use.
Soxhlet extraction
15 g plant powder was weighed to make a thimble using muslin cloth, which was then
inserted into the extractor attached to 150 ml round bottom flask in a heating mantle.
90 ml solvent was poured in to the extractor and the extraction was carried out at
64°C for 6 h. The extract was filtered, dried, weighed and stored.
Extraction by ultrasonication
For extraction, 15 g plant powder was weighed and 90 ml solvent was added in the
flask. The flask was then fixed in ultrasonic bath sonicator (Dakshin, Mumbai, India)
for 6 h. following extraction the extract as filtered, dried, weighed and stored.
Successive extraction of seeds by soxhlet method
Based on earlier results of the three techniques employed, the solvents for successive
extraction were selected in order to obtain the extract with more concentrated
antioxidants. For the extraction, 30 g plant powder was packed to form a thimble. The
powder was subjected to n-hexane, chloroform and methanol successively for soxhlet
extraction. The extract obtained at the end of the method following methanol
extraction, was then filtered, dried and weighed. The extract was then reconstituted in
methanol (1 mg/ml) and subjected to DPPH analysis (section 5.5.3).
Extraction of seeds by cold maceration using hydromethanol
Next, for the extraction of seeds, various proportions of hydromethanol were used
based on the results obtained from earlier experiments. The cold maceration of
powdered seeds of B. juncea was carried out using 80% methanol, 50% methanol and

79
aqueous solution. The extracts obtained were dried and DPPH antioxidant activity
was determined (section 5.5.3). Based on the results, Brassica juncea 80%
hydromethanolic extract (BJHME) was found to be most effective and used for
bioassay guided column fractionation.
Fractionation of seed extract by column chromatography
10 g BJHME was loaded on to the glass column (450 × 18 mm) packed with 30 g
silica gel (60-120 mesh) dissolved in n-hexane. Stepwise gradient extraction was
carried out using the solvent scheme: 100% n-hexane (200 ml), 50% n-hexane + 50%
chloroform (200 ml), 100% chloroform (200ml), 50% chloroform + 50% methanol
(300 ml), 100% methanol (350 ml). Total of 125 fractions were collected of 10 ml
each, and pooled to total of 5 fractions, their TLC profile were developed using
mobile phase n-butanol: n-propanol: glacial acetic acid: water (3:1:1:1) and DPPH
autographic analysis by TLC was performed to screen the extract for potential
antioxidant activity.
5.5.2 TLC autographic assay
The HPTLC method was used to qualitatively determine the antioxidant activity of
extract by DPPH scavenging assay using 0.2% DPPH as a color developer. DPPH is a
paramagnetic purple colored compound with an odd electron. The color of the DPPH
reagent changes from purple to yellow due to the scavenging of free radicals by
antioxidants through donation of hydrogen to form the stable DPPH-H molecule,
visible on TLC plates. The method was used for the mobile phase system – toluene:
ethyl acetate: glacial acetic acid (4:4:1). Ascorbic acid – the water soluble vitamin and
α-tocopherol – the fat soluble vitamin were used as the positive control.

80
5.5.3 DPPH Radical Scavenging Activity
The free radical scavenging activity of the BJHME was measured with stable DPPH
in terms of hydrogen donating or radical scavenging activity (Oyedemi et al. 2012).
100 µL of DPPH solution (0.36 mM DPPH in methanol) was added to 1 mL extract
(100-1000 µg/mL in methanol), vortexed thoroughly and kept in the dark at room
temperature for 30 min. Then, absorbance was measured at 517 nm using Lambda 25
uv/vis spectrometer (Perkin Elmer, Waltham, United States). Ascorbic acid was used
as the positive control. The percentage of inhibition was given by the formula: percent
inhibition (%) = [(A0-A1)/A0] x 100, where A0 was the absorbance of the control
solution and A1 was the absorbance in the presence of the sample and standards.
5.5.4 Characterization of phytoconstituents
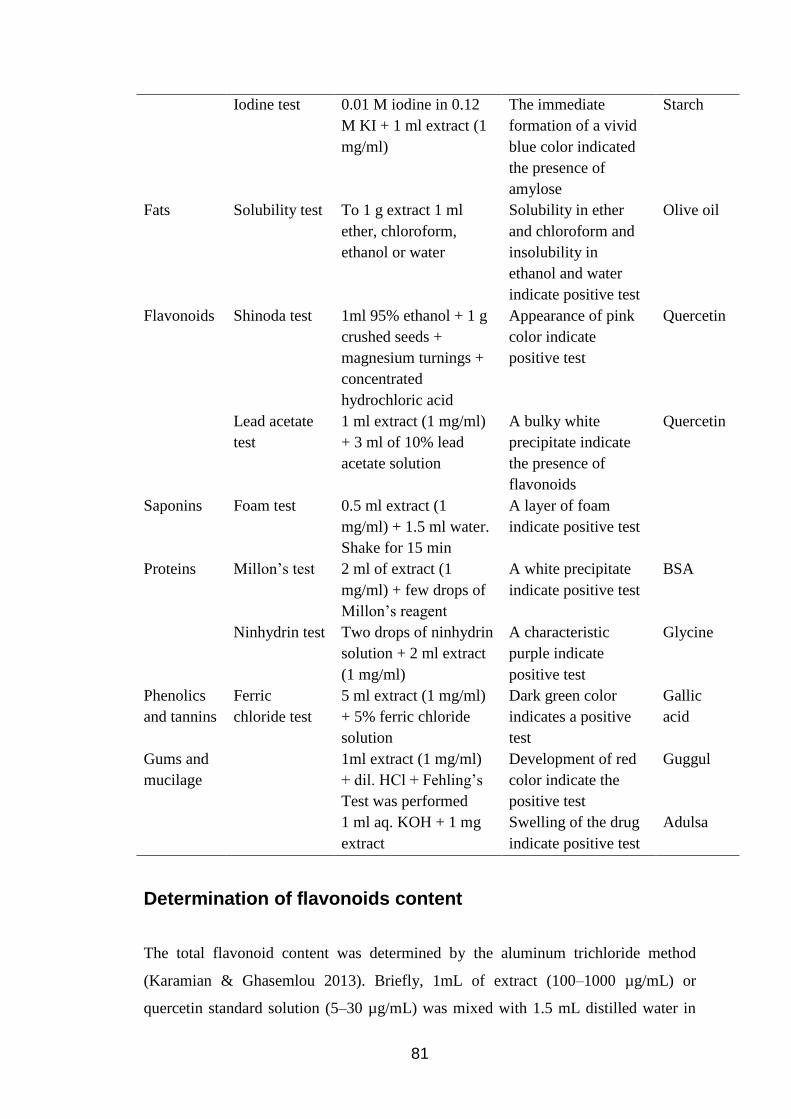
Qualitative phytochemical screening
Various qualitative tests were performed to establish the biochemical profile of plant
extract with respect to its chemical composition using the standard procedures as
given in the Table 5.2 (Kokate et al. 2007).
Table 5.2 Standard methods for qualitative phytochemical analysis for detection
of broad class of phytoconstituents
Class of
compound
Test Reaction mixture Expected results Positive
control
Alkaloids Dragendorff’s
test
1 ml extract (1 mg/ml)
+ drop of
Dragendorff’s reagent
A prominent yellow
precipitate indicate
the test as positive
Colchicine
Carbo -
hydrates
Molish’s test 2 ml of extract (1
mg/ml) + two drops of
alcoholic solution of α-
naphthol + 1 ml of
concentrated sulphuric
acid
A red-violet layer at
the interface between
the acid (bottom) and
aqueous (upper)
layers is a positive
test
D-glucose
81
Iodine test 0.01 M iodine in 0.12
M KI + 1 ml extract (1
mg/ml)
The immediate
formation of a vivid
blue color indicated
the presence of
amylose
Starch
Fats Solubility test To 1 g extract 1 ml
ether, chloroform,
ethanol or water
Solubility in ether
and chloroform and
insolubility in
ethanol and water
indicate positive test
Olive oil
Flavonoids Shinoda test 1ml 95% ethanol + 1 g
crushed seeds +
magnesium turnings +
concentrated
hydrochloric acid
Appearance of pink
color indicate
positive test
Quercetin
Lead acetate
test
1 ml extract (1 mg/ml)
+ 3 ml of 10% lead
acetate solution
A bulky white
precipitate indicate
the presence of
flavonoids
Quercetin
Saponins Foam test 0.5 ml extract (1
mg/ml) + 1.5 ml water.
Shake for 15 min
A layer of foam
indicate positive test
Proteins Millon’s test 2 ml of extract (1
mg/ml) + few drops of
Millon’s reagent
A white precipitate
indicate positive test
BSA
Ninhydrin test Two drops of ninhydrin
solution + 2 ml extract
(1 mg/ml)
A characteristic
purple indicate
positive test
Glycine
Phenolics
and tannins
Ferric
chloride test
5 ml extract (1 mg/ml)
+ 5% ferric chloride
solution
Dark green color
indicates a positive
test
Gallic
acid
Gums and
mucilage
1ml extract (1 mg/ml)
+ dil. HCl + Fehling’s
Test was performed
Development of red
color indicate the
positive test
Guggul
1 ml aq. KOH + 1 mg
extract
Swelling of the drug
indicate positive test
Adulsa
Determination of flavonoids content
The total flavonoid content was determined by the aluminum trichloride method
(Karamian & Ghasemlou 2013). Briefly, 1mL of extract (100–1000 µg/mL) or
quercetin standard solution (5–30 µg/mL) was mixed with 1.5 mL distilled water in
82
the test tube, followed by 100 µL aluminum chloride (10%, w/v) and 100 µL
potassium acetate (1 M). The reaction mixture was then incubated at room
temperature for 45 min and the absorbance was measured at 415 nm by UV/Vis
spectrometer. The results of the plant sample were expressed as µg quercetin
equivalents/mg extract.
Determination of total phenolic content
The total phenolic content of the extract was determined by the Folin-Ciocalteu
reagent method (Karamian & Ghasemlou 2013). Briefly, 1 ml of extract or gallic acid
(2–10 µg/mL in methanol) was added to 5 mL Folin-Ciocalteu reagent (1:20) and
incubated for 5 min at room temperature. Next, 4 ml of sodium carbonate (10% w/v)
was added and further incubated for 15 min at room temperature for color
development. The absorbance was measured at 765 nm by UV/Vis spectrometer. The
amount of total phenolic content was expressed as µg gallic acid equivalent/mg
extract.
Determination of sugar and protein content
Sugar content was measured by 3, 5 dinitrosalicylic acid (DNS) method (Miller 1959)
and the estimation of proteins was carried out by Lowry Method (Lowry et al. 1951).
Fourier transform infrared (FTIR) fingerprinting
Approximately 1 mg dry powder of BJHME was pressed into a pellet with 200 mg of
potassium bromide and IR spectra were recorded with an accumulation of 45 scans on
IRPrestige-21 (Shimadzu Corporation, Kyoto, Japan).
Screening of phytoconstituents by TLC
BJHME was, checked by TLC on analytical plates over silica gel 60F254 (Merck &
Co., New Jersey, United States). The qualitative analysis for different class of
phytoconstituents was carried out by spotting the bands of BJHME using capillaries

83
and using the mobile phase n-butanol: n-propanol: water: glacial acetic acid (3:1:1:1)
using different spray reagents.
HPTLC marker significant fingerprinting
The HPTLC study was carried out for detecting and quantifying the presence of
various marker compounds. HPTLC fingerprinting was performed at room
temperature on aluminum plates pre-coated with silica gel 60F254 (Merck, India).
Solutions of standards and sample were applied to the plates as bands 8.0 mm wide,
10.0 mm apart, and 10.0 mm from the bottom edge of the chromatographic plate
using a Camag (Muttenz, Switzerland) Linomat V sample applicator equipped with a
100µL Hamilton (India) syringe. Ascending development to a distance of 80 mm was
performed using a suitable mobile phase (Table 5.3) in a Camag glass twin-trough
chamber previously saturated with mobile phase vapor for 20 min. After
development, the plates were dried and then scanned with a CAMAG TLC scanner
with WINCAT software for quantification.
Table 5.3 Mobile phase systems for separation of marker compounds for HPTLC
marker-significant fingerprinting
Marker
compounds
Mobile phase
Catechin Toluene: ethyl acetate: glacial acetic acid (4:4:1)
Colchicine Toluene: ethyl acetate: glacial acetic acid (4:4:1) +
Toluene: ethyl acetate: diethyl amine (7:2:1)
Gallic acid Toluene: ethyl acetate: glacial acetic acid (4:4:1)
Quercetin Toluene: ethyl acetate: glacial acetic acid (4:4:1)
Quinine Toluene: ethyl acetate: glacial acetic acid (4:4:1) +
Toluene: ethyl acetate: diethyl amine (7:2:1)
Sinigrin n-butanol: n-propanol: water: glacial acetic acid (3:1:1:1)
Vanillin Toluene: ethyl acetate: glacial acetic acid (4:4:1)
Vitamin C Toluene: ethyl acetate: glacial acetic acid (4:4:1)
Vitamin E Toluene: ethyl acetate: glacial acetic acid (4:4:1)

84
HPLC-DAD method development and quantification of
phytoconstituents
The study was performed to develop a sensitive and accurate HPLC method for the
profiling, identification and quantification of the chemical constituents in B. juncea
seed extracts. The standard solutions were prepared in methanol to obtain the required
concentration: sinigrin (25 ppm), catechin (100 ppm), vanillin (100 ppm), quercetin
(100 ppm) and vitamin E (1000 ppm). The respective standard stock solutions were
diluted to obtain the desired concentrations of sinigrin (0.01-25 ppm), catechin (0.1-
100 ppm), vanillin (0.1-100 ppm), quercetin (0.1-100 ppm) and vitamin E (0.1-1000
ppm). The calibration curve was plotted using the mean peak areas as the y-axis and
concentrations as the x-axis. Linear regression was used to evaluate y = mx + c and
the correlation co-efficient (r). 10 mg BJHME was reconstituted in the 10 mL HPLC
grade methanol and sonicated for 10 mins. The sample was filtered through 0.2 µ
filter and diluted 2 folds with methanol to obtain final concentration of 500 ppm to be
used for HPLC analysis.
Identification of polyphenols in the extract was carried out by UFLC Prominence
Gradient (Shimadzu Corporation, Kyoto, Japan) in Enable C18 G: 5µm 250 x 4.6 mm
column (Spinco Biotech Pvt. Ltd, Chennai, India) using diode array UV detector
(SPD-M20A). A binary gradient (pump: LC 20AD) of 10 mM KH2PO4 (pH: 7) in
deionized water (solvent A), and methanol (solvent B) was as follows: from 10% in 5
min to 50% solvent B over next 5 min, from 50% to 80% solvent B over 5 min, from
80% to 70% solvent B over 5 min, from 70% to 60% solvent B over 5 min, from 60%
to 50% solvent B over 5 min and then isocratic condition of 10% solvent B for a
further 5 min. The flow rate was 1 ml/min. The HPLC-DAD fingerprint analysis was
performed for the standards singrin, catechin, quercetin, vanillin and vitamin E.
5.5.5 Statistical analysis
All the experiments were performed in triplicates and data are expressed as mean ±
standard error. The IC50 values of the extracts for antioxidant assays were calculated

85
by performing regression analysis of the data points. One way ANOVA followed by
Tukey’s test was used to compare the methanolic extracts obtained by three different
methods Figure 5.2.
5.6 Results
5.6.1 Results of extraction of B. juncea seeds
Successful determination of biologically active compounds from plant material is
largely dependent on the type of extraction procedure used. Three extraction methods
were used - cold maceration, soxhlet and sonication to obtain maximum antioxidants.
For optimal extraction, different solvent schemes were employed ranging from non-
polar to polar. The specific polarity of solvent results in extraction of molecules of the
similar polarity. In the present work, extraction procedure was standardized based on
evaluations of DPPH activity as a preliminary tool. The results were expressed as IC50
values and compared.
Extraction of powdered seeds of B. juncea was carried out using non-polar solvent n-
hexane, mid-polar solvent chloroform and polar solvent methanol employing three
different extraction techniques. Cold maceration results in the extraction of readily
extractable solutes in the solvent inclusive of heat-labile compounds. Extraction by
soxhlet method involves boiling the solvents and passing this heated solvent through
the plant powder and extracting the solutes, which generally results in loss of heat-
labile phytoconstituents. Lastly, extraction using ultrasonication involves the forced
degradation by breaking of cells as a result of penetration of ultrasonic waves and
release of compounds. The extraction carried out using these methods, were evaluated
based on yield and DPPH antioxidant activity and the results are shown in Figure 5.2.

86
Figure 5.2 Extraction of B. juncea seeds employing soxhlet, cold maceration and
ultrasonication
(a) extraction by cold maceration; (b) soxhlet; (c) ultrasonication; (d) graphical represents of
the extraction by three methods
Table 5.4 Comparison of B. juncea seed extracts
Method Solvent Activity Yield
Cold n-hexane 1153 ± 78.37 24.2 ± 0.81
chloroform 702 ± 92.53 9.53 ± 0.77
methanol 173.33 ± 11.39 8.67 ± 0.67
Soxhlet n-hexane 883.33 ± 72.65 27.5 ± 1.65
chloroform 445.33 ± 11.85 11.1 ± 0.26
methanol 153.33 ± 15.03 12.4 ± 1.13
Sonication n-hexane 1350 ± 76.38 26 ± 0.58
chloroform 877 ± 105 9.67 ± 0.67
methanol 186 ± 15 4.67 ± 0.88

87
It was observed that, extraction by methanol resulted in DPPH activity at lowest
concentrations versus chloroform and n-hexane. Also, the activity of seeds when
extracted by methanol employing three methods was not significantly different
(Figure 5.2 d). However, the yield in all three methods was significantly different with
very low yield using ultrasonication was obtained. Hence, further extraction was
carried out by soxhlet method using n-hexane, chloroform and methanol in successive
manner. Since, n-hexane and chloroform result in good yield with poor activity, it was
postulated that the successive extraction using these solvents would result in removal
of largely inactive proportions. The extraction of residue thereafter with methanol
should result in better activity than methanol alone. However, it was observed that,
there was a significant difference between the activities of the methanolic extract
obtained from successive extraction method versus single solvent extraction. On
successive extraction the activity of the extract reduced, with increase in IC50 to 268 ±
9.87 µg/ml. Since, hot extraction by successive soxhlet method did not increase the
activity, the cold extraction method was further explored. To obtain, the maximum
antioxidant compounds from seeds, various proportions of hydroalcohol were
employed. It was observed that, in case of extraction by 50% methanol in water IC50
was 255.33 ± 15.5 µg/ml, 80 % methanol in water was 102.67 ± 3.18 µg/ml and
aqueous was 488.33 ± 20.22 µg/ml. Thus, extraction of seeds using 80% hydroalcohol
was significantly better than other extraction methods employed. Hence, gradient
column extraction of BJHME was carried out. Column extraction of BJHME was
carried out using gradient system of solvents n-hexane, chloroform and methanol and
total of 5 different fractions were collected. The fractions were then checked for the
appearance of yellow bands on TLC plates following DPPH spraying which is an
indicator of antioxidant activity. However, it was observed that, none of the fractions
showed the distinct yellow color development when TLC was developed using the
mobile phase system -butanol: n-propanol: glacial acetic acid: water (3:1:1:1) sprayed
with DPPH reagent. These results indicated that separation of phytoconstituents
employing column separation technique, resulted in loss of activity of seeds. Hence,
BJHME with maximum antioxidant activity was used in the study.
88
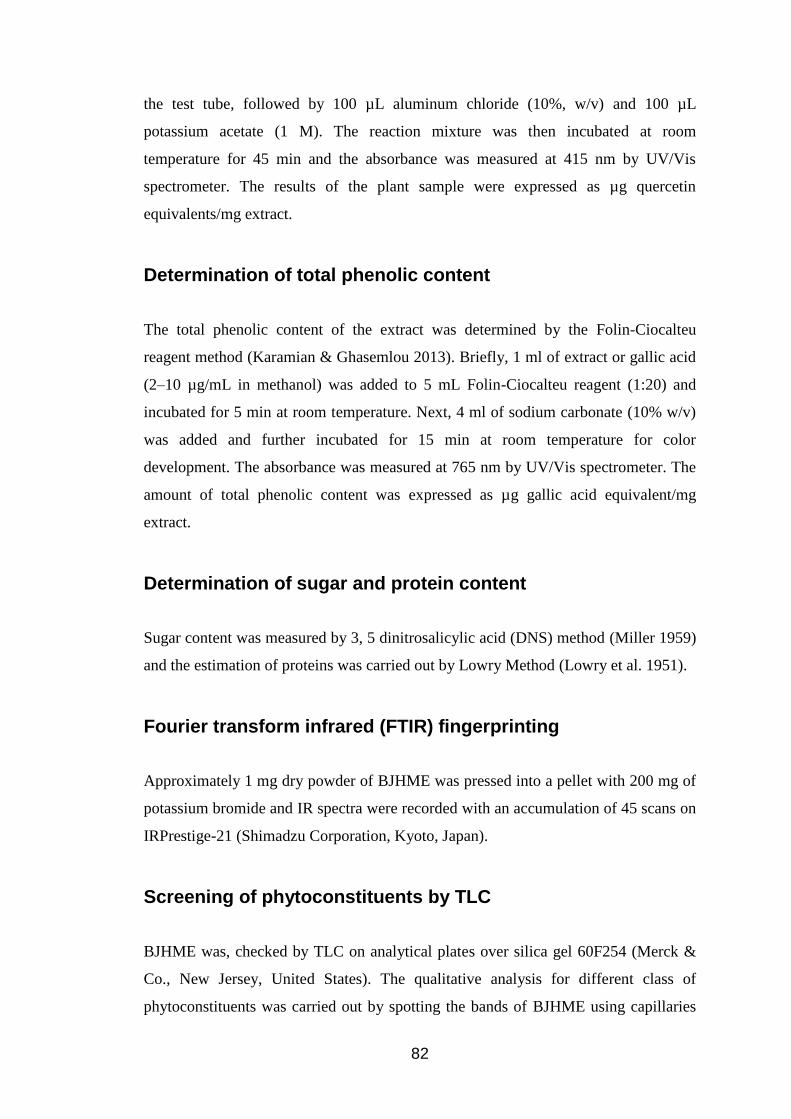
5.6.2 Characterization of BJHME
5.6.3 B. juncea seeds showed presence of broad classes of
phytoconstituents
The preliminary phytochemical analysis of mustard seeds indicated the presence of
various phytoconstituents in seeds as depicted in Table 5.5.
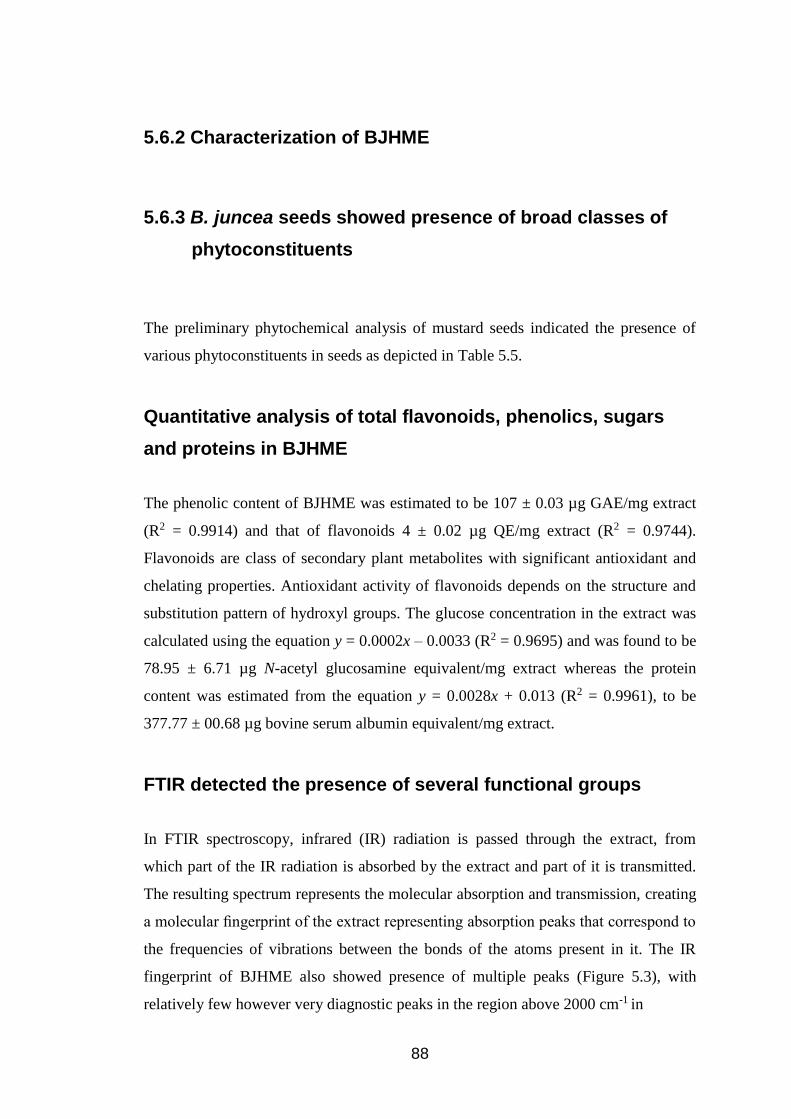
Quantitative analysis of total flavonoids, phenolics, sugars
and proteins in BJHME
The phenolic content of BJHME was estimated to be 107 ± 0.03 µg GAE/mg extract
(R2 = 0.9914) and that of flavonoids 4 ± 0.02 µg QE/mg extract (R2 = 0.9744).
Flavonoids are class of secondary plant metabolites with significant antioxidant and
chelating properties. Antioxidant activity of flavonoids depends on the structure and
substitution pattern of hydroxyl groups. The glucose concentration in the extract was
calculated using the equation y = 0.0002x – 0.0033 (R2 = 0.9695) and was found to be
78.95 ± 6.71 µg N-acetyl glucosamine equivalent/mg extract whereas the protein
content was estimated from the equation y = 0.0028x + 0.013 (R2 = 0.9961), to be
377.77 ± 00.68 µg bovine serum albumin equivalent/mg extract.
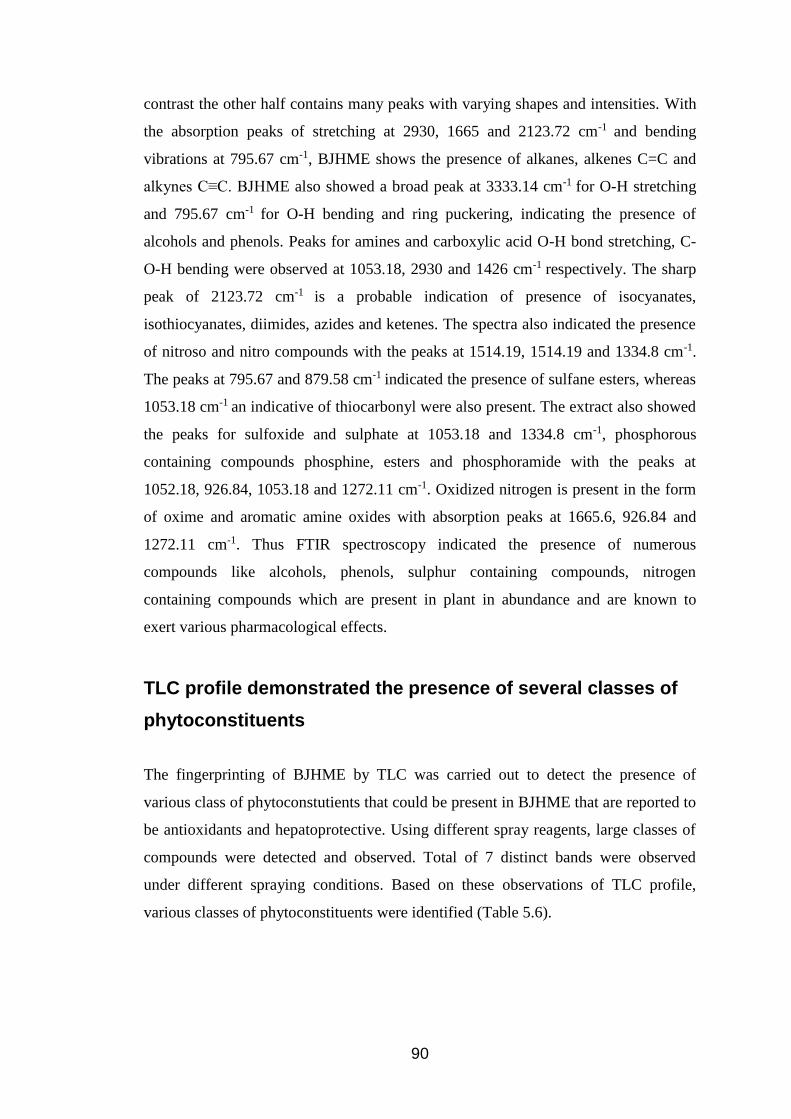
FTIR detected the presence of several functional groups
In FTIR spectroscopy, infrared (IR) radiation is passed through the extract, from
which part of the IR radiation is absorbed by the extract and part of it is transmitted.
The resulting spectrum represents the molecular absorption and transmission, creating
a molecular fingerprint of the extract representing absorption peaks that correspond to
the frequencies of vibrations between the bonds of the atoms present in it. The IR
fingerprint of BJHME also showed presence of multiple peaks (Figure 5.3), with
relatively few however very diagnostic peaks in the region above 2000 cm-1 in

89
Table 5.5 Preliminary phytochemical analysis of seeds of B. juncea
Phytoconstituent Inference
Alkaloids +
Carbohydrates +
Fats +
Flavonoids +
Saponins -
Proteins +
Phenolics & tannins +
Gums and mucilage +
+ = phytoconstituent present in seed, - = phytoconstituent absent in seed
Figure 5.3 IR fingerprint of BJHME
90
contrast the other half contains many peaks with varying shapes and intensities. With
the absorption peaks of stretching at 2930, 1665 and 2123.72 cm-1 and bending
vibrations at 795.67 cm-1, BJHME shows the presence of alkanes, alkenes C=C and
alkynes C≡C. BJHME also showed a broad peak at 3333.14 cm-1 for O-H stretching
and 795.67 cm-1 for O-H bending and ring puckering, indicating the presence of
alcohols and phenols. Peaks for amines and carboxylic acid O-H bond stretching, C-
O-H bending were observed at 1053.18, 2930 and 1426 cm-1 respectively. The sharp
peak of 2123.72 cm-1 is a probable indication of presence of isocyanates,
isothiocyanates, diimides, azides and ketenes. The spectra also indicated the presence
of nitroso and nitro compounds with the peaks at 1514.19, 1514.19 and 1334.8 cm-1.
The peaks at 795.67 and 879.58 cm-1 indicated the presence of sulfane esters, whereas
1053.18 cm-1 an indicative of thiocarbonyl were also present. The extract also showed
the peaks for sulfoxide and sulphate at 1053.18 and 1334.8 cm-1, phosphorous
containing compounds phosphine, esters and phosphoramide with the peaks at
1052.18, 926.84, 1053.18 and 1272.11 cm-1. Oxidized nitrogen is present in the form
of oxime and aromatic amine oxides with absorption peaks at 1665.6, 926.84 and
1272.11 cm-1. Thus FTIR spectroscopy indicated the presence of numerous
compounds like alcohols, phenols, sulphur containing compounds, nitrogen
containing compounds which are present in plant in abundance and are known to
exert various pharmacological effects.
TLC profile demonstrated the presence of several classes of
phytoconstituents
The fingerprinting of BJHME by TLC was carried out to detect the presence of
various class of phytoconstutients that could be present in BJHME that are reported to
be antioxidants and hepatoprotective. Using different spray reagents, large classes of
compounds were detected and observed. Total of 7 distinct bands were observed
under different spraying conditions. Based on these observations of TLC profile,
various classes of phytoconstituents were identified (Table 5.6).

91
Table 5.6 TLC profile of seed extract indicating the presence of various classes of
phytoconstituents
Reagent Observation Inference
Visible UV Short UV Long
Anisaldehyde-
H2SO4
red brown
coloration,
Blue-violet,
Blue, Red
Quenching
Blue, Violet,
Green
fluorescence
Essential oils,
Pigments, Triterpenes,
Saponins
DPPH Yellow band
against purple
background
- - Antioxidant activity
Dragendorff Orange-brown - Blue Alkaloids
Ethanolic-
H2SO4
Brown-black - - Total number of
bands
NP-PEG - - Orange, Green,
Blue, Blue-
green
Bitter drugs
Flavonoids
Anthracene
Vanillin-
H2SO4
Lemon yellow,
Blue, Blue-violet,
Red, Yellow
brown
-
- Pungent principle,
Saponins
Without
spraying
- Quenching Dark yellow,
Green , Blue
Red
Dark-blue
Bitter drugs,
Flavonoids,
Pigments,
Pungent principle

92
HPTLC fingerprinting demonstrated presence of specific
markers in BJHME
In the study of identification of bioactives, silica plates were used to establish the
TLC fingerprint. The samples were identified by comparing the Rf values of bands in
their fingerprints with those of marker compounds. For positive identification, the
sample should show bands with chromatographic characteristics, including color and
position, similar to those of reference compounds. The behaviour of the extract was
observed under UV (254 and 366 nm) and visible light and was compared with the
spectra of each component (Figure 5.4-Figure 5.8). Sinigrin, vanillin, catechin and
quercetin were detected in BJHME and quantified Table 5.7.
Further, the evidence of antioxidant efficacy was acquired by DPPH HPTLC
Autographic analysis. The extract showed multiple yellow bands against purple
background when sprayed with DPPH reagent, an indication of antioxidant activity
similar to the positive controls: Vitamin C and Vitamin E (Figure 5.9).
HPLC-DAD analysis of BJHME detected the presence of
phytoconstituents
Due to the relatively high-molecular mass and intrinsic features of hydrophobic and
hydrophilic mixtures of plant bioactives, HPLC technique was used. All the
components were separated simultaneously and analyzed along with determination of
low concentrations of analytes. A sensitive and accurate HPLC method was
developed for the profiling and identification of markers in BJHME.
In the course of optimizing the conditions of separation, the influence of the stationary
and mobile phases were firstly investigated. In order to achieve a satisfactory
separation of the chemical compounds in the extract, different HPLC parameters,
including column temperature, detection wavelength and mobile phases were
examined. It was found that the column oven temperature of 30°C gave optimal
separation. Furthermore, the mobile phase was optimized through comparison of
different solvents, solvent ratios and gradient profiles.

93
Figure 5.4 HPTLC chromatogram (254 nm) and densitogram of BJHME with
sinigrin
Track (T) 1 = BJHME (200 µg), 2 = BJHME (300 µg), 3 = sinigrin (6 µg), 4 = sinigrin (14
µg).
94
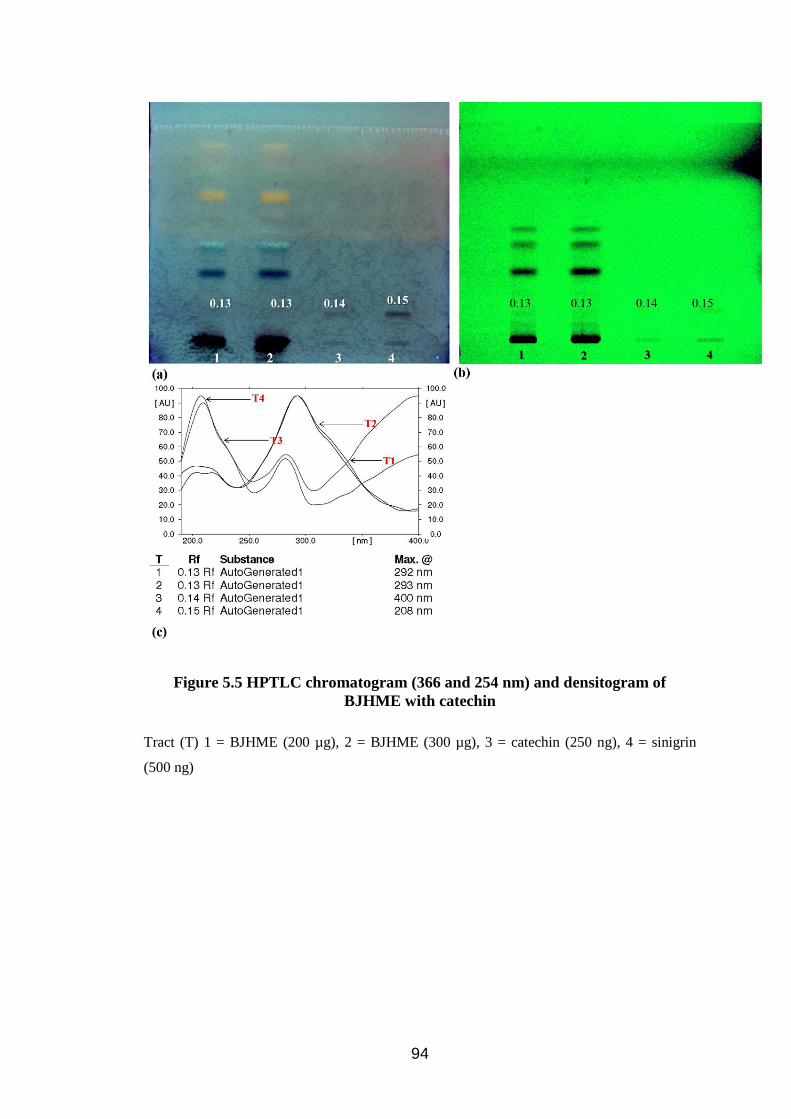
Figure 5.5 HPTLC chromatogram (366 and 254 nm) and densitogram of
BJHME with catechin
Tract (T) 1 = BJHME (200 µg), 2 = BJHME (300 µg), 3 = catechin (250 ng), 4 = sinigrin
(500 ng)

95
Figure 5.6 HPTLC chromatogram (visible, 254 and 366 nm) and densitogram of
BJHME with quercetin
Track (T) 1 = BJHME (200 µg), 2 = BJHME (300 µg), 3 = quercetin (50 ng), 4 = quercetin
(100 ng), 5 and 6 = spiked (200 µg + 50 ng quercetin)

96
Figure 5.7 HPTLC chromatogram (254 nm) and densitogram of BJHME with
gallic acid and vanillin
Track (T)1 = BJHME (150 µg), 2 = BJHME (200 µg), 3 = BJHME (250 µg), 4 = gallic acid
(5 µg), 5 = vanillin (50 µg), 6 = BJHME (200 µg)

97
Figure 5.8 HPTLC chromatogram (254 and 366 nm) of BJHME with quinine &
colchicine
Track (T) 1: BJHME (150 µg), 2: BJHME (200 µg), 3: quinine (500 ng), 4: quinine (1 µg), 5:
colchicine (10 µg), 6: colchicine (20 µg).
Table 5.7 Quantification of markers in BJHME by HPTLC analysis
Marker compounds Rfa Quantification in BJHME (mg/g %)b
Vanillin 0.62 2.57 ± 0.1
Sinigrin 0.47 0.7 ± 0.001
Catechin 0.15 0.06 ± 0.01
Quercetin 0.58 0.13 ± 0.02
a results based on densitometry-HPTLC, b values expressed as the mean ± standard error

98
Figure 5.9 DPPH autographic analysis of BJHME
Track (T) 1 = BJHME (200 µg), 2 = BJHME (250 µg/mL), 3 = Vitamin C (2 µg/mL), 4 =
Vitamin C (5 µg/mL), 5 = Vitamin E (4 µg/mL), 6 = Vitamin E (10 µg/mL)
99
Since the isocratic elution mode had some of the components in the sample had too
long retention times and not all the compounds in the sample could be eluted, thus
linear gradient elution was used.
Compared with other solvent systems, methanol: 10 mM KH2PO4, pH – 7, mobile-
phase system presented more powerful separation ability for the investigated
compounds with sharper peak and better peak symmetry. As a result, the solvent
system consisting of 10 mM KH2PO4, pH: 7 (a) and methanol (b) was ultimately
selected as the mobile phase system. In BJHME, not all the peaks but most of the
main peaks could be well separated by the optimum gradient elution. Since it is not
practically feasible to strive for baseline separation of all components in one run to
fulfil the identification objectives of fingerprinting of herbal medicines; the resolution
under the optimized conditions was acceptable. All marker polyphenols were
successfully separated in a single HPLC run. The peak purity of each polyphenol in
the BJHME extract was assessed by diode array detection. HPLC fingerprinting for
simultaneous detection of all compounds in BJHME was obtained at 273 nm (Figure
5.10). Selection of detection wavelength was one of the key factors contributing to a
reliable and reproducible HPLC fingerprint of BJHME. Diode array detector (DAD)
detector was applied to select the optimum wavelength.

100
Figure 5.10 HPLC-DAD fingerprint of BJHME and standards sinigrin, catechin,
vanillin, quercetin and vitamin E at 273 nm
(a) Mixture of standards; (b) BJHME showing peaks of standards sinigrin, catechin, vanillin,
quercetin and vitamin E at 5.669, 20.92, 23.538, 26.011 and 26.984 min respectively
101
Section III: Assessment of antioxidant activity of BJHME in vitro
5.7 Introduction
Due to the complexity of the composition of foods, separating each antioxidant
compound and studying it individually is costly and inefficient, notwithstanding the
possible synergistic interactions among the antioxidant compounds in a food mixture.
Since performing only one assay is not a true reflection of the antioxidant capacity of
food, there is an emerging view that a combination of rapid, sensitive and
reproducible methods should be used wherever an antioxidant screening is desired.
5.8 Methods
5.8.1 FRAP assay
The reducing power of BJHME was quantified by FRAP assay (Song et al. 2010). 1
mL extract of various concentrations (100-500 µg) prepared in distilled water. It was
then mixed with 2.5 mL of phosphate buffer (0.2M, pH 6.6), 2.5 mL of 1 % potassium
ferricyanide and incubated at 500C for 30 minutes. After incubation, 2.5 mL of
trichloroacetic acid (10% w/v) was added and centrifuged for 10 min at 6500 rpm. 2.5
mL of the supernatant was diluted with 2.5 mL water and 0.5 mL freshly prepared
ferric chloride (0.1% w/v) was added to it. The absorbance was measured at 700 nm.
The sample was replaced with water for blank. Ascorbic acid was used as positive
control. Increase in absorbance of the reaction mixture as compared to reference
solution, correspond to the reducing power. The reducing power of BJHME was
calculated using formula: percent inhibition (%) = [(A0-A1)/A0] x 100, where A0 was

102
the absorbance of the control solution and A1 was the absorbance in the presence of
the sample and standards.
5.8.2 Superoxide radical scavenging assay
The superoxide radical scavenging activity of BJHME was measured towards
superoxide anion radicals generated in a non-enzymatic phenazinemethosulfate -
nicotinamide adenine dinucleotide (PMS-NADH) system through the reaction of
PMS, NADH, and oxygen (Lau et al. 2002). Its scavenging activity was assayed by
the reduction of nitrobluetetrazolium (NBT). The superoxide anion was generated in 3
mL of Tris-HCl buffer (100 mM, pH 7.4) containing 0.75 mL of NBT (300 μM)
solution, 0.75 mL of NADH (936 μM) solution and was mixed with 0.3 mL of
different concentrations of the extract (100-500 µg). The reaction was initiated by
adding 0.75 mL of PMS (120 μM) to the mixture. After 5 min of incubation at room
temperature, the absorbance at 560 nm was measured. Ascorbic acid was used as the
positive control. The super oxide anion radical scavenging activity was calculated
using the formula: percent inhibition (%) = [(A0-A1)/A0] x 100, where A0 was the
absorbance of the control solution and A1 was the absorbance in the presence of the
sample and standards.
5.8.3 ABTS Radical Scavenging Assay
ABTS assay is based on the scavenging of light by ABTS radicals and was performed
at Natural remedies, Bangalore, India. The relatively stable ABTS radical has a green
color and is quantified spectrophotometrically. An antioxidant with an ability to
donate a hydrogen atom will quench the stable free radical, a process which is
associated with a decrease in absorbance of the radical. The assay is performed as per
method described by (Auddy et al. 2003). ABTS radical cations were produced by
reacting ABTS and APS and incubating the mixture at room temperature in dark for
16 hours. Briefly, the total reaction volume contained 10mM PBS pH 7.4, positive
control, and test solutions of various concentrations. ABTS radical solution was added

103
to a final concentration of 0.219 mM. The reaction mixture was mixed and
immediately read at 734 nm using VersaMax ELISA microplate reader (Molecular
devices, Sunnyvale, United States). A control reaction was carried out without the test
sample. The % inhibition was calculated by formula: percent inhibition (%) = [(A0-
A1)/A0] x 100, where A0 was the absorbance of the control solution and A1 was the
absorbance in the presence of the sample and standards.
5.8.4 ORAC-Hydrophillic Assay
This assay was performed at natural remedies, Bangalore, India; as per Dávalos et al.
method (Dávalos et al. 2004). A pre-incubation mixture of 140 µl contained – 20 µl of
test solution, Trolox of various concentrations, 75 mM Sodium phosphate buffer (pH
7.4); 120 µl of Sodium fluorescein (117 nM). The mixture was incubated at 370C for
10 mins. Following pre-incubation, 60 µl of AAPH (40 mM) is added and mixed for
15 seconds. The reaction was carried out for 90 minutes at 370C. The fluorescence
measurements were taken at 485 nm excitation and 520 nm emission filters. Data
reduction and ORAC value calculation was done as per Davalos et al.
5.9 Results
Antioxidant compounds from plant extract can act either by free radical scavenging,
chelating of transitional metal, as reducing agents and as activators of antioxidant
defence enzyme systems to suppress radical damage in biological system (Halliwell &
Gutteridge 2007). Thus, on the basis of the type of chemical reactions involved, major
in vitro antioxidant capacity assays can be divided into HAT reaction based assays
and ET reaction based assays (Huang et al. 2005).
DPPH scavenging activity was estimated to be 103.37 ± 4.2 µg/mg at 50% BJHME
concentration, as discussed. Ferric reducing capacity of BJHME was checked to
evaluate the reducing power. The assay involves the change of yellow color of
BJHME test solution to green depending upon its reducing power. IC50 for ferric
104
reducing power of BJHME was calculated to be 83.26 ± 1.11 µg/mg. The reducing
properties have been shown to exert antioxidant action by donating hydrogen atom to
break the free radical chain. It has been reported that, compounds with structures
containing -OH, -SH, -COOH, -PO3H2, C=O, -NR, -S- and/or -O- in a favourable
structure-function configuration show chelation activity (Yuan et al. 2005). Thus,
molecules including phenolic acids like vanillin, catechin, gallic acid, tannic acid;
glucosinolates like thiocyantaes; alkaloids like sinapic acid, sinigrin and the
flavonoids quercetin, rutin, kaempherol, isorhamnetin, and its glycoside derivatives,
many of which reported to be present in B. juncea (Kumar et al. 2011) that could be
present in the native or modified form in BJHME are noted to chelate metal ions.
Superoxide scavenging activity of BJHME in the assay was found to be 345.22 ± 5.15
µg/mg. Superoxide is generated from O2 by multiple pathways like NADPH oxidation
by NADPH oxidase, oxidation of xanthine or hypoxanthine by xanthine oxidase, or
oxidation of reducing equivalents (e.g., NADH, NADPH, and FADH2) via the
mitochondrial electron transport system. Although superoxide anion is a weak
oxidant, it gives rise to generation of powerful and dangerous hydroxyl radicals as
well as singlet oxygen, both of which contribute to oxidative stress. Scavenging of
these radicals by BJHME may contribute to stop the chain reactions initiated by ROS
species. BJHME also has an IC50 of 83.05 µg/mL in ABTS radical scavenging assay
and ORAC value of 1115 µmoles TE/g of extract. ORAC measures antioxidant
inhibition of peroxyl and hydroxyl radical induced oxidation and reflects classical
radical chain breaking antioxidant activity by H-atom transfer (Karadag et al. 2009).
5.10 Discussion
The macroscopic and microscopic examination authenticated the seeds of B.
juncea by showing typical morphological characteristics. Also, the total ash, water
soluble ash and acid-insoluble ash contents of the seeds of B. juncea has been
reported which are important indices to illustrate the quality as well as purity of herbal
drug. Total ash includes physiological ash, which is derived from the plant tissue
itself and non-physiological ash, which is often from environmental contaminations
105
such as sand and soil. B. juncea, like other herbal materials, show a variation in the
variety and contents of compounds according to differences in growing conditions,
such as soil type, climate, etc which may change the ash content depending upon
presence or absence of various contaminants thus becoming an important parameter
of quality assessment.
Further, it is well documented that phytoextracts contain free radical
scavenging molecules, such as vitamins, terpenoids, phenolic acids, lignins, stilbenes,
tannins, flavonoids, quinones, coumarins, alkaloids, amines, betalains, and other
metabolites, which are rich in antioxidant activity. The preliminary phytochemical
study of B. juncea was carried out to characterize the chemical constituents present in
the extracts following standard procedures.
The results obtained from qualitative phytochemical analysis revealed the
presence of plant biomolecules like fats, proteins, amino acids along with other
important secondary metabolites like alkaloids, flavonoids, phenolics and tannins
which are known for their varied pharmaceutical roles. The use of preliminary data
obtained was extended to extract the relevant biomolecules from the seeds.
The APAP hepatotoxicity, as discussed in the chapter 4, was due to excessive
generation of ROS resulting in damage to hepatocyte membrane, DNA fragmentation
and extensive necrosis leading to alteration of cell cycle. In APAP toxicity, the
binding of active metabolite NAPQI with GSH, resulting in glutathione depletion,
which is an intracellular antioxidant compound. This sulphur containing biomolecule
in reduced form reduces reactive oxygen species undergoing oxidation. The depletion
of GSH results in oxidative stress within the cells, which then binds to various
proteins and lipid bilayer, propagating the toxicity. The strategy behind the
phytotherapy against APAP toxicity was hence to extract phytoconstituents with
maximum antioxidant activity that can act as reducing agents against ROS
diminishing the deleterious effects. Further, phytoconstituents have been reported to
be nutritious owing to the presence of various vitamins, carotenoids, phenolics, etc
which has an added advantage along with the therapeutic effect. For the extraction
and isolation of active phytoconstituents from seeds of B. juncea, the bioassay guided
approach was used. For the preliminary antioxidant screening of the extract, a simple,

106
easy, reproducible and widely used method of DPPH scavenging assay was
performed; followed by extensive characterization of the selected extract for various
radicals scavenging potential by FRAP, ABTS, ORAC and superoxide scavenging
assays.
Mustard seeds are the biggest source of edible oil in northern part of India.
Thus, extraction using n-hexane was performed to check, if the oils released by the
method show antioxidant activity. But the fixed oils, alkanes, some terpenoids,
alkaloids, and coumarins that get extracted in non-polar solvents showed no activity
till the highest concentration of 1000 µg/ml in any of the methods. Chloroform is a
mid-polar solvent which usually extracts waxes, steroids, carotenoids, pigments and
resins. Extraction with chloroform showed very little activity with IC50 at high
concentration of 445.33 ± 11.85 µg/ml with soxhlet method; whereas, method of cold
maceration and ultrasonication resulted in even lesser activity. It is also known, that
flavonoid glycosides, tannins, some alkaloids and other pharmacologically active
compounds are usually extracted in polar solvent systems. Extraction with methanol
gave moderate activity of 153.33 ± 15.03 µg/ml with soxhlet extraction, 173.33 ±
11.39 µg/ml with cold maceration and 186 ± 15 µg/ml with method of ultrasonication.
Extraction of seeds by alcohol resulted in significantly higher activity as compared to
n-hexane and chloroform (p≤0.05). Alcohols are more efficient in penetrating cell
walls and seed degradation and cause polyphenols to be released from cells (Tiwari et
al. 2011). It was observed, that with methanol (polarity index 5.1) all the three method
resulted in non-significant difference in activity. Hence to isolate the antioxidant
fraction, the method of soxhlet was further extended to be used for successive
extraction. It was observed that with soxhlet method of extraction, the yield of n-
hexane extract was 27.5 ± 1.65% and chloroform extract was 11.1 ± 0.26% with
minimal activity (Table 5.4). Thus, it was presumed that the successive extraction of
seeds by n-hexane and chloroform, would result in removal of approximately 35-40%
inactive fraction, and final extraction by methanol to obtain the active fraction with
higher activity. However, it was observed that, with the removal of inactive fraction,
the activity of methanol fraction reduced. The activity of methanolic fraction obtained
as a result of successive extraction (IC50 = 268 ± 9.87 µg/ml) was lower than the
activity of methanolic extract obtained after the single solvent extraction (IC50 =
153.33 ± 15.03 µg/ml). This could be due to possible synergism among the
107
phytoconstitents. It has been well reported in the study of plant extracts, that the
effects observed with plants is usually due to the combined effect of all the
phytoconstituents present in it. Thus, with successive extraction, the removal of other
fractions could have resulted in the loss of combined effect contributed by the other
fractions resulting in reduction of activity. Further, the low activity derived with
soxhlet method could be because of thermal degradation of parent compounds present
in seeds, generated because of successive exposure to hot solvent vapors. Since, the
hot successive extraction method did not improve the antioxidant capacity
significantly; the next approach was to modify solvents used in cold maceration
technique. To improve the activity of extract obtained using methanol by cold
maceration, methanol was combined with different proportions of distilled water.
Water is a good solvent to extract plant polyphenols as it offers high solubility, it is
less toxic and inexpensive compared to other organic solvents. It was observed that,
extraction with 80% methanol in water improved the antioxidant activity of the
extract (section 5.9). The higher activity of the hydroalcoholic extract could be due to
the presence of higher amounts of polyphenols that could be extracted due to
combined effect of high solubility offered by water and high cell-penetration power of
alcohol. Hydroalcoholic mixtures are also completely miscible further suited for the
extraction of the active principles from the seeds.
This extract obtained with 80% methanol by cold maceration was termed
Brassica juncea hydroalcoholic extract referred to as BJHME. Next, BJHME was
subjected to column extraction following a gradient of n-hexane, 50% n-hexane +
50% chloroform, chloroform, 50% chloroform + 50% methanol and methanol. The
similar results were observed with the separation of phytoconstituents by column
chromatography, the activity of the extract reduced, and became undetectable by
DPPH autographic analysis. Thus, for the analysis of hepatoprotective potential,
BJHME was used, since it resulted in maximum activity at minimum concentration
(IC50 = 102.67 ± 3.18 µg/ml).
Dietary antioxidants, including polyphenolic compounds, vitamins e and c and
carotenoids, are believed to be the effective nutrients in the prevention of these
oxidative stress related diseases (Huang et al. 2005). With the objective of
supplementing the cells with natural antioxidants under the situations of GSH

108
depletion, an important effort was dedicated to identify and characterize BJHME for
its antioxidant activity, which may aid in understanding the probable effect it has on
HepG2 cells under APAP induced oxidative stress. It was observed that seeds possess
variety of radical scavenging potential in ET and HAT based assays. Also, earlier
studies on mustard seed meal report similar findings on mustard seeds exhibiting
antioxidant potential (Singh & Malik 2011; Dubie et al. 2013). The leaves of mustard
are also reported to possess antioxidant activity (Nouairi et al. 2008; Kim et al. 2003)
and has been reported to be related other therapeutic effects it exerts on
streptozotocin-induced diabetic rats (Yokozawa et al. 2002). Peroxynitrite radical
scavenging potential of mustard has been used in isolation of active phytoconstituents
like isorhamnetin (Choi et al. 2002) and sinapic acid (Zou et al. 2002). BJHME also
exhibited radical scavenging and reducing potential in in vitro assays. Cabbage,
broccoli and cauliflower belongs to the family Brassicaceae as that of mustard Table
5.8.
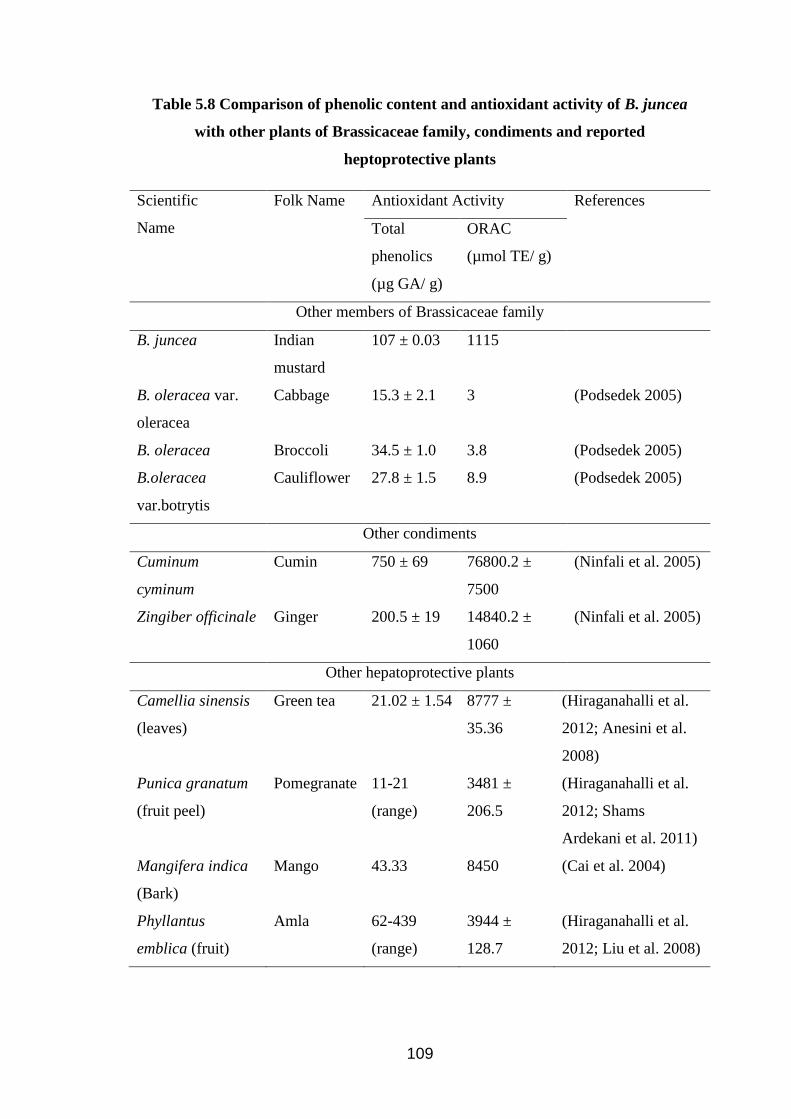
Brassica vegetables show antioxidant activity of 3-8.9 µmol TE/g as versus
BJHME (1115µmol TE/g). Also these plants possess almost one fifth or lesser content
of total phenolics compared to Indian mustard seeds as reported by Podsedek, 2005.
When compared with other spices and condiments used in dressings in variety of
Indian cuisines such as cumin and ginger, BJHME also showed strong antioxidant
capacity, justifying the use of seeds for various ailments by traditional practitioners.
Further, phenolics are not sole the source of antioxidant activity supported by the fact
that the plants known for exhibiting hepatoprotective potential like green tea,
pomegranate, mango and amla show high antioxidant activity, in spite of having
lesser phenolic content Table 5.8. Mustard meal has been reported to be a good source
of phenolic compounds. More than a dozen phenolic acid conjugates have been
reported and the spectrum of phenolics is also unique and broad (Cartea et al. 2011).
The antioxidant capacity of Brassica species has been related to their phenolic profile
and content, particularly flavonoids, since phenolic compounds have demonstrated a
higher antioxidant activity than vitamins and carotenoids (Cartea et al. 2011).
109
Table 5.8 Comparison of phenolic content and antioxidant activity of B. juncea
with other plants of Brassicaceae family, condiments and reported
heptoprotective plants
Scientific
Name
Folk Name Antioxidant Activity References
Total
phenolics
(µg GA/ g)
ORAC
(µmol TE/ g)
Other members of Brassicaceae family
B. juncea Indian
mustard
107 ± 0.03 1115
B. oleracea var.
oleracea
Cabbage 15.3 ± 2.1 3 (Podsedek 2005)
B. oleracea Broccoli 34.5 ± 1.0 3.8 (Podsedek 2005)
B.oleracea
var.botrytis
Cauliflower 27.8 ± 1.5 8.9 (Podsedek 2005)
Other condiments
Cuminum
cyminum
Cumin 750 ± 69 76800.2 ±
7500
(Ninfali et al. 2005)
Zingiber officinale Ginger 200.5 ± 19 14840.2 ±
1060
(Ninfali et al. 2005)
Other hepatoprotective plants
Camellia sinensis
(leaves)
Green tea 21.02 ± 1.54 8777 ±
35.36
(Hiraganahalli et al.
2012; Anesini et al.
2008)
Punica granatum
(fruit peel)
Pomegranate 11-21
(range)
3481 ±
206.5
(Hiraganahalli et al.
2012; Shams
Ardekani et al. 2011)
Mangifera indica
(Bark)
Mango 43.33 8450 (Cai et al. 2004)
Phyllantus
emblica (fruit)
Amla 62-439
(range)
3944 ±
128.7
(Hiraganahalli et al.
2012; Liu et al. 2008)

110
Brassicaceae vegetables represent an important part of the human diet
worldwide and are considered important food crops in China, Japan, India and
European countries. Various classes of phytoconstituents from seeds of B. juncea
were also detected via qualitative analysis. B. juncea are known to produce several
classes of bioactive phytochemicals including glycosides, flavonoids, phenolic
compounds, sterols, triterpene alcohols, glucosinolates, proteins and carbohydrates.
The available pre-clinical information on this easily cultivable and edible plant
strongly suggests that it could be a sustainable source of affordable nutraceuticals or
drugs. The beneficial effects of Brassica vegetables on health improvement have been
partly attributed to their complex mixture of phytochemicals possessing antioxidant
activity(Cartea et al. 2011). In the present work, the extraction procedure was
standardized based on evaluations of DPPH activity as a preliminary tool. Recent
reports suggest that cruciferous vegetables act as a good source of natural antioxidants
due to their high levels of carotenoids, tocopherols and ascorbic acid (Cartea et al.
2011).