Chapter 5: Interference and Diffraction - University of...
16
Physics 341 Experiment 5 Page 5-1 Chapter 5: Interference and Diffraction 5.1 Introduction Interference and diffraction are common phenomena intrinsic to wave propagation. Interference refers to the effects caused by the coherent addition of wave amplitudes that travel different paths. If such waves are in phase, the light intensity is enhanced; conversely if they are out of phase, the light is attenuated. Diffraction is the result of wave propagation that spreads a beam of light from a straight linear path. The origin of the two phenomena is, in any case, exactly the same. The following experiments are arranged in order of increasing complexity. This may blur the distinction in your mind between the two phenomena of interference and diffraction. That’s not entirely a bad idea, as they are so closely related. Figure 5.1 “Snapshot” of a wave Figure 5.2 The amplitude of two waves, 180 o out of phase. For most of the following exercises, you will observe diffraction and interference patterns generated by a He-Ne laser beam incident on a variety of targets. These come in two forms: 2” x 2” squares such as 35-mm mounted film transparencies and rotating plastic disks imprinted with a number of selectable patterns. These are listed with dimensions in Table 5.1 and Table 5.2 below. The laser operating wavelength is 632.8 nm. With these numbers, you can compare experimental observations with theoretical estimates. A list of targets is given in Table 5.1 Note that most of the photographic targets are available as complementary pairs of positive and negative, i.e., where the positive target is transparent, the negative one is opaque and vice-versa. The diffraction patterns from either of these are indistinguishable except for the presence or absence of the undiffracted beam. One reason for providing this two-fold multiplicity is to convince you that the patterns you see are quite distinct from geometric shadowing.
Transcript of Chapter 5: Interference and Diffraction - University of...
Physics 341 Experiment 5 Page 5-1
Chapter 5: Interference and Diffraction
5.1 Introduction
Interference and diffraction are common phenomena intrinsic to wave propagation. Interference refers to the effects caused by the coherent addition of wave amplitudes that travel different paths. If such waves are in phase, the light intensity is enhanced; conversely if they are out of phase, the light is attenuated. Diffraction is the result of wave propagation that spreads a beam of light from a straight linear path. The origin of the two phenomena is, in any case, exactly the same. The following experiments are arranged in order of increasing complexity. This may blur the distinction in your mind between the two phenomena of interference and diffraction. That’s not entirely a bad idea, as they are so closely related.
Figure 5.1 “Snapshot” of a wave
Figure 5.2 The amplitude of two waves, 180o out of phase.
For most of the following exercises, you will observe diffraction and interference patterns generated by a He-Ne laser beam incident on a variety of targets. These come in two forms: 2” x 2” squares such as 35-mm mounted film transparencies and rotating plastic disks imprinted with a number of selectable patterns. These are listed with dimensions in Table 5.1 and Table 5.2 below. The laser operating wavelength is 632.8 nm. With these numbers, you can compare experimental observations with theoretical estimates. A list of targets is given in Table 5.1 Note that most of the photographic targets are available as complementary pairs of positive and negative, i.e., where the positive target is transparent, the negative one is opaque and vice-versa. The diffraction patterns from either of these are indistinguishable except for the presence or absence of the undiffracted beam. One reason for providing this two-fold multiplicity is to convince you that the patterns you see are quite distinct from geometric shadowing.
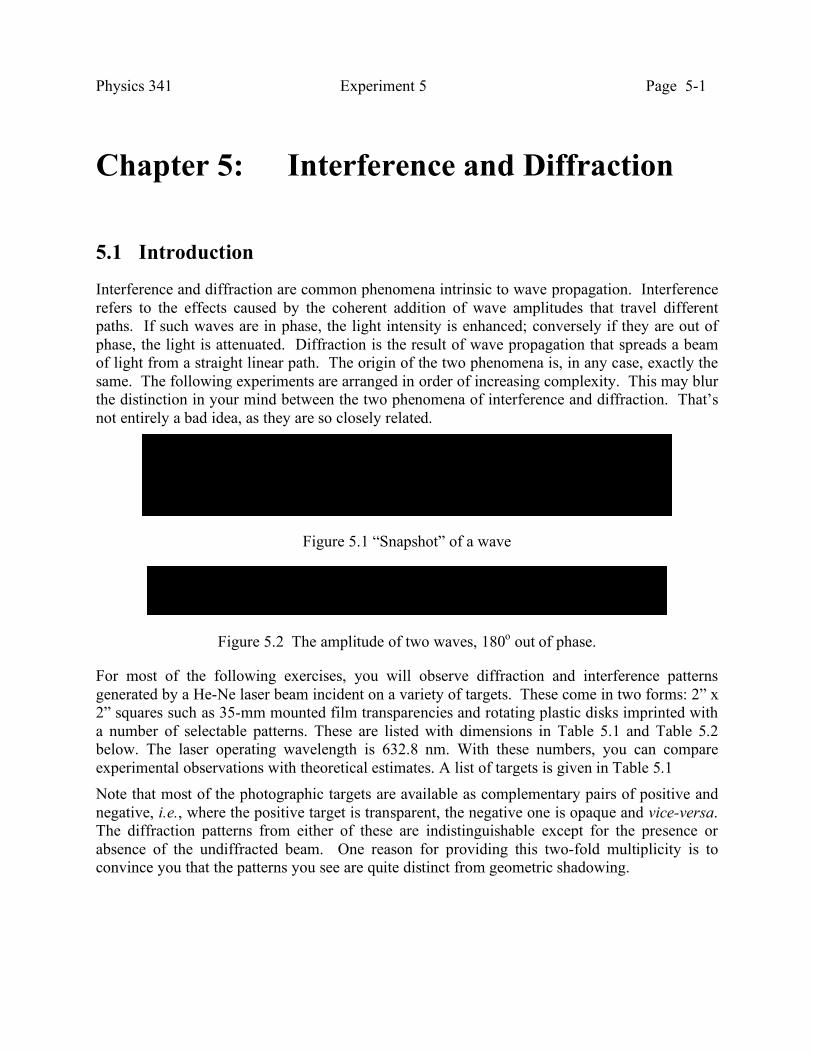
Physics 341 Experiment 5 Page 5-2 Table 5.1 Photographic film diffraction and interference targets.
10 micron single slit 25 micron single slit 50 micron single slit 25 micron diameter circular aperture 50 micron diameter circular aperture 100 micron diameter circular aperture 21 1 dimensional diffraction grating (+) 22 1 dimensional diffraction grating (-) 23 2 dimensional diffraction grating (+) 24 2 dimensional diffraction grating (-) 25 51 ring Fresnel zone plate (+) 26 51 ring Fresnel zone plate (-) diffraction grating replica
Table 5.2 Rotating wheel diffraction and interference targets.
PASCO Single Slit Disk PASCO Multiple Slit Disk 20 µ width single slit 40 µ width/250 µ spacing double slit 40 µ width single slit 40 µ width/500 µ spacing double slit 80 µ width single slit 80 µ width/250 µ spacing double slit 160 µ width single slit 80 µ width/500 µ spacing double slit 20 – 200 µ variable width single slit 40 µ width/125 - 750 µ variable spacing double slit square pattern 40 µ width single slit vs. 40 µ/250 µ double slit hexagonal pattern 40 µ/250 µ double slit vs. 40 µ/500 µ double slit 60 µ diameter random opaque dots 40 µ/250 µ double slit vs. 80 µ/250 µ double slit 60 µ diameter random holes 40 µ/125 µ double slit vs. 40 µ/125 µ triple slit 80 µ width line 40 µ width/125 µ spacing double slit 40 µ width line/slit comparison 40 µ width/125 µ spacing triple slit 200 µ diameter circular aperture 40 µ width/125 µ spacing quadruple slit 400 µ diameter circular aperture 40 µ width/125 µ spacing quintuple slit
The direct unscattered laser beam is sometimes bright enough to obscure the diffraction pattern; you can use a small patch of black tape over the beam spot to kill most of this light. It is a good idea to take a careful look at the targets with a good light behind to understand what each is. (A magnifying glass or optical comparator will help.) Also, note the sequence on the wheels, as the labels are hard to read when they are mounted. The targets on the wheels are hard to align, so it’s best to do all you can with the slides first.
Physics 341 Experiment 5 Page 5-3
5.2 Newton’s Rings Most everyone has noticed the spectrum of colors in light reflected by thin soap bubbles or traces of oil on water. The same effect can be experienced with two glass surfaces in close contact. The arrangement is schematically shown in Figure 5.3. In such cases, the alternate light and dark bands called Newton’s rings are visible. Although an annoying nuisance for darkroom photographers, they nicely demonstrate the essential wave nature of light and give people an appreciation for the dimensions of a wavelength – small, but not infinitesimal. To see the effect, look at incident light reflected from the interface between two microscope slides. (Clean the glass carefully to remove fingerprints first.) By applying a bit of pressure to the glass, the bands will move as the spacing changes. The apparatus for this experiment consists of a pair of optically polished glass plates, one plane and the other plano-convex mounted together in a metal frame. Pressure between plates can be adjusted by turning three screws. Light and dark bands are formed due to the varying separation between the two plates. By changing pressure to the glass, the bands will move as the spacing changes.
• Explain why the bands are colored.
Figure 5.3: Interference of rays from the interface between two microscope slides.
Figure 5.4: The amplitudes of waves that are uniformly spaced in phase add to zero. The pairs indicated by arrows are 180° out of phase.
Physics 341 Experiment 5 Page 5-4
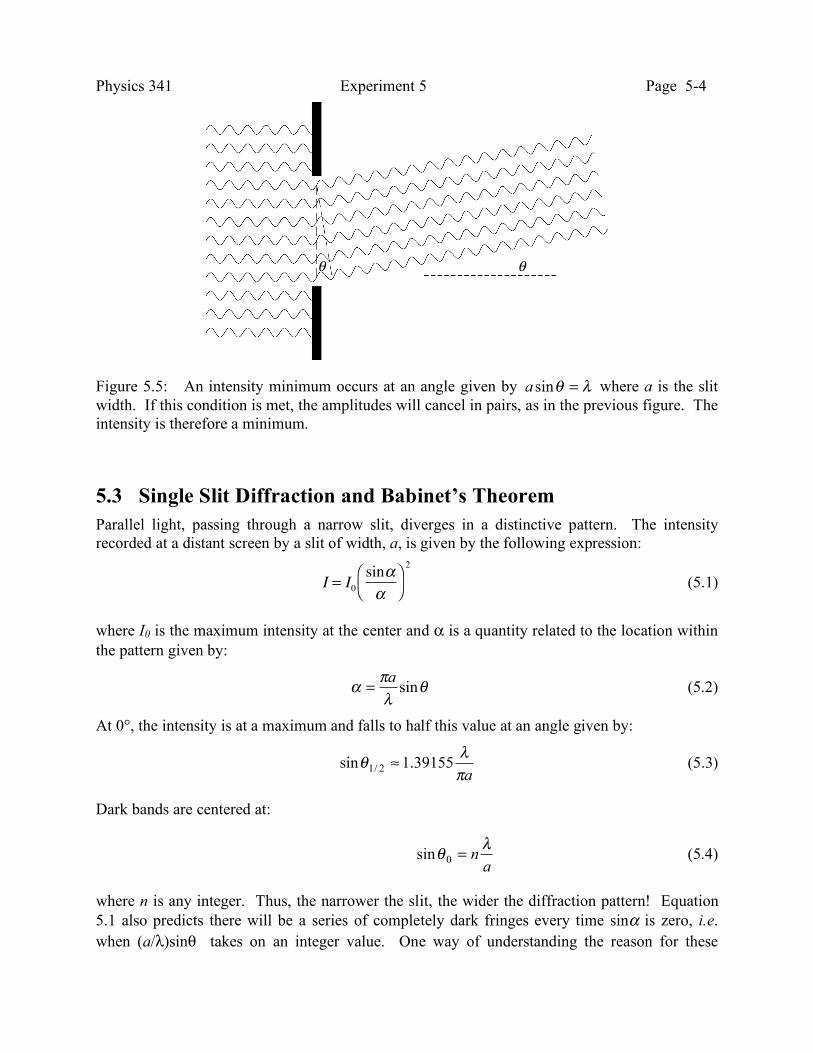
Figure 5.5: An intensity minimum occurs at an angle given by !" =sina where a is the slit width. If this condition is met, the amplitudes will cancel in pairs, as in the previous figure. The intensity is therefore a minimum.
5.3 Single Slit Diffraction and Babinet’s Theorem Parallel light, passing through a narrow slit, diverges in a distinctive pattern. The intensity recorded at a distant screen by a slit of width, a, is given by the following expression:
I = I0
sin!!
"
#
$
%
2
(5.1)
where I0 is the maximum intensity at the center and α is a quantity related to the location within the pattern given by:
!"
#$ sin
a= (5.2)
At 0°, the intensity is at a maximum and falls to half this value at an angle given by:
a!
"# 39155.1sin
2/1$ (5.3)
Dark bands are centered at:
an!
" =0
sin (5.4)
where n is any integer. Thus, the narrower the slit, the wider the diffraction pattern! Equation 5.1 also predicts there will be a series of completely dark fringes every time sinα is zero, i.e. when (a/λ)sinθ takes on an integer value. One way of understanding the reason for these
θ θ
Physics 341 Experiment 5 Page 5-5 minima is shown in Figures 5.4 and 5.5. Assume we are observing light diffracted by a slit at an angle given by a sinθ=λ. The amplitude contributions from separate parts of the wavefront will cancel in pairs leading to a total of zero. The variation of the amplitude with angle is shown as the dashed curve in Fig. 5.6 with
x ! "asin# /$ .
• Use the He-Ne laser as a light source and several different slide-mounted slits as targets. Tape a piece of white paper to the aluminum screen to mark the position of the diffraction minima (the screen itself does not reflect enough light to show the pattern very well). Measure the angles of several diffraction minima for each of the 50, 25, and 10 micron slits. Make a table comparing the measured angles with those predicted from Eq. 5.4.
• In the absence of any slit, the screen would only be illuminated by the direct undiffracted beam. If the slit target is replaced by an obstructing line of equal width, a new diffraction pattern will be formed. However, since the sum of the amplitudes from these two configurations must be exactly zero, it follows that the obstructing line pattern must be the same as for the equal width slit. A generalization of this principle is called Babinet’s theorem. Verify that this is correct.
• Try measuring the diameter of a human hair using the methods outlined above.
5.4 Diffraction from a Circular Aperture We have seen in Section 5.3 the diffraction pattern formed by a long parallel slit. A geometry with more practical application is the diffraction of a plane wave by a circular aperture since this sets the resolution limits of most optical instruments. For a hole diameter, d, the diffracted intensity is given by:
2
10
)(2!"#
$%&
=''J
II (5.5)
where J1 is a sinusoidal-like curve called a Bessel function and δ is defined by:
!"
#$ sin
d= (5.6)
Physics 341 Experiment 5 Page 5-6
Figure 5.6: The amplitude dependence of a circular aperture as a function of !"
#sin
d . The
dashed line shows the equivalent amplitude for a long rectangular parallel slit. The amplitude dependence responsible for this intensity behavior is shown in Figure 5.6. Superficially the shape is quite similar to the behavior for a long rectangular slit. However, the Bessel function J1 decreases asymptotically to zero for large arguments, making the intensity faint and difficult to detect. The first three minima1 occur at δ = 3.83171, 7.01559, 10.17347 (compare with Equation 5.1 for which the zeroes are π, 2π, 3π, ...).
• Using the He-Ne laser as a light source, observe the diffraction pattern produced by circular apertures with diameters 100, 50, 25 microns. Measure the radius for the first several minima and make a table comparing them with the expected angles.
• The human eye has a aperture of 2 mm and the Hubble Space Telescope has an aperture of 2400 mm. Estimate the diffraction limited angular resolution of both instruments.
5.5 Double Slit Interference In Section 5.3, you investigated the diffraction pattern from a single slit. What happens if instead of one slit, there are two, closely spaced? As can be seen in Figure 5.7, the amplitudes from the two slits will undergo a relative phase delay since one ray must travel a slightly greater
1 Bessel functions such as J1 are solutions of the wave equation for a freely vibrating drumhead. The non-uniform spacing of the zeroes means that drum overtones lack the simple harmonic structure characteristic of string and wind instruments.
Physics 341 Experiment 5 Page 5-7 distance to some distant point. This extra distance is !sinb for a slit separation, b, and the associated phase difference is !"# sin)/2( b . The total amplitude is the sum of two terms:
)sin2
sin()sin( 00 tb
kzAtkzAATOT
!"#
$! %++%= (5.7)
which can be rewritten as:
!"#
$%& '+!
"#
$%&
= tb
kzb
AATOT
()*+
)*+
sinsinsincos20
(5.8)
Since light intensity is proportional to the square of the amplitude, maxima and minima will be observed for !" nb =sin and !" )2/1(sin += nb respectively where n is any integer. The intensity distribution is easily obtained from Equation 5.8:
2
0
2
0sin
2sincos4 !!
"
#$$%
&==
''
' III (5.9)
where .sin)/( !"#$ b= Note that this function is exactly periodic. This analysis has not included the single slit diffraction effects described by Equation 5.1. The combined modulation of both phenomena is described by:
22
0sin
2sinsin
!!"
#$$%
&!"#
$%&
=''
((
II (5.10)
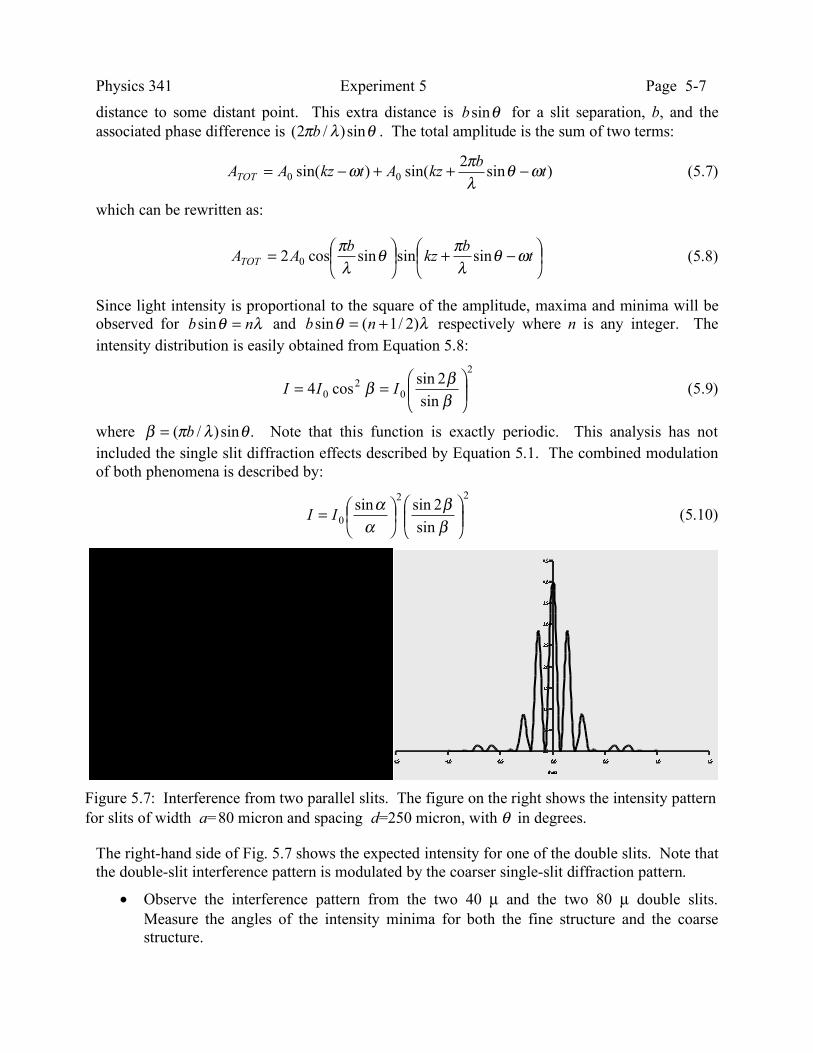
Figure 5.7: Interference from two parallel slits. The figure on the right shows the intensity pattern for slits of width a=80 micron and spacing d=250 micron, with θ in degrees.
The right-hand side of Fig. 5.7 shows the expected intensity for one of the double slits. Note that the double-slit interference pattern is modulated by the coarser single-slit diffraction pattern.
• Observe the interference pattern from the two 40 µ and the two 80 µ double slits. Measure the angles of the intensity minima for both the fine structure and the coarse structure.
θ
Physics 341 Experiment 5 Page 5-8
• Compare the coarser structure with that for single slits with similar widths.
• Make a table comparing both the fine structure and coarse structure with the predicted minima. Use the Excel spreadsheet program provided on the lab computers to plot the intensity patterns expected and mark where your minima appear.
5.6 Multiple Slit Interference The same basic procedure used to calculate the intensity for two parallel slits can be easily generalized to N slits. The result is:
22
0sin
sinsin
!!"
#$$%
&!"#
$%&
=''
(( N
II (5.11)
where !"#$ sin)/( a= and !"#$ sin)/( b= with the definitions for a and b as given in the previous sections. The effect of adding more slits is to make the bright bands narrower with a width proportional to 1/N. Try to verify the general predictions of Eq. 5.11 using various numbers of parallel slits. Compare your results with the Excel spreadsheet predictions.
5.7 Interference Effects with CD-ROM Disks • CD-ROMs store information in grooves etched in aluminized plastic. Measure the
spacing of these grooves by using the disk as a reflective diffraction grating. (The setup and equation are similar to that in Sect. 5.11 for lines on a ruler.)
• The optical device used to detect the etch pattern in current CD-ROM readers is a solid state laser operating at a wavelength of 675 nm. A good deal of money has been spent on developing a blue laser with a wavelength of 450 nm for such purposes. Can you explain why there is such commercial interest?
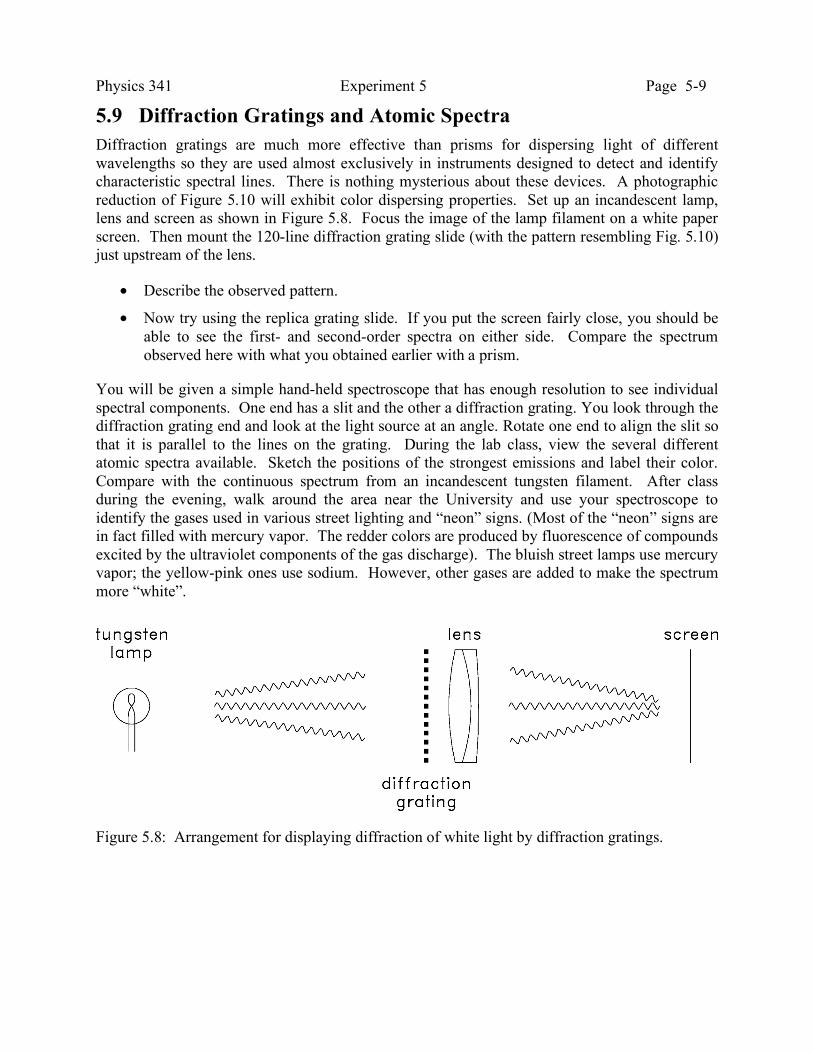
5.8 Two-dimensional Diffraction A slide with a periodic two-dimensional pattern is available (see Figure 5.11). Examine the diffraction pattern with the He-Ne laser. How does it differ from the one-dimensional arrays of straight lines? Use the incandescent lamp as a source with an achromatic 200 mm focal length lens just downstream of the mask as shown in Figure 5.8. Make the lamp to screen distance as large as possible. Adjust the position of a focusing screen to image the lamp filament. Look for a “rainbow” image of the filament on either side.
• Sketch the pattern observed and compare with the target mask. Are the shortest distances in the diffraction pattern along the same axis as the narrowest structure in the mask?
Physics 341 Experiment 5 Page 5-9
5.9 Diffraction Gratings and Atomic Spectra Diffraction gratings are much more effective than prisms for dispersing light of different wavelengths so they are used almost exclusively in instruments designed to detect and identify characteristic spectral lines. There is nothing mysterious about these devices. A photographic reduction of Figure 5.10 will exhibit color dispersing properties. Set up an incandescent lamp, lens and screen as shown in Figure 5.8. Focus the image of the lamp filament on a white paper screen. Then mount the 120-line diffraction grating slide (with the pattern resembling Fig. 5.10) just upstream of the lens.
• Describe the observed pattern.
• Now try using the replica grating slide. If you put the screen fairly close, you should be able to see the first- and second-order spectra on either side. Compare the spectrum observed here with what you obtained earlier with a prism.
You will be given a simple hand-held spectroscope that has enough resolution to see individual spectral components. One end has a slit and the other a diffraction grating. You look through the diffraction grating end and look at the light source at an angle. Rotate one end to align the slit so that it is parallel to the lines on the grating. During the lab class, view the several different atomic spectra available. Sketch the positions of the strongest emissions and label their color. Compare with the continuous spectrum from an incandescent tungsten filament. After class during the evening, walk around the area near the University and use your spectroscope to identify the gases used in various street lighting and “neon” signs. (Most of the “neon” signs are in fact filled with mercury vapor. The redder colors are produced by fluorescence of compounds excited by the ultraviolet components of the gas discharge). The bluish street lamps use mercury vapor; the yellow-pink ones use sodium. However, other gases are added to make the spectrum more “white”.
Figure 5.8: Arrangement for displaying diffraction of white light by diffraction gratings.
Physics 341 Experiment 5 Page 5-10
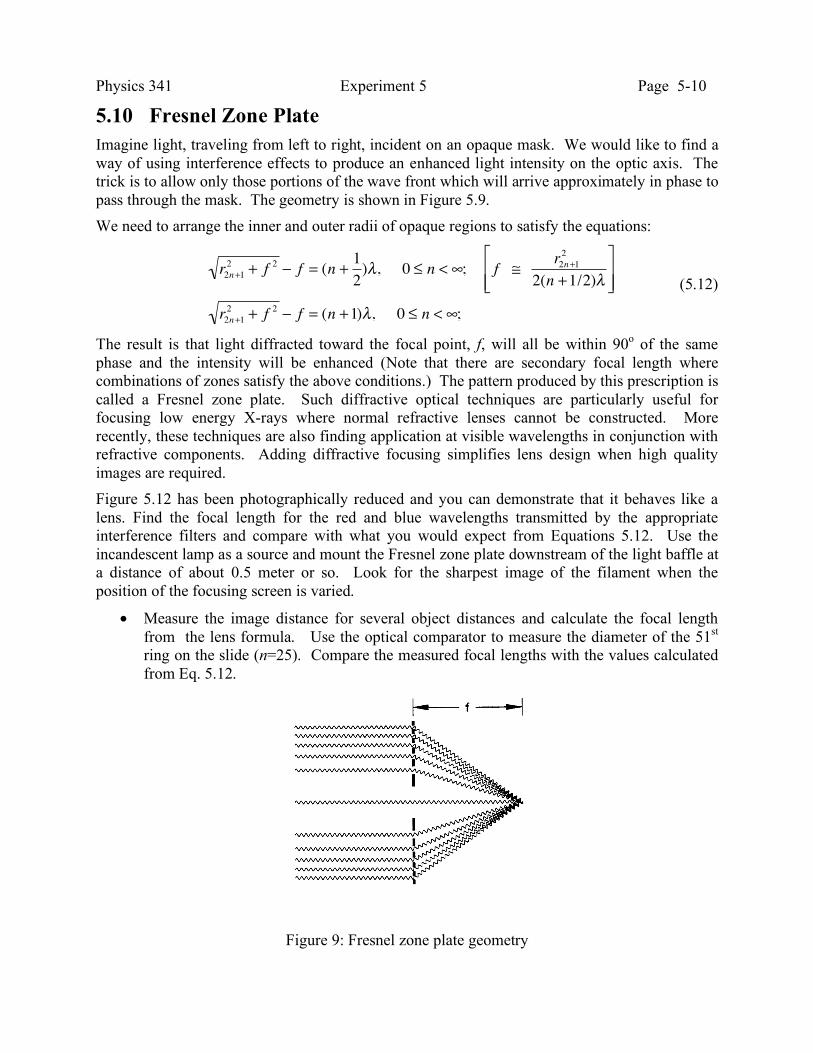
5.10 Fresnel Zone Plate Imagine light, traveling from left to right, incident on an opaque mask. We would like to find a way of using interference effects to produce an enhanced light intensity on the optic axis. The trick is to allow only those portions of the wave front which will arrive approximately in phase to pass through the mask. The geometry is shown in Figure 5.9. We need to arrange the inner and outer radii of opaque regions to satisfy the equations:
r2n+1
2+ f
2 ! f = (n +1
2)", 0 # n < $; f %
r2n+1
2
2(n + 1/2)"
&
'
( (
)
*
+ +
r2n+1
2+ f
2 ! f = (n + 1)", 0 # n < $;
(5.12)
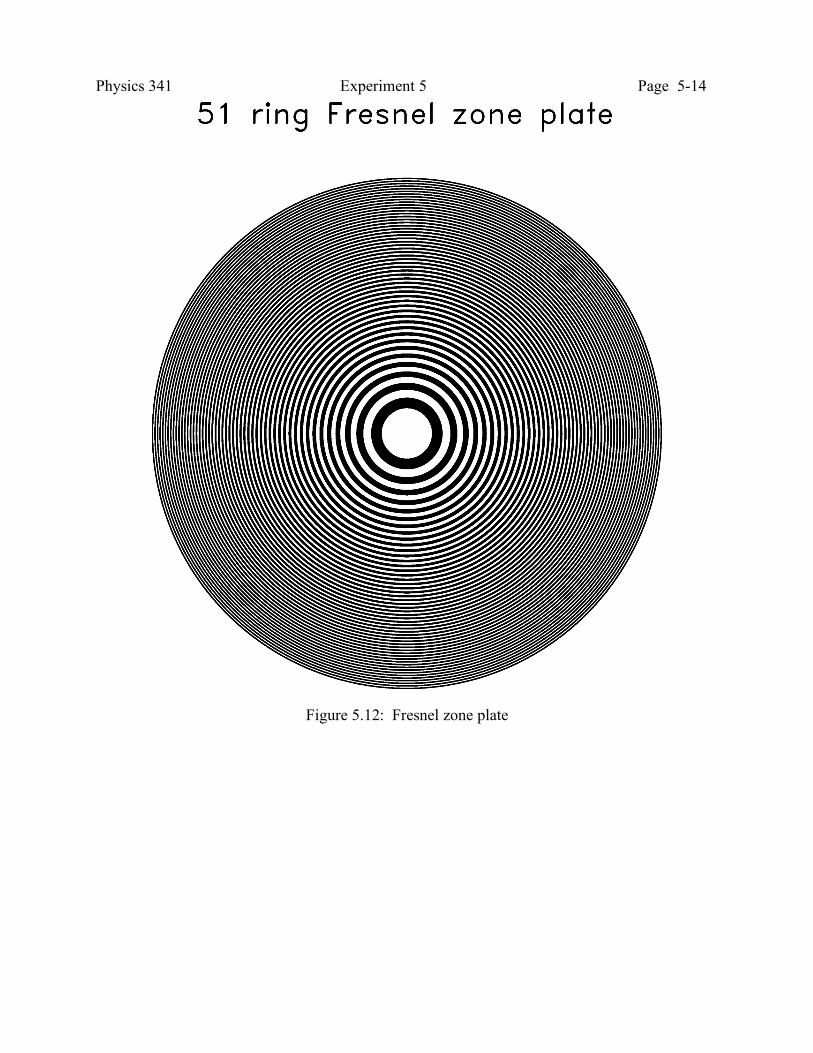
The result is that light diffracted toward the focal point, f, will all be within 90o of the same phase and the intensity will be enhanced (Note that there are secondary focal length where combinations of zones satisfy the above conditions.) The pattern produced by this prescription is called a Fresnel zone plate. Such diffractive optical techniques are particularly useful for focusing low energy X-rays where normal refractive lenses cannot be constructed. More recently, these techniques are also finding application at visible wavelengths in conjunction with refractive components. Adding diffractive focusing simplifies lens design when high quality images are required. Figure 5.12 has been photographically reduced and you can demonstrate that it behaves like a lens. Find the focal length for the red and blue wavelengths transmitted by the appropriate interference filters and compare with what you would expect from Equations 5.12. Use the incandescent lamp as a source and mount the Fresnel zone plate downstream of the light baffle at a distance of about 0.5 meter or so. Look for the sharpest image of the filament when the position of the focusing screen is varied.
• Measure the image distance for several object distances and calculate the focal length from the lens formula. Use the optical comparator to measure the diameter of the 51st ring on the slide (n=25). Compare the measured focal lengths with the values calculated from Eq. 5.12.
Figure 9: Fresnel zone plate geometry
Physics 341 Experiment 5 Page 5-11
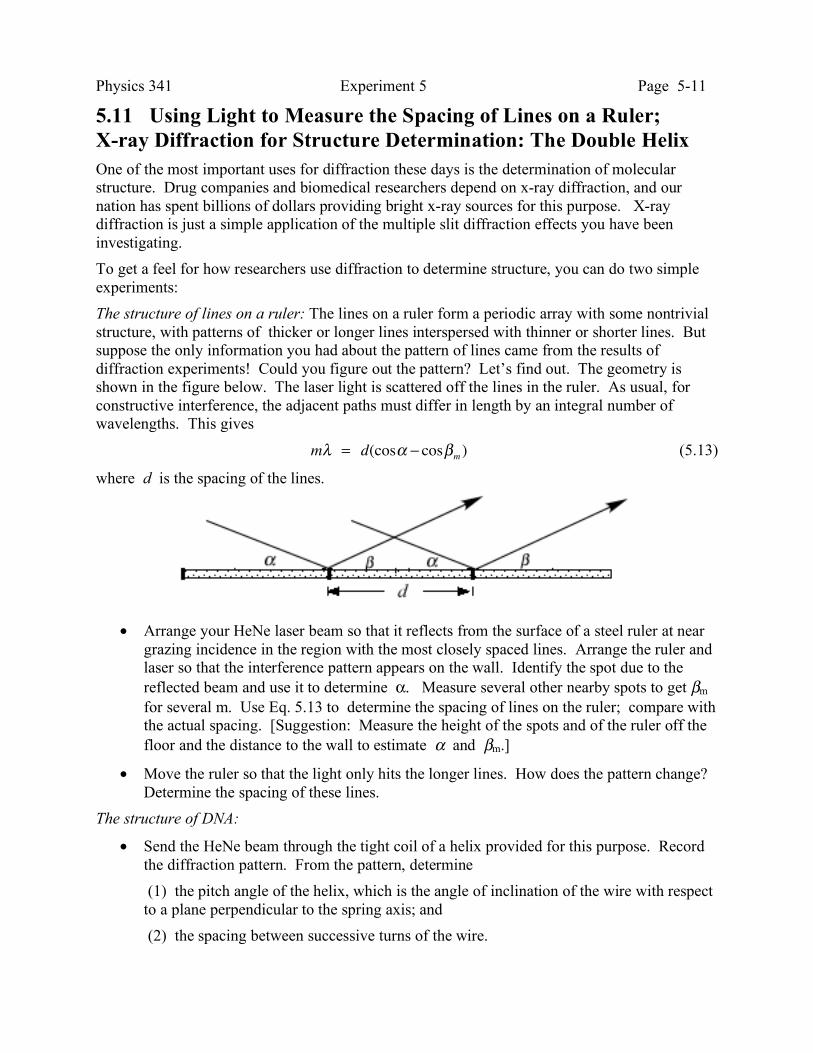
5.11 Using Light to Measure the Spacing of Lines on a Ruler; X-ray Diffraction for Structure Determination: The Double Helix One of the most important uses for diffraction these days is the determination of molecular structure. Drug companies and biomedical researchers depend on x-ray diffraction, and our nation has spent billions of dollars providing bright x-ray sources for this purpose. X-ray diffraction is just a simple application of the multiple slit diffraction effects you have been investigating. To get a feel for how researchers use diffraction to determine structure, you can do two simple experiments: The structure of lines on a ruler: The lines on a ruler form a periodic array with some nontrivial structure, with patterns of thicker or longer lines interspersed with thinner or shorter lines. But suppose the only information you had about the pattern of lines came from the results of diffraction experiments! Could you figure out the pattern? Let’s find out. The geometry is shown in the figure below. The laser light is scattered off the lines in the ruler. As usual, for constructive interference, the adjacent paths must differ in length by an integral number of wavelengths. This gives
m! = d(cos" # cos$m
) (5.13)
where d is the spacing of the lines.
• Arrange your HeNe laser beam so that it reflects from the surface of a steel ruler at near
grazing incidence in the region with the most closely spaced lines. Arrange the ruler and laser so that the interference pattern appears on the wall. Identify the spot due to the reflected beam and use it to determine α. Measure several other nearby spots to get βm for several m. Use Eq. 5.13 to determine the spacing of lines on the ruler; compare with the actual spacing. [Suggestion: Measure the height of the spots and of the ruler off the floor and the distance to the wall to estimate α and βm.]
• Move the ruler so that the light only hits the longer lines. How does the pattern change? Determine the spacing of these lines.
The structure of DNA:
• Send the HeNe beam through the tight coil of a helix provided for this purpose. Record the diffraction pattern. From the pattern, determine (1) the pitch angle of the helix, which is the angle of inclination of the wire with respect to a plane perpendicular to the spring axis; and (2) the spacing between successive turns of the wire.
Physics 341 Experiment 5 Page 5-12 Explain how you determined these and compare with the pitch and turn spacing of the actual helix.
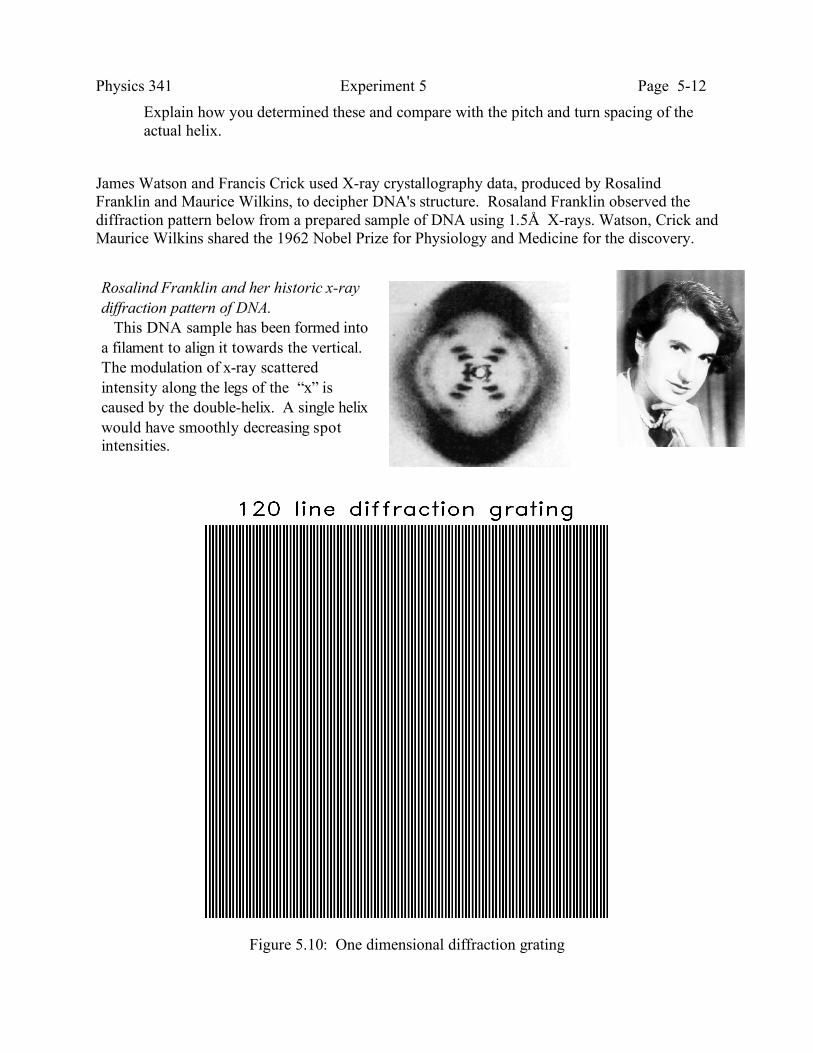
James Watson and Francis Crick used X-ray crystallography data, produced by Rosalind Franklin and Maurice Wilkins, to decipher DNA's structure. Rosaland Franklin observed the diffraction pattern below from a prepared sample of DNA using 1.5Å X-rays. Watson, Crick and Maurice Wilkins shared the 1962 Nobel Prize for Physiology and Medicine for the discovery.
Figure 5.10: One dimensional diffraction grating
Rosalind Franklin and her historic x-ray diffraction pattern of DNA. This DNA sample has been formed into a filament to align it towards the vertical. The modulation of x-ray scattered intensity along the legs of the “x” is caused by the double-helix. A single helix would have smoothly decreasing spot intensities.
Physics 341 Experiment 5 Page 5-13
Figure 5.11: Two-dimensional diffraction grating
Physics 341 Experiment 5 Page 5-14
Figure 5.12: Fresnel zone plate
Physics 341 Experiment 5 Page 5-15
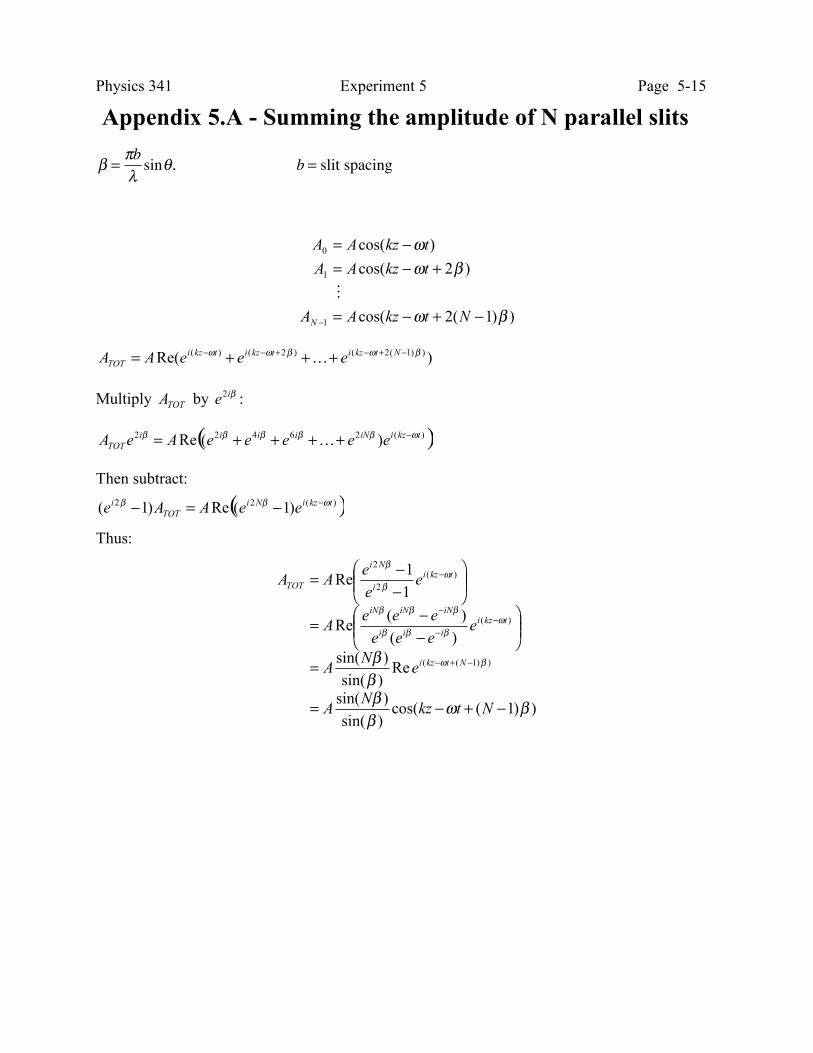
Appendix 5.A - Summing the amplitude of N parallel slits
! ="b
#sin$, b = slit spacing
))1(2cos(
)2cos(
)cos(
1
1
0
!"
!"
"
#+#=
+#=
#=
# NtkzAA
tkzAA
tkzAA
N
!
)Re( ))1(2()2()( !"!"" #+#+##+++=
Ntkzitkzitkzi
TOTeeeAA …
Multiply TOTA by !i
e2 :
( ))(26422 )(Re tkziiNiiii
TOTeeeeeAeA
!""""" #++++= …
Then subtract:
( ))(22 )1(Re)1( tkziNi
TOT
ieeAAe
!"" ##=#
Thus:
))1(cos()sin(
)sin(
Re)sin(
)sin(
)(
)(Re
1
1Re
))1((
)(
)(
2
2
!"!!!! !"
"!!!
!!!
"!
!
#+#=
=
$$%
&''(
)##
=
$$%
&''(
)##
=
#+#
##
#
#
NtkzN
A
eN
A
eeee
eeeA
ee
eAA
Ntkzi
tkzi
iii
iNiNiN
tkzi
i
Ni
TOT
Physics 341 Experiment 5 Page 5-16
Experiment 5 - Interference and diffraction Apparatus list
1. He-Ne laser
2. Optical bench with lamp, light baffle, screen
3. Two microscope slides
4. Box of 27 photographic film diffraction and interference targets
5. Booklet with target image originals
6. Replica diffraction grating
7. Five pinhole apertures, various diameters
8. CD-ROM fragment
9. Achromatic lens and holder
10. Interference filters
11. Hand-held spectroscope (to be taken home)
12. Hewlett-Packard model E3632A low voltage DC power supply
13. Tungsten lamp and holder
14. Metric tape measure
15. Spectral lamps
16. Slide holder
17. Optical comparator (for measuring distances on slides)


![Interference and Diffraction –A New Theoryijapm.org/papers/170-ST0012.pdf · interference and diffraction [3]-[5]. ... Interference is mainly studied in the Newton‟s Rings experiment,](https://static.fdocuments.net/doc/165x107/5aa0c88e7f8b9a6c178e979f/interference-and-diffraction-a-new-and-diffraction-3-5-interference.jpg)