CHAPTER 5: GENERAL METHODS AND RULES FOR ASSESSING ...
48
Lakes Simcoe and Couchiching-Black River SPA Part 1 Approved Assessment Report CHAPTER 5: GENERAL METHODS AND RULES FOR ASSESSING DRINKING WATER SYSTEMS VULNERABILITY, ISSUES AND THREATS TABLE OF CONTENTS 5 GENERAL METHODS AND RULES FOR ASSESSING DRINKING WATER SYSTEMS VULNERABILITY, ISSUES AND THREATS ................................................ 4 5.1 Overview of assessing Vulnerability, Issues and Threats .............................. 4 5.1.1 Groundwater Vulnerability Analysis ........................................................... 4 5.1.2 Surface Water Vulnerability Analysis ......................................................... 8 5.1.3 Identifying Issues and Threats ................................................................. 10 5.1.3.1 Issues Analysis .................................................................................... 10 5.1.3.2 Threat Analysis .................................................................................... 11 5.2 Groundwater Vulnerability ............................................................................... 13 5.2.1 Wellhead Protection Area (WHPA) Delineation ....................................... 13 5.2.2 WHPA Vulnerability ................................................................................. 15 5.2.3 Vulnerability Increases - Transport Pathways .......................................... 17 5.2.4 WHPA Vulnerability Scores ..................................................................... 18 5.2.5 Uncertainty Assessment .......................................................................... 20 5.2.6 WHPA Delineation Peer Review Process ................................................ 20 5.3 Surface Water Vulnerability ............................................................................. 21 5.3.1 Intake Protection Zone (IPZ) Delineation ................................................. 21 5.3.2 IPZ Vulnerability Scores........................................................................... 24 5.3.3 Uncertainty Assessment .......................................................................... 25 5.4 Drinking Water Issues Evaluation ................................................................... 26 5.5 Drinking Water Threats Evaluation ................................................................. 28 5.5.1 Listing Drinking Water Threats – Activities............................................... 30 5.5.2 Listing Drinking Water Threats – Conditions ............................................ 31 5.5.3 List Circumstances .................................................................................. 32 5.5.4 Identify Areas for Significant, Moderate, or Low Threats – Activities ....... 34 5.5.5 Identify Areas for Significant, Moderate, or Low Threats - Conditions ..... 37 Chapter 5: General Methods and Rules for Assessing Drinking Water Systems Vulnerability, Issues and Threats 1
Transcript of CHAPTER 5: GENERAL METHODS AND RULES FOR ASSESSING ...

Lakes Simcoe and Couchiching-Black River SPA Part 1 Approved Assessment Report
CHAPTER 5: GENERAL METHODS AND RULES FOR ASSESSING DRINKING WATER SYSTEMS VULNERABILITY, ISSUES AND
THREATS TABLE OF CONTENTS
5 GENERAL METHODS AND RULES FOR ASSESSING DRINKING WATER SYSTEMS VULNERABILITY, ISSUES AND THREATS ................................................ 4
5.1 Overview of assessing Vulnerability, Issues and Threats .............................. 4
5.1.1 Groundwater Vulnerability Analysis ........................................................... 4
5.1.2 Surface Water Vulnerability Analysis ......................................................... 8
5.1.3 Identifying Issues and Threats ................................................................. 10
5.1.3.1 Issues Analysis .................................................................................... 10
5.1.3.2 Threat Analysis .................................................................................... 11
5.2 Groundwater Vulnerability ............................................................................... 13
5.2.1 Wellhead Protection Area (WHPA) Delineation ....................................... 13
5.2.2 WHPA Vulnerability ................................................................................. 15
5.2.3 Vulnerability Increases - Transport Pathways .......................................... 17
5.2.4 WHPA Vulnerability Scores ..................................................................... 18
5.2.5 Uncertainty Assessment .......................................................................... 20
5.2.6 WHPA Delineation Peer Review Process ................................................ 20
5.3 Surface Water Vulnerability ............................................................................. 21
5.3.1 Intake Protection Zone (IPZ) Delineation ................................................. 21
5.3.2 IPZ Vulnerability Scores ........................................................................... 24
5.3.3 Uncertainty Assessment .......................................................................... 25
5.4 Drinking Water Issues Evaluation ................................................................... 26
5.5 Drinking Water Threats Evaluation ................................................................. 28
5.5.1 Listing Drinking Water Threats – Activities ............................................... 30
5.5.2 Listing Drinking Water Threats – Conditions ............................................ 31
5.5.3 List Circumstances .................................................................................. 32
5.5.4 Identify Areas for Significant, Moderate, or Low Threats – Activities ....... 34
5.5.5 Identify Areas for Significant, Moderate, or Low Threats - Conditions ..... 37
Chapter 5: General Methods and Rules for Assessing Drinking Water Systems Vulnerability, Issues and Threats 1

Lakes Simcoe and Couchiching-Black River SPA Part 1 Approved Assessment Report
5.5.6 Enumerate Significant Drinking Water Threats ........................................ 39
5.5.6.1 Overview .............................................................................................. 39
5.5.6.2 Threats inventory database .................................................................. 40
5.5.6.3 Identify Significant Threats Using the Table of Drinking Water Threats 43
5.5.6.4 Refinement of Significant Drinking Water Threats Enumeration .......... 45
5.5.6.4.1 LSCBR SPA Threat Refinement Methodology .............................. 46
5.5.6.4.1 Severn Sound SPA Threat Refinement Methodology .................... 47
5.6 Acknowledgements .......................................................................................... 48
Chapter 5: General Methods and Rules for Assessing Drinking Water Systems Vulnerability, Issues and Threats 2

Lakes Simcoe and Couchiching-Black River SPA Part 1 Approved Assessment Report
List of Tables
Table 5-1: Conversion of ISI and AVI scores to an Intrinsic Vulnerability Rating. ......... 16
Table 5-2: Conversion of SWAT and SAAT advection times to an Intrinsic Vulnerability Rating. ........................................................................................................................... 17
Table 5-3: WHPA Vulnerability Scores using the ISI or AVI method of assessing Vulnerability. .................................................................................................................. 19
Table 5-4: WHPA Vulnerability Scores using the SAAT or SWAT method of assessing Vulnerability. .................................................................................................................. 19
Table 5-5: Vulnerability Score Ranges for Type A, C or D Surface Water Intakes. ....... 25
Table 5-6 to 5-8: Example of the tables that are associated with each WHPA that demonstrate the possible number of Activities (under certain circumstances) that would be considered as a Threat (Low, Medium or High). Note that this means that the Threat does not necessarily exist currently. A separate table is required for pathogens, chemicals and DNAPLS. ............................................................................................... 35
Table 5-7. ...................................................................................................................... 35
Table 5-8. ...................................................................................................................... 35
Table 5-9 to 5-10: This is an example of the tables that are associated with each IPZ that demonstrate the possible number of Activities and circumstances which would be considered as a Threat (Low, Medium or High) in areas of a particular Vulnerability Score. ............................................................................................................................ 36
Table 5-10. .................................................................................................................... 37
Table 5-11: Table used to determine potential of a vulnerable area to have Significant, Moderate or Low Condition Threats. ............................................................................. 38
Table 5-12: The range of Drinking Water Threat classifications assigned to Risk Scores. ...................................................................................................................................... 43
Table 5-13: Example of the type of table used to show the number of Significant Drinking Water Threats in the vulnerable areas. ........................................................... 45
Table 5-14: Agencies responsible for Threat refinement in each municipality. .............. 46
Chapter 5: General Methods and Rules for Assessing Drinking Water Systems Vulnerability, Issues and Threats 3

Lakes Simcoe and Couchiching-Black River SPA Part 1 Approved Assessment Report
5 GENERAL METHODS AND RULES FOR ASSESSING DRINKING WATER SYSTEMS VULNERABILITY, ISSUES AND THREATS
In the South Georgian Bay–Lake Simcoe Region there are over 108 municipal drinking systems drawing water through more than 290 individual wells and 15 surface water intakes (see chapter 2 for more details). In chapters 6 to 13 of this report, the vulnerability of each of the municipal drinking water systems in the Lake Simcoe watershed to contamination is assessed, and potential Drinking Water Issues and Threats are identified. The technical studies completed for these chapters were undertaken by 5 different consulting firms that followed the Provincial Technical Rules (MOE, 2008a), acts, regulations, Guidance Modules and Technical Bulletins (see Chapter 1, Section 1.4.5 for the list of contributing consulting firms). This chapter is not a requirement of the Technical Rules, but it is recognized that methods used in these studies and the rules that had to be adhered to can be complex and often difficult to understand. It is, therefore, the purpose of this chapter to help the reader interpret the information provided in the municipal vulnerability and threats chapters and in doing so summarizing some of the components and requirements of the Technical Rules. Part 1 of this chapter provides a brief overview of the steps taken to assess Vulnerability, Issues and Threats for groundwater and surface water systems. Part 2 includes a more in-depth description of Wellhead Protection Areas (WHPAs) and Intake Protection Zones (IPZs), as well as the methods by which they were delineated and used throughout the report. Each consultant followed the Technical Rules as prescribed by the Ministry of the Environment (MOE, 2008a). However, the rules do not stipulate in all cases which method should be used, and thus a number are acceptable to meet the technical requirements. Therefore, while each consultant followed the required rules and legislation, there are differences in the methods and approaches employed. This chapter does not aim to describe or compare the different approaches, but give a high-level description which, for the most part, applies to all the studies undertaken. For specific methods and approaches used for a drinking water system the reader is directed to the applicable chapter and supporting technical study reports.
PART 1
5.1 OVERVIEW OF ASSESSING VULNERABILITY, ISSUES AND THREATS
5.1.1 Groundwater Vulnerability Analysis Groundwater Vulnerability is determined in a multi-step process. The first step is to delineate the Wellhead Protection Areas (WHPAs), which is based on how long it takes aquifer water to travel to the well. The second is to determine the Intrinsic Vulnerability
Chapter 5: General Methods and Rules for Assessing Drinking Water Systems Vulnerability, Issues and Threats 4

Lakes Simcoe and Couchiching-Black River SPA Part 1 Approved Assessment Report
of these areas, with a third step to factor in additional increased Vulnerability due to anthropogenic (man-made) structures (such as abandoned wells that might be a conduit to the water supply). Based on the Vulnerability (a combination of the factors above), and the WHPA type, a Vulnerability Score is assigned to help determine what is, or could become, a Threat in that area. Below is a detailed description of this process. There are three types of groundwater vulnerable areas: Wellhead Protection Areas (WHPAs), Highly Vulnerable Aquifers (HVAs) and Significant Groundwater Recharge Areas (SGRAs). Chapter 4 discusses HVAs and SGRAs, while the municipal vulnerability and threats chapters (Chapters 6 to 13) focus on the vulnerability of the deeper supply aquifer and each associated WHPA. These chapters focus on WHPA delineation and the assignment of Vulnerability Scores within them. The following section provides a summary of the main steps of delineating a WHPA and assigning a Vulnerability Score. See Section 5.2 for additional details on these steps. The Cannington water supply system was randomly picked to illustrate the different steps of Groundwater Vulnerability, Issues and Threats Analyses to give visual consistency for the reader. For the specific methods used for this system, as well as the results of the Vulnerability and Threats Analysis, see Chapter 6, Section 6.3 which describes Cannington in more detail. Step 1: Wellhead Protection Area Delineation A Wellhead Protection Area (WHPA) is the area around the wellhead where land use activities have the greatest potential to affect the quality of water that flows into the well. A WHPA consists of up to seven separate areas (WHPA-A to WHPA-F) based on how long it takes water within the aquifer to reach the well. This is also known as the time-of-travel (TOT). The exception is the WHPA closest to the well (WHPA-A), which is simply a 100m radius around the well established to offer maximum protection to the well. Other WHPAs include; WHPA-B (2
Figure 1: Example of a Wellhead Protection Area (WHPA) map as presented throughout this Assessment Report.
Chapter 5: General Methods and Rules for Assessing Drinking Water Systems Vulnerability, Issues and Threats 5

Lakes Simcoe and Couchiching-Black River SPA Part 1 Approved Assessment Report
year TOT), WHPA-C (5 year TOT), WHPA-D (25 year TOT). In situations where the WHPA was delineated before 2005, a WHPA-C may not have been delineated, and in these cases a WHPA-C1 (10 year TOT) is provided (MOE, 2008a). The area and shape of a Wellhead Protection Area is influenced by a variety of factors including the amount of water being pumped out of the well, aquifer permeability, and the direction and speed that groundwater travels. All these factors are included in a hydrogeological model which is used to estimate the time-of-travel for each well. In situations where surface waters, such as a river or stream, have the potential to influence the likelihood of a contaminant entering the well, additional WHPAs are delineated – WHPA-E and F. WHPAs considered to be under the influence of surface water are also sometimes referred to as GUDI systems - Groundwater Under Direct Influence. So that the potential for surface water contamination is accounted for, the WHPA-E incorporates the surface water course and contributing sewershed within a minimum of 2 hours. WHPA-F is to be added to cover the remaining upstream contributing area but would only be delineated in the event that a Drinking Water Issue is observed. Figure 1 above is an example of a WHPA map. Step 2: Determine Groundwater Vulnerability Vulnerability is an expression of how (relatively speaking) easily the groundwater could become contaminated. It is possible to determine the Groundwater Vulnerability through a number of methods that are either based on the permeability of the overlying geological material, or the time-of-travel from the surface to the supply aquifer. If an aquifer can easily become contaminated, it is considered to be highly vulnerable. If it is difficult for an aquifer to be contaminated, for example, due to an impermeable layer such as clay, the Vulnerability would likely be low. At this step, areas within the WHPAs
Figure 2: Example of Intrinsic Vulnerability with increase due to Transport Pathways, as presented throughout this Assessment Report.
Chapter 5: General Methods and Rules for Assessing Drinking Water Systems Vulnerability, Issues and Threats 6

Lakes Simcoe and Couchiching-Black River SPA Part 1 Approved Assessment Report
are assigned an Intrinsic Vulnerability Rating of High, Medium or Low. Step 3: Vulnerability Increase, Transport Pathways Vulnerability of a supply aquifer to contamination may be increased by anthropogenic structures or disturbances such as abandoned wells, pits and quarries. These structures or disturbances have the potential to increase the speed at which surface or groundwater can flow to the well, hence reducing the time-of-travel (i.e. an abandoned well is a direct conduit to the aquifer below, bypassing the overburden that a contaminant would otherwise have to pass through to get to the water supply). Where potential Transport Pathways have been identified, Aquifer Vulnerability may increase from Low to High, Low to Medium and from Medium to High. Figure 2 takes the WHPA delineation (Figure 1) and overlays the data from the Intrinsic Vulnerability Rating and any increase due to Transport Pathways. Increases due to Transport Pathways are often localized (30m radius) increase in Vulnerability associated with other wells that intersect the supply aquifer. Step 4: Determine Vulnerability Scores A Vulnerability Score for all areas within the WHPA is assigned based on standard matrix that incorporates both the specific WHPA (A to D), and the Vulnerability Rating assigned in Step 2 and 3 (high, medium or low). Potential Vulnerability Scores range from 2 to 10, although activities in an area with a Vulnerability Score less than 4 cannot be a Drinking Water Threat. Logically, the Vulnerability Score for an area increases the closer it is to a wellhead and the greater the Vulnerability category (i.e. High vs. Low). This assessment results in a Vulnerability Score map for all areas in the WHPA. Figure 3 shows the final Vulnerability Score, determined from a matrix that combines the Intrinsic Vulnerability and the WHPAs. By
Figure 3: Example of the Groundwater Vulnerability Score map, as presented throughout this Assessment Report.
Chapter 5: General Methods and Rules for Assessing Drinking Water Systems Vulnerability, Issues and Threats 7
Lakes Simcoe and Couchiching-Black River SPA Part 1 Approved Assessment Report
undertaking this step, the final Vulnerability Score incorporates; (1) how easily a contaminant would reach the supply aquifer from the surface – the Intrinsic Vulnerability; and (2) how quickly a contaminant in the supply aquifer would reach the well - the WHPA. The Vulnerability Score for WHPA-E (GUDI) is based on the approached used for Intake Protection Zone (IPZ) Vulnerability (see Step 3 for Intake Protection Zones, below).
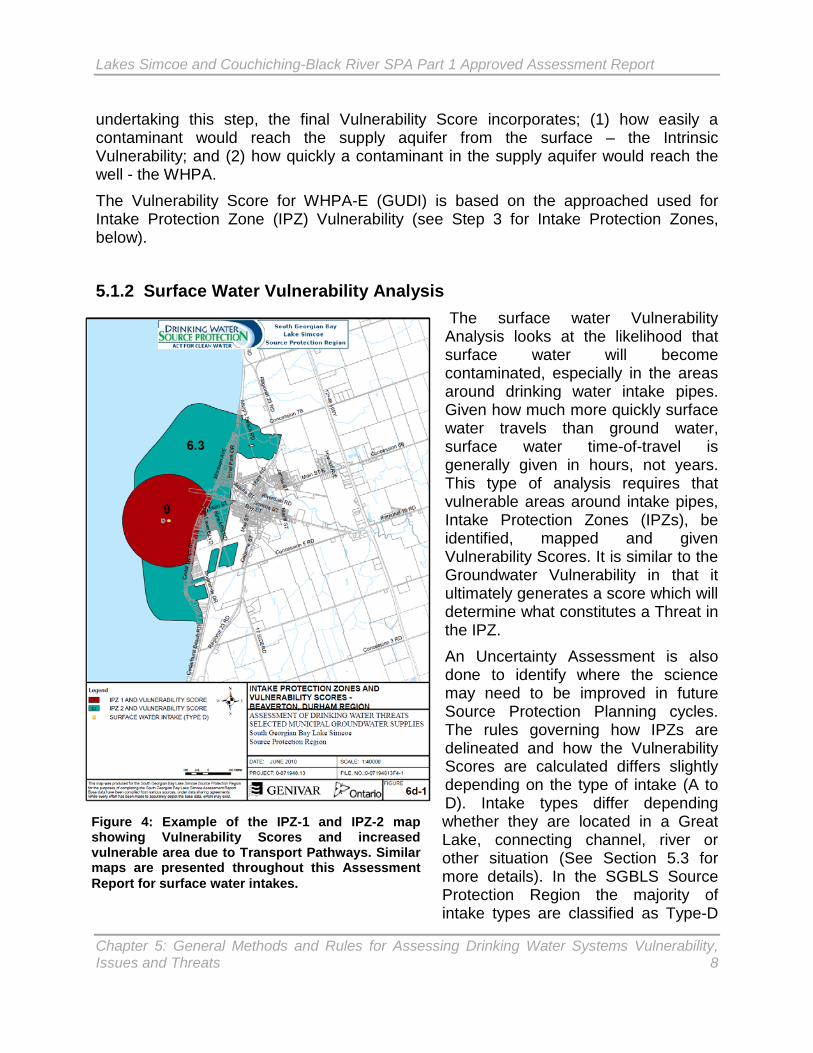
5.1.2 Surface Water Vulnerability Analysis The surface water Vulnerability Analysis looks at the likelihood that surface water will become contaminated, especially in the areas around drinking water intake pipes. Given how much more quickly surface water travels than ground water, surface water time-of-travel is generally given in hours, not years. This type of analysis requires that vulnerable areas around intake pipes, Intake Protection Zones (IPZs), be identified, mapped and given Vulnerability Scores. It is similar to the Groundwater Vulnerability in that it ultimately generates a score which will determine what constitutes a Threat in the IPZ. An Uncertainty Assessment is also done to identify where the science may need to be improved in future Source Protection Planning cycles. The rules governing how IPZs are delineated and how the Vulnerability Scores are calculated differs slightly depending on the type of intake (A to D). Intake types differ depending whether they are located in a Great Lake, connecting channel, river or other situation (See Section 5.3 for more details). In the SGBLS Source Protection Region the majority of intake types are classified as Type-D
Figure 4: Example of the IPZ-1 and IPZ-2 map showing Vulnerability Scores and increased vulnerable area due to Transport Pathways. Similar maps are presented throughout this Assessment Report for surface water intakes.
Chapter 5: General Methods and Rules for Assessing Drinking Water Systems Vulnerability, Issues and Threats 8

Lakes Simcoe and Couchiching-Black River SPA Part 1 Approved Assessment Report
(other situation), with Collingwood being the only Type-A (Great Lake). Step 1: Intake Protection Zone (IPZ) Delineation The area of water and land where activities have the potential to affect the quality of water being taken up by a surface water intake is called an Intake Protection Zone (IPZ). Each intake has up to three IPZs. IPZ-1 is a 1 km radius around the intake, delineated to offer maximum protection to the intake. IPZ-2 is based on the amount of time it takes any material spilled to reach the intake with a minimum TOT of 2 hours (although, if it was known to take longer than 2 hours for the plant operator to shut down the plant, the IPZ-2 would be modified to take this longer time into consideration.) IPZ-2s are delineated using a hydrological model that can simulate how a spill may travel through the water body under various conditions such as wind speed, current speed and river flow. An IPZ-3 is the area of the water and land that may lead to contaminants reaching an intake during an extreme event such as a one in one hundred year rainfall. IPZ-3s typically cover a significantly larger area than either the IPZ-1 or 2. IPZ-3s for Type-D intakes are also subdivided into subzones for the purpose of assigning varying Vulnerability Scores. IPZ-3s for Type-D intakes include the area on the surface water body and abutted land that may contribute water to the intake. The on-land portion must not exceed a 120 meter setback or the Conservation Authority Regulation Limit. Great Lake (Type-A) are delineated using what is referred to as an event based approach. Using this approach, modeling is used to demonstrate whether a contaminant spill, from an existing or proposed activity, would reach the intake during an extreme event and result in the deterioration of water for the use of as a source of drinking water. Where modeling shows that a spill from an activity would lead to deterioration of drinking water, the activity is considered to be within the IPZ-3 and a Significant Drinking Water Threat. Step 2: Intake Protection Zone (IPZ) Delineation – Transport Pathways A Transport Pathway is a hydrological or hydrogeological condition that contributes water to an IPZ-2 and is anthropogenic in origin. The most common surface water Transport Pathways includes stormwater sewersheds, ditches and rural drains. IPZ-2s are modified to include potential Transport Pathways in the 2-hour minimum TOT or operator response time. Step 3: Determine Vulnerability Scores A Vulnerability Score must be assigned to all IPZ-1s, IPZ-2s, and IPZ-3s associated with Type-D intakes. The Vulnerability Score ranks the relative vulnerability of the intake to contaminants. Different types of surface waters have different degrees of vulnerability resulting from hydrological and watershed characteristics. The Vulnerability Score is based on multiplying an Area Vulnerability Factor by a Source Vulnerability Factor. The Area Vulnerability Factor considers factors such as percentage of the IPZ that is on land, land use, and hydrological conditions. The Source Vulnerability Factor considers factors such as depth of the intake, distance of the intake from land and any Drinking Water Issues related to the intake. Potential Vulnerability Scores range from 2 to 10,
Chapter 5: General Methods and Rules for Assessing Drinking Water Systems Vulnerability, Issues and Threats 9

Lakes Simcoe and Couchiching-Black River SPA Part 1 Approved Assessment Report
although activities in an area with a Vulnerability Score less than 4 cannot be a Drinking Water Threat.
5.1.3 Identifying Issues and Threats After the Vulnerability has been determined, Issues and Threats can be identified. This section describes the process by which Issues and Threats were determined. Like with the Vulnerability Analysis, it is a multi-step process with each building on the data of the previous step.
5.1.3.1 Issues Analysis Step 1: Issues Evaluation The intent of the Issues Evaluation is to identify chemical or bacterial situations in the raw drinking water that will limit the ability of the water to serve as a drinking water source either now, or in the future. The presence of a contaminant in a well or drinking water system is determined through analysis of available data and reports. To be considered a Drinking Water Issue, a parameter needs to be at a concentration that is above the Ontario Drinking Water Quality Standards, or have an increasing trend that will lead to concentrations being above the standards (MOE, 2008a, Rule 114). However, a parameter may not be considered an Issue in cases where it is naturally occurring or effective treatment is in place. Examples include iron and manganese, which tend to naturally occur in the environment. Occasional low levels of coliform bacteria are also not typically considered an Issue either, as they are being treated effectively and in accordance with Safe Drinking Water Act regulations. Step 2: Issues Contributing Area If a Drinking Water Issue is identified, the next step is to delineate the area where Drinking Water Threats may contribute to the Drinking Water Issue – this area is known as the Issues Contributing Area. For example, if Trichloroethylene (TCE) is determined to be an Issue, the area from which the source of TCE is determined and this is called the Issues Contributing Area. In many cases the Issue Contributing Areas is the same as the WHPA. Activities and Conditions that are associated with the Issues and are within the Issues Contributing Area are also identified at this step—these Threats are considered to be a Significant Drinking Water Threat. In the event that the available information is insufficient to confirm the source of a Drinking Water Issue, an outline for a plan to obtain further information needs to be provided. Step 3: Prepare List of Drinking Water Issues The final step of the process is to list all Drinking Water Issues for a water supply and the Threats (Activities and Conditions) that may be contributing to the Issue.
Chapter 5: General Methods and Rules for Assessing Drinking Water Systems Vulnerability, Issues and Threats 10

Lakes Simcoe and Couchiching-Black River SPA Part 1 Approved Assessment Report
5.1.3.2 Threat Analysis Once the vulnerable areas for a drinking water system have been delineated and scored, it is then necessary to identify both the existing Threats as well as the Activities that would be a Threat if they were to occur in the vulnerable area. A Drinking Water Threat is defined as “an Activity, or Condition that adversely affects or has the potential to adversely affect, the quality and quantity of any water that is or may be used as a source of drinking water, and includes any Activity or Condition that is prescribed by the regulations as a drinking water threat” (MOE, 2006a). Therefore, it is not only presently existing Threats that must be regulated, but future ones as well. Step 1: Listing Drinking Water Threats - Activities This reporting requirement simply means that the Assessment Report must list the 21 prescribed Drinking Water Threats in paragraphs 1 through 18, and paragraph 21 of subsection 1.1(1) of O.Reg 287/07 (General). These threats, which form the basis of the Tables of Drinking Water Threats, are provided in the more detailed methods section below (Section 5.5). Step 2: Identifying Areas for Significant, Moderate or Low Threats The purpose of this step is to produce a map that relates the Vulnerability Score (see 5.1.1 & 5.1.2) for a WHPA or IPZ to the number and types of circumstances in the Table of Drinking Water Threats (MOE 2008b). These maps will illustrate the areas around the water supply sources where land use activities either are, (for the case of existing Activities,) or would be (for the case of potential future Significant, Moderate, or Low Drinking Water Threats). Given the immense number of circumstances in the Table of Drinking Water Threats it is a substantial challenge to communicate all of this information on a single map. The
Figure 5: Example of map showing the areas of Significant, Moderate and Low Threats around a well field.
Chapter 5: General Methods and Rules for Assessing Drinking Water Systems Vulnerability, Issues and Threats 11

Lakes Simcoe and Couchiching-Black River SPA Part 1 Approved Assessment Report
method chosen uses a map for each of the threat types (Pathogen, Chemical, or DNAPL) and uses a key table (see Section 5.5.3 for example tables) to direct the reader to the appropriate list of threats that corresponds to the combination of vulnerable area (I.e. WHPA-A, -B, -C, -D, -E) and Vulnerability Score (10, 8, 6). Figure 5 illustrates the areas of Significant, Moderate and Low Drinking Water Threats (Chemical) around a well field. In Figure 5, the table embedded shows that where the Vulnerability Score is 10 (red) there are 528 circumstances that would be considered a chemical Significant Threat, 824 which could be a Moderate Threat and 2811 which could be a Low Threat. Note that this doesn’t mean that these circumstances do exist, only that if they did, they would be a Threat. Step 3: Listing Drinking Water Threats – Conditions A Condition refers to the presence of a contaminant in the soil, sediment, or groundwater resulting from past activities. To determine where any Conditions may exist, records provided by the MOE, municipalities and conservation authorities were reviewed, and any Conditions listed for each vulnerable area. The list of Conditions includes information regarding the identified water intake and the Chemical or Pathogen Threat. Step 4: Identifying areas for Significant, Moderate or Low threats - Conditions The purpose of this step is to help identify whether a Condition would be classified as a Significant, Moderate or Low Threat if it was to occur in a vulnerable area. The threat level not only depends on the Vulnerability where the actual or potential Condition occurs, but also the nature of the Condition, specifically whether there is evidence off-site contamination. Step 5: Enumerating Significant Drinking Water Threats The final step in the entire process is to enumerate the number of Significant Drinking Water Threats in the WHPAs and IPZs. The mandated process of counting Significant Threats requires that a description of land use activities for each property parcel in the region be gathered and verified as best as possible. Information for the activities database is gathered from a variety of sources including existing inventories and databases, windshield surveys, aerial photography and MPAC data (Municipal Property Assessment Corporation). The activities database, in combination with the Vulnerability Score for the property parcel, is then linked to the Table of Drinking Water Threats to determine what circumstance for the identified Activity are considered a Significant, Moderate or Low Threat. The number of locations where a Significant Drinking Water Threats is identified in this step is then tabulated. By looking at an extract of the Table of Drinking Water Threats, below, it can be seen that if the pesticide pendimethalin is applied to an area of 1 to 10 hectares, it can only be a Moderate Threat in an WHPA with a Vulnerability Score of 10 (table reference number 76). If however, the same pesticide was applied to an area greater than10 hectares, then the activity would be a Moderate Threat in areas with a Vulnerability Score of 8 and above (table reference number 87). The table below also shows how
Chapter 5: General Methods and Rules for Assessing Drinking Water Systems Vulnerability, Issues and Threats 12

Lakes Simcoe and Couchiching-Black River SPA Part 1 Approved Assessment Report
Threat classification differs depending on the type of pesticide (e.g. Pendimethalin vs. Atrazine) and where a vulnerable area is a WHPA or IPZ. Example page from the Table of Drinking Water Threats showing the relationship between the type of Activity (column 1), the specific circumstances (column 2), and type of vulnerable area (column 3) and the potential resulting Threat category of Significant, Moderate or Low (column 4 to 6).
PART 2
5.2 GROUNDWATER VULNERABILITY This section details the methods by which Groundwater Vulnerability was determined in the South Georgian Bay-Lake Simcoe Source Protection Region.
5.2.1 Wellhead Protection Area (WHPA) Delineation The Wellhead Protection Area (WHPA) is the primary vulnerable area to be delineated to ensure the protection of the municipal water supply wells. Each WHPA is subdivided into four time-of-travel zones that estimate the amount of time it would take a contaminant to reach the municipal well. The following time-of-travel zones are required per Technical Rule 51:
Chapter 5: General Methods and Rules for Assessing Drinking Water Systems Vulnerability, Issues and Threats 13

Lakes Simcoe and Couchiching-Black River SPA Part 1 Approved Assessment Report
• Zone A: 100 m radius.
• Zone B: 2 year time-of-travel (TOT) capture zone.
• Zone C: 5 year TOT capture zone.
• Zone C1: 10 year TOT capture zone. (for WHPAs delineated before April 2005)
• Zone D: 25 year TOT capture zone. The Groundwater Vulnerability is assessed to provide an indication, within the WHPA, which current (or future) Activities at the surface present the greatest risk to contaminate the water supply. The Vulnerability Analysis considers the WHPA and the Groundwater Vulnerability, as well as the potential for the Vulnerability to be increased by anthropogenic activities, through Transport Pathways, by developing a “Vulnerability Score” within the WHPA. The WHPA-A is determined as a fixed radius of 100 m to ensure that all wells receive a minimum standard of protection. WHPAs -B to -D are developed based on the area that contributes groundwater to the municipal wells within a specified time for a specified rate of groundwater withdrawal. The rate of groundwater withdrawal is typically selected to reflect the maximum planned taking (or the permitted taking) to ensure that the delineated WHPA is sufficiently large to reflect the zone of contribution for the wells. In addition, Technical Rules 47 - 51 (Part V) contain the requirement to delineate a WHPA-E and WHPA-F as required for municipal groundwater supplies that are considered to be Groundwater Under the Direct Influence of surface water (GUDI). The intent of this is to provide protection from surface watercourses that may deliver contaminants to the water supply aquifer faster than would be considered based groundwater alone. The typical extent of the WHPA-E is to cover a minimum time-of-travel distance of 2 hours within the surface water course from the point of infiltration that is considered to be in connection with the water supply aquifer. WHPA-F would consider the remainder of the contributing watercourse path but would only be delineated in the event that a Drinking Water Issue is observed. WHPA-E and WHPA-F typically include an area 120 m inland from the surface water feature, but will also consider other contributing areas, such as stormwater catchments that discharge within the WHPA-E or -F. Technical Rules stipulate that WHPAs be determined by 1 of 4 methods, or a method that in the opinion of the Director is equivalent to or better than those permitted. The prescribed methods are:
1) A computer based three-dimensional groundwater flow model, 2) Two-dimensional analytical model, 3) Uniform flow method, 4) Calculated fixed radius method;
Chapter 5: General Methods and Rules for Assessing Drinking Water Systems Vulnerability, Issues and Threats 14

Lakes Simcoe and Couchiching-Black River SPA Part 1 Approved Assessment Report
The majority of WHPAs within the SGBLS Source Protection Region were delineated by using a three dimensional groundwater flow model. However, a number of WHPAs were also delineated using methods 2 to 4 above. Specific details on the model(s) used can be found in the municipal vulnerability and threats chapters (Chapters 6-13) and their related reports. The WHPAs presented in this report vary greatly in size and shape. While the size and shape is somewhat dependent on the modeling approach used (e.g. fixed radius versus the 3-D model), the characteristics of a WHPA are dictated by the hydrogeological properties of the aquifers and aquitards, and the pumping rates of the supply wells. The greater the pumping rate, the wider the WHPA and conversely, the lower the pumping rate, the narrower the WHPA. Within the SGBLS Source Protection Region many of the WHPAs are long and narrow, and this reflects the low pumping rates of the wells. In terms of the hydrogeological properties, the greater the porosity and hydrologic conductivity (i.e. the easier it is for water to travel through the aquifer) the larger the WHPA – water can travel much further in a set period of time (e.g. 5 years) in porous rock than non-porous rock.
5.2.2 WHPA Vulnerability The vulnerability of a groundwater system is an expression of how easily (relatively speaking) the aquifer could become contaminated by threat activities on or beneath the ground surface. An aquifer that can easily become contaminated is considered to be a Highly Vulnerable Aquifer (HVA). Technical Rules 37 and 38 (Section IV) provide guidance on categorizing the Groundwater Vulnerability as either “High”, “Medium”, or “Low” using one of the following assessment methods:
1) Intrinsic Susceptibility Index (ISI);
2) Aquifer Vulnerability Index (AVI);
3) Surface to Aquifer Advection Time (SAAT);
4) Surface to well Advection Time (SWAT);
The ISI and AVI methods use a scoring system that reflects the thickness and the type of soil. In general, a Highly Vulnerable Aquifer will consist of source granular materials or fractured rock that is exposed near surface with a relatively shallow water table. The vulnerability of the aquifer will typically reduce as a greater thickness of fine-grained soils is observed to cover the aquifer. The SAAT and SWAT methods for determining Aquifer Vulnerability are determined through use of the calibrated numerical groundwater flow models. The groundwater models are able to estimate the amount of time it takes water from the surface to reach the municipal aquifer (SAAT) or municipal well (SWAT). Within the SGBLS Source Protection Region vulnerability of the WHPAs
Chapter 5: General Methods and Rules for Assessing Drinking Water Systems Vulnerability, Issues and Threats 15

Lakes Simcoe and Couchiching-Black River SPA Part 1 Approved Assessment Report
are for the most part assessed using the AVI approach, although in York Region the Water Table to Well Advective Time (WWAT) approach was used. Intrinsic Susceptibility Index (ISI) and Aquiver Vulnerability Index (AVI) The Intrinsic Susceptibility Index (ISI) is a specific methodology that utilizes information in the existing Water Well Information System (WWIS) to qualitatively assess the degree of protection of soil materials above either the water table in an unconfined aquifer, or the top of a designated confined aquifer. In this approach, the uppermost 2 m-thick confined aquifer is used when there is no unconfined or water table aquifer. In the ISI method, a score is obtained for each well by multiplying a representative “permeability” or “K” factor by the measured thickness of each unit (or unsaturated thickness for the water table case). A high K factor (5 or 6) represents low permeability soils that typically behave as aquitards and provide vertical protection to underlying layers. A low K factor (1-2) represents permeable materials (typically sands or gravels) that can more readily conduct groundwater and contaminants to the municipal well. The sum of these scores for each layer above the water table or first aquifer is then added to determine an ISI index. The ISI score is then converted to an intrinsic vulnerability rating of either High, Medium, or Low using the standard required by the Technical Rules (Table 5-1).
Table 5-1: Conversion of ISI and AVI scores to an Intrinsic Vulnerability Rating.
ISI/AVI Score Intrinsic Vulnerability <30 High
30 - 80 Moderate >80 Low
The Aquifer Vulnerability Index (AVI) is calculated in a similar way as the ISI methods described above. The difference is that the AVI is calculated as the sum of the K factor and thickness for each soil layer above the aquifer of interest with no consideration of the water table. This approach can be either applied using interpreted geological layers or using the soils data from individual boreholes. The AVI score, like the ISI score, is then related as High, Medium, or Low Vulnerability category using the standard stated in the Technical Rules (Table 5-1). ISI and AVI mapping methods are described in greater detail in Draft Guidance Module 3 (MOE, 2006). The list of K factors for various geological materials is provided in Appendix 3 of Draft Guidance Module 3 (MOE, 2006). Surface to Aquifer Advection Times (SAAT) or Surface to Well Advection Times (SWAT) SAAT or SWAT analysis can be performed manually using analytical methods or more typically using a numerical groundwater flow model. These methods determine the
Chapter 5: General Methods and Rules for Assessing Drinking Water Systems Vulnerability, Issues and Threats 16

Lakes Simcoe and Couchiching-Black River SPA Part 1 Approved Assessment Report
actual time of travel from either ground surface to the aquifer (SAAT), or from surface to the municipal well (SWAT). In the SAAT approach, a direct estimate is made of the vertical travel time from the ground surface (or near ground surface) to the top of the aquifer (or top of the water table in an unconfined aquifer). The SAAT can also be described as the breakthrough time of the mean concentration of the advancing front of a conservative tracer, for a continuous source; or the breakthrough time of the centre of mass for a pulse source. The SAAT calculation consists of the following two components, the sum of which defines the total SAAT:
• The unsaturated zone arrival time, which defines the time-of-travel through the unsaturated zone to the water table.
• The Water table to Aquifer Arrival Time (WAAT), which defines the time-of-travel from the water table to the aquifer of interest (required for confined aquifers). (MOE Guidance module 3, 2006)
The SWAT approach involves calculating the total travel time from ground surface (or near ground surface) to a supply well. It includes both the vertical travel time and the horizontal travel time through the groundwater flow system. As it requires the presence of a pumping well to complete, the SWAT approach would only be applicable for mapping the intrinsic vulnerability within an existing (or potential future) municipal WHPA. It should be noted that this method does not replace the TOT calculations, but provides a means of assessing the relative vulnerability of the water supply aquifer within each of the TOT capture zones. The SWAT and SAAT scores are then converted to High, Medium, or Low Vulnerability category using the standard required by the Technical Rules (Table 5-2). Table 5-2: Conversion of SWAT and SAAT advection times to an Intrinsic Vulnerability Rating.
SWAT and SAAT advection time Intrinsic Vulnerability < 5 years High
5 to 25 years Moderate >25 years Low
5.2.3 Vulnerability Increases - Transport Pathways The vulnerability of an aquifer may be increased by any land use activity or feature that disturbs the surface above the aquifer, or which artificially enhances flow to that aquifer. Constructed or anthropogenic preferential pathways to aquifers such as large and small diameter wells and excavations can have a significant impact locally on the vulnerability of an aquifer. The Technical Rules 39-40, state that a Transport Pathway can increase Intrinsic Vulnerability from a Low to a Medium or High Vulnerability and from a Medium
Chapter 5: General Methods and Rules for Assessing Drinking Water Systems Vulnerability, Issues and Threats 17

Lakes Simcoe and Couchiching-Black River SPA Part 1 Approved Assessment Report
to High Vulnerability. When determining whether the vulnerability of an area has increased, the following factors shall be considered (Technical Rule 41).
• Hydrogeological conditions;
• The type and design of any transport pathways;
• The cumulative impact of any transport pathways; and
• The extent of any assumptions used in the assessment of the vulnerability of the groundwater.
Examples of features that may provide a Transport Pathway that could result in an increase in Vulnerability of a water supply source include:
• Existing wells or boreholes
• Unused or abandoned wells
• Pits and quarries
• Mines The first step in identifying potential Transport Pathways was to assemble and review available data that may indicate the presence of a pathway. Examples of data sources include: databases of well decommissioning and upgrades, municipal groundwater study reports and property fabric. Once an inventory of potential pathways was completed, the degree to which the pathway increased Vulnerability was identified. Many potential pathways were ruled out at this stage (i.e. not considered to increase Vulnerability) as they were considered to be too shallow to reach the deeper supply aquifer. Increased Vulnerability for remaining Transport Pathways depended on the likelihood that they could affect the water quality of the supply aquifer, and in most cases resulted in a single increase from a Low to Medium, or Medium to High. Vulnerable areas that were already rated as High cannot increase any further. In the Source Protection Region domestic wells that intersect with the municipal supply wells were the most commonly identified Transport Pathway. Criteria used to determine if a domestic well should be considered a Transport Pathway included:
• Whether the well intersects with the municipal well
• Density of wells
• Age of wells (as a proxy for integrity of the annular seal)
• Height of the well casing
5.2.4 WHPA Vulnerability Scores A Vulnerability Score is determined for the area within the WHPA in accordance with Part VII.3 of the Technical Rules. The Vulnerability Score is assigned using the matrix provided in the Technical Rules that relates the delineated WHPA to the assigned
Chapter 5: General Methods and Rules for Assessing Drinking Water Systems Vulnerability, Issues and Threats 18

Lakes Simcoe and Couchiching-Black River SPA Part 1 Approved Assessment Report
Groundwater Vulnerability category (High, Medium, or Low). The matrix used to convert the Vulnerability category to the Vulnerability Score differs slightly depending on whether the ISI/AVI or the SWAT/SAAT method of assessing Vulnerability were used – see Table 5-3 and Table 5-4 based on that provided in the Technical Rules. Table 5-3: WHPA Vulnerability Scores using the ISI or AVI method of assessing Vulnerability.
Groundwater Vulnerability Category
for the Area
Location Within a Wellhead Protection Area
WHPA-A WHPA-B WHPA-C WHPA-C1 WHPA-D
High 10 10 8 8 6 Medium 10 8 6 6 4
Low 10 6 4 4 2
Table 5-4: WHPA Vulnerability Scores using the SAAT or SWAT method of assessing Vulnerability.
Groundwater Vulnerability Category
for the Area
Location Within a Wellhead Protection Area
WHPA-A WHPA-B WHPA-C WHPA-C1 WHPA-D
High 10 10 8 8 6 Medium 10 8 6 6 4
Low 10 6 2 2 2
In accordance with the Technical Rules, the Vulnerability Score provided for the deep supply aquifer at this stage may be different from the shallow aquifer Vulnerability Score developed for the Highly Vulnerable Aquifer assessment presented in Chapter 4 (Technical Rule 43). Conversion of Vulnerability categories (High, Medium and Low) to Vulnerability Scores (10, 8, 6, 4 and 2) results in a new map for each WHPA that expresses the relative degree to which a land use or activity could affect the drinking water supply aquifer. A higher value Vulnerability Score will always be assigned to the immediate vicinity of the well and to any areas that are shown to be vulnerable. For example, WHPA-A is always assigned a Vulnerability Score of 10, and a WHPA-B is assigned a Vulnerability of 10 where the Vulnerability Rating was determined to be High. Wells with good natural protection will demonstrate lower scores close to the wells. Any specific areas, such as natural or artificial recharge areas, where natural conditions would allow potential contaminants to reach the aquifer, will be reflected by a higher Vulnerability Score. Vulnerability Scores are also assigned to the WHPA-E or WHPA-F areas for GUDI wells in accordance with Technical Rules 89 through 96. Vulnerability Scores for WHPA-E or WHPA-F are based on the rules for establishing scores for an Intake Protection Zone. Vulnerability Scores for WHPA-E and WHPA-F reflect the relative potential for surface
Chapter 5: General Methods and Rules for Assessing Drinking Water Systems Vulnerability, Issues and Threats 19

Lakes Simcoe and Couchiching-Black River SPA Part 1 Approved Assessment Report
water to reach the area of interaction between a surface water flow regime and the groundwater flow system.
5.2.5 Uncertainty Assessment An analysis of the uncertainty, characterized by “High” or “Low” is required with respect to the delineation of WHPA and the assessment of Vulnerability of a WHPA (Rule 13; MOE, 2008a). The factors to be considered in the analysis include:
• Distribution, variability, quality and relevance of data;
• Ability of the methods and models to accurately predict the processes in the hydrological system;
• Quality assurance and quality control procedures applied;
• Extent and level of calibration and validation achieved for model used; and
• For vulnerability factors, the accuracy to which the groundwater vulnerability categories effectively assess the relative vulnerability of underlying hydrological features.
5.2.6 WHPA Delineation Peer Review Process All of the Wellhead Protection Areas in the South Georgian Bay-Lake Simcoe Protection Region, with the exception of those in York Region, were peer reviewed by Dillon Consulting. The modeling used for the York Region WHPAs had already been peer reviewed in the past and it was deemed unnecessary to repeat. The objectives of the peer review process are to ensure consistency with the expectations of the Technical Rules, and that the methodologies used to delineate the WHPAs are appropriate and scientifically defensible. The criteria used for the assessment includes a total of eleven (11) criteria with a scoring system (from 5 to 10) that results in a ‘pass’ or ‘fail’ (Table 1, Appendix MO). If issues are identified and a ‘fail’ is possible, the work goes back to the respective consultant to improve and/or modify before being re-evaluated. The WHPAs that ‘pass’ the peer review are accepted and incorporated into the Assessment Report. In general, the peer review process uses the 11 criteria to evaluate if the WHPA has been accurately delineated with Technical Rule-approved models and methods and the groundwater flow model has appropriate assumptions and data input. An Uncertainty Rating of ‘High’ or ‘Low’ is then given for the WHPA delineation. In situations where the consultants who delineated the WHPA also provided an Uncertainty Assessment, and the Uncertainty Assessment differed from that provided by the peer review, then the most conservative uncertainty was assigned (i.e. high). For the comprehensive scoring matrix see Table 1, Appendix MO.
Chapter 5: General Methods and Rules for Assessing Drinking Water Systems Vulnerability, Issues and Threats 20
Lakes Simcoe and Couchiching-Black River SPA Part 1 Approved Assessment Report
5.3 SURFACE WATER VULNERABILITY The Technical Rules classify surface water intakes according to their location, with slightly different rules for delineating the Intake Protection Zone and Vulnerability Score for the four different classifications. The four classifications are: Type A: Intakes or the planned intake is or would be located in a Great Lake; Type B: Intake or the planned intake is or would be located in a connecting channel; Type C: Intake or the planned intake is or would be located in a river and neither the
direction nor velocity of the flow of the water at the intake is affected by a water impoundment structure; or
Type D: If the intake is not a Type A, B or C. Within the Region, all intakes with the exception of Collingwood are considered to be Type-D intakes. Collingwood intake is located in Georgian Bay and is therefore considered a Type-A intake. While the two intakes located in Severn Sound (Victoria Harbour and Rope Subdivision) are technically in a Great Lake (Lake Huron) the physical setting of these intakes (shallow and close to shore) is more typical of intakes classified as Type-D. As a result, these intake types were reclassified as Type-D once approval from the Director was provided.
5.3.1 Intake Protection Zone (IPZ) Delineation The Intake Protection Zone (IPZ) is the primary vulnerable area to be delineated to ensure the protection of the municipal surface water supply. For each drinking water system, an IPZ-1, IPZ-2 and IPZ-3 have been delineated (with the exception of IPZ-3s for Georgian Bay intakes which are currently in development). IPZ-1 The IPZ-1 is the area immediately around the intake, defined for the Type A and D intakes by a 1 km radius centered on the intake (Rule 61-1; MOE, 2008a). Where the IPZ-1 abuts land, it includes a setback of 120 m or the Regulated Limit, whichever is greater. It is measured from the high water mark of the surface water body that encompasses the area where overland flow drains into the surface water body and the area of the Regulated Limit along the abutted land (Rule 61-2a and 61-2b; MOE, 2008a). The Regulated Limit is delineated with respect to the Provincial Policy Statement and the Conservation Authority (CA) Act Regulation 97/04 (MOE, 2008c). It includes flood plains, streams, valleys, wetlands and shorelines. These areas are of significant risk for loss of life, property damage, infrastructure damage and social disruption. The IPZ-1 was determined using GIS, based on the 1 km radius, regulation limits and the 120m setback from the shoreline.
Chapter 5: General Methods and Rules for Assessing Drinking Water Systems Vulnerability, Issues and Threats 21

Lakes Simcoe and Couchiching-Black River SPA Part 1 Approved Assessment Report
IPZ-2 The IPZ-2 acts as a secondary protective zone around the IPZ-1. In the event of a spill or acute situation, the treatment facility will have minimal time to respond. Contaminants released in this zone have a high chance of reaching the intake quickly and will have limited time to be diluted prior to reaching the intake (MOE, 2006a). The IPZ-2 is defined based on the area that may contribute water to the intake where the TOT to the intake is equal to or less than the time that is sufficient to allow the operator of the system to respond to an adverse condition in the quality of the surface water (Rule 65; MOE, 2008a). Where the time that is sufficient to allow the operator to respond to an adverse condition in the quality of the surface water is less than two hours, the TOT to the intake shall be deemed to be two hours (Rule 66; MOE, 2008a). The two hour minimum response time was used for all intakes in the region, as the operator response times to shut-down the intakes were less than 2 hours after receiving notification. The IPZ-2 is comprised of four areas:
• The area within each surface water body (in this case, the lake which the intake is located in and an extension up tributaries flowing into the IPZ-2);
• Up-tributary where the IPZ-2 is extended up the tributaries to the 2-hour TOT limit;
• A setback inland along the abutted land; and
• An extension to include areas that contribute water to the IPZ-2 through transport pathways (Rules 65 and 72-74; MOE, 2008a).
In-water IPZ-2s were delineated using hydrodynamic models. For intakes located in Lake Couchiching and Lake Simcoe this was completed by Baird and Associates using the MIKE3 Hydrodynamic model and in Georgian Bay this was completed by SNC Lavalin using the GEMSS Hydrodynamic model. Both of these models were originally developed and calibrated for the Assimilative Capacity Studies as described in Baird (2006) and Lavalin (2006). This previous work demonstrated that the models can successfully simulate currents in these locations. Where tributaries flow into the lake within the IPZ-2, the IPZ-2 is extended up the tributary (Rule 65; MOE, 2008a). The upstream limit of the IPZ-2 was calculated as 2 hours minus the travel time from the intake to tributary mouth multiplied by the tributary velocity. Tributary velocity was based on velocity at bank full stage as per the MOE (2006a) recommendation and it was assumed that bank full flow is equivalent to the 2 year return period event. Where the IPZ-2 abuts land, it includes a setback 120 m inland along the abutted land or the Regulation Limit, whichever is greater. It is measured from the high water mark of the surface water body that encompasses the area where overland flow drains into the
Chapter 5: General Methods and Rules for Assessing Drinking Water Systems Vulnerability, Issues and Threats 22

Lakes Simcoe and Couchiching-Black River SPA Part 1 Approved Assessment Report
surface water body and the area of the Regulation Limit along the abutted land (Rule 65-3; MOE, 2008a). Where an area that is an IPZ-2 includes a setback from a surface water body delineated in accordance with Subrule 65-3 (MOE, 2008a), the area may be extended to include an area that contributes water to the IPZ-2 through a Transport Pathway (Rule 72; MOE, 2008a). The IPZ-2s were modified to include potential Transport Pathways based on Rules 72 to 74. A complete description of the methodology, analysis and Transport Pathway delineation is provided in Baird, 2009. Data were acquired by LSRCA from field surveys, in-house development, and from participating municipalities. Datasets included (but were not limited to):
• Storm sewersheds;
• Storm water pond locations;
• Sewershed outfall locations, diameters, flows and velocities;
• Ditch locations and cross-sections;
• Rural drainage networks;
• Impervious areas;
• Subsurface tile drains;
• Watercourse engineered and modeled cross-sections;
• Soils and land use data; and
• Ortho-imagery
IPZ-3 The IPZ-3 is the area within the surface water body through which contaminants released during an extreme event could be transported to the intake. An extreme event is defined in MOE as “a period of heavy precipitation or winds up to a 100 year storm event; a freshet; or a surface water body exceeding its high water mark.” (2008a, p.2) In Lake Simcoe and Lake Couchiching the IPZ-3 was delineated using the MIKE3 Hydrodynamic model. Reverse particle tracking using neutrally buoyant particles, was used to evaluate the distances that currents could transport a contaminant in Lake Simcoe, during an extreme wind event (up to a 100 year return period). This modeling demonstrated that a contaminant could reach an intake from anywhere in Lake Simcoe, during extreme events. The size and irregular shape of the lake, with two large bays (Cook’s Bay and Kempenfelt Bay) means that movement of the contaminant across the lake, behind islands, and in and out of bays is highly dependent on the directionality of the wind. To complicate matters further, there are eight intakes in Lake Simcoe, and there is substantial overlapping of the IPZ-3s. Based on discussions with LSRCA and MOE, it was agreed that the modeling supports the original direction in MOE (2006a), to
Chapter 5: General Methods and Rules for Assessing Drinking Water Systems Vulnerability, Issues and Threats 23

Lakes Simcoe and Couchiching-Black River SPA Part 1 Approved Assessment Report
extend the IPZ-3 to the watershed limits. Additional site specific contaminant modeling may be undertaken in the next phase, considering specific threats, to determine whether or not a contaminant could reach the intake in sufficient concentration, to compromise the drinking water at the intake (MOE, 2008a; Rule 130). The IPZ-3 sub-zones, used to define areas with varying Vulnerability Scores, were delineated based on the subwatershed boundaries. The Lake Simcoe waterbody was also delineated as one sub-zone. Although Lake Simcoe generally flows into Lake Couchiching through the Atherley Narrows, data showed that reverse flow does occur, with water flowing from Lake Couchiching into Lake Simcoe. The Lake Couchiching water body and watershed were therefore included as IPZ-3 sub-zones. The IPZ-3 was extended up tributaries from the lake, to the watershed limit. A setback of 120 m and the Regulation Limit was used to define the setback within the Lake Simcoe watershed. As Lake Couchiching is not within a Conservation Authority jurisdiction, there is no Regulation Area and therefore only the 120m setback was applied. IPZ-3s for Collingwood and Severn Sound Intakes are currently being prepared and will be provided in future versions of the Assessment Report.
5.3.2 IPZ Vulnerability Scores Drinking water intakes that use surface water sources are highly vulnerable to contamination. In addition, different types of surface waters have different degrees of vulnerability (e.g., the Great Lakes, the Great Lakes connecting channels, inland rivers/streams, and inland lakes). The different degrees of vulnerability result from inherent hydrological and environmental characteristics. Due to these differences, the water quality may be different at a given intake. In addition to the Source Vulnerability, there is also vulnerability associated with each zone. A Vulnerability Score must be assigned to each IPZ-1, IPZ-2 as well as the sub-regions of an IPZ-3 associated with Type-D intakes (Rule 86; MOE, 2008a). The Vulnerability Score assigned to each IPZ-1, IPZ-2 and each area of an IPZ-3 associated with a Type-C or Type-D intake shall be calculated in accordance with the following formula:
B x C
where, B = the Area Vulnerability Factor of the area of the IPZ C = the Source Vulnerability Factor of the surface water of the IPZ
The range of possible Vulnerability Scores is listed in Table 5-5. The Technical Rules stipulate an Area Vulnerability Factor (and hence the overall Vulnerability Score) for an IPZ-3 cannot be greater than the IPZ-2.
Chapter 5: General Methods and Rules for Assessing Drinking Water Systems Vulnerability, Issues and Threats 24

Lakes Simcoe and Couchiching-Black River SPA Part 1 Approved Assessment Report
Table 5-5: Vulnerability Score Ranges for Type A, C or D Surface Water Intakes.
Intake Type
Area Vulnerability Factor (B)
Source Vulnerability
Factor (C)
Range of Vulnerability Score
(V) IPZ-1 IPZ-2 IPZ-3 IPZ-1 IPZ-2 IPZ-3
Type A 10 7 to 9 n/a 0.5 to 0.7 5 to 7 3.5 to 6.3 n/a
Type C or D 10 7 to 9 1 to 9 0.9 to 1 (C) 0.8 to 1 (D) 8 to 10 5.6 to 9 0.8 to 9
Area Vulnerability Factor Area Vulnerability Factors aim to account for factors in the surrounding environment that may the intake more or less vulnerable to contamination. An Area Vulnerability Factor for all IPZ-2s and all Type D IPZ-3 were assigned according to the requirements of the Technical Rules. Factors considered in IPZ-2 Area Vulnerability Assessment were land cover, hydrology, slope and the characteristics of the subwatershed in which the IPZ-2 is located. The Area Vulnerability Factors for the Type-D intake IPZ-3 sub-zones were determined, using the same methodology as for the IPZ-2, with some minor additions, including a modifier for the distance from the intake to the subwatershed outlet (required in Technical Rule 92-4). The Technical Rules define the acceptable ranges for the Vulnerability Factors for each IPZ – see Table 5-5. Source Vulnerability Factor A Source Vulnerability Factor is assigned to each surface water intake (Rule 94; MOE, 2008a). The acceptable range for the Source Vulnerability Factor varies with the intake type, but is constant for all IPZs, for a given intake (see Table 5-5). Source Vulnerability needs to take into account the following factors: the depth of the intake from the top of the water surface, the distance of the intake from land, and the number of recorded Drinking Water Issues related to the intake, if any. Source Vulnerability for intakes within the SGBLS Source Protection Region were based on that developed by the Michigan Department of Environmental Quality (MDEQ) whereby 4 Vulnerability categories are assigned according to the depth of the intake (<>6m depth) and distance from shore (<>300m) - See Baird 2010 for more details. For the Type D intakes, this analysis resulted in a Source Vulnerability Factor of either 0.8, 0.9 or 1 being assigned, with a higher value indicating higher Vulnerability.
5.3.3 Uncertainty Assessment An analysis of the uncertainty, characterized by “High” or “Low” is required with respect to the delineation of surface water Intake Protection Zones and the assessment of Vulnerability of surface water Intake Protection Zones (Rule 13; MOE, 2008a). The factors to be considered in the analysis include:
Chapter 5: General Methods and Rules for Assessing Drinking Water Systems Vulnerability, Issues and Threats 25
Lakes Simcoe and Couchiching-Black River SPA Part 1 Approved Assessment Report
• Distribution, variability, quality and relevance of data;
• Ability of models to predict the processes;
• Quality assurance and quality control procedures applied;
• Extent and level of calibration and validation achieved for model used; and
• For vulnerability factors, the accuracy with which the area and source vulnerability factors effectively assesses the relative vulnerability of the hydrological features
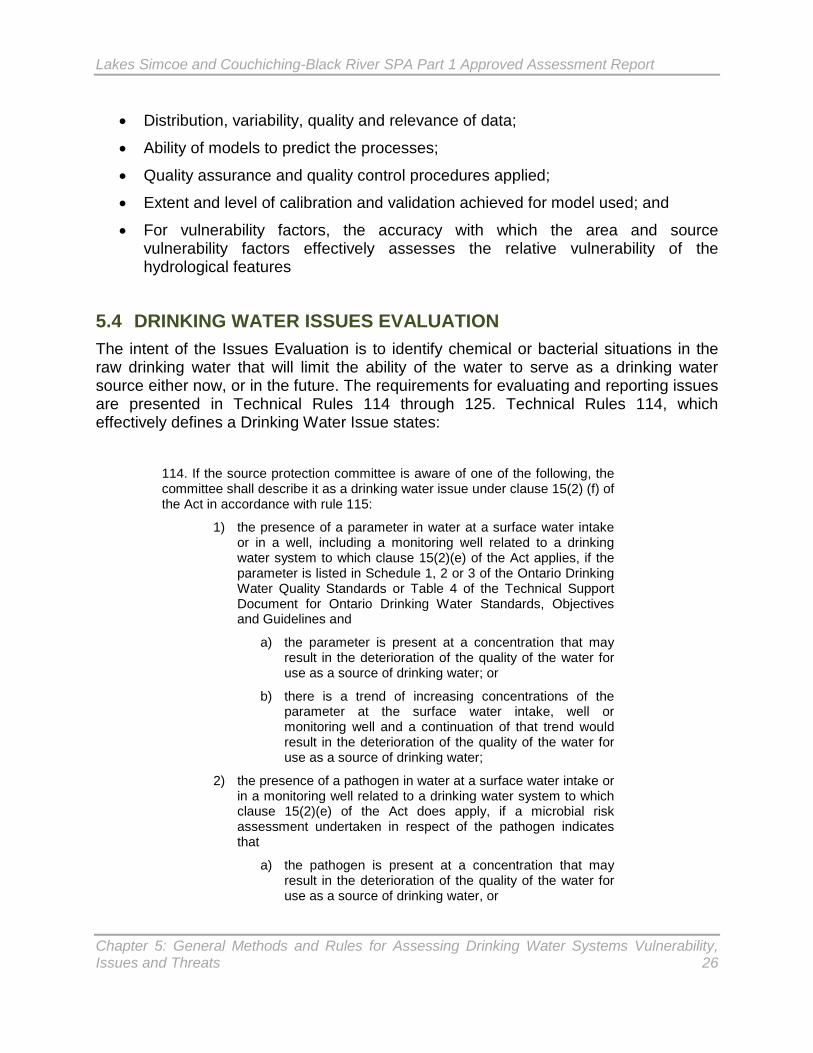
5.4 DRINKING WATER ISSUES EVALUATION The intent of the Issues Evaluation is to identify chemical or bacterial situations in the raw drinking water that will limit the ability of the water to serve as a drinking water source either now, or in the future. The requirements for evaluating and reporting issues are presented in Technical Rules 114 through 125. Technical Rules 114, which effectively defines a Drinking Water Issue states:
114. If the source protection committee is aware of one of the following, the committee shall describe it as a drinking water issue under clause 15(2) (f) of the Act in accordance with rule 115:
1) the presence of a parameter in water at a surface water intake or in a well, including a monitoring well related to a drinking water system to which clause 15(2)(e) of the Act applies, if the parameter is listed in Schedule 1, 2 or 3 of the Ontario Drinking Water Quality Standards or Table 4 of the Technical Support Document for Ontario Drinking Water Standards, Objectives and Guidelines and
a) the parameter is present at a concentration that may result in the deterioration of the quality of the water for use as a source of drinking water; or
b) there is a trend of increasing concentrations of the parameter at the surface water intake, well or monitoring well and a continuation of that trend would result in the deterioration of the quality of the water for use as a source of drinking water;
2) the presence of a pathogen in water at a surface water intake or in a monitoring well related to a drinking water system to which clause 15(2)(e) of the Act does apply, if a microbial risk assessment undertaken in respect of the pathogen indicates that
a) the pathogen is present at a concentration that may result in the deterioration of the quality of the water for use as a source of drinking water, or
Chapter 5: General Methods and Rules for Assessing Drinking Water Systems Vulnerability, Issues and Threats 26

Lakes Simcoe and Couchiching-Black River SPA Part 1 Approved Assessment Report
b) there is a trend of increasing concentrations of the
pathogen at the surface water intake or well and a continuation of that trend would result in the deterioration of the quality of the water for use as a source of drinking water; and
3) in respect of drinking water systems in the vulnerable area that are not mentioned in clause 15 (2) (e) of the Act, there is evidence of the widespread presence of a parameter listed in Schedule 2 or 3 of the Ontario Drinking Water Quality Standards or Table 4 of the Technical Support Document for Ontario Drinking Water Standards, Objectives and Guidelines at surface water intakes or in wells, including monitoring wells, related to those systems, and
a) the parameter is present at a concentration that may result in the deterioration of the water for use as a source of drinking water, or (b) there is a trend of increasing concentrations of the parameter at the intake, well or monitoring well and a continuation of that trend would result in the deterioration of the quality of the water for use as a source of drinking water.
Technical Rule 15 then states what information is required to be included in the Assessment Report, if a Drinking Water Issue is identified and is the result of anthropogenic activity. These requirements include listing the parameter or pathogen of concern with the associated intake or monitoring well and the area where past Activities may contribute to the parameter or pathogen. This area shall be identified as the “Issue Contributing Area” (ICA). Finally, all Activities and Conditions within the ICA need to be identified, and these are then classified as a Significant Drinking Water Threats. However, if any of this information can not currently be attained, a plan for how the information will be obtained needs to be provided. Issues Evaluation for this Assessment Report generally followed a 4 step process, although steps 3 and 4 were not conducted if a Drinking Water Issue was not identified. Step 1: Assemble Available Data. Step 2: Review Data, Identify and Evaluate Drinking Water Issues. Step 3: Identify Contributing Area (ICA) for Drinking Water Issues. Step 4: Prepare List of Drinking Water Issues. Step 1: Assemble available data. This step involved obtaining and reviewing data for each municipal water supply area. The types of data sources include: municipal Groundwater Study Reports, Microbial Control Plans, Water Supply System Engineers’ Reports, Permit To Take Water applications and Technical Reports. Step 2: Review Data, Identify and Evaluate Drinking Water Issues. After a preliminary list of potential Issues have been identified, evaluation as to whether an Issue exists was conducted based on a decision process that primarily focused on
Chapter 5: General Methods and Rules for Assessing Drinking Water Systems Vulnerability, Issues and Threats 27

Lakes Simcoe and Couchiching-Black River SPA Part 1 Approved Assessment Report
benchmarking the identified parameters to the Ontario Drinking Water Quality Standards. At this stage Issues are screened against other criteria, such as whether there is already effective treatment in place or whether the parameter is naturally occurring. Step 3: Identify Contributing Area for Drinking Water Issues. This step is only required if an Issue or multiple Issues have been identified. Linking Issues to an Issues Contributing Area is based on relating known Drinking Water Threats (Activities and Conditions) to the vulnerable areas, and in most cases results in whole or part of the WHPA or IPZ being identified as the ICA. In the event that the available information is insufficient to confirm the source of the Drinking Water Issue, an outline for a plan to obtain further information has been provided. Step 4: Prepare List of Drinking Water Issues. The final list of Drinking Water Issues is prepared for each water supply source based on Step 2. The list of Drinking Water Issues identifies the parameter, the identifier for the surface water intake or well where the Drinking Water Issue is observed, the coordinates for the contributing area for the Drinking Water Issue, and the activities, conditions, or naturally occurring conditions that contribute to the Drinking Water Issue. Subsequent guidance from the Province (MOE, 2010a) has advised that if a contaminant in the raw water can be effectively treated, bringing the contaminant below the Standards, then the SPC may consider not categorizing the parameters as a Drinking Water Issue. In considering whether a contaminant can be effectively treated, the Province advised that the assessment should consider the systems excess treatment capacity, whether the system could get overwhelmed during an event and how sustainable the treatment is for that parameter. Whether a treated contaminant be classified as an Issue or not has been reviewed on a case by case basis using the criteria recommended by MOE. In those situations where a parameter is considered not to be an Issue because it can be treated, the parameter is still identified in the Assessment Report and the reason for not considering it an Issue identified.
5.5 DRINKING WATER THREATS EVALUATION The Clean Water Act (the Act) requires this Assessment Report to list Activities and Conditions that are or would be Drinking Water Threats in four types of vulnerable areas. Through Ontario Regulation (O. Reg.) 287/07 (General) and the Technical Rules the province has set out which activities, at a minimum, are considered Drinking Water Threats under specific circumstances. Specifically, section 1.1 of O. Reg. 287/07 lists Activities that are prescribed as Drinking Water Threats and the Tables of Drinking Water Threats in the Rules specify under what circumstances these Activities are categorized as Significant, Moderate or Low Drinking Water Threats. Categorizing Drinking Water Threats is achieved using what is called the Threats Based Approach, the Issues Based Approach, the Events Based Approach, or a combination of these
Chapter 5: General Methods and Rules for Assessing Drinking Water Systems Vulnerability, Issues and Threats 28

Lakes Simcoe and Couchiching-Black River SPA Part 1 Approved Assessment Report
three approaches. Identification of Threats using the Issues Based Approach was described in the previous section (MOE, 2010). The Event Based Approach was designed to address threats to drinking water in systems drawing water from larger water bodies where the Vulnerability Scores are generally Low. The approach allows for the use of modeling or other methods (referred to as modeling in this bulletin (MOE, 2010)) to identify existing or future activities or existing Conditions as Significant Drinking Water Threats if the modeling results indicate that there would be a Drinking Water Issue at an intake if chemicals or pathogens were released from the location under an extreme event. It is a two part process, one part allows identification of Threats that could cause an Issue and the second part allows development of an IPZ-3 (MOE, 2010). The Event Based Approach for modeling IPZ-3 is currently being undertaken for drinking water systems in Georgian Bay and Severn Sound; these results will be presented in a future version of the Assessment Report. This remainder of this chapter will discuss how Threats are categorized using the Threats Based Approach. There are four specific requirements set out in O. Reg. 287/07 and the Rules for the completion of the Threats Assessment and Issues Evaluation component of the assessment report for each vulnerable area in a Source Protection Area:
• Listing Drinking Water Threats – Activities: Requires identification of the Activities that are or would be Drinking Water Threats for each type of vulnerable area. These Threats are different depending on whether the source of water is groundwater or surface water (Part XI.2 (Rules 118 to 125))
• Listing Drinking Water Threats – Conditions: Requires identification of the Conditions that are or would be Drinking Water Threats for each type of vulnerable area. These Threats are different depending on whether the source of water is groundwater or surface water (Part XI.3 (Rule 126))
• List Circumstances: A list of the circumstances under which each activity listed above makes or would make the Activity a Significant, Moderate, or Low Drinking Water Threat. For Conditions, include the information that confirms there is a Condition and the hazard rating for the Condition
• Identifying Areas for Significant, Moderate, and Low Drinking Water Threats – Activities: Show the areas (for example, area scoring 10) within each vulnerable area and the relevant circumstances where an Activity is or would be a Significant, Moderate or Low Drinking Water Threat. (Part XI.4 (Rules 127 – 137))
• Identifying Areas for Significant, Moderate, and Low Drinking Water Threats – Conditions: Show the areas (for example, area scoring 10) within each vulnerable area and the relevant circumstances where an Condition is or would be a Significant, Moderate or Low Drinking Water Threat (Part XI.5 Rules 138 – 143))
Chapter 5: General Methods and Rules for Assessing Drinking Water Systems Vulnerability, Issues and Threats 29

Lakes Simcoe and Couchiching-Black River SPA Part 1 Approved Assessment Report
• Enumerating Significant Drinking Water Threats: Determine the number of locations (for example, parcels of land) at which a person is engaging in an Activity that is a Significant Drinking Water Threat or where there is a Condition that is a Significant Drinking Water Threat
The following sections will discuss the requirements and methods used for each of these components.
5.5.1 Listing Drinking Water Threats – Activities Technical Rule 118 requires that all Assessment Reports list the Activities prescribed to be Drinking Water Threats in paragraph 1 through 18 and paragraph 21 of subsection 1.1(1) of Regulation 287.07 (General) be collectively listed. These Activities are:
1) The establishment, operation or maintenance of a waste disposal site within the meaning of Part V or the Environmental Protection Act.
2) The establishment, operation or maintenance of a system that collects, stores, transmits, treats or disposes of sewage.
3) The application of agricultural source material to land. 4) The storage of agricultural source material. 5) The management of agricultural source material. 6) The application of non-agricultural source material to land. 7) The handling and storage of non-agricultural source material. 8) The application of commercial fertilizer to land. 9) The handling and storage of commercial fertilizer. 10) The application of pesticide to land. 11) The handling and storage of pesticide. 12) The application of road salt. 13) The handling and storage of road salt. 14) The storage of snow. 15) The handling and storage of fuel. 16) The handling and storage of a dense non-aqueous phase liquid. 17) The handling and storage of an organic solvent. 18) The management of runoff that contains chemicals used in the de-icing of
aircraft. 19) An activity that takes water from an aquifer or a surface water body without
returning the water taken to the same aquifer or surface water body.
Chapter 5: General Methods and Rules for Assessing Drinking Water Systems Vulnerability, Issues and Threats 30

Lakes Simcoe and Couchiching-Black River SPA Part 1 Approved Assessment Report
20) An activity that reduces the recharge of an aquifer. 21) The use of land as livestock grazing or pasturing land, an outdoor confinement
area, or a farm-animal yard. Prescribed Threats 19 and 20 are considered Threats related to water quantity. These Threats can only be identified once Tier III water budgets have been completed and are therefore not included in this version of the Assessment Report. Technical Rules 119 to 122 describe the requirements under which a Source Protection Committee can add Activities to be locally considered as Drinking Water Threats with the appropriate approval by the Director. No non-prescribed Activities have been added for consideration as Drinking Water Threats in the SGBLS Source Protection Region. However the Source Protection Committee has identified a number of potential Activities that may be considered for inclusion in future Assessment Reports. These include transport corridors (e.g. Highways) and cemeteries (See Chapter 14: Assessment Report in Context, Section 14.3 for additional information). Prescribed Threat number 16 refers to Dense Non-Aqueous Phase Liquids, typically referred to as DNAPLs. This is a class of chemicals that are slightly soluble in water and are therefore often observed as a separate “oil-like” phase in the subsurface. DNAPLs can include compounds such as chlorinated solvents used to clean and de-grease machinery and creosol based wood treating oils. What makes DNAPLs so dangerous is the fact that they degrade to other compounds which are even more toxic. The oil-like phase is denser than water and as a result, the presence and migration of the DNAPL liquids is controlled more by gravity and the distribution of permeable and conductive features in the subsurface rather than by the groundwater flow directions. This class of chemicals has been considered as a special case for the assessment of the threat to groundwater-based drinking sources. The list of Activities that are prescribed as Drinking Water Threats was established using input from multiple stakeholder groups and committees. The method of determining when an activity is a Threat, and more specifically a Significant, Moderate, or Low Drinking Water Threat, is based on a semi-quantitative risk assessment that considers both the nature of the Activity itself (the hazard rating) and the vulnerability of the area in which the Activity is located. This is used to determine a Risk Score. The methodology was widely consulted on in advance of the posting of the regulations and Technical Rules around the Assessment Report.
5.5.2 Listing Drinking Water Threats – Conditions Conditions are defined as an existing contaminations associated with a past Activity that has the potential effect the quality of drinking water. For example, a previous gas station which no longer exists, but has left contamination in the ground from poorly stored fuel or a fuel leak. Technical Rule 126 requires that the list of Drinking Water Threats shall
Chapter 5: General Methods and Rules for Assessing Drinking Water Systems Vulnerability, Issues and Threats 31

Lakes Simcoe and Couchiching-Black River SPA Part 1 Approved Assessment Report
include the following Conditions that exist in a vulnerable area and that result from a past Activity:
1) The presence of a dense non-aqueous phase liquid in groundwater in a Highly Vulnerable Aquifer, Significant Groundwater Recharge Area or Wellhead Protection Area;
2) The presence of a single mass of more than 100 litres of one or more dense non-aqueous phase liquids in surface water in a surface water Intake Protection Zone;
3) The presence of a contaminant in groundwater in a Highly Vulnerable Aquifer, Significant Recharge Area or a Wellhead Protection Area, if the contaminant is listed in Table 2 of the Soil, Ground Water and Sediment Standards and is present at a concentration that exceeds the potable groundwater standard set out for the contaminant in that Table;
4) The presence of a contaminant in surface soil in a surface water Intake Protection Zone if, the contaminant is listed in Table 4 of the Soil, Groundwater and Sediment Standards is present at a concentration that exceeds the surface soil standard for industrial/commercial/community property use set out for the contaminant in that Table ; and
5) The presence of a contaminant in sediment, if the contaminant is listed in Table 1 of the Soil, Ground Water and Sediment Standards and is present at a concentration that exceeds the sediment standard set out for the contaminant in that table.
The method used to determine if a drinking water supply has a related Condition was based on reviewing records provided by the municipality, Conservation Authorities, and the MOE. In addition, historical review of aerial photographs and historical input from published and anecdotal evidence was also often used in areas where potential Conditions could exist. A list of Conditions for each drinking water supply was prepared and includes information regarding the identified water intake, the chemical or pathogen Threat and the uncertainty associated with each identified Condition. In most situations however there was insufficient data or information to determine if the contamination exceeded the standards. In some of these situations the contamination was identified as a potential Condition that requires further investigation.
5.5.3 List Circumstances Circumstances are site-specific characteristics of Threats that refine the associated level of a prescribed Threat and are used to define whether an Activity is a Significant, Moderate or Low Threat. The Province has prepared tables – Tables of Drinking Water Threats (MOE, 2008b) – which detail the circumstance for each prescribed Threat and then relates the Vulnerability of the area in which the activity is located to a Threat level
Chapter 5: General Methods and Rules for Assessing Drinking Water Systems Vulnerability, Issues and Threats 32

Lakes Simcoe and Couchiching-Black River SPA Part 1 Approved Assessment Report
of either Significant, Moderate of Low. Two sets of tables are provided, one for chemical Threats and one for pathogen Threats. Circumstances specify characteristics of a potential Threat such as the type of chemical being used, volume of storage and whether storage is above or below ground. For example, under the Handling and Storage of Pesticide Threat category, one set of circumstances relate to pesticides with a mass of less than 25 kilograms, whereas another set of circumstances relate to different pesticides with a mass between 25 and 250 kilograms. Logically, different circumstances have been developed because the risk to drinking water will vary depending on the specific details of the Activity or potential Activity. To meet the requirement for listing threat categories, the Assessment Report only needs to state that all circumstances for prescribed Threats can be found in the Tables of Drinking Water Threats (MOE, 2008b). The Assessment Report must also provide circumstances for any local Threats, but as discussed above, no local Threats have been included in this round of the Assessment Report. Example page from the Table of Drinking Water Threats. This example shows the relationship between the type of Activity (column 1), the specific circumstances (column 2), and type of vulnerable area (column 3) and the potential resulting Threat category of Significant, Moderate or Low (column 4 to 6).
Chapter 5: General Methods and Rules for Assessing Drinking Water Systems Vulnerability, Issues and Threats 33

Lakes Simcoe and Couchiching-Black River SPA Part 1 Approved Assessment Report
In addition to the official MOE Table of Drinking Water Threats (example above), a web based look-up table has been developed by the Upper Thames Valley Conservation Authority1. This website provides an easy to understand tool that can be used to identify the Activities and circumstances for all combinations of vulnerable area (e.g. WHPA-A, WHPA-B), Vulnerability Score (2 to 10) and contaminant of concern (pathogens, chemicals and DNALPS).
5.5.4 Identify Areas for Significant, Moderate, or Low Threats – Activities The Technical Rules require that areas where Activities and the associated circumstances are considered to be a Significant, Moderate, Low Drinking Water Threat to groundwater and surface water sources be identified. As discussed, only prescribed Drinking Water Threats related to drinking water quality (1 to 18 and 21) are considered in this assessment, and not those related to quantity. Threats to quantity will be assessed in future Assessment Reports. The Activities and circumstances under which Threats are considered to be a Significant, Moderate, or Low Threat to groundwater and surface water sources are described in the Table of Drinking Water Threats (MOE, 2008). For this report, maps based on the Vulnerability Scores have been prepared to illustrate where Activities are or would be Significant, Moderate, or Low Drinking Water Threats. These threats are illustrated in three different maps for each WHPA: one for Pathogen Threats, one for Chemical Threats, and one for DNAPL threats. These maps include a matrix table for each WHPA that provide a reference to a set of tables produced by MOE that list all circumstances for all combinations of Vulnerability Score, threat category (Significant, Moderate or Low) and contaminant of concern – see Table 5-6 to Table 5-8. The MOE tables referenced can be downloaded from the South Georgian Bay Lake Simcoe website.2 As the matrix tables for IPZ are too large to include on the associated maps, they have not been included, but are provided below (Table 5-9 to Table 5-10).
1 http://maps.thamesriver.on.ca/SWPThreats/ 2 http://ourwatershed.ca/documents/assessment_report/threatslist.php.
Chapter 5: General Methods and Rules for Assessing Drinking Water Systems Vulnerability, Issues and Threats 34

Lakes Simcoe and Couchiching-Black River SPA Part 1 Approved Assessment Report
Table 5-6 to 5-8: Example of the tables that are associated with each WHPA that demonstrate the possible number of Activities (under certain circumstances) that would be considered as a Threat (Low, Medium or High). Note that this means that the Threat does not necessarily exist currently. A separate table is required for pathogens, chemicals and DNAPLS.
Pathogens Vulnerability
Score1 Number of circumstances in Table of Drinking Water Threats2 Significant Moderate Low
10 16 (PW10S3) 4 (PW10M) 0 8 0 16 (PW8M) 4 (PW8L) 6 0 0 16 (PW6L)
1 Areas with vulnerability scores less than 6 can not have significant, moderate or low threats. Pathogens are not a threat in WHPA C, C1 or D: 2 The number of circumstances was determined from information distributed along with the Tables of Circumstances as prepared by the MOE from the Table of Drinking Water Threats (November 2009). 3 Refers to the MOE Table of Circumstances that corresponds to this vulnerability score and parameter (See: http://www.ene.gov.on.ca/en/water/cleanwater/provincialTables.php).
Table 5-7.
Chemicals Vulnerability
Score1 Number of circumstances in Table of Drinking Water Threats2 Significant Moderate Low
10 528 (CW10S3) 824 (C210M) 211 (CW10L) 8 5 (CW8S) 792 (CW8M) 717 (CW8L) 6 0 5 (CW6M) 1126 (CW6L)
1 Areas with vulnerability scores less than 6 can not have significant, moderate or low threats. 2 The number of circumstances was determined from information distributed along with the Tables of Circumstances as prepared by the MOE from the Table of Drinking Water Threats (November 2009). 3 Refers to the MOE Table of Circumstances that corresponds to this vulnerability score and parameter (See: http://www.ene.gov.on.ca/en/water/cleanwater/provincialTables.php).
Table 5-8.
DNAPLS Vulnerability
Score / WHPA1 Number of circumstances in Table of Drinking Water Threats2 Significant Moderate Low
WHPA A, B, C, C1 (< 5 year TOT) 25(all) (DWAS3) 0 0
6 0 3 (DW6M) 22 (DW6L) 1 Areas with vulnerability scores less than 6 can not have significant, moderate or low threats. 2 The number of circumstances was determined from information distributed along with the Tables of Circumstances as prepared by the MOE from the Table of Drinking Water Threats (November 2009). 3 Refers to the MOE Table of Circumstances that corresponds to this vulnerability score and parameter (See:
Chapter 5: General Methods and Rules for Assessing Drinking Water Systems Vulnerability, Issues and Threats 35

Lakes Simcoe and Couchiching-Black River SPA Part 1 Approved Assessment Report
Table 5-9 to 5-10: This is an example of the tables that are associated with each IPZ that demonstrate the possible number of Activities and circumstances which would be considered as a Threat (Low, Medium or High) in areas of a particular Vulnerability Score.
IPZ (Pathogens) Vulnerability
Score1 Number of circumstances in Table of Drinking Water Threats2 Significant Moderate Low
10 19 (PIPZWE10S3) 8 (PIPZWE10M) 1 (PIPZWE10L) 9 13 (PIPZWE9S) 14 (PIPZWE9M) 1 (PIPZWE9L)
8.1 12 (PIPZWE8.1S) 7 (PIPZWE8.1M) 9 (PIPZWE8.1L) 8 12 (PIPZWE8S) 7 (PIPZWE8M) 8 (PIPZWE8L)
7.2 0 13 (PIPZWE7.2M) 14 (PIPZWE7.2L) 7 0 13 (PIPZWE7M) 14 (PIPZWE7L)
6.4 0 12 (PIPZWE6.4M) 15 (PIPZWE6.4L) 6.3 0 12 (PIPZWE6.3M) 15 (PIPZWE6.3L) 6 0 12 (PIPZ6M) 15 (PIPZ6L)
5.6 0 0 19 (PIPZWE5.6L) 5.4 0 0 19 (PIPZWE5.4L) 5 0 0 13 (PIPZ5L)
4.9 0 0 13 (PIPZWE4.9L) 4.8 0 0 13 (PIPZWE4.8L) 4.5 0 0 13 (PIPZWE4.5L) 4.2 0 0 12 (PIPZWE4.2L)
1 Areas with vulnerability scores less than 4 can not have significant, moderate or low threats. 2 The number of circumstances was determined from information distributed along with the Tables of Circumstances as prepared by the MOE from the Table of Drinking Water Threats (November 2009). 3 Refers to the MOE Table of Circumstances that corresponds to this vulnerability score and parameter (See: http://www.ene.gov.on.ca/en/water/cleanwater/provincialTables.php).
http://www.ene.gov.on.ca/en/water/cleanwater/provincialTables.php).
Chapter 5: General Methods and Rules for Assessing Drinking Water Systems Vulnerability, Issues and Threats 36

Lakes Simcoe and Couchiching-Black River SPA Part 1 Approved Assessment Report
Table 5-10.
IPZ (Chemicals) Vulnerability
Score1 Number of circumstances in Table of Drinking Water Threats2 Significant Moderate Low
10 610 (CIPZ10S3) 876 (CIPZ10M) 405 (CIPZWE10L) 9 239 (CIPZWE9S) 967 (CIPZWE9M) 646 (CIPZWE9L)
8.1 14 (CIPZWE8.1S) 834 (CIPZWE8.1M) 898 (CIPZWE8.1L)
8 13 (CIPZWE8S) 835 (CIPZWE8M) 888 (CIPZWE8L)
7.2 0 436 (CIPZWE7.2M)
1176 (CIPZWE7.2L)
7 0 352 (CIPZWE7M) 1192 (CIPZWE7L)
6.4 0 71 (CIPZWE6.4M) 1282 (CIPZWE6.4L)
6.3 0 40 (CIPZWE6.3M) 1282 (CIPZWE6.3L)
6 0 13 (CIPZWE6M) 1193 (CIPZWE6L) 5.6 0 0 966 (CIPZWE5.6L) 5.4 0 0 848 (CIPZWE5.4L)
5 0 0 558 (CIPZWE5L) 4.9 0 0 551 (CIPZWE4.9L) 4.8 0 0 436 (CIPZWE4.8L) 4.5 0 0 239 (CIPZWE4.5L)
4.2 0 0 40 (CIPZWE4.2L) 1 Areas with vulnerability scores less than 4 can not have significant, moderate or low threats. 2 The number of circumstances was determined from information distributed along with the Tables of Circumstances as prepared by the MOE from the Table of Drinking Water Threats (November 2009). 3 Refers to the MOE Table of Circumstances that corresponds to this vulnerability score and parameter (See: http://www.ene.gov.on.ca/en/water/cleanwater/provincialTables.php).
5.5.5 Identify Areas for Significant, Moderate, or Low Threats - Conditions As described above, a Condition is defined as an existing contamination associated with a past Activity that has the potential effect quality of drinking water. Technical Rules 138 through 143 provide guidance on how to classify Conditions as Significant, Moderate, or Low Threats. The classification of a Condition is based on a Risk Score calculated in accordance with the following formula:
Chapter 5: General Methods and Rules for Assessing Drinking Water Systems Vulnerability, Issues and Threats 37

Lakes Simcoe and Couchiching-Black River SPA Part 1 Approved Assessment Report
A x B where, A = the hazard rating of the Condition B = the Vulnerability Score of the area (see sections 5.2.4 and 5.3.2).
According to the Technical Rules, if there is evidence that the Condition is causing off site contamination or if the Condition is on the same property as the drinking water system well, intake or monitoring well, then the hazard rating is 10. In all other situations the hazard rating is 6 (i.e. if the Condition is and will remain contained within the site). When identifying areas where a Condition is or would be a Significant, Moderate or Low For the purposes of identifying areas of Significant, Moderate or Low Condition Threats, the following apply:
• A Significant Threat when the Risk Score of the area is equal to or greater than 80 (Technical Rule 140);
• A Moderate Threat when the Risk Score is equal to or greater than 60 but less than 80; and
• A Low Threat when the Risk Score is greater than 40 but less than 60
Therefore, using the above equation, if the Hazard Score is 10 the Condition would be Significant Threat in areas with a Vulnerability Score of 8 and 10 and Moderate Threat in areas with Vulnerability Scores of 6. If the Hazard Score is 6 then the Condition is a Moderate Threat in areas with a Vulnerability Score of ten and low in an area with a vulnerability score of 6 (Table 5-11). Refer to map of Vulnerability Scores to see where Conditions are or would be potential Significant/Moderate/Low Drinking Water Threats. Table 5-11: Table used to determine potential of a vulnerable area to have Significant, Moderate or Low Condition Threats.
Vulnerability Score
Evidence that the condition is causing off-site contamination and/or condition is on a
property or well related to the drinking water system
All other situations
Hazard score
Risk score
Are or Would be Conditions Risk
Hazard score
Risk score
Are or Would be Conditions Risk
10 10 100 Significant 6 60 Moderate 8 10 80 Significant 6 48 Low 6 10 60 Moderate 6 36 Negligible risk 4 10 40 Negligible risk 6 24 Negligible risk
Chapter 5: General Methods and Rules for Assessing Drinking Water Systems Vulnerability, Issues and Threats 38

Lakes Simcoe and Couchiching-Black River SPA Part 1 Approved Assessment Report
5.5.6 Enumerate Significant Drinking Water Threats 5.5.6.1 Overview The final step in the entire process is to enumerate the number of Significant Drinking Water Threats in the WHPAs and IPZs. This requirement is under Technical Rule 9 (MOE, 2008a, p.9-11) and Paragraph 13(1)(6) of O.Reg. 287/07. In accordance with regulation, “For each vulnerable area identified under clause 15 (2)(d) or 15(2)(e) of the Act, i. the number of locations at which a person is engaging in an activity listed under subclause 15(2)(g)(i) of the Act that is or would be a significant drinking water threat, and ii. the number of locations at which a location listed under subclause 15(2)(g)(ii) of the Act is a significant drinking water threat.” The counting of Significant Threats has been accomplished using the following sets of information:
• The maps of Vulnerability Score for each vulnerable area (see Sections 5.2.2 and 5.3.2);
• Databases of Threats for each vulnerable area; and • An electronic database associated with the Table of Drinking Water Threats (The
Threats LUT Database Version 7.1.2) as provided by the MOE. In essence, these three sets for information are pulled together and analyzed for each property parcel that lies within, or intersects and WHPA or IPZ. The Vulnerability Score defines how easily the municipal water supply is to contamination, the higher the Vulnerability Score (on a scale of 1 to 10), the more likely it is that an Activity may be a Threat to the water supply. While Threats related to chemicals and pathogens can only occur in areas that have a Vulnerability Score greater than 8, DNAPL threats can be significant in any WHPA with a time of travel <5 years (i.e. WHPA A-C). As described below, the Threats LUT database is then used to link the potential Threats on the property to the Table of Drinking Water Threats, which helps determine if the Threat is Significant, Moderate or Low. While each consultant enumerating Significant Threats in the SGBLS Source Protection Region followed the same general approach, notable differences in the methods and information sources used were noted during development of draft technical reports. Without intervention, these inconsistencies would have led to difference in the way that a land use activities in one vulnerable area is classified (i.e. potential Significant Threat or not) compared to another if not resolved. Recognizing the importance of reducing these inconsistencies, and under the direction of SWP committee, an exercise was undertaken to ensure consistency in Threats Enumeration across the Source Protection Region. The process to establish consistent standards involved: 1) Identifying which threat subcategories the inconsistencies were occurring within; 2) Identifying why the inconsistencies were occurring; (3) Resolving the differences through a series of workshops and meetings, ranking evaluation and seeking further clarification from the Province. Due to the alternate approaches to identifying Significant Threats (i.e. Threat
Chapter 5: General Methods and Rules for Assessing Drinking Water Systems Vulnerability, Issues and Threats 39

Lakes Simcoe and Couchiching-Black River SPA Part 1 Approved Assessment Report
specific database versus identifying land uses from the MOE Look-Up Tables (LUT)) it will never be possible to have complete consistency in identification of potential Significant Threats. Moreover, the approach taken was to ensure standardization in application of the LUT approach and the associated circumstance assumptions. This process of reducing inconsistencies in enumerating Significant Threats was documented in SGBLS, 2010. Since there were different approaches used for the identification of Significant Threats, the reader is directed to the specific chapters and technical studies for details. Here we provide a general outline of the methods undertaken by studies completed by the consultant Genivar.
5.5.6.2 Threats inventory database Identification of potential Threats on each property parcel is based on a series of databases that georeference potential Threats in the region. These databases have been populated through Threat inventory surveys, existing databases such as the Municipal Property Assessment Corporation (MPAC) database, and GIS property fabric layers. The databases, which contain information such as the type of Activity and location, are then cross referenced against the MOE activities database to develop a list of potential Significant Drinking Water Threats. Before the number of Significant Drinking Water Threats and the number of parcels containing Significant Drinking Water Threats can be determined, there are a couple of necessary steps that need to be taken to generate information required in the analysis. This information includes pre-classification of Managed Lands, Livestock Density, and Impervious Surfaces associated with the vulnerable areas. These values are required to identify landuse activities that correspond with specific circumstances in the Table of Drinking Water Threats. The methods followed are described below. Managed Lands Managed Land means land to which agricultural source material (ASM), commercial fertilizer, or non-agricultural source material (NASM) is applied (MOE, 2008a) The proportion and distribution of Managed Lands were determined following the basic approach described in the “Technical Bulletin: Proposed Methodology for Calculating Percentage of Managed Lands and Livestock Density for Land Application of Agricultural Source Material and Commercial Fertilizers” (MOE, 2009b). The areas of Managed Lands were generally identified from the MPAC property codes and landuse data and were verified by orthophotography. The area of Managed Lands was determined on a parcel level for each vulnerable area where the Vulnerability Score is sufficient to result in a Significant, Moderate, or Low Drinking Water Threat. In order to maintain consistency across the South Georgian Bay-Lake Simcoe Source Protection Region, a decision was reached to continue to estimate Managed Land Areas using the total area of properties that intersect individual vulnerable areas.
Chapter 5: General Methods and Rules for Assessing Drinking Water Systems Vulnerability, Issues and Threats 40

Lakes Simcoe and Couchiching-Black River SPA Part 1 Approved Assessment Report
The Percent Managed Land was determined for each vulnerable area as follows:
Managed Land Area within Properties Intersecting Vulnerable Area x 100% Total Area of Properties Intersecting Vulnerable Area
In the case where a property intersects more than one vulnerable area, the property was included in the Managed Land calculation for each area. The calculated % Managed Lands were grouped in a geodatabase to reflect the ranges used in the Table of Drinking Water Threats:
• % Managed Land < 40%
• % Managed Land > 40% and < 80%
• % Managed Land > 80% From this analysis, a Managed Land Map was prepared to illustrate the distribution of Managed Lands and the above classifications for each vulnerable area associated with the municipal water supply intake or well. Livestock Density The Livestock Density was estimated following the basic approach described in the “Technical Bulletin: Proposed Methodology for Calculating Percentage of Managed Lands and Livestock Density for Land Application of Agricultural Source Material and Commercial Fertilizers” (MOE, 2009b). The Livestock Density is required for evaluation of specific threats circumstances in the Table of Drinking Water Threats. The Livestock Density was estimated on a parcel level (parcels identified as Agricultural Managed Lands3) for each vulnerable area where the Vulnerability Score is sufficient to result in a Significant, Moderate, or Low Drinking Water Threat. The entire area of a parcel that intersects the vulnerable area was included in the calculation. The number of nutrient units on each parcel was estimated using the type of livestock and the barn size as outlined in the Technical Bulletin (MOE, 2009b). The Livestock Density was estimated for each vulnerable area as:
Sum of Nutrient Units in All Properties Intersecting Vulnerable Area Total Area of Agricultural Managed Lands in Properties Intersecting Vulnerable Area
The livestock density was grouped in the Geodatabase to reflect the ranges used in the Table of Drinking Water Threats:
3 Agricultural managed land is managed land that is used for agricultural production, including areas of cropland, fallow land, and improves pasture where agricultural source material, commercial fertilizer, or non-agricultural source material (NASM) is applied or may be applied (MOE, 2008a)
Chapter 5: General Methods and Rules for Assessing Drinking Water Systems Vulnerability, Issues and Threats 41

Lakes Simcoe and Couchiching-Black River SPA Part 1 Approved Assessment Report
• Livestock Density: < 0.5 Nutrient Units/Acre
• Livestock Density: > 0.5 Nutrient Units/Acre; <1.0 Nutrient Units/Acre
• Livestock Density: > 1.0 Nutrient Units/Acre From this analysis, a Livestock Density Map was prepared to illustrate the distribution of Livestock Density and the above classifications for each vulnerable area associated with the municipal water supply intake or well. Impervious Surfaces The proposed amendments to Technical Rule 16(11) (August 2009) requires the Assessment Report to include maps showing the percentage of surface area where road salt could be applied to impervious surfaces within the vulnerable areas. The proportion of impervious areas within the identified vulnerable areas was determined as follows:
• A 1 km square grid was set up based on the centre of each Source Protection Region or vulnerable area;
• The impervious area (where salt could be applied for winter de-icing purposes) was estimated for road right of way and individual land parcels designated as parking lots in the MPAC database;
• The proportion of Impervious Surface within each 1 km grid square was determined by GIS.
The Impervious Surface proportion within individual grid cells was grouped in the Geodatabase to reflect the following ranges:
• Impervious Surface: < 1%/km2
• Impervious Surface: > 1%/km2 ; < 8%/km2
• Impervious Surface: > 8%/km2 ; <80%/km2
• Impervious Surface: ≥ 80%/km2 From this analysis, a Total Impervious Surface Area Map was prepared to illustrate the distribution of Impervious Surfaces within the portion of each vulnerable area where a Drinking Water Threat could be associated with the municipal water supply intake or well. This map does not truly reflect the total area of Impervious Surfaces as the area of buildings and parking lots on private lands are not included. This is appropriate as the intent of the mapping is to reflect an increased Threat related to the application of winter deicing agents. Within the SGBLS SPR there are a few systems which have vulnerable areas that cross Source Protection Area boundaries. In some situations the impervious surface area was based on a grid for the entire SGBLS SPR surface and not just the SPA. The method of using separate grids centered on each SPA, as required by the Technical Rules, do not
Chapter 5: General Methods and Rules for Assessing Drinking Water Systems Vulnerability, Issues and Threats 42

Lakes Simcoe and Couchiching-Black River SPA Part 1 Approved Assessment Report
necessarily align with the next SPA grid. Because of this, vulnerable areas that cross boundaries could have inconsistent results where the grids are mismatched. To address this, a single grid surface method was recommended in these particular situations to ensure consistent impervious surfaces percentages across the vulnerable area. Directors Approval was given on January 18, 2010 for the use of this alternate method for all three Source Protection Areas within the SGB-LS SPR. The alternative method is equal to or better than that stated in the Technical Rules in that the single grid surface crosses over SPA boundaries, creating a continuous grid surface for vulnerable areas that cross the boundaries. Additionally, the use of a single grid surface is also consistent with in-house grids and may enable improved data comparison in future studies.
5.5.6.3 Identify Significant Threats Using the Table of Drinking Water Threats
Once the Vulnerability Score of an area has been determined and potential threat Activities for all properties within the vulnerable area (WHPA or IPZ) identified, then the number of properties with Significant Drinking Water Threats can be identified and enumerated. This final step relies on an electronic database associated with the Table of Drinking Water Threats called the Threats Look Up Table (LUT) Database. As discussed in Section 5.5.3, the Table of Drinking Water Threats make a link between the hazard rating of an Activity under a specific circumstance and for a specific source, and the Vulnerability Scores needed to make the activity/circumstance a Significant, Moderate, or Low Drinking Water Threat. By multiplying the hazard rating and the Vulnerability Score, a Risk Score is generated (in the same manner that a Risk Score is assigned to Conditions – Section 5.5.5). These Risk Scores are then assigned a Threat classification according Table 5-12: Table 5-12: The range of Drinking Water Threat classifications assigned to Risk Scores.
Risk Score Range Drinking Water Threat
Classification 80-100 Significant 60-<80 Moderate >40 - <60 Low
The Hazard Ratings are not provided in the Tables, but are available within the LUT database that generated the Tables. Hazard Ratings are based on factors such as the parameter toxicity, quantity, release method and environmental fate. The lookup table takes the hazard rating for each Activity (with a specific set of circumstances) and back calculates the Vulnerability Scores necessary for the Activity to fall in the Risk Score ranges above. Therefore, if the Hazard Rating is 8.5 for an Activity in a surface water
Chapter 5: General Methods and Rules for Assessing Drinking Water Systems Vulnerability, Issues and Threats 43

Lakes Simcoe and Couchiching-Black River SPA Part 1 Approved Assessment Report
environment, then theoretically that Activity would be a Significant Drinking Water Threat in a vulnerable area that has a Vulnerability Score of 9.5 or higher (9.5 multiplied by 8.5 equals 80.75 which is within the Significant Risk Score range). However, the Tables will show a Vulnerability Score of 10 for surface water under the column labelled Significant (column 3 in the figure below). This is because the multiplication of Area Vulnerability Factors and Source Vulnerability Factors do not allow a Vulnerability Score of 9.5. So the Table includes a Vulnerability Score of 10 rather than the theoretical Vulnerability Score range of 9.5 to 10. This final step is repeated for each property within the vulnerable area, with number of properties for each prescribed Threat type that are Significant recorded for enumeration purposes. Once this first stage of enumeration was completed, the Drinking Water Threats are then tabulated as shown in Table 5-13. As required under the Technical Rules, property owners where Activities were considered to be Significant Threats and where there was High uncertainty in the assignation were consulted in accordance with the Section 88 property entry rules. This information was used to confirm that a potential Significant Drinking Water Threat is present and is therefore included in the enumeration of Significant Drinking Water Threats. While considerable effort has been taken to accurately assess Activities and land uses in the region, errors in identifying the type of Activities and the circumstances may have occurred. Furthermore, as land use and Activities are also constantly changing these databases will be updated regularly to include the most recent information collected or provided.
Chapter 5: General Methods and Rules for Assessing Drinking Water Systems Vulnerability, Issues and Threats 44

Lakes Simcoe and Couchiching-Black River SPA Part 1 Approved Assessment Report
Table 5-13: Example of the type of table used to show the number of Significant Drinking Water Threats in the vulnerable areas.
5.5.6.4 Refinement of Significant Drinking Water Threats Enumeration In 2013, a threats enumeration refinement exercise was undertaken across the Source Protection Region. In the Lake Simcoe watershed this exercise was completed by Source Protection Authority and municipal staff members. Table 5-14 documents the agencies responsible for completing the threat refinement in each municipality within the Lake Simcoe watershed.
# # # #threats parcels threats parcels
1The establishment, operation or maintenance of a waste disposal site within the meaningof Part V or the Environmental Protection Act. 1 1
2The establishment, operation or maintenance of a system that collects, stores, transmits,treats or disposes of sewage. 1 1
3 The application of agricultural source material to land.4 The storage of agricultural source material.5 The management of agricultural source material.6 The application of non-agricultural source material to land.7 The handling and storage of non-agricultural source material.8 The application of commercial fertilizer to land.9 The handling and storage of commercial fertilizer.
10 The application of pesticide to land. 1 111 The handling and storage of pesticide.12 The application of road salt.13 The handling and storage of road salt.14 The storage of snow.15 The handling and storage of fuel. 1 116 The handling and storage of a dense non-aqueous phase liquid. 2 2 2 217 The handling and storage of an organic solvent.18 The management of runoff that contains chemicals used in the de-icing of aircraft.
19 An activity that takes water from an aquifer or a surface water body without returning thewater taken to the same aquifer or surface water body.
20 An activity that reduces the recharge of an aquifer.
21The use of land as livestock grazing or pasturing land, an outdoor confinement area, or afarm-animal yard.
6 3 2 2
Enumeration of Significant Threats (Wellhead Protection Areas)
TOTALTOTAL NUMBER OF SIGNIFICANT THREATS:
TOTAL PARCELS WITH SIGNIFICANT THREATS:
Threat
Significant Threat Counts by Vulnerability ScoreVS=10 WHPA B & C
Note: The number of parcels identified will typically be less than the number of significant threats as multiple threats can be observed per parcel.
58
Chapter 5: General Methods and Rules for Assessing Drinking Water Systems Vulnerability, Issues and Threats 45
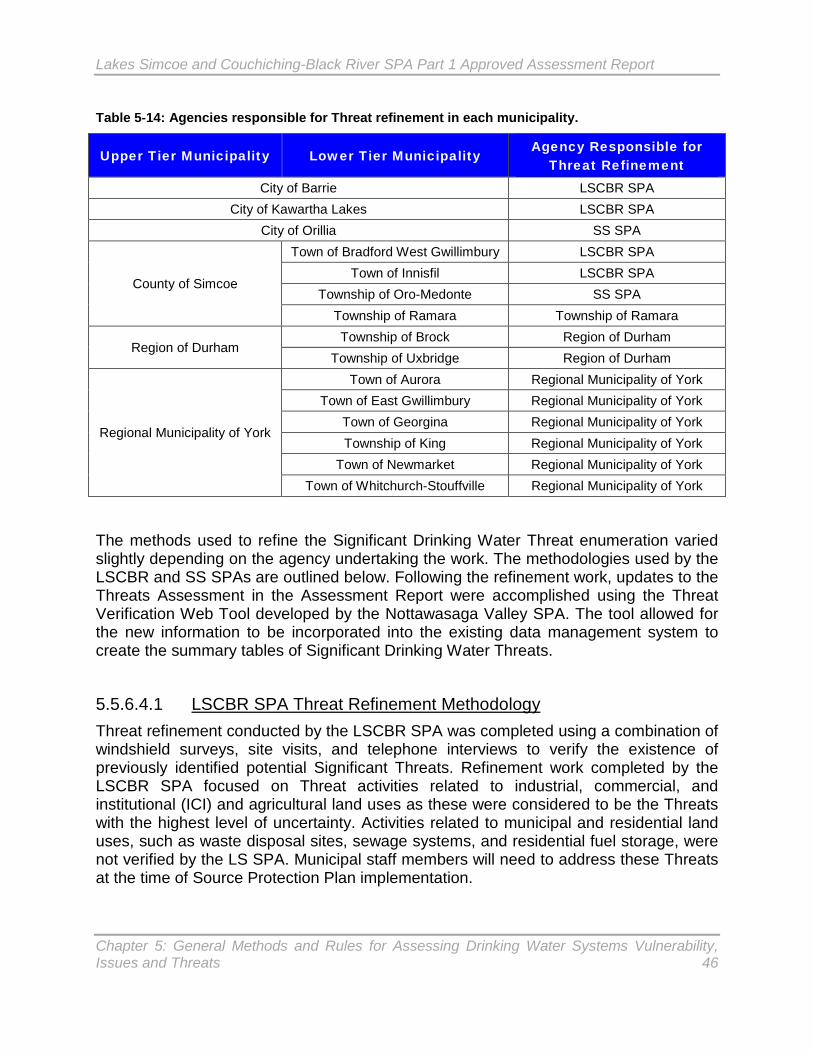
Lakes Simcoe and Couchiching-Black River SPA Part 1 Approved Assessment Report
Table 5-14: Agencies responsible for Threat refinement in each municipality.
Upper Tier Municipality Lower Tier Municipality Agency Responsible for
Threat Refinement City of Barrie LSCBR SPA
City of Kawartha Lakes LSCBR SPA City of Orillia SS SPA
County of Simcoe
Town of Bradford West Gwillimbury LSCBR SPA Town of Innisfil LSCBR SPA
Township of Oro-Medonte SS SPA Township of Ramara Township of Ramara
Region of Durham Township of Brock Region of Durham
Township of Uxbridge Region of Durham
Regional Municipality of York
Town of Aurora Regional Municipality of York Town of East Gwillimbury Regional Municipality of York
Town of Georgina Regional Municipality of York Township of King Regional Municipality of York
Town of Newmarket Regional Municipality of York Town of Whitchurch-Stouffville Regional Municipality of York
The methods used to refine the Significant Drinking Water Threat enumeration varied slightly depending on the agency undertaking the work. The methodologies used by the LSCBR and SS SPAs are outlined below. Following the refinement work, updates to the Threats Assessment in the Assessment Report were accomplished using the Threat Verification Web Tool developed by the Nottawasaga Valley SPA. The tool allowed for the new information to be incorporated into the existing data management system to create the summary tables of Significant Drinking Water Threats.
5.5.6.4.1 LSCBR SPA Threat Refinement Methodology Threat refinement conducted by the LSCBR SPA was completed using a combination of windshield surveys, site visits, and telephone interviews to verify the existence of previously identified potential Significant Threats. Refinement work completed by the LSCBR SPA focused on Threat activities related to industrial, commercial, and institutional (ICI) and agricultural land uses as these were considered to be the Threats with the highest level of uncertainty. Activities related to municipal and residential land uses, such as waste disposal sites, sewage systems, and residential fuel storage, were not verified by the LS SPA. Municipal staff members will need to address these Threats at the time of Source Protection Plan implementation.
Chapter 5: General Methods and Rules for Assessing Drinking Water Systems Vulnerability, Issues and Threats 46

Lakes Simcoe and Couchiching-Black River SPA Part 1 Approved Assessment Report
Step 1: Windshield Survey During windshield surveys, staff would drive by the land parcel in question to verify the current land use and associated activities on the land parcel. If the land use did not have the potential for a Significant Threat activity to be present, the Significant Drinking Water Threat was eliminated. If the land use matched with the land use originally identified, or otherwise had the potential for a Significant Threat activity to be occurring, then contact was made by either a site visit or a phone interview. Step 2: Site Visit Where appropriate, a site visit was conducted. In most cases this was the preferred approach for making contact at ICI properties. During site visits, the business owner, manager, or an appropriate staff member was asked to complete a voluntary questionnaire that would enable verification staff to determine if activities taking place on the property matched with circumstances for a Significant Threat in the Table of Drinking Water Threats. The Threat verification questionnaires were based on those provided in Module 2 of the Source Water Protection Implementation Guide (available at www.ourwatershed.ca). If participation in the questionnaire was refused, then the potential Threat is still included in the Assessment Report and will need to be verified by municipal staff members or representatives at the time of Source Protection Plan implementation. In cases where the information provided on the questionnaire was not sufficient to verify a Threat with certainty, the Threat also remains in the Assessment Report and will require further investigation by municipal staff members or representatives. Step 3: Telephone Interview In situations where a site visit was not appropriate or when there was a need to follow up later, contact was made by telephone. The telephone interview involved completing the verification questionnaire over the phone or, alternatively, making an agreement to transmit the questionnaire in some other method (email, fax, or mail).
5.5.6.4.1 Severn Sound SPA Threat Refinement Methodology The verification of potential SDWT activities conducted by SS SPA was completed using information collected through a combination of windshield surveys, a review of existing and previously collected data, and interviews with property owners, tenants, and municipal staff members. Refinement work completed by the SS SPA focused on Threat activities related to industrial, commercial, and institutional (ICI), agricultural, residential, and municipal land uses.
Chapter 5: General Methods and Rules for Assessing Drinking Water Systems Vulnerability, Issues and Threats 47
Lakes Simcoe and Couchiching-Black River SPA Part 1 Approved Assessment Report
Step 1: Mapping and Existing Information Review Using existing vulnerable area mapping, information collected during municipal septic inspection programs (where available), and orthophotography, staff members were able to verify a large number of SDWTs related to private residential septic systems. In some cases, although the land parcel intersected with the vulnerable area, the septic system for that property was not actually within an area with a sufficient vulnerability score to be considered a SDWT and therefore the Threat was removed. The mapping review also helped to facilitate planning of windshield surveys and interviews. Step 2: Windshield Survey During windshield surveys, staff would drive by the land parcel in question to verify the current land use and associated activities on the land parcel. If the land use did not have the potential for a Significant Threat activity to be present, the SDWT was eliminated. If the land use matched with the land use originally identified, or otherwise had the potential for a Significant Threat activity to be occurring, then staff would proceed to the next step in the verification process. Windshield surveys also sometimes identified new land use activities that could be potential SDWTs. Step 3: Interviews and Site Visits In order to collect the necessary information to verify the existence of SDWTs, different approaches were used to make contact with land owners, tenants, or representatives for different types of land use activities. Using the information collected, the activities occurring on a given property were compared to the circumstances in the Tables of Drinking Water Threats to verify the existence of SDWTs. Municipal properties and associated potential SDWTs were discussed at meetings with municipal staff members. Agricultural properties and associated potential SDWTs were verified by approaching local agricultural community leaders to act as liaisons when approaching the people actually involved in the potential Threat activities. This was sometimes the landowner and sometimes the renter of the land for agricultural purposes. The owners of rented properties were also contacted as necessary to obtain additional information. The properties associated with the possible handling and storage of dense non-aqueous phase liquids (DNAPLs) were sent letters explaining that staff would visit the site to obtain more information in support of Source Water Protection. The letters were followed by appointments arranged with either the owner of the property or with the business renting the property (or unit of the property).
5.6 ACKNOWLEDGEMENTS It is acknowledged that sections of this chapter have been extracted, or based on, numerous other reports and documentation, including the Genivar Technical Memo A5, MOE bulletins, and other consultant reports.
Chapter 5: General Methods and Rules for Assessing Drinking Water Systems Vulnerability, Issues and Threats 48