Chapter 5: CONCLUSIONS - rand.org · implications of this study are briefly ... significance and of...
25
94 Chapter 5: CONCLUSIONS “At your age the heyday in the blood is tame, it’s humble.” Shakespeare (Hamlet to Gertrude) This chapter consists of Basic Conclusions, Policy Analysis and Technical Conclusions. After summarizing the statistical findings, Basic Conclusions places the results within the diffusion framework presented in Chapter 1. Policy Analysis discusses broad policy implications, specific policy issues and the future of HMOs. Technical Conclusions compares the findings with the prior expectations and with the results of previous studies. The methodological implications of this study are briefly discussed, and numerous suggestions for further research are offered. A brief Chapter Summary concludes this chapter and the main part of this study. A. Basic Conclusions A1. RESEARCH FINDINGS The regression analysis of HMO growth in the 1973 to 1978 period shows a connection between provider variables and HMO growth. As discussed in Chapter 4, MD and RN variables show strong explanatory power when HMO enrollment growth in cities that had operational HMOs in 1973 is analyzed. A local tradition of the group practice of medicine appears to have been especially favorable for HMO growth. On the MSA level, an increase in the number of physicians in group practice by 1% of the physician population is associated with a .17% increase in overall HMO market share. 145 The congruence between group practice and HMO management during this period may be responsible for this relationship. The overall proportion of MDs in the population also generated a statistically significant positive association. It appears that increased competition for patients drove many physicians to affiliate with distasteful HMOs. Although these 2 relationships reflect distinct mechanisms, together they suggest that MD acceptance was essential. The overall proportion of RNs in the population is positively associated with HMO growth during the mid 1970s. This may have been a consequence of surplus value being transferred from nurses to hospitals to HMOs, and other attributes of nurses may have contributed to it. We also see that HMOs tended to grow more rapidly in MSAs of lesser Latitudes, i.e. more southerly cities. The most likely explanation for this unprecedented finding is that Latitude is a proxy for Firm Size or other economic variables that are difficult to measure directly. Numerous hypothesized variables do not show any relationship with HMO growth during the 1973-78 period. No direct measure of any hospital attribute shows any relationship. Available measures of Per Capita Income, market power of Blue Cross plans and several other variables showed no effect. 146 145 In a hypothetical city with 1 million people and 1,500 MDs during this period, an increase of 15 MDs in Group Practice in 1975 is associated with an increase of 1,700 HMO members from 1973 to 1978. 146 Table 4-7 lists the 25 variables that were tested and provides a quick summary of findings for each.
-
Upload
hoangtuyen -
Category
Documents
-
view
221 -
download
0
Transcript of Chapter 5: CONCLUSIONS - rand.org · implications of this study are briefly ... significance and of...

94
Chapter 5: CONCLUSIONS “At your age the heyday in the blood is tame, it’s humble.” Shakespeare (Hamlet to Gertrude) This chapter consists of Basic Conclusions, Policy Analysis and Technical Conclusions. After summarizing the statistical findings, Basic Conclusions places the results within the diffusion framework presented in Chapter 1. Policy Analysis discusses broad policy implications, specific policy issues and the future of HMOs. Technical Conclusions compares the findings with the prior expectations and with the results of previous studies. The methodological implications of this study are briefly discussed, and numerous suggestions for further research are offered. A brief Chapter Summary concludes this chapter and the main part of this study. A. Basic Conclusions A1. RESEARCH FINDINGS The regression analysis of HMO growth in the 1973 to 1978 period shows a connection between provider variables and HMO growth. As discussed in Chapter 4, MD and RN variables show strong explanatory power when HMO enrollment growth in cities that had operational HMOs in 1973 is analyzed. A local tradition of the group practice of medicine appears to have been especially favorable for HMO growth. On the MSA level, an increase in the number of physicians in group practice by 1% of the physician population is associated with a .17% increase in overall HMO market share.145 The congruence between group practice and HMO management during this period may be responsible for this relationship. The overall proportion of MDs in the population also generated a statistically significant positive association. It appears that increased competition for patients drove many physicians to affiliate with distasteful HMOs. Although these 2 relationships reflect distinct mechanisms, together they suggest that MD acceptance was essential. The overall proportion of RNs in the population is positively associated with HMO growth during the mid 1970s. This may have been a consequence of surplus value being transferred from nurses to hospitals to HMOs, and other attributes of nurses may have contributed to it. We also see that HMOs tended to grow more rapidly in MSAs of lesser Latitudes, i.e. more southerly cities. The most likely explanation for this unprecedented finding is that Latitude is a proxy for Firm Size or other economic variables that are difficult to measure directly. Numerous hypothesized variables do not show any relationship with HMO growth during the 1973-78 period. No direct measure of any hospital attribute shows any relationship. Available measures of Per Capita Income, market power of Blue Cross plans and several other variables showed no effect.146
145 In a hypothetical city with 1 million people and 1,500 MDs during this period, an increase of 15 MDs in Group Practice in
1975 is associated with an increase of 1,700 HMO members from 1973 to 1978. 146 Table 4-7 lists the 25 variables that were tested and provides a quick summary of findings for each.

95
Regression results for the period 1988 to 1993 are weaker, both in terms of statistical significance and of material relationships with HMO growth. Once again, most of the hypothesized relationships are not remotely borne out by statistical testing. However, there is an extraordinary suggestion that the proportion of Group Practice MDs and the number of MDs per capita actually had a negative effect on growth during the later period.147 There was also a finding that Economic Growth had a negative association with enrollment growth during this period, also an initially surprising finding.148 A2 FINDINGS WITHIN THE DIFFUSION FRAMEWORK In Chapter 1, an applicable framework on the diffusion of innovations was reviewed. Based on the work of Lawrence A. Brown, this framework uses 6 elements to define the process and extent of diffusion. It offers 4 categories of factors that influence the establishment of diffusion agencies and the success of the diffusion; these categories are market potential, public exposure, agency characteristics (in this case characteristics of individual HMOs) and the role of other institutions. Brown also incorporates product life cycle stages from the marketing literature, namely introduction, growth, maturity and decline. Product life cycle fits in well with this literature because it illustrates how successful diffusion strategies can, and often do, change over time. Chapter 1 showed that the research design of this study is consistent with Brown’s framework. In particular, the conduct of parallel statistical analyses for 2 time periods separated by 15 years allows for possible advancement of the HMO product and industry from one life cycle stage to another. It was noted that the explanatory variables employed in this study primarily relate to the categories of market potential and role of other institutions. The role of other institutions receives particular attention because HMO relationships with physicians have always been crucial to the success of the industry. However, the physician relationship issues that (mostly) fledgling HMOs faced in 1970s were very different than those that faced many large and growing HMOs in the 1990s. MDs per capita and 4 other physician workforce variables were hypothesized to affect the rate of HMO growth on the MSA level. Chapter 2 discussed how the diffusion of innovation literature relates to literature on the economics of HMOs. Specifically, the health economics concept of favorable and adverse selection relates to the adopter categorization system. Typically, diffusion researchers classify the very first adopters of an innovation as “innovators” and those who adopt well ahead of the majority as “early adopters.” Although the concept of selection is different in several respects, the adopter categorization system provides a helpful analogy for understanding why the evidence indicates that favorable selection is less of a factor behind HMO cost savings than it may have been in the 1970s and 1980s. Chapter 2 also discusses findings from the late 1990s that HMO enrollees disproportionately tend to be willing to trade off provider choice for health care cost savings. This suggests that 147 In the final model for the late 80s/early 90s, both Group Practice and MDs per capita associations fall just shy of statistical
significance. 148 As would be expected, the Economic Growth and Per Capita Income variables were highly correlated in the 1988 to 1993
data set, and it was difficult to determine which variable was should be included in the final model. Please see Chapter 4, pages 13-14, for an explanation of the choice of Economic Growth.

96
the natural market for HMO health insurance does not include the entire U.S. population but only persons with certain attitudes and circumstances that are congruent with HMO enrollment. As a result, it becomes plausible that the HMO industry reached maturity in the 1990s despite never enrolling more than 30% of the U.S. population. The results of this study, presented in Chapter 4, offer significant evidence that the relationship between HMOs and the physician profession changed substantially between the 1970s and the early 1990s. In the earlier period, more physicians in group practice and a higher concentration of physicians overall were associated with faster growth, but in the later period these factors showed a moderate association with declines in HMO enrollment. Non-physician factors associated with HMO growth also changed. When these results are viewed within the diffusion of innovations framework, it appears that the HMO industry was approaching maturity in the late 1980s and early 1990s. If the adopter categorization system is applied to entire MSAs, these results suggest that the innovator and early adopter cities had passed their period of maximum growth by 1988, and rapid growth was more likely to be seen in late majority and laggard cities. This interpretation implies that cities that earlier were hospitable to the HMO movement started to see their growth curves level off and that the previously less favorable cities began to catch up. This suggestion is reinforced by subsequent national HMO enrollment trends. U.S. HMO enrollment reached a peak of 80.5 million in 1999 and decreased to 78.0 million by 2001 (InterStudy 2002). This pattern of plateauing or slow decline is consistent with the HMO product reaching maturity.

97
B. Policy Analysis This section is divided into 3 sub-sections. The 1st sub-section addresses 3 broad policy implications of this study. Policy implication #1 is that the changing nature of the HMO industry may open up new policy levers. But policy implication #2 is that, based on the available evidence, it is unlikely that new policies can easily or directly increase commercial HMO enrollment. Policy implication #3 is that HMO enrollment tends to plateau. The 2nd sub-section addresses the inter-related issues of health care costs, the appropriate level of government to regulate HMOs and a bill of rights for HMO patients. The 3rd sub-section provides some thoughts concerning the future of HMOs. B1 BROAD POLICY IMPLICATIONS This research has 3 broad policy implications. First, plausible causal factors associated with HMO growth or decline have changed in the past, and they may change again. Therefore, continued research is needed so that policy makers can be advised of any new policy levers that might influence HMO enrollment in the decade of the 2000s. However, the second implication is that policies within the normal range of government actions are unlikely to easily or directly increase commercial HMO enrollment.149 One of the original motivations of this study was to find policy levers by which government could increase HMO enrollment, particularly commercial enrollment, without mandating it. However, the factors found to be influential are usually not directly controlled by government policy, or influencing those factors would entail numerous other consequences besides a possible change in HMO enrollment. Therefore, if the desire to encourage HMO enrollment were to return, it would be difficult to find clear or efficient levers to serve that purpose. Since this study applies to the MSA level, the results of this study more directly apply to state and local HMO policy than to federal policy. For example, the 1990s analysis presents substantial evidence that economic growth/ per capita income is negatively related to HMO growth. However, it would be absurd for any level government to deliberately reduce economic growth and per capital income for the purpose of increasing HMO enrollment. If the purpose were to decrease HMO enrollment, this finding is still of no help because economic growth is already a paramount goal of government at all levels, and they are already seeking to promote it as well as they can. The results of the 1990s analysis also hold out the possibility that physician variables may still have some influence on HMO enrollment, with the caveat that any current influence is actually opposite in direction from that which may have prevailed during the 1970s. However, any public policy that affected the supply of physicians or the prevalence of group practice would have numerous effects on the health care system besides any possible effect on HMO
149 Naturally, there is always the possibility of government intervention for the purpose of discouraging or even eliminating
HMOs. For example, state governments could add difficult or impossible requirements for the issuance of an HMO license. However, such policies are not currently being contemplated, and analysis of their potential effects is beyond the scope of this study.

98
enrollment. Therefore, any suggestion that physician workforce policy should be revamped in the hopes of generating a noticeable impact on HMO enrollment would neither be plausible nor defensible. The same logic applies to the related finding of Dranove et al (1998) that hospital concentration is negatively associated with HMO market share. There is no possibility that basic policy concerning the concentration of the hospital industry will be changed solely, or even primarily, for the purpose of influencing HMO enrollment. Review of previous federal health policy initiatives leads to a similar conclusion that substantially increasing HMO enrollment would be difficult. The White House health care reform plan of 1993 proposed very substantial changes in the health economy, and a major concept of this plan was to use HMOs to control costs and improve access to care. President Clinton, First Lady Hillary Clinton and their advisers clearly believed it was not possible to achieve such effects without sweeping change.150 Further back, the HMO Act of 1973 was intended to encourage HMO growth, but the HMO movement was growing rapidly before the Act was passed. The Act may have hurt enrollment as much as it helped it.151 Both these episodes illustrate the difficulty of increasing commercial enrollment through deliberate government policy. The 3rd broad policy implication is that there is excellent reason to believe that the growth years of the HMO industry are over. This is of interest to policy analysts and policy makers because policies are often implemented, and often produce their effects, over a period of many years. Policy makers need to judge whether the health insurance industry of 10 years hence will be dominated by HMOs, or whether it is likely to have a structure similar to that which currently prevails.152 The evaluation of many health care and health finance policies, including proposals for coverage of prescription drugs by Medicare, may be altered depending on beliefs concerning the future of U.S. health insurance. The observed shift in factors affecting HMO growth suggests that enrollment tends to plateau on the MSA level. On the national level, enrollment has peaked, and it has gone down slightly in the last 4 years. Congruent with the national results, enrollment seems to be stable or slightly declining in most states. Therefore, a similar condition seems to prevail on several levels. The previous discussion of the diffusion of innovations and the product life cycle shows why this development is logical, based on published theory and empirical work for other industries. Further research on the HMO product life cycle might support, deepen and elaborate on this analysis.
150 Congress and the public rejected the White House proposal because they believed it entailed too much risk and not enough
benefit to justify such sweeping changes. 151 Specifically, the Kaiser system, which accounted for most of national HMO enrollment in 1973, reduced its expansion
program in response to the HMO Act! Brown, Lawrence D. Politics and Health Care Organization: HMOs as Federal Policy, 1983, p.330. Additionally, the analysis of HMO growth from 1973 to 1978 presented here did not show any effects that could readily be attributed to the Act. However, it may have contributed to HMO growth in the long run by increasing awareness of the HMO concept and signaling that legislatures would be unlikely to ban or repress HMOs.
152 Clearly, there are numerous other possibilities for health insurance in the year 2013, including scenarios in which HMO enrollment is much smaller than it is now.
99
B2 SPECIFIC POLICY ISSUES
Chapter 1 introduced several policy issues, including the relationship between HMO growth and health care cost control. If the question is whether HMOs can continue to serve as tools for cost control in the commercial insurance market, then the evidence appears positive. At this point, the strong preponderance of the evidence is that HMOs reduce health care costs, and they have had a major impact on costs because they have evolved and adapted to local market conditions throughout the country. Insofar as the basic issues in the health economy have not changed, it appears the HMO industry is capable of adapting to the conditions of the 2000s and continuing to offer cost control options to consumers and businesses. However, if the question is whether further government policy to encourage HMO enrollment is likely to prevent further escalation of health care costs, then the answer is no. As discussed above, government policy does not have that much influence over HMO enrollment, especially not in the commercial market, and the ability of HMOs to control costs may be less today than it was 10 years ago. As was discussed in Chapter 1, recent policy initiatives at both the State and Federal levels have tended to reduce, rather than expand, commercial HMO cost control capabilities. Another policy issue concerns whether Federal or State governments should take the lead in regulating HMOs. This study has not found strong grounds for either substantially different policy across the 50 states or for Federal imposition of a uniform policy nationwide. Possibly, level of government and other policy parameters should adjust dynamically to evolutionary changes in the industry. As was discussed in Chapter 1, much of the policy focus has shifted from efforts to encourage HMO enrollment to assessing and changing the manner in which HMOs operate. One of the key policy issues of the late 1990s and early 2000s was the “Patients’ Bill of Rights.” Despite this broad title, patients’ bills of rights usually only apply regulations and restrictions on HMO operations. One major component of many bill of rights proposals is to permit patients to appeal HMO denials of coverage to outside bodies, sometimes to a medical peer review organization (PRO). California and several other states have enacted patients’ bills of rights. In 2001, different versions of this legislation passed both the U.S. House of Representatives and the U.S. Senate. However, the differences between the House and Senate versions were not resolved that year, and this federal legislation did not advance in 2002 or so far in 2003.153 In fact, a federal patients’ bill of rights may be less urgent in light of the patterns and trends of HMO enrollment presented in this study. If there were a strong expectations that HMOs would dominate U.S. health insurance in the coming years, than businesses and individuals might have little choice but to purchase insurance from HMOs. In that case, it could be appropriate for the federal government to closely regulate HMO operations and decisions. However, the reality, for now and for the foreseeable future, is that most businesses and many
153 It is noteworthy that the high water mark of the federal patients’ bill of rights was passage by the House of Representatives
in August 2001, shortly before the September 11 terrorist attacks. Some might argue that this legislation does not appear to be as urgent for the federal government in the wake of those attacks and the issues they raised.
100
individuals have health insurance choices other than HMOs, most notably preferred provider organizations (PPOs). In this circumstance, the natural regulation of a competitive market is likely to be the most effective check on HMO operations and practices. If HMOs abuse their power or don’t respect their patients’ medical needs, then it would be reasonable to expect a major shift away from HMO insurance. The availability of greater state regulation provides another check on undesirable HMO practices. In these circumstances, blanket federal regulation could reduce local autonomy and deter innovation without offering substantial additional protection to consumers. Therefore, the analysis of this study offers a possible reason for the deferral of federal patients’ rights legislation. B3 THE FUTURE OF HMOs Thirty years of vigorous HMO growth have ended, and the tight restrictions on utilization of the 1990s have significantly eroded.154 Some analysts now anticipate the demise of this economic form. Two who remain sympathetic with the HMO concept find, “… many health plans report that they simply have ceased to try to sell the traditional HMO product because of consumer leeriness and regulatory unwieldiness.”155 Another authority states we are in for a “very messy and very smelly” process of dismantling managed care.156 Some financial analysts believe that the blossoming increase in health care costs will further cut HMO profit margins.157 Additionally, the continuing decline in Medicare HMO enrollment and the aging of the population is not favorable to resumption of HMO growth (NY Times 2001, 2002). On the other hand, there is some possibility that growth will resume in response to re-escalation of health care costs and a lower rate of overall economic growth. 158 There is also a possibility that much of HMO enrollment may shift back into staff/group HMOs such as Kaiser Permanente.159 However, the product life cycle is one of the most useful concepts for analyzing and understanding many industries, including the HMO industry (LA Brown 1981). The results of the research performed here are consistent with a life cycle approach, and the preponderance of the evidence indicates that HMO insurance has reached the maturity stage of its product life cycle. It is rare for products to “become younger” and return to an earlier stage of their life
154 New York Times “A Changing World Is Forcing Changes on Managed Care” July 2, 2001, American Health Line (AHL)
“Aetna: Can the Ailing Insurer Recover from Recent Woes?” 2/26/01; AHL “Aetna Abandons ‘All Products Policy’ For Doctors” 12/20/00; AHL “UnitedHealth: Ends Pre-authorization, Gives MDs Final Say” 11/8/99.
155 Hurley and Ginsburg “Badly Bent Out of Shape: The Transformation of Traditional HMOs” May 2001, draft distributed at the 8th Princeton Conference On the Future of Managed Care.
156 “Like an unembalmed corpse decomposing, dismantling managed care is going to be very messy and very smelly, and take awhile.” George Lundberg, quoted in AHL 3/26/01.
157 AHL “MCO Stocks: Wall Street Grows ‘Bearish’ About Industry” 7/3/01. 158 Hewitt Associates estimated that employers and workers were both paying about 7% more for health insurance in 2001 than
in 2000, NYT 7/2/01, and official estimates suggested that health care costs have been re-escalating substantially (Levit et al 2002).
159 AHL 5/2/01 story on Kaiser Permanente and 3/21/01 story on Colorado HMOs. Kaiser remains unique among HMOs in its ownership of a large chain of hospitals. For background on Kaiser’s previous difficulties, see WSJ “In Age of the HMO, Pioneer of the Species Has Hit a Rough Patch”, 12/1/94, p. A1.

101
cycle, although this has been accomplished in a few cases through strong promotion or repositioning (Kotler and Armstrong 2001). Marketing textbooks indicate that the maturity stage normally lasts longer than the introduction or growth stages. It is characterized by intense price competition. Firms seek to defend or increase market share, which implies that competition is focused on existing customers rather than on drawing new customers into the market. Firms typically try to introduce new and improved versions of the product in the interests of extending the maturity stage and forestalling decline (Bearden et al 2001, Kotler and Armstrong 2001). This suggests that further HMO evolution and price competition may enable the industry to maintain enrollment, but substantial overall growth is unlikely. Perhaps there is potential for growth in certain areas where HMOs have still not attained 20% market share, but there also may be further enrollment decline in areas with high market share (LA Times 2002). A return to 12-13% annual growth in U.S. HMO enrollment is very unlikely. Although the evidence appears to be consistent and reasonable, these analyses and projections must be tempered with caution. This statistical analysis is for a period ending in 1993, so it cannot reflect new trends or further shifts in the complex relationships that influence HMO enrollment. The product life cycle is clearly an applicable concept and tool for the HMO industry, but predictions based on life cycle assumptions have been just as fallible as all other predictions. Bearden et al (2001) state, “the product life cycle has limited relevance in forecasting future performance.” Finally, HMO enrollment, like all health care organizational and financial arrangements, is likely to be strongly influenced by technological changes in health care, including genetic diagnostic and therapeutic methods. At this point, it is not clear whether these impending changes will lead to higher or lower HMO enrollment. HMOs were thought to embody a new paradigm in health care finance; they would lead to the creation of a more efficient and more effective health care sector in the U.S. (Enthoven and Kronick 1989). They have certainly had a dramatic effect on the financing and delivery of health care (Zwanziger et al 2000). But HMO growth has stopped, and many major elements of the health care sector, particularly the central role of physicians, have survived the HMO challenge. However, the growth of HMOs may be valuable to study as a precedent and reference when analyzing other health care trends and movements.

102
C. Technical Conclusions In order for a study to be published, its authors must demonstrate how it advances and improves upon the knowledge of the field. Generally, new findings suggest additional research questions. Many studies also pioneer or refine methods of operationalizing concepts or collecting, processing or analyzing data, and these new methods must be documented and their soundness and effectiveness demonstrated. Sometimes innovative methods generate greater interest among researchers than the initial findings generated using those methods. This study may be of interest for its research findings and its research approach and methods. The findings themselves are summarized in the first section of this chapter, but they are compared with prior expectations and placed in the context of prior research here. This section also addresses the unusual methods employed and suggests further research to both advance knowledge of the field and to apply and extend the methods utilized here. C1 COMPARISON WITH EXPECTATIONS Following completion of descriptive statistical analysis for each of the 2 periods under study, expectations for the multiple regression results for each of the periods were developed and announced.160 For the mid 1970s, hypotheses concerning 4 of the possible explanatory variables were designated as primary, and expected associations were stated for 11 additional variables. For the late 80s/ early 90s period, the author designated 4 primary hypotheses, and expected associations were designated for 5 additional variables.161 Table 5-1 compares actual with expected results for the most critical variables.162 If the variable was the subject of one of the primary hypotheses for that period, then the expected association is indicated in capitals; otherwise the expected association is shown in lower case. This table lists the analysis period, the specific variable and both the expectation and the result for that variable. For a few variables, a comment is provided. For each period, the table only shows those variables that were the subject of primary hypotheses or that were included in the final analytic model. As Table 5-1 shows, 3 of the associations predicted for the mid 1970s period were supported by the regression analysis. All 3 involved provider-related variables, namely MDs per capita, RNs per capita and % of Physicians in Group Practice. However, only the MD association had been designated a primary hypothesis for this period. The other 3 primary hypothesized associations, for Hospital Beds per capita, Blue Cross/Blue Shield Market Share and Income per capita, were not supported at all by the regression analysis.
160 This process is more fully explained in Chapter 3, sub-section B3. 161 For the original statements of expectations, please see “Final Memo to Committee Before 1970s Regression Runs”,
unpublished, dated April 4, 1996, and “Final Memo to Committee Ever: Preparation for 1990s Regression Runs”, unpublished, dated September 27, 1999. These memos are both included in Appendix F to this Thesis.
162 Please see Table F1, Comprehensive Comparison of Results With Expectations, for a longer version of Table 5-1 showing all the expectations stated prior to the completion of each of the regression analyses.

103
TABLE 5-1
COMPARISON OF RESULTS WITH EXPECTATIONS
Period Variable
(Abbrev) Expected Association
Actual Association
Comment
1973-78 MDs POSITIVE POSITIVE Hospital Beds POSITIVE NONE BC/BS POSITIVE NONE Income NEGATIVE NONE Group Practice Positive POSITIVE Strongest Result RNs Positive POSITIVE Latitude Positive NEGATIVE 1988-93 Econ Growth NEGATIVE NEGATIVE Establishment
Size POSITIVE NONE
Pop Density POSITIVE NONE Net Migration/
Pop Growth NEGATIVE NONE
MDs None NEGATIVE Reversed Direction from Previous Period
Group Practice None NEGATIVE Reversed Direction from Previous Period
E North Central None NEGATIVE ---------------------------------------------------------------------------------------------------------------------- Additionally, there was some expectation that Latitude would show a positive association in these regressions, namely that HMO market share would grow faster in more northerly cities. But the final model for the 1970s shows a negative association with latitude. The actual findings and their interpretation and import are discussed at great length in Chapter 4, Sub-sections B2 to B5. For the early 90s period, only one of the predicted associations, the one for economic growth, was supported by the regression analysis. The hypothesis that economic growth over the period from 1978 to 1993 would have a negative association with HMO growth from 1988 to 1993 was one of the primary hypotheses for this period. The other 3 primary hypothesized associations, for Employees per Establishment (aka Establishment Size), Population Density and Net Migration/Population Growth163, were not supported at all by the regression analysis. Conversely, 3 of the variables that were not predicted to show any association, namely MDs per capita, % of Physicians in Group Practice and location in the East North Central (aka
163 Net Migration and Population Growth have a positive correlation of .75 in this data set.

104
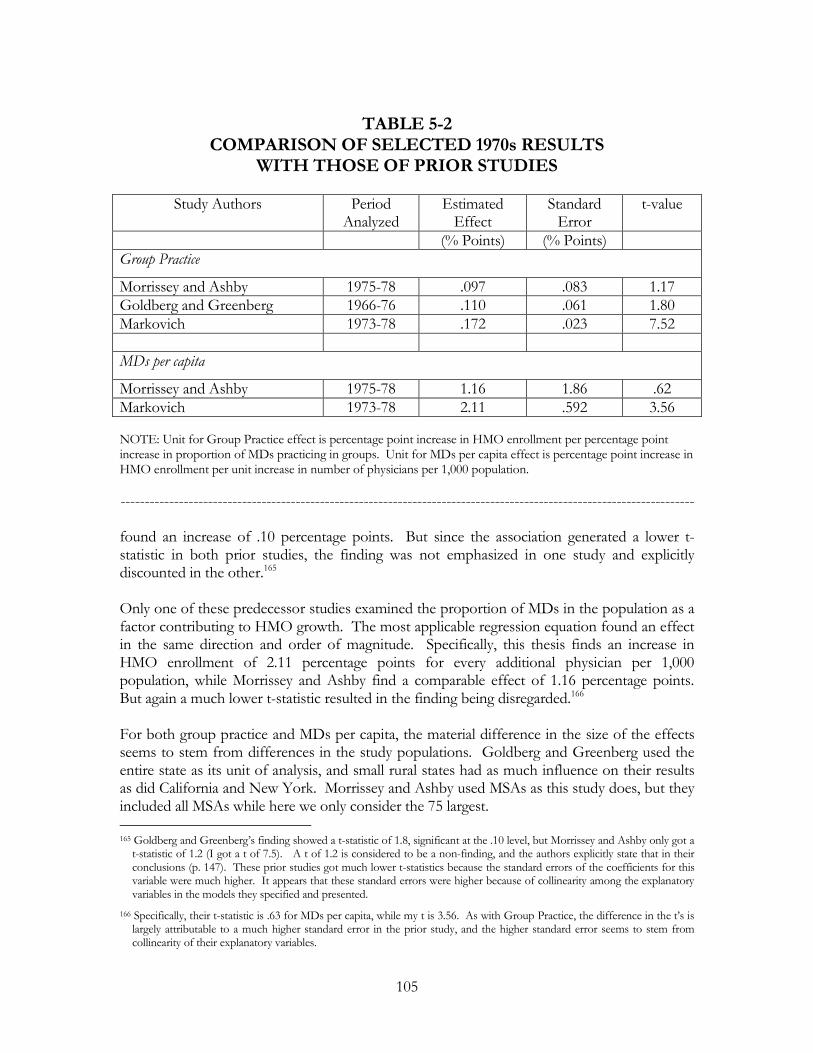
eastern Midwest) region, all showed negative associations with HMO growth. The findings for the late 80s/ early 90s are discussed in Chapter 4, Sub-sections B6 and B7. The comparison of results with expectations clearly shows that these 2 analyses yielded a number of surprises. Both the academic and journalistic literatures had posited a confusing variety of hypotheses about factors associated with HMO growth, and no one explanation was strongly supported by the available evidence. However, the 1970s analysis shows that economic conditions of the health care professions, primarily medicine but also nursing, had a strong association with HMO growth at the MSA level. The 1990s analysis indicates that the effect of the physician related variables reversed direction. The counter-intuitive expectation that Economic Growth had a negative effect on HMO growth from 1988 to 1993 was borne out. C2 COMPARISON WITH PRIOR STUDIES A natural question that arises in reviewing the 1970s findings and analysis is “How do these results compare with those of the similar studies discussed in Chapter 2, Section D (Goldberg and Greenberg 1981, Morrissey and Ashby 1982, Welch 1984)?” Similarly, the results for the 1990s can be compared with those of Dranove et al, which are also presented in Chapter 2. The results for the 1970s initially seem very different from those of the prior studies. But closer examination shows that several observed associations, as measured by variable co-efficients, are roughly comparable. Furthermore, most of the observed differences in co-efficients can be reasonably explained. None of the 3 previous studies tested RNs per capita or Latitude, so these results are not directly comparable.164 The variables for which there are comparable results are Group Practice and MDs per capita. The comparison is presented in Table 5-2. The top of the table compares results for Group Practice, and the bottom makes the same comparison for Physicians per capita. In the table, each study is identified by its authors’ names, with Markovich listed last. For each study, the table presents the analysis period, the size of each effect, the standard error of the effect and the resultant t statistic. Two of these 3 studies examined the possibility that Group Practice influenced HMO growth. Interestingly, both their regression results present evidence of an effect of the same direction and order of magnitude as this study finds. This Ph.D. thesis finds that HMO enrollment increased by .17 percentage points (i.e. .17 of 1% of the MSA population) for every increase of one percentage point of physicians in group practice at the state level. Goldberg and Greenberg found a comparable effect of .11 percentage points, and Morrissey and Ashby
164 As discussed in Chapter 4, Sub-section B5, there were some indications that the negative association with Latitude was really
driven by a negative effect of Firm Size or by effects of other economic variables confounded with Latitude. Morrissey and Ashby tested Establishment Size and found very weak evidence in favor of a positive association. However, since they used a different measure of Establishment Size than is used in this study, it is difficult to analyze the difference in these results.
105
TABLE 5-2
COMPARISON OF SELECTED 1970s RESULTS WITH THOSE OF PRIOR STUDIES
Study Authors Period
Analyzed Estimated
Effect Standard
Error t-value
(% Points) (% Points) Group Practice
Morrissey and Ashby 1975-78 .097 .083 1.17 Goldberg and Greenberg 1966-76 .110 .061 1.80 Markovich 1973-78 .172 .023 7.52 MDs per capita
Morrissey and Ashby 1975-78 1.16 1.86 .62 Markovich 1973-78 2.11 .592 3.56 NOTE: Unit for Group Practice effect is percentage point increase in HMO enrollment per percentage point increase in proportion of MDs practicing in groups. Unit for MDs per capita effect is percentage point increase in HMO enrollment per unit increase in number of physicians per 1,000 population. ---------------------------------------------------------------------------------------------------------------------- found an increase of .10 percentage points. But since the association generated a lower t-statistic in both prior studies, the finding was not emphasized in one study and explicitly discounted in the other.165 Only one of these predecessor studies examined the proportion of MDs in the population as a factor contributing to HMO growth. The most applicable regression equation found an effect in the same direction and order of magnitude. Specifically, this thesis finds an increase in HMO enrollment of 2.11 percentage points for every additional physician per 1,000 population, while Morrissey and Ashby find a comparable effect of 1.16 percentage points. But again a much lower t-statistic resulted in the finding being disregarded.166 For both group practice and MDs per capita, the material difference in the size of the effects seems to stem from differences in the study populations. Goldberg and Greenberg used the entire state as its unit of analysis, and small rural states had as much influence on their results as did California and New York. Morrissey and Ashby used MSAs as this study does, but they included all MSAs while here we only consider the 75 largest. 165 Goldberg and Greenberg’s finding showed a t-statistic of 1.8, significant at the .10 level, but Morrissey and Ashby only got a
t-statistic of 1.2 (I got a t of 7.5). A t of 1.2 is considered to be a non-finding, and the authors explicitly state that in their conclusions (p. 147). These prior studies got much lower t-statistics because the standard errors of the coefficients for this variable were much higher. It appears that these standard errors were higher because of collinearity among the explanatory variables in the models they specified and presented.
166 Specifically, their t-statistic is .63 for MDs per capita, while my t is 3.56. As with Group Practice, the difference in the t’s is largely attributable to a much higher standard error in the prior study, and the higher standard error seems to stem from collinearity of their explanatory variables.

106
In many smaller MSAs in the 1970s, the active physician community may have had only 150 or fewer members. By contrast, almost all of the 75 largest MSAs had more than 500 MDs, and most had more than 1,500. The economic relationships and social dynamics within a 150 MD community may well have been very different from the relationships within a 1,000 MD community, and these differences are likely to have influenced the process of HMO acceptance and affiliation within those differing physician communities.167 Alternatively, there is a technical reason why a study of all MSAs would find a smaller Group Practice effect. Group Practice data are only available on the State level. In most cases, a state average will be more accurate for larger MSAs, each of which constitutes a greater component of that average, than it will for smaller MSAs. It is possible that more accurate measurement of Physician Group Practice at the MSA level would lead to more similar estimates of this effect on HMO enrollment in both large and small cities. Taken collectively, the prior studies found some evidence for a negative effect of per capita Income, a positive effect of Hospital Costs and a positive effect of Population Mobility.168 As shown in Chapter 4, this study did not find meaningful evidence for any of these effects. As with the physician related variables, it is possible that these factors had an effect in smaller MSAs that did not exist in this study’s population of MSAs. It is more difficult to compare this study’s results for the early 1990s with those of Dranove et al. Although the time periods of the 2 studies are roughly comparable, the differences in the definition and measurement of the outcome variable are considerable. Dranove et al use managed care penetration as their outcome variable, and PPO enrollment was a larger component than HMO enrollment by the 1993-95 period. Furthermore, Dranove et al estimated managed care penetration using a physician survey and a market research survey. Such survey results reflect a different perspective on the growth of HMOs and managed care than is reflected by the direct enrollment data used by this study. Additionally, most of the specific explanatory variables tested by Dranove et al differ in substance from the explanatory variables utilized in this study. However, there is some similarity in flavor between the 2 sets of results. Most notably, Dranove et al found that health care supply variables had a considerable effect on managed care growth in the 1980s and early 1990s, and this is consistent with the findings reported here. They found some evidence of a non-linear relationship between firm size and managed care during their study period, while this study finds some evidence that HMOs grew more in cities with smaller employers during the 1973-78 period. One area of possible inconsistency between the studies is the size of physician practices. They found that large having more physicians in solo practice may have had a negative effect on managed care penetration, while this study finds that, by 1988-93, there was a negative 167 However, this likely difference detracts from the external validity of this study. The results are valid for the 75 largest MSAs
and the majority of the US population that resided therein, but apparently the causes of HMO growth were (and possibly still are) substantially different in smaller MSAs and in rural areas.
168 Specifically, for all 3 of these variables, 2 out of the 3 prior studies found evidence attaining or approaching statistical significance for the effects listed. Please see Appendix G for a Summary Table.

107
relationship between physicians in group practice and HMO enrollment growth. However, substantial differences in both the outcome and explanatory variables make meaningful comparison of these specific results difficult.169 C3 CONTEXT OF THE HMO ECONOMIC LITERATURE This report makes extensive reference to 2 broad sets of scholarly literature. The first of these is the diffusion of innovations literature, which is used to establish a framework of how industries in general grow. The results of this study are placed within the context of the diffusion of innovations literature in sub-section A2 of this chapter. The second set of literature is the HMO economic and health services literature, and Chapter 2 is devoted to that literature. This sub-section discusses how the results of this study fit in with and contribute to the HMO specific literature. Recent evidence shows that persons who are willing to give up provider choice for cost savings are more likely to enroll in HMOs (Kemper et al 1999/2000). But only a certain percentage of the population is willing to make that tradeoff, so this finding suggested that HMO enrollment was likely to plateau. In fact, HMO enrollment on the national level has plateaued in the last few years (InterStudy 2002). This is consistent with the findings of this study. Analysis of HMO enrollments from 1988 to 1993 shows that factors associated with HMO growth on the MSA level were different than the factors associated with growth during 1973 to 1978. This finding is consistent with the hypotheses that HMOs were approaching the maturity stage of the product life cycle and that the period of rapid growth would end during the 1990s. Thus this study fits in well with other evidence concerning the overall trend of HMO enrollment. Much of the published HMO literature is on the consequences, rather than the causes, of HMO growth. However, by investigating the causes of HMO growth, this study complements the published literature. Prominent among the more recent findings, Escarce et al (2000) find that HMO growth tends to reduce the number of physicians in an MSA170. However, during an overlapping period of time, this study suggests that lower numbers of physicians and a smaller proportion of group practice physicians tend to increase HMO growth at the MSA level. In conjunction, the 2 studies suggest an acceleration effect with respect to the concentration of physicians. At least during the 1988-93 period, lower concentrations of physicians are associated with HMO enrollment growth, and HMO growth reduced total numbers of physicians in metropolitan areas. Thus the cities with a relative sparsity of physicians would have experienced a further decline in number of MDs (and probably Osteopaths as well) relative to metropolitan areas with a relative abundance of physicians. If this acceleration effect were dominant, it would have widened the gap between physician-sparse and physician-abundant cities during this period. This issue is discussed further in the final sub-section, Suggestions for Further Research. 169 Dranove et al used the MSA percentage of primary care physicians in solo practice in 1985 as their explanatory variable, while,
for the 1988-93 period, this study uses state level percentage of all physicians in group practice in 1988 as an explanatory variable.
170 They found that HMO market share did not affect the number of generalists, but it did reduce the number of medical/surgical specialists and the overall number of physicians.

108
Similarly, the findings of this study can be combined with the well-established finding that HMO growth leads to a reduction in hospital costs to suggest additional hypotheses. Specifically, during 1988-93 cities with rapid economic growth experienced less HMO growth while cities with less economic growth saw faster HMO growth. However, the lack of statistical association between hospital costs and HMO growth during this period suggests that hospital costs did not have a substantive effect on growth. Therefore, using the findings from other studies (Miller and Luft 2001, Gaskin and Hadley 1997, Miller and Luft 1994), it may be possible to build a causal chain: lower economic growth led to faster HMO growth, which led to a reduction in hospital costs. C4 METHODOLOGICAL IMPLICATIONS As detailed in Chapter 3, this study has applied some unusual methods. These methods are consistent with the framework provided by the diffusion of innovation literature, and they have generated a substantial set of findings and implications. Researchers may be interested in what this process can teach us about the findings of other studies and how future studies can adopt or adjust some of these methods. Rather than setting out to confirm or deny one particular concept or hypothesis, this study set out to analyze a particular phenomenon, namely the growth of HMOs on the MSA level. Because the subject matter is broad, and because of the limited number of observations in the data set, a flexible approach was taken in developing a model of HMO growth. Specifically, for both time periods that were analyzed, a large number of variables and combinations of variables were tested before selecting the final model. This approach entails the risk of over-fitting, of developing a model that conforms to the peculiarities or random disturbances of the particular data set being used at the expense of developing a useful and applicable structural model. To reduce the risk of over-fitting, very specific expectations were stated prior to the execution of the 2 sets of analysis. The accuracy of those expectations was just examined in Sub-section B1. The prior statements of expectations did not constrain the development of the final models, but they restrain the ability to claim that those models were expected all along. By doing so, the statements made it clearer what knowledge was gained and what value this knowledge has. Ideally, this new knowledge should be used to state expectations for a different study using substantially different data. If expectations derived from this study were confirmed by an independent examination of a related subject, then there would be strong assurance that the results presented here are accurate. Another major issue was endogeneity, the threat that the outcome variable may have influenced one or more explanatory variables instead of, or in addition to, the explanatory variables influencing the outcome. One approach to this issue is to use an instrumental variable; an elaboration on the instrumental variable approach is to use 2 Stage Least Squares (2SLS).171 This approach was not applied here. Instead, prior values for the explanatory variables, which in the normal course of events could not have been influenced by the
171 This approach is discussed in Chapter 3. For a more technical discussion, please see Kennedy (1992).

109
subsequent growth of HMO market share, were used.172 In Chapter 3, this is referred to as the Growth Prediction method. Some of these prior values showed substantial explanatory power in the regression analysis, indicating that they had a truly structural, or causal, effect on HMO growth during the periods under study. Because of several difficulties with the instrumental variable/2SLS approach, researchers may wish to consider the Growth Prediction method for other applications. Another feature of this study is the application of similar methods to 2 distinct periods of time. Reference to the product life cycle concept suggested that results for the 2 periods would be somewhat different. In fact, results were very different, and the statistical associations of the physician related variables reversed direction between the 1st period and the 2nd period. These results can be used to illustrate the usefulness of the product life cycle concept for empirical research. C5 SUGGESTIONS FOR FURTHER RESEARCH This sub-section makes suggestions for additional research in 10 different areas. The first 3 concern testing the product maturity hypothesis and the inter-relationship between the physician workforce and HMOs, and these will be of immediate interest. Other promising areas for research include the relationship between the nurse workforce and HMOs, resolving the economic growth/per capita income issue, extending this analysis to additional years and geographic areas, conducting separate analyses for commercial, Medicare and Medicaid enrollment and investigating the influence of HMO model type. The last 2 suggested areas for further research are Point of Service plans, which are a variety of HMO, and Preferred Provider Organizations, which are a form of managed care but are distinct from HMOs. Testing the Product Maturity Hypothesis
One of the most important challenges for further research is to confirm or refute the suggestion that the HMO industry was approaching maturity during 1988 to 1993 and that the upcoming leveling off of national HMO enrollment could be inferred from MSA-level growth trends during 1988 to 1993. Clearly, the evidence of this study, the product life cycle concept and subsequent trends in national enrollment show a consistent pattern. This evidence suggests the potential market for HMO insurance was always large, but probably less than half the population in most cities and states. By 1988, the HMO health insurance product was reaching the limit of its potential market in a number of MSAs, including Minneapolis-St Paul, Cleveland and Denver. During 1988 to 1993, enrollment hardly grew or actually declined in these cities, and the 1987/88 peaks were never substantially exceeded. On the national level HMO health insurance reached maturity in the late 1990s, and overall enrollment is likely to be stable or slightly declining for many years. However, the available evidence is not conclusive, and any claim that the results of this study anticipate broader trends in HMO enrollment must be carefully scrutinized. In particular, national HMO enrollment did not peak until 1999. Had this statistical analysis been available in 1993, a fair conclusion would have been that the industry was rapidly
172 If the outcome variable were HMO market share per se, then it would have been much more difficult to provide assurance
that the explanatory variables were not endogenous.

110
approaching the maturity stage of the product life cycle and that enrollment would probably peak in the next 3 years. Additionally, the argument concerning the potential HMO market would be simpler and more testable if all cities, and the country as a whole, have the same “natural” level of HMO market share, but there is substantial evidence against such a hypothesis. If all geographic areas had the same natural level, one would expect that there would be a high negative correlation between 1988 market share and market share growth between 1988 and 1993. This would be because enrollment would stop growing in cities with high market share and growth would accelerate in cities with low market share. In fact, for the dataset analyzed here, the correlation between 1988 market share and 1988-93 growth is -.08. For this small data set, this level of correlation suggests there was essentially no relationship between initial market share and subsequent growth.173 A simplistic model under which all MSAs inexorably honed in on one particular level of HMO market share is not supported by the available data. However, it may be that different cities have different natural levels of market share, depending on market conditions, health care institutional arrangements and the local labor market. The data may be consistent with a view that, by 1988, market share growth had slowed down or stopped entirely in MSAs that were close to their natural level. Conversely, other cities, including some with high market shares, may have been far short of their natural HMO market share in 1988. These may have been the MSAs where market share grew the fastest from 1988 to 1993. One goal for further research is to test the usefulness of this set of hypotheses and the accuracy of the implications that flow from these hypotheses. The central hypothesis can be referred to as the product maturity hypothesis, the concept that HMO enrollment growth slows down and eventually stops as the HMO product reaches maturity in a particular market or geographic area. One way of testing the product maturity hypothesis and its implications is to build a model of MSA level market share growth around this concept and to assess how well the data corresponds to such a model. A model of HMO product maturation in each MSA would necessarily be more complex and sophisticated than the ordinary least squares multiple regression models employed in this report. However, it may be possible to operationalize and test such a model by focusing on 2 major elements. The first major element of the model would generate estimates of the natural HMO market share for each MSA. The second major element would simulate HMO market share over time as it approached and stabilized around the natural level. The second element would incorporate the S-shaped curve or logistic function in generating the simulated time path for each MSA or other geographic unit included in the study. If a more sophisticated model of this type could yield a substantial improvement in goodness of fit over one or more simpler models, than this would constitute serious evidence in favor of the product maturity and logistic growth concepts. However, specifying, operationalizing and testing such a model constitutes a formidable research challenge. 173 However, the comparable correlation was +.38 for the 1973-78 period, and the decline to -.08 for the later period
constitutes further evidence that the dynamics of HMO growth underwent change.

111
Factors Leading To Initial HMO Establishment
As discussed in Chapter 4, the 1973-78 results offer substantive evidence concerning enrollment growth in many cities that had operational HMOs at the beginning of the period. The available results offer little useful evidence to explain why 1 or more HMOs began operations in 19 of the 47 cities with no HMOs in 1973. Any comprehensive theory of HMO enrollment must address that initial diffusion of HMO insurance into any given market.174 That diffusion process was almost complete for the 75 largest cities by 1988, but it continued to be an issue in small cities and rural areas well into the 1990s. To some extent, it remains an issue today for many such areas where there are still no operational HMOs. Perhaps the best way to address initial HMO establishment would be to perform a series of in-depth case studies of this process in numerous markets over a period of 25 years or more. The series could include studies of areas where the HMO concept failed to diffuse within a specified time period. It would be desirable to include cities of all sizes and rural areas. Such an approach would be likely to generate well thought out hypotheses concerning the causes of successful HMO establishment. It would then be appropriate to design statistical studies or other follow-up research to develop a definitive enumeration of the causes of initial HMO operation. However, it is possible that immediate further statistical research could yield noteworthy results. In particular, it may be useful to use the date of successful HMO establishment as the outcome variable and to investigate the relationship between that date and a wide range of variables. It would be desirable to test the geographic dispersion hypothesis – i.e. to see if HMOs were more likely to begin operations in geographic areas proximal to areas that already had operating HMOs. Finally, if more specific geographic data could be developed, it would be worthwhile to investigate the relationship between the profitability of other health insurers and initial HMO establishment. Inter-relationship Between the Physician Workforce and HMOs
As mentioned earlier in this chapter, Escarce et al (2000) find that HMO growth tends to reduce the number of physicians in an MSA. When this finding is combined with the finding that, during 1988-93, HMOs grew faster in MSAs that already had lower concentrations of physicians, it suggests that HMOs may have widened the gap between physician-sparse and physician-abundant cities during this period. Further research could confirm or deny that this gap widened during the late 1980s and early 1990s and that MSAs with rapid HMO growth were the ones experiencing a relative decline in physician concentration. This proposed research project would require the construction of an index of the variance in physician concentration across MSAs during the period of interest. Escarce et al cover the years 1987 to 1997. A new study might analyze data for the years 1987, 1992, 1997 and 2002. If such examination of the variances in physician concentration finds that these variances are increasing over time, the study should seek to ascertain whether the increase was associated with HMO market share. 174 As discussed in Chapter 2, there have been a few studies of the formation of new HMOs and of the demise of individual
HMOs, but no studies of the establishment of initial HMOs by geographic area.

112
If physician concentrations across MSAs are diverging, it may be that the cities with high and increasing physician concentrations are the ones with the lowest levels of HMO market share; conversely, the cities with low and stagnant physician concentrations may be the ones with the highest levels of HMO market share. One possible way of testing this hypothesis would be to use HMO market share to estimate both initial physician concentration and change in physician concentration for all 5-year periods. Confirmation that high or increasing HMO enrollment tends to widen disparities in physician concentration would be of interest to a broad range of researchers, policy analysts and health care decision makers.
Attitudes of Group Practice Physicians Toward HMOs
The findings of this study concerning the proportion of group practice physicians and HMO enrollment growth are remarkable. As discussed in Chapter 4, it may be possible to explain these findings either specifically in terms of changes in the attitudes of physicians in group practice or in terms of the overall evolution of the HMO industry. These 2 sets of explanations are distinct from each other, but not necessarily in conflict. Changes in the attitudes of group practice physicians may have been, in whole or in part, a consequence of HMO evolution. (The overall evolution of the industry is addressed in the first suggestion for further research above.) The hypothesis that the attitudes of group physicians toward HMOs became less favorable can be supported with several points. First of all, part of the evolution of the HMO industry was the emergence of independent practice association (IPA) HMOs as the dominant form. In the early 1970s, staff HMOs accounted for the overwhelming majority of HMO enrollment, but by 1993 over two-thirds of HMO enrollees belonged to IPAs or mixed model HMOs that operated predominantly on an IPA basis (InterStudy 1994). Therefore, it is very plausible that group practice physicians of the 1990s saw HMOs as a less congenial form of insurance than they had in the 1970s. Additionally, the nature of physicians in group practice is likely to have changed as economic and social forces led many physicians to abandon solo practice and join groups. 175 Unfortunately, data concerning the attitudes of group practice physicians in the 1970s may not be available. However, during the 1990s, researchers conducted a number of surveys concerning physician attitudes toward HMOs, and it may be possible to synthesize or extract detailed information concerning the attitudes of group practice physicians from extant data. Of more practical interest, it is possible to investigate this issue now. A survey of group practice physicians could yield valuable information concerning HMO-physician relationships today and possible effects on future changes in HMO enrollment. The attitudes of today’s group physicians may be particularly salient because of the continuing shift of physicians into small groups. One key issue is whether group practice physicians are more satisfied with the degree of physician autonomy in treating HMO patients. Since many HMOs have abandoned some of their more restrictive utilization review policies, it is possible that group physicians now have 175 For a while it appeared that the physician profession was moving toward organization in very large groups. Many of these
groups have collapsed, and, as of 2002, it appears that this trend has completely halted. However, physicians continue to abandon solo practice and organize themselves into small groups.

113
more favorable attitudes in this area. A second key issue concerns the effect of HMO reimbursement rates on group practice physicians’ incomes. HMOs continue to reimburse physicians at lower rates than other commercial health insurance plans do (Polsky and Nicholson 2001). If group physicians believe that they have a viable option for improving their incomes by declining to contract with HMOs, then this could contribute to a decline in HMO enrollment. Effect of Nurses on HMO Growth in the 1970s
Researchers may be interested in explaining the unprecedented suggestion here that nurses influenced the growth of HMOs in the 1970s. With recent concern about a Registered Nurse (RN) shortage, a better understanding of how the nurse labor market influences the health economy would be interesting. One possible explanation, discussed in Chapter 4, is that a surplus of nurses influenced negotiations between hospitals and HMOs. Put bluntly, in certain markets hospitals extracted surplus value from nurses, and HMOs extracted some of this surplus from hospitals. To test this hypothesis, we would ideally want extensive data concerning nurse wages and HMO reimbursement of hospitals, but such data are unlikely to be available for the 1973-78 period. However, data may be available on hospital profits or surplus during this period. If such data are meaningful, it would be possible to regress hospital profits on the MSA level as a function of the supply of RNs, HMO market share and other variables. If it were found that a greater supply of nurses had a positive effect on profits, but that increased HMO enrollment had a negative effect on profits, this would lend support to this elaborate and intriguing hypothesis. Resolving the Economic Growth/Per Capita Income Issue
Another unresolved question concerns the choice between including Economic Growth and per capita Income in the final 1990s model. It is clear that one of these 2 variables, which have a correlation of .67 in the 1988-93 data set, had a negative effect on HMO enrollment. In Chapter 4 it is explained that Economic Growth was included because such an effect was more consistent with the boom and bust cycle that influenced enrollment during this period. But t statistics were generally slightly higher for per capita Income. The simplest way of resolving the uncertainty concerning these 2 economic variables is to increase the number of observations. Extending the data set to include smaller MSAs or disaggregating to the County level, or both, could do this.176 If increasing the number of observations by itself does not resolve the issue, it would make it possible to carve out 2 sub-data sets for comparative analysis. One of these would consist of MSAs, or Counties, that have consistently had high levels of per capita income, but which experienced only modest economic growth after 1970. The other subset would consist of MSAs which experienced rapid economic growth during the 1970-1993 period, but which were still not in the top 176 Either method of expanding the data set could present problems. If smaller MSAs are included, there would be an implicit
assumption that the causes of HMO growth were the same in those cities as in the larger ones. Accurately allocating HMO enrollment between Counties within each MSA could be very difficult; a less ambitious program would be to disaggregate the data for the 18 Consolidated Metropolitan Statistical Areas (CMSAs) into the component Primary Metropolitan Statistical Areas (PMSAs). The good side is that a well conceived and carefully executed extension of the 1990s data set could offer additional insights beyond resolving the Economic Growth vs. per capita Income question.

114
quadrant of per capita Income by 1993. Analyzing these 2 contrasting sets of urban units would be likely to resolve whether Economic Growth or per capita Income shows the stronger negative association with HMO growth. Naturally, if further research finds that one variable or the other continues to show a statistically significant negative association, then it would be desirable to determine if that relationship continued during subsequent years. Extending the Analysis of HMO Enrollment This project has analyzed HMO enrollment growth for the periods 1973-1978 and 1988-1993. This type of analysis could be performed for other time periods since 1978, including periods between 1993 and 2001. In particular, the period from 1993-1998 saw accelerated growth, while national HMO enrollment has plateaued from 1998-2001. In concept, it would be simple to replicate this analysis for these periods, and more recent results would be of interest to both policy makers and researchers. Analogously, it would be desirable to extend this analysis to more geographic areas. As discussed above, there are some indications that factors influencing HMO enrollment differ in large and small MSAs, and rural areas may well differ in this respect from MSAs. Therefore, it may be wise to conduct separate, parallel analyses for small MSAs and rural areas. However, it would certainly be noteworthy if any effects were found to work in the same direction and approximate magnitude in all 3 types of areas. Separate Analyses for Commercial, Medicare and Medicaid Enrollment
One of the most serious limitations of this study is the inability to analytically separate Commercial, Medicaid and Medicare HMO enrollment for the 1988-1993 period and for subsequent periods.177 Some distinct factors influence enrollment in each of these 3 markets, with Medicaid and Medicare enrollment heavily influenced, but not perfectly controlled, by administrative policies for these 2 government programs.178 The analysis of the Commercial market could use methods quite similar to those employed here, and it would be very worthwhile to determine if the findings of this study are accurate for the Commercial market by itself. An analysis of Medicaid HMO enrollment at the MSA level would need to include dummy variables reflecting the state where each city is located.179 It is not clear what factors influence State policies toward Medicaid HMOs. Apparently, rapid increases in program costs stimulate officials to steer more beneficiaries into HMOs in the interest of controlling costs. Possibly State Medicaid officials consider the accessibility to Fee For Service care, as reflected in the numbers of physicians and other providers who accept Medicaid patients.
177 Medicaid and Medicare accounted for a very small percentage of HMO enrollment before 1988. 178 Analysis of combined enrollment offers some advantages, and these are discussed in Footnote 3 to Chapter 3. However, it
would be a big advantage to have separate analyses for each of the 3 markets in addition to analysis of combined enrollment. 179 Clearly proper coding for MSAs split between 2 or more states would be a challenge.

115
For Medicare, it appears that the competitiveness of HMOs is greatly affected by the average Medicare fee for service (FFS) payments in their area. Another unique aspect of the Medicare HMO industry is the need to offer benefits not otherwise offered by Medicare, most notably prescription drug coverage, in order to attract enrollees. An updated analysis of Medicare HMO enrollment would ideally choose analysis periods so as to consider the effect of major changes in Federal Medicare policy, especially the host of changes initiated by the Balanced Budget Act of 1997. Influence of HMO Model Type
Another set of HMO categories is referred to as Model Type. We tend to think of 2 basic HMO types, Group and Independent Practice Association (IPA), but accurate classification is a serious challenge.180 A considerable volume of HMO research in the 1970s and 1980s examined HMOs by type, and some studies found that Group or Staff HMOs offered superior preventive care and continuity of care.181 However, the IPA model, whether in pure or mixed form, had a substantial advantage in the market place because it offered enrollees a greater choice of physicians and other providers. The influence of HMO type on HMO enrollment at the MSA level remains an open question, but one that is amenable to statistical analysis. Point of Service Plans
One of the most important HMO trends of the 1990s was the rapid growth of Point of Service plans (POS, also referred to Open Ended plans). Enrollment in this type of HMO increased from 400,000 in 1988 to 7.8 million in 1997 and approximately 18 million in 2000.182 It appears that these plans have grown because consumers want the option to go outside the network, but most don’t actually do it. The low outside utilization keeps POS premiums competitive with those of pure HMOs.183 POS should definitely be considered part of the HMO family, and their enrollment was included in the outcome variable for this study. But it would be interesting to examine trends and patterns in POS compared to other Commercial HMOs. In particular, it would be desirable to see if POS plans are more attractive in high-income areas and to employers with high-income work forces. It may be that POS plans tended to grow more in certain types of cities, and in the near future POS enrollment will demonstrate an in-fill pattern similar to that shown by HMOs in general in the 1990s. Study of POS enrollment in MSAs would be beneficial, but there is also a need to study their enrollment and business practices on the individual, employer and provider levels.
180 InterStudy uses 5 categories, Group, IPA, Mixed, Network and Staff, with over 80% of national HMO enrollment in either
IPA or Mixed HMOs as of January 1997. 181 Refer to MOS, SMFR and 1 or 2 others. 182 InterStudy Edge, Spring 1988, p.9. InterStudy Competitive Edge 7.2, October 1997, p.6. 183 A recent study published in JAMA indicates that less than 15% of POS enrollees take advantage of their option to self refer
to any provider at all over the course of a year (AHL 2001).
116
PPOs
Preferred Provider Organizations (PPOs) constitute a promising area for further research.184 HMOs have always been more aggressive in implementing managed care concepts, but PPOs have been an important alternative for at least 20 years. PPO enrollment grew more than twice as fast as HMO enrollment from 1987 to 1995 (Dranove et al 1998), and PPOs account for at least 50% of private insurance in the US (New York Times 1998). However, PPOs do not track their enrollees, providers and utilization as meticulously as HMOs do, which makes research difficult. And most states do not regulate PPOs, further limiting data availability (American Health Line 2001). Therefore, the next step for analysis of PPO enrollment is to collect available data in geographically disaggregated form. InterStudy now conducts a PPO Census and plans on regularly releasing reports on PPOs. If reasonable estimates of PPO enrollment on the MSA level are available, then comparison of relative HMO and PPO strength is a promising area. Another desirable, but difficult, research area is comparison of PPO and HMO premiums and expenses. In particular, it would be interesting to compare PPOs’ advantage in having lower administrative costs with their disadvantage in covering greater utilization at higher reimbursement rates.
184 Some individual plans may tread on the boundary between HMO and PPO categories. However, there are clear legal and
substantive distinctions between these 2 types of managed care. Legally, HMOs operate under HMO licenses in virtually all states. Substantively, HMOs employ elaborate payment and other mechanisms to influence provider behavior, employ primary care gatekeepers and collect substantial volumes of patient medical data. PPOs almost never do any of this (Lehnard 1999).
117
D. Chapter Summary This chapter explores the implications of the findings presented in Chapter 4. These findings strongly suggest that the relationship between the HMO industry and the physician profession changed between the mid-1970s and the early 1990s. This suggestion is consistent with research on the diffusion of innovations, which finds that diffusion strategies usually change as a product progresses from one life cycle stage to another. The results of this study are of interest to policy makers and policy analysts for several reasons. The results suggest that minor changes in public policy at the state and local levels are unlikely to generate substantial increases in HMO enrollment. This is because the factors that are associated with HMO enrollment growth are intractable or unsuitable to influence by state and local policy levers. This study also provides systematic evidence that HMO enrollment tends to plateau. When this evidence is combined with the observed path of HMO enrollment at the national and state levels, the case that enrollment has plateaued and is unlikely to resume rapid growth becomes very strong. The plateau in HMO enrollment may be reassuring to those concerned about HMOs’ restriction of benefits or about possible arbitrary decisions denying coverage. As long as enrollment does not surpass current levels, most businesses and many individuals will have health insurance options other than HMOs. As a result, enactment of a federal Patients’ Bill of Rights may be less urgent than it was perceived to be in the late 1990s. The results of this study substantially improve upon the prior literature on factors associated with HMO growth. Prior studies of the 1970s found suggestions that the physician group practice and concentration of MDs variables were positively related to enrollment growth, but these results did not achieve statistical significance. In terms of the size of the coefficients, the results of this study are comparable with the prior results. However, here both variables are clearly statistically significant. The results of this study complement those of prior studies on the effects of HMO growth, particularly findings concerning the geographic distribution of physicians and the reduction of hospital costs. Most notably, the combined evidence suggests that HMOs may have widened the gap between physician-sparse and physician-abundant cities, and this hypothesis deserves further research. The results of this study suggest several other research projects. To understand the HMO industry, it would be helpful to rigorously test the hypothesis that HMO enrollment tends to plateau on the MSA level. Further research on HMO growth during the 1970s is warranted because the events of that era were crucial to the subsequent growth of the industry. It would be beneficial to understand why HMOs began operations in certain cities, but not others, during the 1973 to 1978 period. It would be worthwhile to test whether conditions in the nurse labor market affected financial arrangements between HMOs and hospitals. This chapter also recommends further analysis of HMO enrollment statistics, including analysis of enrollment in point of service (POS) plans and of enrollment broken down by HMO model type. Finally, the PPO industry, now much larger than the HMO industry, richly deserves

118
more research, including the development and analysis of geographically disaggregated enrollment statistics. The most important conclusion from this chapter is that this study contributes to the literature on the economics of HMOs. It provides additional evidence for, and a fuller explanation of, the tendency of HMO enrollment to plateau. Additionally, the better understanding of the factors associated with HMO growth is likely to be helpful for future research on the HMO industry, including research on the effects of HMO growth. This study was initiated in the belief that the HMO industry could help resolve national problems with health care costs and lack of access. For many, this prospect was attractive because HMOs applied entrepreneurial dynamism and flexibility to our hybrid public-private health sector. There is now strong evidence that HMOs did slow the growth of costs during the 1990s, but lack of access to health care remains as much of a problem as ever. The results of this study, which suggest that there were always serious limits to HMO growth, are consistent with the historical record that HMOs, and public policies oriented toward HMOs, have done little to expand health insurance. However, once limits are understood, it becomes possible to devise new ways to transcend those limits. Our understanding of the history and performance of HMOs should be helpful in the development of public and private initiatives to resolve the continuing problems of high costs and lack of access.