CHAPTER 4shodhganga.inflibnet.ac.in/bitstream/10603/11889/7/07_chapter 4.pdf · CHAPTER 4 ....
54
CHAPTER 4
-
Upload
hoangkhuong -
Category
Documents
-
view
228 -
download
0
Transcript of CHAPTER 4shodhganga.inflibnet.ac.in/bitstream/10603/11889/7/07_chapter 4.pdf · CHAPTER 4 ....

CHAPTER 4

Spectroscopic studies of porphyrins
The above synthesized free-base porphyrins and metalloporphyrins from non-aqueous
and aqueous series were characterized by UV-Visible spectroscopy, infrared
spectroscopy (FTIR), proton magnetic resonance spectroscopy ( 1Hnmr), elemental
analysis, high resolution mass spectroscopy (HR-MS), fluorescence spectroscopy and
diffuse reflectance spectroscopy (DRS). The experimental results obtained were
compared with standard results from the literature. In case where reference results were
not available, then elemental analysis and high resolution mass spectroscopy results were
used for the confirmation of the respective porphyrins.
4.1 UV-Visible spectroscopy
The non-aqueous porphyrins, TPP and its metalloporphyrins where M= Co 2+, Ni2+, Cul+,
zn2+, Ag2+, Mn-+, Fe3+ and Sn4+ were characterized by UV-visible absorption spectroscopy.
The porphyrins spectra are due to it - IC* transitions. The electron transitions for soret band
are from a l„ eg (allowed) and for Q-band 28 azu eg (forbidden). The concentrations
used for soret band and Q-band arel 0 -5 M and 104 M respectively. In TPP the bands obtained
are 416 nm (soret), 515, 549, 590, and 647 nm (Q-bands) whereas in Co TPP, NiTPP, CuTPP,
ZnTPP and AgTPP the number of bands are reduced to two and in SnTPPC12 three in the
visible region. Thus successful insertion of metal in porphyrins is confirmed by
disappearance of 647 nm band 184 and reduction in number of Q-bands as compared to TPP. A
free base TPP is having two hydrogens attached to two nitrogens in the porphyrin ring which

is having a rectangular geometry with D2h symmetry. When metallation takes place, the
geometry of the porphyrin ring becomes square with Doh symmetry 185. Thus when free base
TPP is metallated the geometry becomes more symmetric, as a result the number of
absorption bands obtained is minimum. It is observed that TPP, ZnTPP and SnTPPC1 2 form
closed shell porphyrins and they show normal spectra, where, there is no or minimum
interaction between metal and porphyrin ring. Therefore, they are classified as regular
porphyrins. The porphyrins such as CoTPP, NiTPP, CuTPP and AgTPP have small
interactions between the porphyrin and corresponding metal. As a result the nature of the
spectra remains the same with slight shift in absorption peaks. Fig.4.1 shows UV-visible
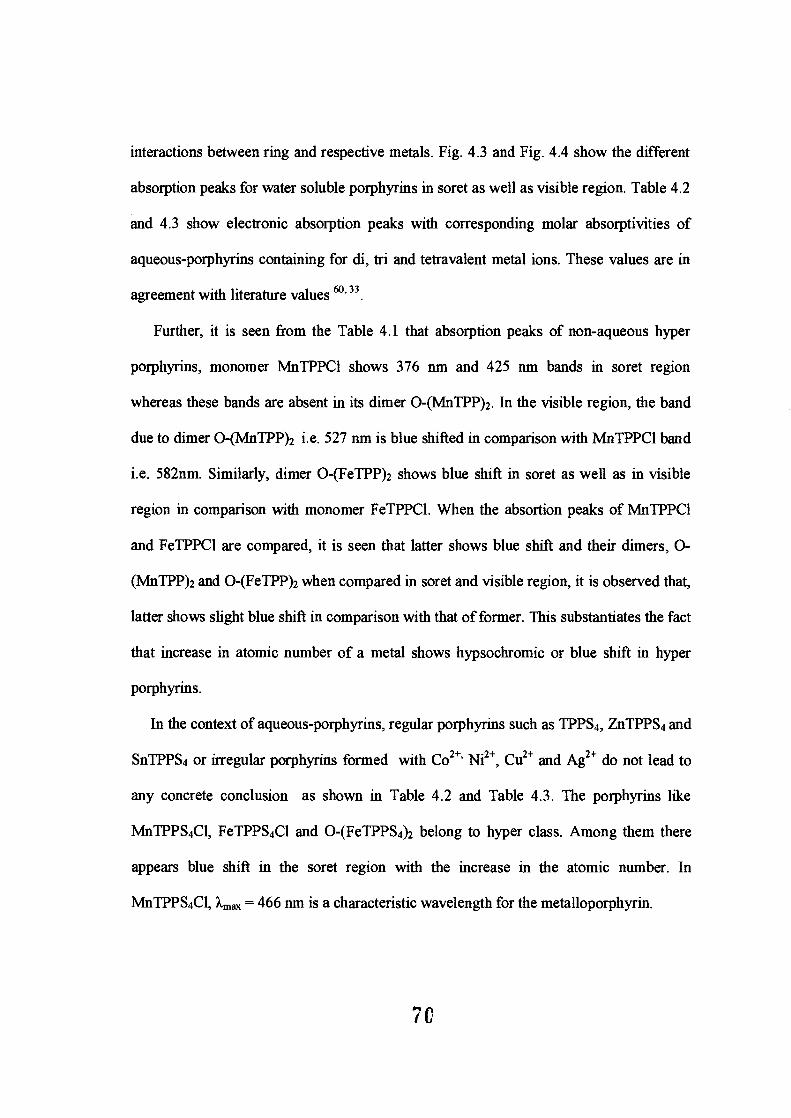
spectra of TPP and CoTPP. The porphyrins like MnTPPC1, O-(MnTPP)2, FeTPPC1 and 0-
(FeTPP)2 are called hyper porphyrins where there is a strong interaction between metal and
porphyrin ring. Due to this reason, hyper porphyrins show extra absorption peaks. Fig. 4.2
shows UV-visible spectra of MnTPPC1 and SATPPCVhe values of absorption peaks of all
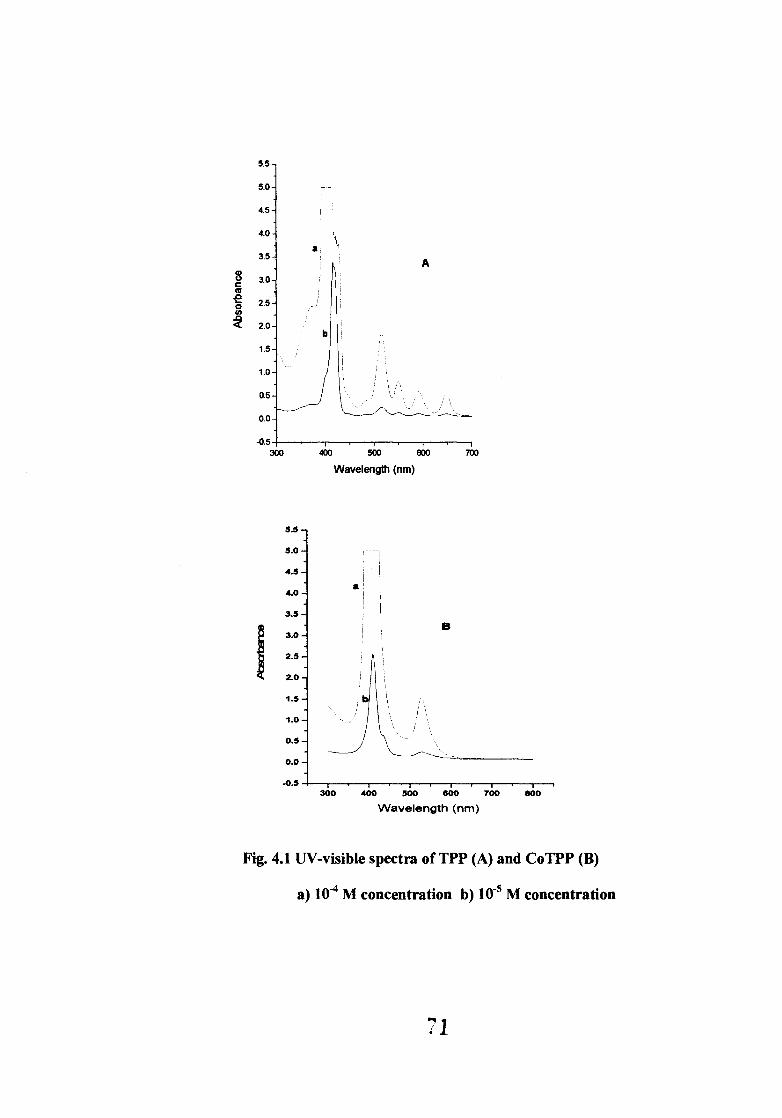
non-aqueous porphyrins in Soret and visible region with molar absorptivities are shown in
Table 4.1 and are in agreement with literature values 49 ' 185 '33 .
In the context of aqueous-porphyrins, there is substitution of four SO3Na groups at the -
para position of each phenyl ring. This makes a free-base porphyrin (TPPS 4) and the
corresponding metalloporphyrins (MTPPS4) soluble in water. TPPS4, ZnTPPS4 and
SnTPPS4C12 show normal spectra due to the fact that TPPS4 is open shell porphyrin
whereas Zn2÷ and Sn4+ form closed shell porphyrins. In the case of CoTPPS 4, NiTPPS4,
CuTPPS4 and AgTPPS 4 on account of small interactions between porphyrin ring and
metal, slight shifting of absorption of peaks from normal spectra is observed. Similarly,
MnTPPS4C1, FeTPPS4C1 and O-(FeTPPS4)2 show hyper spectra, due to greater
interactions between ring and respective metals. Fig. 4.3 and Fig. 4.4 show the different
absorption peaks for water soluble porphyrins in soret as well as visible region. Table 4.2
and 4.3 show electronic absorption peaks with corresponding molar absorptivities of
aqueous-porphyrins containing for di, tri and tetravalent metal ions. These values are in
agreement with literature values 60, 33 .
Further, it is seen from the Table 4.1 that absorption peaks of non-aqueous hyper
porphyrins, monomer MnTPPC1 shows 376 nm and 425 nm bands in soret region
whereas these bands are absent in its dimer O-(MnTPP) 2 . In the visible region, the band
due to dimer O-(MnTPP)2 i.e. 527 nm is blue shifted in comparison with MnTPPC1 band
i.e. 582nm. Similarly, dimer O-(FeTPP) 2 shows blue shift in soret as well as in visible
region in comparison with monomer FeTPPC1. When the absortion peaks of MnTPPC1
and FeTPPC1 are compared, it is seen that latter shows blue shift and their dimers, 0-
(MnTPP)2 and 0-(FeTPP)2 when compared in soret and visible region, it is observed that,
latter shows slight blue shift in comparison with that of former. This substantiates the fact
that increase in atomic number of a metal shows hypsochromic or blue shift in hyper
porphyrins.
In the context of aqueous-porphyrins, regular porphyrins such as TPPS 4, ZnTPPS4 and
SnTPPS4 or irregular porphyrins formed with Co 2+' Ni2+, Cu2+ and Ag2+ do not lead to
any concrete conclusion as shown in Table 4.2 and Table 4.3. The porphyrins like
MnTPPS4C1, FeTPPS4C1 and O-(FeTPPS4)2 belong to hyper class. Among them there
appears blue shift in the soret region with the increase in the atomic number. In
MnTPPS4C1, kma. = 466 rim is a characteristic wavelength for the metalloporphyrin.
7C
Abs
orba
nce
5.5 -
5.0 -
4.5 -
4.0 -
3.5 -
3.0 -
2.5 -
2.0 -
1.5-
1.0 -
0.5 -
0.0
-0.5 300
5.5 -
5.0 -
4.5 -
4.0 -
3.5 -
3.0 -
2.5 -
2.0 -
1.5 -
1.0 -
0.5 -
0.0 -
-0.5
A
400 500 ea)
Wavelength (nm)
a!
300 400 500 600 700 800
Wavelength (nm)
Fig. 4.1 UV-visible spectra of TPP (A) and CoTPP (B)
a) 10-4 M concentration b) le M concentration

a
5 .-
4.-
2-
0-
300 400 500 500 700 800
Wavelength (nm)
600 SOO 700
Wavelength
Fig. 4.2 UV-visible spectra of MnTPPCI (A) and SnTPPCl2 (B)
a) 104 M concentration b) 10-5 M concentration
Table 4.1 The absorption peaks and molar absorptivities of
non-aqueous porphyrins of divalent, trivalent
and tetravalent metal ions
Sr. No.
Porphyrin
Soret band
Absorption
Q-bands
Bands
--4
1 TPP 416 515 549 590 647 C =3.4 x10⁵ C =1.8x10⁴ C =8.1x10³ C =5.9x10³ C =5Ax103
2 CoTPP 410 528 C =2.5x10⁵ C =1.5x10⁴
3 NiTPP 416 528 C =3.1x10⁵ C =1.9x10⁴
4 CuTPP 413 539 C =3.5x10⁵ C =2.1x10⁴
423 C -=4.5x10⁴
5 ZnTPP 418 547 584 C =6.3x10⁵ C = 2.4x10⁴ C = 4.3x10³
6 AgTPP 425 541 C =5.7x10⁵ C =2.2x10⁴
7 MnTPPCI 376 479 582 618 C =7.0x10⁴ C = 1.2x10⁵ C =1.0x10⁴ C =1.2x 10⁴
425 C =5.6x10⁴
8 O-(MnTPP)2 479 527 580 616 C =7.0x10⁴ C =4.1x10³ C =6.1x10³ C =6.1x10³
9 FeTPPCI 416 509 572 609 C =1.2 x10⁵ C =9.3x10³ C =4.5x10³ C =2.3x 10³
10 O-(FeTPP)2 408 571 611 C =1.1 x10⁵ C =7.9x10³ C =36x103
11 SnTPPCl2 426 524 561 606 627 C =1.7x10⁵ C =3.8x10³ C =9.9x10³ C =1.2x10⁴ C =1.5x10⁴
c !
04 egr) 4. L.. E

A
400 SOO 800 700 800
Wavelength (nm)
Wavelength (nm)
Fig. 4.3 UV-visible spectra of TPPS 4 (A) and NiTPPS4 (B)
a) le M concentration b) 10 -5 M concentration
7 4
6-
4- a
A
350
400
600 600 700 800
Wavelength
Wavelength (nm)
Fig. 4.4 UV-visible spectra of FeTPPS4 (A) and O-(FeTPPS4)2 (B)
a) 10-4 M concentration b) 10 -5 M concentration
7c

Table 4.2 Absorption peaks and molar absorptivities of
aqueous-porphyrins containing divalent metal ions
Sr. No.
Porphyrin
Soret
Absorption
4- Q-bands
Bands
->
1 TPPS4 413 516 552 579 633 C =1.6x10⁵ C =5.6x103
=2.4x103 =2.4x103 =1.3x10³
2 CoTPPS 4 425 540E C =9.4x10⁴ C =5.2 x10³
3 NiTPPS4 409 525 C =2.0x10⁵ C =1.2x10⁴
4 CuTPPS 4 412 539 C =2.8x10⁵ C =1.2x10⁴
5 ZnTPPS4 421 556 595 C=2.9x10⁵ C =1.2x10⁴ C=5.0x10³
6 AgTPPS4 422 540 C =2.7x10⁵ C =1.1x10⁴
C cv;";
7C

Table 4.3 Absorption peaks and molar absorptivities of
aqueous-porphyries containing trivalent and tetravalent
metal ions
Sr. No.
Porphyrins
Soret
Absorption
Q-Bands
Bands
-->
7 MnTPPS4C1 413 516 553 579 633 E= 2.5x10 5 =1.1x104
=5.6x103 =5.2x103 =2.3x10³
8 FeTPPS4C1 394 526 608 644 =9.6x10⁴ E =5.6x10³ E=1.8x103
=2.1x10³
9 O-(FeTPP 395 567 609 C =5.5x10⁴ C C
=2.5x103 =1.9x10³
10 SnTPPS4C12 418 515 553 593 E =1.0x10⁵ E =6.2x10² E C
=4.2x103 =2.0x10³
c v;,- I 70.2 10
77

When non-aqueous porphyrins are compared with aqueous-porphyrins from Table 4.1,
4.2 and 4.3, some of the following salient features are observed.
i) The soret band and a characteristic free-base porphyrin band in visible region in TPPS 4
i.e. 413 nm and 633 nm are blue shifted in comparison with 416 nm and 647 nm as
observed in TPP.
ii) The irregular porphyrins formed by divalent metal ions show blue shift in Soret region
for NiTPPS4, CuTPPS4 and AgTPPS 4 in comparison with NiTPP, CuTPP and AgTPP
respectively. The bathochromic or red shift is observed in soret region and in visible
region for CoTPPS4 and ZnTPPS4 in comparison with CoTPP and ZnTPP respectively.
The remaining porphyrins are exhibiting nearly equal absorption peaks in the visible
region for aqueous- and non-aqueous porphyrins for the same metal ion.
iii) The sulphonated porphyrins i.e. MnTPPS4C1, FeTPPS4C1 and O-(FeTPPS4)2 showed
hypsochromic shift in comparison with non-sulphonated MnTPPC1, FeTPPC1 and
O-(FeTPP)2 in Soret as well as in visible region.
iv) Aqueous porphyrin i.e. SnTPPS 4C12 showed blue shift in soret and visible region in
comparison with non-aqueous SnTPPC12.
Therefore, in general, it can be concluded that sulphonated porphyrins absorb at
shorter wavelength than non-sulphonated porphyrins with few exceptions as mentioned
above.

4.2 Infrared spetrosopy
These porphyrins were further characterized by FTIR spectroscopy. A free base TPP
shows medium N-H stretching vibrations at 3317 cm -1. When a metal ion is inserted into a
porphyrin ring the stretching vibrations due to N-H disappear on account of replacement
of two acidic hydrogens by the metal ion. This also gives information about the presence
or absence of TPP as an impurity in the corresponding metalloporphyrins (MTPP). Fig
4.5 and 4.6 show FTIR spectra of non-aqueous porphyrins of divalent, trivalent and
tetravalent metal ions. The main intense absorption bands of the metal chelates of TPP
appear near 1600 cm-1 due to C=C stretching of phenyl ring. At lower frequencies three
sharp bands due to C—H rocking vibrations of the pyrrole ring are obtained at 960, 980
and 1000 cm -1 as shown in Table 4.4 and 4.5 respectively. The results were compared
with literature values 5"3 and are found to be in good agreements. The strong absorption
band near 1000 cm -1 appears due to vibration of the porphyrin ring or pyrrole units, which
is sensitive to the nature of the metal ion. Further, it establishes the strength of the metal-
nitrogen bonds in the TPP chelates. It is evident from the frequency values that the
strength of the metal-nitrogen bond for porphyrins of divalent metal ions is in the
following order ZnTPP < CoTPP = CuTPP < NiTPP = AgTPP. In case of trivalent and
tetravalent metal ion porphyrins the sequence of stability is given as FeTPPC1 < 0-
(FeTPP)2 < MnTPPC1 < O-(MnTPP) 2 < SnTPPC12 . The strong band common to TPP and
metal chelates near 800 cm -1 appears due to vibration of pyrrole ring. The FTIR
spectroscopy is also useful to distinguish between monomers and dimers of Mn 3+ and
Fe3+ respectively.
7 st
100
80 -
A
60 -
40 -
20 -
3000 2600 2000 1600 1000 600
Wave number cm -1
3500
110 -
100 -
90 -
80 -
70 -
60
50 -
40 -
30 -
20 -
4000
V
ti
B
3500 3000 2500 2000 1500 1000 500
Wavenumber (am-1 )
Fig. 4.5 Infrared spectra of TPP (A) and CuTPP (B)
80
n
i\I
0
100 -
'nr
1
80 -
A
60 -
40 -
20 -
t 4000 3500 3000 2600 2000 1500
Wavenumber (cm -1 )
1000 500
e
80 -
60-
40 -
100
B r
p
ti
1
4000 3600 3000 2500 2000 1600 1000 500
Wavenumber (em -1 )
Fig. 4.6 Infrared spectra of MnTPPC1 (A) and SnTPPC1 2 (B)
S 1

Table 4.4 Infrared frequencies and assignments for divalent metal ions
Sr.No. Ligand
TPP Co
Metal
Ni Cu
ions
Zn Ag
Assignment
1 3317 (m) — N—H Stretching
2 3055 (m) 3053 3053 3051 3053 3053 C—H Stretching (Py)
3 3024 (m) — 3024 3024 3024 3024 C—H Stretch (phenyl)
4 1595 1598 1599 1599 1595 1595 (Phenyl) (m) (m) (m) (m) (m) (m)
5 1556 (PY) (m)
6 1443 1440 1441 1441 1441 1441 C—H bend (m) (m) (m) (m) (m) (m) (Py)
7 1350 1350 1352 1346 1341 1341 (s) -C—N- Stretch (m) (m) (s) (m) (s)
8 1001 1005 1007 1005 1003 1007(s C—H Rock (m) (s) (s) (s) (s) ) (PY)
9 798 793 793 792 (s) Pyrrole ring (s) (s) (s)
82
Table 4.5 Infrared frequencies and assignments
for porphyrins of trivalent and tetravalent metal ions
Sr.No Ligand Metal ions Assignment
TPP Mn Mn (di) Fe (di) Sn
1 3317 (m) N—H Stretch
2 3055 (m) 3055 (m) 3055(m) 3055 (m) 3053(w) C—H Stretch (Py)
3 3024 (m) 3024 (w) 3024 (w) 3024 (w) 3024 (w) C—H Stretch (Phenyl)
4 1595 (m) 1597 (m) 1597 (m) 1597 (m) 1595 (m) (Phenyl)
5 1556 (m) 1553 (s) (Py)
6 1443(m) 1438 (m) 1441 (m) 1441 (m) 1441 (m) (Py)
7 1350 (m) 1342 (m) 1341(m) 1339 (m) 1341 (m) -C—N Stretch
8 1001 (m) 1007(s) 1011 (s) 1003 (s) 1022 (s) C—H Rock (Py)
9 798 (s) 806 (s) 800 (m) 798 (m) Pyrrole ring
8?
90
80 -
70 -
60 -
50 -
40 -
30
20 4000
90 -
80 -
70 -
60 -
50 -
40
4000
A
\) 1
1 3600 3000 2600 2000 1600 1000 600
Wavenumber (cm -1 )
3600 3000 2600 2000 1600 1000 500
Wavenumber (cm-1 )
B
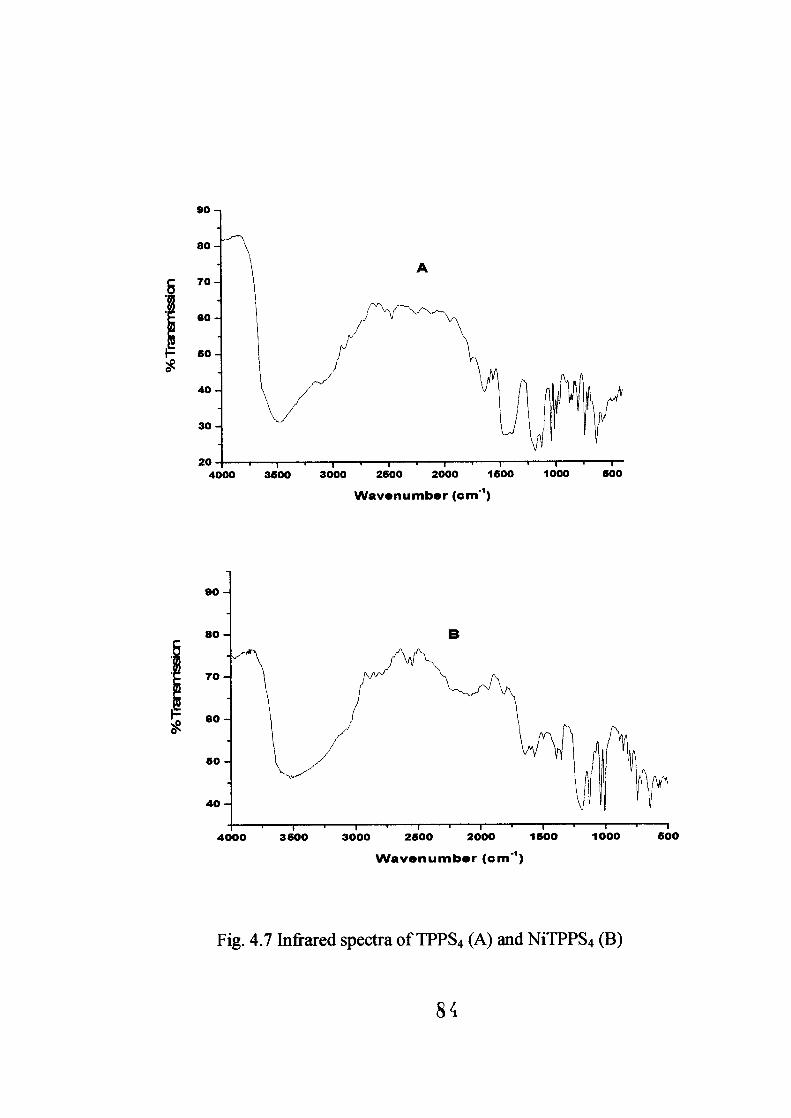
Fig 4 7 Infrared spectra of TPPS 4 (A) and NiTPPS4 (B)
S i

1St
I 3 500 3 000 2 50 0 2000 1500 1000 S 0 0
A
i\
V
1
.\ v‘
\ , • 1
4000 3600 3000 2600 2000 1600 10100 600
Wavenumber (em -1 )
VV Imo lb op ir- (c rim''' )
80 —
so
40
Fig. 4.8 Infrared spectra of FeTPPS 4 (A) and O-(FeTPPS4)2 (B)

Table 4.6 Infrared frequencies and assignments for porphyrins of
divalent metal ions
Sr. No
Ligand
TPPS4 Co
Metal
Ni Cu
ions
Zn Ag
Assignment
1 3440-3590 3523 3523 3523 3508 3523 N—H Stretch & 0—H Stretch
2 3113(w) 3001 3064(w) 3113 3120 3120 C—H
(w) (w) (w) (w) Stretch(Py)
3 1593 (w) 1577 1573 (w) 1595 1577 1593 C= C (phenyl)
(w) (w) (w) (w)
4 1560 (w) 1566 (s) 1560 (w) 1562 1566 1560 C= C (Py) (w) (m) (w)
5 1420-1440 1420 1420 (vw) 1442(m) C—H bend (Py) (s) (m) In plane
6 1184 (s) 1199 1188 (s) 1184 (s) 1193 1186 Sodium
(m) sulphonate
7 1128 (s) 1130 1128 (s) 1130 (s) 1128 (s) 1130 (s) If
(m)
8 1041 (s) 1043 1039 (s) 1041 (s) 1041 (s) 1041 (s) (m)
9 1012 (s) 1000- 1006 (s) 1010- 999 1004 C—H Rock (Py) 1010 999 (m) (s)
10 800 (m) 797 (m) 795 (m) 800 (m) 797 (m) 795 Pyrrole ring
S c

Table 4.7 Infrared frequencies and assignments for porphyrins of trivalent and tetravalent metal ions
Sr.
No.
Ligand
TPPS4 Mn
Metal
Fe Fe(di)
Ions
Sn
Assignments
1 3440-3590 3440-3530 3400-3650 3440-3590 3400-3545 N—H Stretch &
0—H stretch
2 3113 (w) 3111 (w) 3111 (w) 3160 (w) 3132 (w) C—H Stretch
3 1593 (w) 1595 (w) 1600 (w) 1595 (w) 1597 (w) C=C (Phenyl)
4 1560 (w) 1562 (w) 1565 (w) - - C=C (Py)
5 1420-
1440(s)
1396 (m) 1392 (m) 1440-1470
(m)
1384 (s) C—H bend (Py)
6 1184 (s) 1192 (s) 1175-1240
(s)
1188 (s) 1195 (s) Sodium
sulphonate
7 1128 (s) 1128 (s) 1130 (s) 1128 (s) 1130 (s) t,
1041 (s) 1041 (s) 1041 (s) 1041 (m) 1041 (s)
8 1012 (s) 1012 (s) 1001,1012
(s) (w)
1001,1012
(s) (w)
1006,1012
(s) (w)
C—H Rock (Py)
9 850 (w) 881 (s)
10 800 (m) 804 (m) 798 (m) 798 (m) 806 (m) Pyrrole ring
In FeTPPC1 and MnTPPC1 the weak bands obtained are 833 and 834 cm' whereas in
dimer O-(MnTPP)2 and O-(FeTPP)2 the bands are 879 and 877 cm -1 respectively. The
bands obtained in dimers are attributed to Mn-O-Mn and Fe-O-Fe stretching 82 .
In the context of aqueous-porphyrins, the additional bands are obtained due to
sulphonation of porphyrins in addition to all bands present in non-aqueous porphyrins.
These bands in TPPS4 are 1041, 1128 and 1184 cm' which confirms substitution of
SO3Na group in each of the four phenyl rings at -para or 4- position. Since aqueous
porphyrins are containing water of crystallization, -OH stretching frequency is seen as
shown in Table 4.6 and 4.7 for base-free and other metalloporphyrins. The FTIR spectra
of some of the porphyrins were confirmed by comparison with literature values 33 ' 34 . It is
also observed from the tables that C-H rocking vibrations of the pyrrole ring are reduced
with divalent metals and remained nearly same with trivalent metals as compared with
the free-base TPPS4. The vibration bands due to SO3Na increase in magnitude after
metalalion with divalent, trivalent and tetravalent metals with the exception of CuTPPS4.
The monomer FeTPPS4C1 and dimer O-(FeTPPS4)2 are differentiated from each other by
850 and 881 cm-1 bands due to Fe-O-Fe stretching in dimer
When non-aqueous and aqueous-porphyrins are compared following features are
revealed.
i) Disappearance of N-H stretching vibrations indicate metalation reaction and removal of
imputity due to TPP or TPPS 4 in metalloporphyrins.
ii) The C-H rocking vibrations of pyrrole ring in non-aqueous porphyrins are depending
upon the nature of the metal, which further explains the bond strength between metal and
nitrogen of pyrrole ring. In aqueous-porphyrins, substitution of different metals in
porphrinato core does not produce any obseravable change, instead, it has shown
decreasing values of C-H rocking vibrations as compared to TPPS4.
iii) The O-H stretching in aqueous-porphyrins reveals that these porphyrins are hydrated
whereas non-aqueous porphyrins do not show such stretching, which shows absence of
water of hydration.
4.3. 1Hnmr spectroscopy
These synthesized porphyrins contain meso-tetraphenylporphyrin (TPP), which is a
parent compound. I Hninr spectrum of TPP is characterized by two singlets arising from
the 13-pyrrole protons and N-H protons, respectively. The phenyl protons can be assigned
to the two resonances with little fine structure; one results from the -ortho protons and the
other from the -meta and -para protons 186'187 . The phenyl rings are generally considered to
be restricted in their rotation and noncoplanar with the plane of the porphyrin ring.
Some of the representative metalloporphyrins are used for characterization of non-
aqueous and aqueous porphyrins. The porphyrins can be classified as diamagnetic and
paramagnetic metalloporphyrins. The salient features of 1 1inmr spectra of compounds
with unpaired spins are determined by hyperfine electron-nuclear interactions and by
relaxation processes 188 .
In above non-aqueous porphyrins, TPP, NiTPP, ZnTPP and SnTPPC12 are
diamagnetic whereas CoTPP, CuTPP, AgTPP, MnTPPC1, 0-(MnTPP)2, FeTPPC1 and 0-
(FeTPP)2 are found paramagnetic in nature. Fig. 4.9 and Fig.4.1 0 show 1 Hnmr spectra of
non-aqueous diamagnetic and paramagnetic porphyrins respectively. The chemical shifts
of selected non-aqueous porphyrins are summarized in Table 4.8.
8 9,

In the series of aqueous porphyrins, TPPS4, NiTPPS 4, ZnTPPS4 and SnTPPS4C12 are
diamagnetic whereas CoTPPS 4, CuTPPS4, AgTPPS4, MnTPPS4C1, FeTPPS4C1, 0- 4-4•14
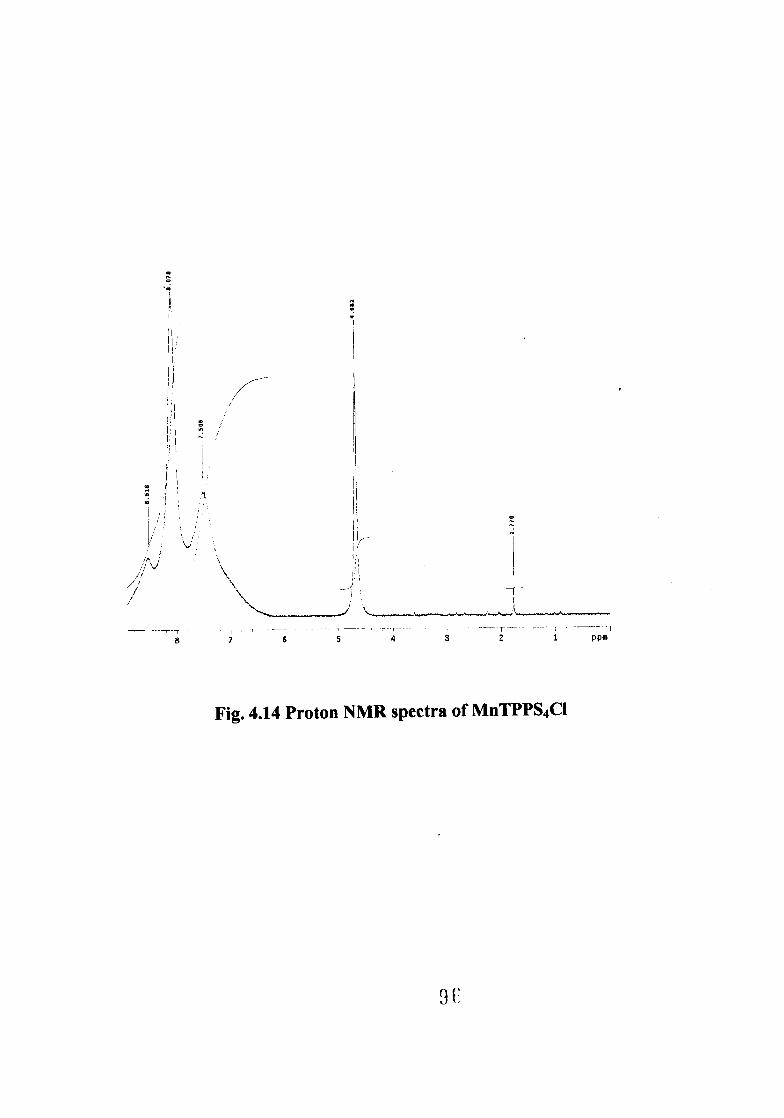
(FeTPPS4)2 are paramagnetic in nature. Fig.4.1Sshows 'Hnmr spectra of aqueous TPPS4
and MnTPPS4C1 and Table 4.9 gives chemical shifts of some aqueous-porphyrins.
It is observed that in TPP 3-pyrrole protons show the maximum low field signal whereas
ortho-phenyl protons show comparatively shifting of the signal towards high field and meta-
and para- phenyl protons are having overlapping resonance signal at still more higher field.
This type of situation is also observed in NiTPP and ZnTPP respectively. When the proton
nmr spectra of paramagnetic porphyrins like CoTPP is considered, it is seen that all types of
proton signals are shifted to the maximum low field values with broadening of the resonance
signals. In case of CuTPP, and AgTPP the signals due to pyrrole protons and ortho-phenyl
protons are either absent or overlapping with meta- or para-phenyl protons. This was
compared with literature values' 87 and found to be in good agreement. In FeTPPC1 and
MnTPPC1, it is observed that due to presence of axial Cl proton nmr signals move toward the
diamagnetic four-coordinated porhyrins 189,190 .
90

TT' 1
8.4 8.3 8.2 8.1. 8.0 7.9 7.8
8.8 8.7 8.6 8.5 PPm
Fig.4.9 Proton NMR spectra of TPP

►
17 16 15 ► ' "
Fig 4.10 Proton NMR spectra of CoTPP
9 2

r
Fig.4.11 Proton NMR spectra of CuTPP
cioka 6, G T, RG-512
0 PP,"
Fig 4.12 Proton NMR spectra of AgTPP
It

Table 4.8 Proton NMR chemical shifts (in 8 ppm) for non-aqueous porpyrins
Sr.No Porphyrin o-Phenyl m-phenyl p-Phenyl fl-Pyrrole
1 TPP 8.22 (m) 7.74 (m) X 8.84 (s)
2 CoTPP 13.0 (s) 9.88 (d) 9.67 (s) 15.9 (s)
3 NiTPP 8.0 7.7 7.7 8.7
4 CuTPP X 7.58 7.2 (m) 8.78 (s)
5 ZnTPP 8.2 (m) 7.71 7.69 (d) 8.9 (s)
6 AgTPP X 7.6 7.2 X
7 MnTPPCI X X X 7.8-8.8 ( not resolved)
8 FeTPPCI 7.7 7.2 6.4 7.7
Note:
1) All spectra were obtained at 29°C and chemical shift values are mentioned in 8 ppm w.r.t.(CH3)4Si
2) "X" entries indicate signals not detected due to large line width or overlap with other signals.
3) Solvent used is CDC13
94
1 I I rITTI/IIIIIFIII-11- 7 1r 11,1171,1-1,1-11114111,11,ilItT,11/11111. 1. , Ifl,
8 . 6 , 8 . 4 8.2 8.0 7.8 7.6 7.4 7.2 7.0 ppm
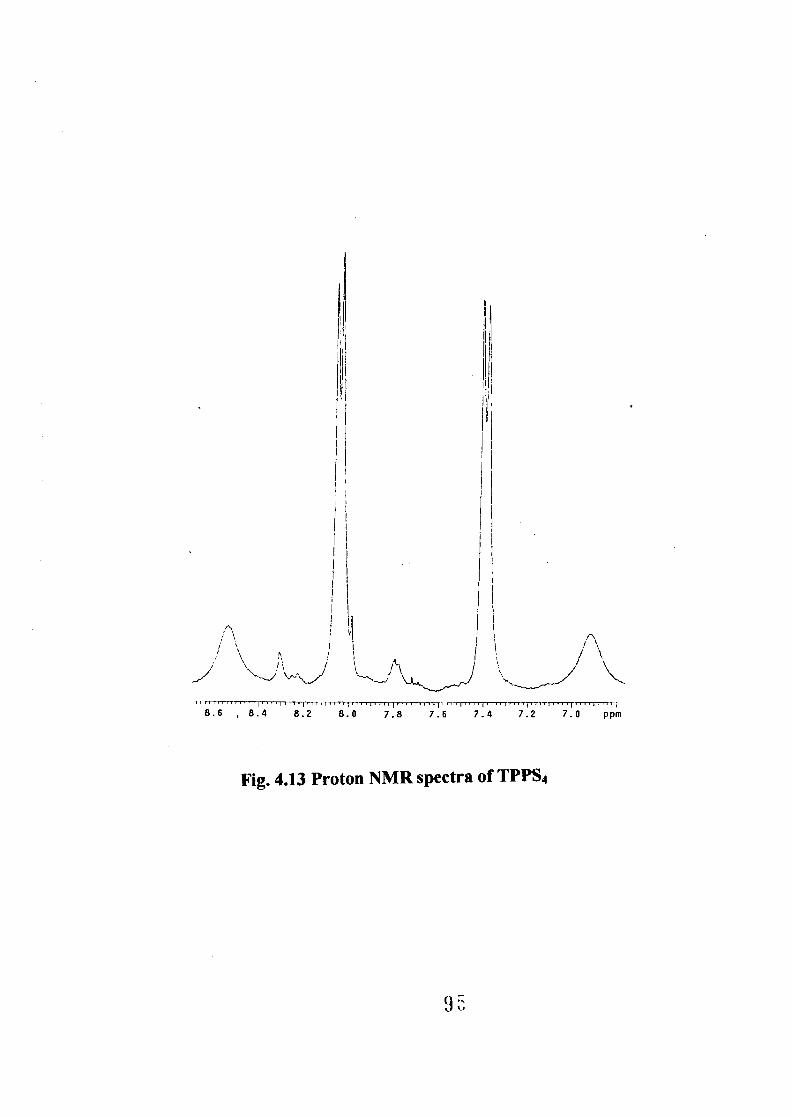
Fig. 4.13 Proton NMR spectra of TPPS4
9
8 7 6
5 4 3 2 1
PPm
Fig. 4.14 Proton NMR spectra of MnTPPS4C1

Table 4.9 Proton NMR chemiet?I shifts (in S ppm) for aqueous porPyrins
Sr.No. Porphyrin 0-Phenyl m-Phenyl fl-Pyrrolle
1 TPPS4 8.53 7.38-7.4 (d) 8.05-8.03 (d)
2 CoTPPS4 9.2 8.06 8.9
3 MnTPPS4C1 8.51 7.5 8.07
Note :
Here, o-phenyl protons are considered w.r.t. SO 3Na group. Threfore, these protons are deshielded and ultimately give more low field value than pyrrole protons.
In aqueous-porpyrins like TPPS4, it is seen that ortho-phenyl protons are shifted to
more down-field value as compared to pyrrole protons signal. The reason may be due to
the presence of SO3Na group at para position of the phenyl ring, ortho protons may be
deshielded. Therefore, in aqueous-porphyrins o-phenyl protons have maximum down-
field signal than a-protons. In CoTPPS 4, being paramagnetic in nature, the o-phenyl
protons are still more shifted to down-field as compared to TPPS 4. In MnTPPS4C1, even
though paramagnetic in nature, due to the presence of axial Cl ligand, the proton shifts
are again seen at the position of diamagnetic porphyrins. Thus it is evident from above
that; aqueous-porphyrins show more down-field proton shift than non-aqueous
porphyrins on account of presence of SO 3Na group.
97

4.4 Elemental analysis
The elemental analysis being a characterization tool, it is included in this chapter to
confirm the synthesized porphyrins, in addition to other spectroscopic methods. The
selective non-aqueous porphyrins like TPP and CuTPP and aqueous-porphyrin like
MnTPPS4C1 were subjected to elemental analysis with respect to C, H, and N analysis.
The results of the same are summarized in Table 4.10
Table 4.10 Elemental analysi§_of non-aqueous and Aqueous-porarins
Sr.No. Porphyrin Amount % C % H %N
1 TPP Expected 85.95 4.92 9.10 Found 84.01 4.90 8.96
2 CuTPP Expected 78.13 4.26 8.28 Found 76.52 4.33 8.16
3 MnTPPS4CINa4.12H20 Expected 39.76 4.22 3.65
Found 38.61 4.28 3.62
From the results in the above table, it can be concluded that there is sufficiently good
agreement between expected results and experimental results, which reflects upon the
routes of synthesis and methods of purification modified from time to time, are up to the
expectation.
9S
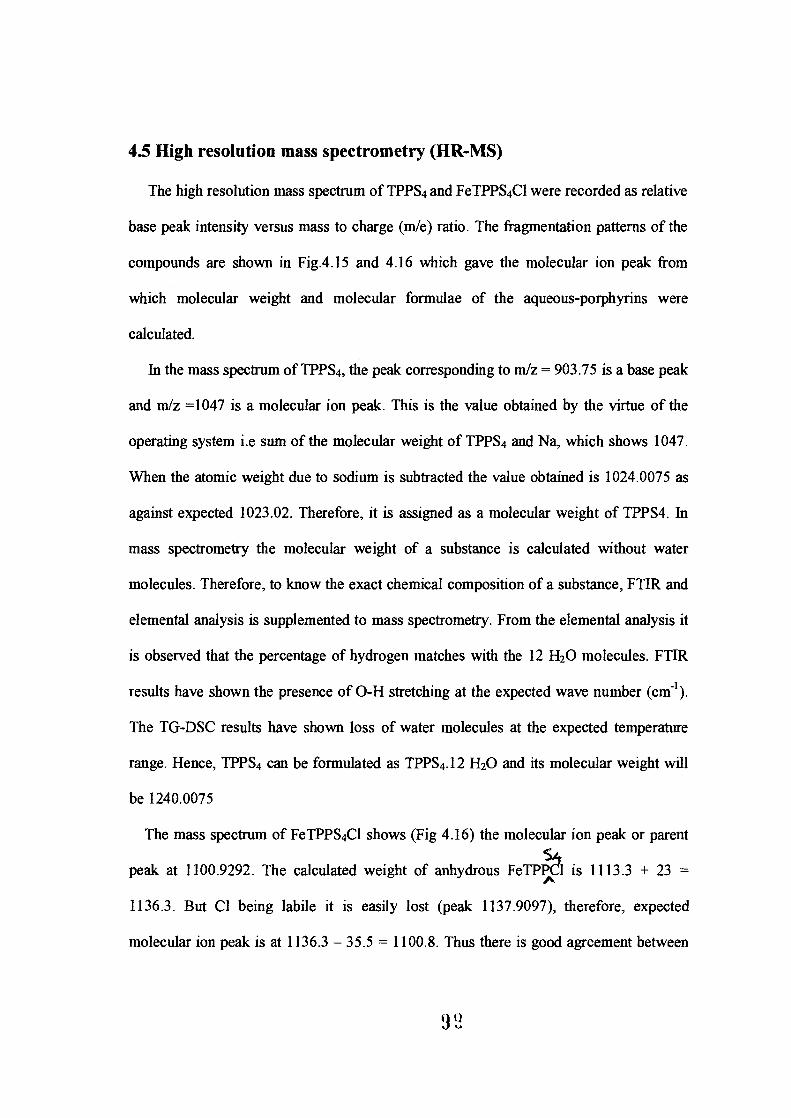
4.5 High resolution mass spectrometry (HR-MS)
The high resolution mass spectrum of TPPS4 and FeTPPS4C1 were recorded as relative
base peak intensity versus mass to charge (m/e) ratio. The fragmentation patterns of the
compounds are shown in Fig.4.15 and 4.16 which gave the molecular ion peak from
which molecular weight and molecular formulae of the aqueous-porphyrins were
calculated.
In the mass spectrum of TPPS4, the peak corresponding to m/z = 903.75 is a base peak
and m/z =1047 is a molecular ion peak. This is the value obtained by the virtue of the
operating system i.e sum of the molecular weight of TPPS 4 and Na, which shows 1047.
When the atomic weight due to sodium is subtracted the value obtained is 1024.0075 as
against expected 1023.02. Therefore, it is assigned as a molecular weight of TPPS4. In
mass spectrometry the molecular weight of a substance is calculated without water
molecules. Therefore, to know the exact chemical composition of a substance, FTIR and
elemental analysis is supplemented to mass spectrometry. From the elemental analysis it
is observed that the percentage of hydrogen matches with the 12 H 2O molecules. FTIR
results have shown the presence of 0-H stretching at the expected wave number (cm -1 ).
The TG-DSC results have shown loss of water molecules at the expected temperature
range. Hence, TPPS4 can be formulated as TPPS4.12 H2O and its molecular weight will
be 1240.0075
The mass spectrum of FeTPPS4C1 shows (Fig 4.16) the molecular ion peak or parent
peak at 1100.9292. The calculated weight of anhydrous FeTPP1I is 1113.3 + 23 =
1136.3. But Cl being labile it is easily lost (peak 1137.9097), therefore, expected
molecular ion peak is at 1136.3 — 35.5 = 1100.8. Thus there is good agreement between
9i2

experimental and calculated value. Based on these calculations, the porphyrin can be
formulated as FeTPPS4C1 .12H20 with molecular weight of 1329. Using above results
from the HR-mass spectroscopy, molecular formula and corresponding molecular weight
of the aqueous-porphyrins were determined as shown in Table 4.11

1045.9966 1088.9579
1067.9752
TPS TPS 2 (0.058) AM (Cen,10, 99.00, k,5343.0,556.28,0.40,LS 10); Sm (Mn, 2x4.00); Sb (4,40.00 ); Cm (2:3) 1: TOF MS ES+
1 903.7559 932
Cala! Mass = 1047.0075 (M+Na )
1044.9960 901.7480
905.7692
1066.9788
877.7423
879.7422
906.7708
907.7844
1089.9631 1047.0009
940 960 980 1000 1020 1040 1060 1080 1100 1120 1140
1.7551
o-4440 860
Fig 4.15 HR-MS spectra of TPPS4
101

1
NIPS • FeTPS 17 (0.419) AM (Cen,10, 99.00, Ar,5343.0,556.28,0.40,LS 10); Sm (Mn, 2x4.00); Sb (4,40.00 ); Cm ((2:6+10:17))
1075.9423
10989261 Calcd Mass =1100.9268 (M+Nal
1: TOF MS ES+ 5.81e3
1076.9476 1099.9296
%-
1077.9456
I 1100.9292
1053 9640 1129 9547 1078.9385
1054.9617
1101.9270 1115.9282 1137 9097 1155.9299
1156.9344 1055.9543 1079.9319 1102.9265 (
1116.9369 1139.9174
I 0 . ,„ „.. ■ .1111 „.. [ili, 1,1 4,1! ; I
/fr rnk 1010 1020 1030 1040 1050 1060 1070 1080 1090 1100 1110 1120 1130 1140 1150 1160 1170 1180 1190
Fig.4.16 HR-MS spectra of FeTPPS4CI
102

Table 4.11 Molecular formulae and molecular weights of aqueous-porphyrins
Sr.No. Molecular formula Molecular weight
1 TPPS4.12H20 1240
2 CoTPPS4. 12H20 1297
3 NiPPS4. 12H20 1296.6
4 CuTPPS4.12H20 1301.5
5 ZnTPPS4. 12H20 1303.4
6 AgTPPS4. 12H20 1345.8
7 MnTPPS4C1. 12H20 1328.4
8 FeTPPS4C1. 121120 1329
9 0-(FeTPPS4)2. 24120 2. 6 03
10 SnTPPS4C12. 12H20 1427.7
Note: For convenience the 12H20 molecules are not represented each time
10

4.8 Fluorescence spectroscopy
It is accepted that most of the luminescence and photochemistry observed from
porphyrins is associated with the IC - it states of the porphyrin ring, even though, the
lifetimes and reactivity of these states depend strongly on the metal ion incorporated l°7 .
In general most of the free base porphyrins, chlorins, and related compounds show strong
fluorescence at room temperature and in rigid glasses they show fluorescence and
phosphorescence. Metalloporphyrins luminescence falls into several categories, which is
dependent upon the electronic structure of the metal. For the free-base TPP, fluorescence
Amax and singlet energies are 660 nm and 45 kcal/mol. When metals are containing either
empty or full d-shells, form complexes with tetraphenyl porphyrin or octaethyl porphyrin
and then they show fluorescence at room temperature 108,109 as well as fluorescence and
phosphorescence at liquid nitrogen temperature. The fluorescence yield tends to decrease
with increasing atomic number of the metal as does the phosphorescence. The emission
spectra are usually shifted to longer wavelengths as the square-planar metalloporphyrin
accepts axial ligands in the fifth and sixth coordination positions 110 .
The non-aqueous and aqueous porphyrins were first tested under UV lamp to check
their fluorescence property and accordingly they were selected for quantitative
determination of fluorescence intensity and corresponding wavelength i. e. k fith..
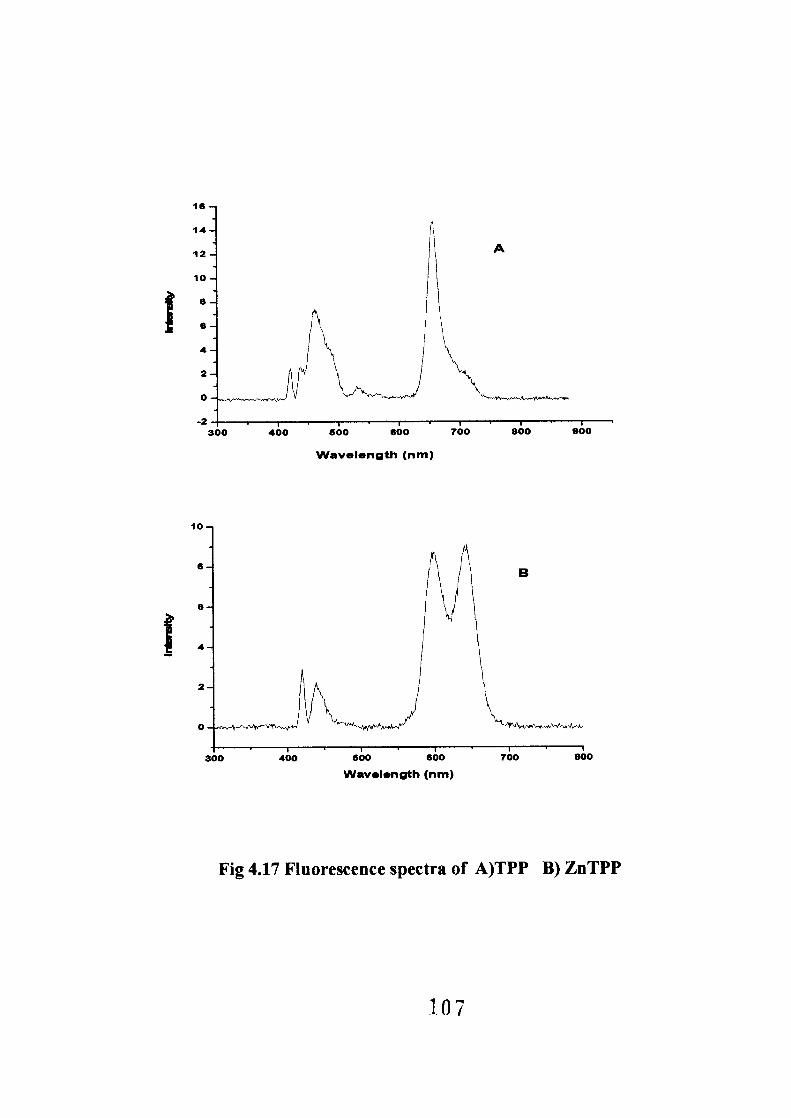
In the series of non-aqueous porphyrins, TPP, ZnTPP, MnTPPC1, O-(MnTPP)2 and
SnTPPC12 are found to be fluorescent whereas CoTPP, NiTPP, CuTPP, AgTPP, FeTPPC1
and O-(FeTPP)2 are nearly non-fluorescent. In TPP emission intensity at ?max = 657 nm
is 14.69 whereas in ZnTPP there are two well defined emission bands at 597 nm and 644
nm with emission intensity of 9.13 at A as shown in Fig. 4.17. The values of Amax
.10

obtained for TPP and ZnTPP are in good agreement with the literature values 192' 193 .
Further, it is seen that the MnTPPC1 exhibits maximum fluorescence intensity in the
series as shown in Fig. 4.18. Following sequence gives the intensities of non-aqueous
porphyrins in the order MnTPPC1 > O-(MnTPP) 2 > TPP > ZnTPP > SnTPPC1 2 .
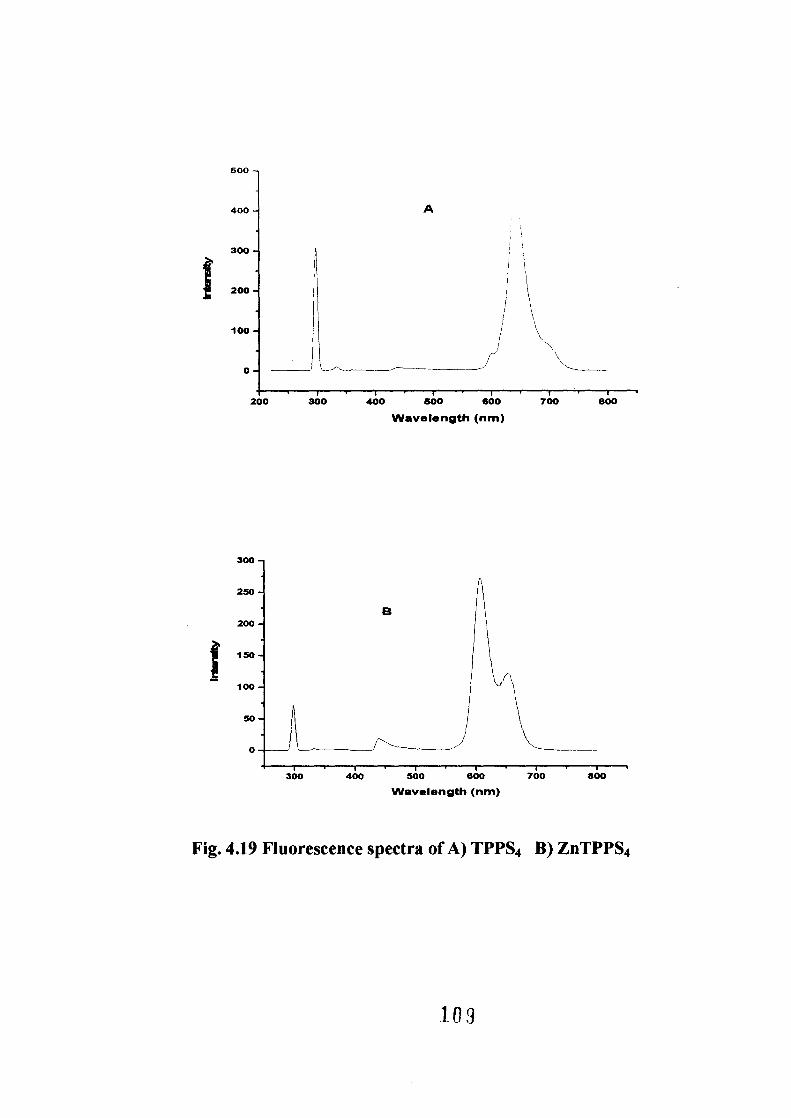
With reference to aqueous-porphyrins it is seen that TPPS 4, ZnTPPS4, AgTPPS4,
MnTPPS4C1 and SnTPPS4C12 are fluorescent whereas CoTPPS4, NiTPPS4, CuTPPS4,
FeTPPS4C1 and O-(FeTPPS4)2 are nearly non-fluorescent. In this series, TPPS4 shows
maximum emission intensity, ZnTPPS 4 and AgTPPS4 show minimum and equal amount
of intensities. Fig 4.19 shows fluorescence intensity for TPPS 4 and ZnTPPS4 whereas Fig
4.20 shows the fluorescence for MnTPPS4C1 and SnTPPS 4C12 respectively. The order of
fluorescence intensity is given as TPPS4 > SnTPPS4C12 > MnTPPS 4C1 > ZnTPPS4 =
AgTPPS4.
When non-aqueous and aqueous-porphyrins are compared it is observed that
1) The aqueous-porphyrins show hypsochromic or blue shift in emission wavelength as
compared to non-aqueous porphyrins. The values can be compared as shown in Tables
4.12 and 4.13.
2) The aqueous-porphyrins show many fold higher fluorescence than non-aqueous
porphyrins.
3) AgTPP is found to be non-fluorescent whereas after sulphonation i.e. AgTPPS 4 shows
fluorescent property.
4) The excitation wavelength required for aqueous-porphyrins is 300 nm whereas for
non-aqueous porphyrins it is 420 nm for 10 4 M concentration.
These observations may be explained on the basis of solvent effect as well as
sulphonation of four phenyl rings at para position in aqueous porphyrins. It is also
observed in the chapter 6 that the fluorescent porphyrins are more efficient photocatalysts
than non-fluorescent porphyrins.
1 0 C
300 400 500 800 700 800 900
Wavelength (nm)
10-
8-
6-
i
4-
2-
300 400 500 890 700
800
Wavelength (nm)
Fig 4.17 Fluorescence spectra of A)TPP B) ZnTPP

so -
50 -
40 -
30 -
20 -
10-
0
300
A
400 800 600
700
800
Wavelength (nm)
300
400
600 eoo
700
800
Wavelength (nm)
Fig. 4.18 Fluorescence spectra of A) MnTPPCI B) SnTPPC12
500 i
400 - A
300 -
I
200 -
100 -
0-
200
3tio 7•io 400 500 600 800
Wavelength (nm)
300 -
250 -
200 -
1 150 -
100 -
50
o
300 400 500 600 700 800
Wavelength (nm)
Fig. 4.19 Fluorescence spectra of A) TPPS 4 B) ZnTPPS4

-50 300 400 500 600
700
800
Wavelength (nm)
B 350 -
300 -
250 -
200 -
150 -
100 -
50 -
0 -
400 -
300 400 500 800 700 800
Wavelength (nm)
Fig.4.20 Fluorescence spectra of A) MnTPPS4C1 B) SnTPPS4C12
-50 200
400 -
350 -
300 -
250 -
200 -
150 -
100 -
50-

Table 4.12 Fluorescence data of non-aqueous porphyryrin
(Excitation wavelength = 420 nm)
Sr.No. Porphyrin kmax (nm) Fluorescence
lntesity
1 TPP 657 14.69
2 CoTPP 421 2.837
3 NiTPP 421 2.911
4 CuTPP 420 2.578
5 ZnTPP 644 9.13
6 AgTPP 421 2.603
7 MnTPPCI 651 56.72
8 O-(MnTPP)2 504 46.06
9 FeTPPCI 420 2.879
10 O-(FeTPP)2 420 2.710
11 SnTPPCl2 636 7.89
lit
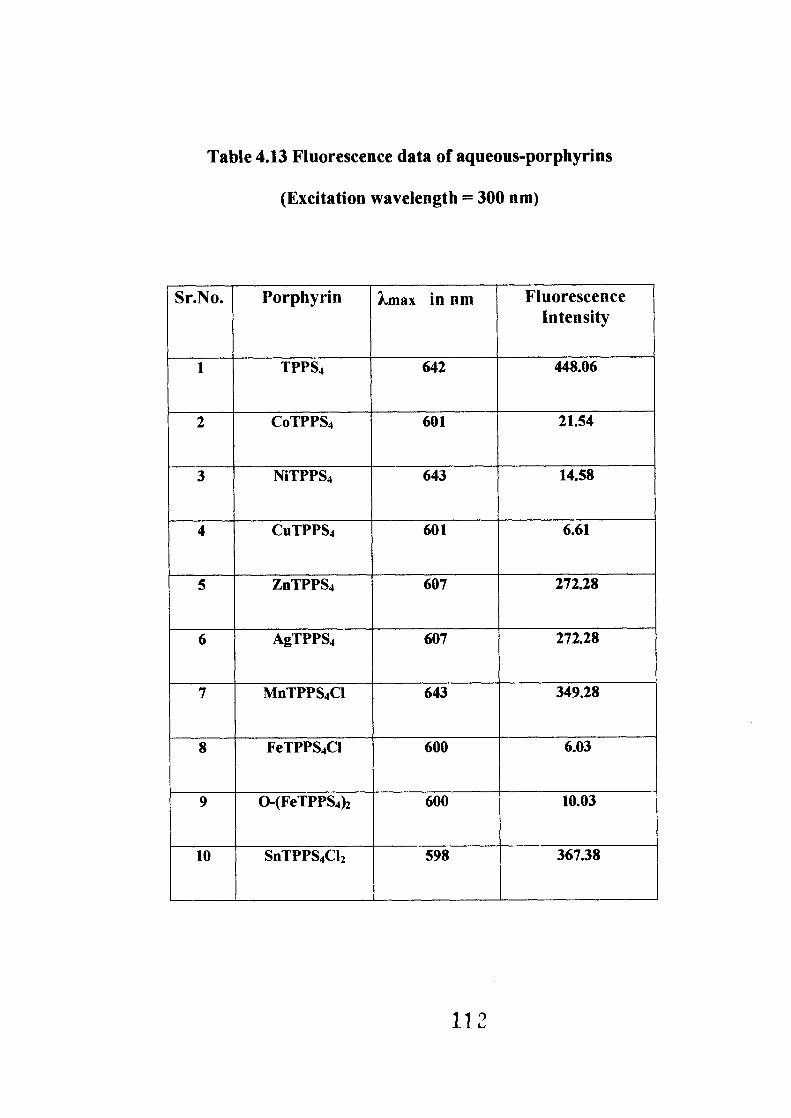
Table 4.13 Fluorescence data of aqueous-porphyrins
(Excitation wavelength = 300 nm)
Sr.No. Porphyrin Amax in nm Fluorescence Intensity
1 TPPS4 642 448.06
2 CoTPPS4 601 21.54
3 NiTPPS4 643 14.58
4 CuTPPS4 601 6.61
5 ZnTPPS4 607 272.28
6 AgTPPS4 607 272.28
7 MnTPPS4C1 643 349.28
8 FeTPPS4C1 600 6.03
9 0-(FeTPPS4)2 600 10.03
10 SnTPPS4C12 598 367.38

4.9 Diffuse reflectance spectroscopy (DRS)
Diffuse reflectance spectra of non-aqueous and aqueous porphyrins were recorded on
using wavelength range from 300 to 800 nm and BaSO4 as a reference material.
Reflectance data are usually expressed in terms of percent reflectance (%R) which is
analogous to percent transmission in absorption spectroscopy. The technique is non-
destructive and is used to determine the energy gap (E g) in semiconductors in
• optoelectromcs 120-123 . A common way of determining band gap from absorption spectra is
the percent reflectance (%R) is made function of wavelength and from the corresponding
graph Eg is calculated.
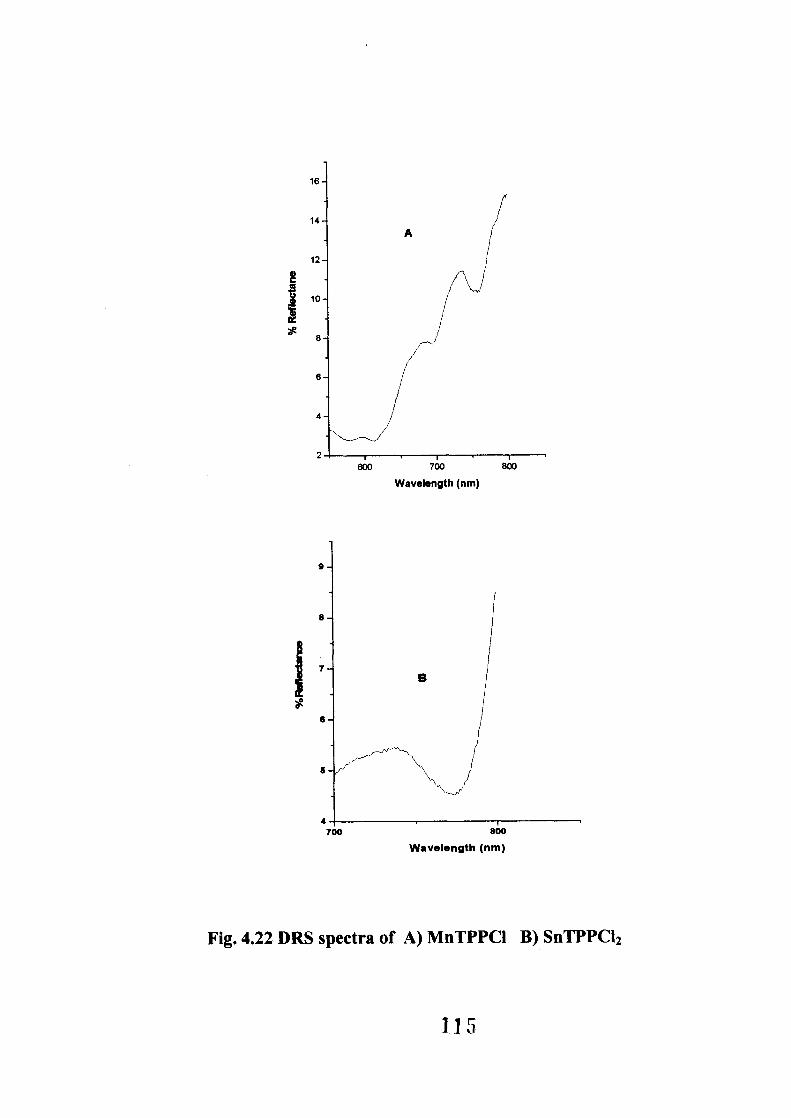
In the series of non-aqueous porphyrins it is seen that the band-gap energy value of
CoTPP is 1.92 eV whereas for CuTPP it is 1.61 eV. These are higher and lower values
obtained for the selected series. The rest of the values are lying in between these two
extreme values. The DRS curves for TPP, ZnTPP, MnTPPC1 and SnTPPC1 2 are shown in
Fig. 4.21 and 4.22 respectively. The band-gap (E g) values for given porphyrins are
calculated by using formula, band gap (eV) = 1239 / k max where, Amax is obtained from
the respective DRS curves. Table 4.14 contains band-gap energy values for non-aqueous
porphyrins in eV.
113

603 760 660
Wavelength (nm)
60-
50-
40 -
30- B
20-
10-
0-
400 600 600 700
Wavelength (nm)
Fig. 4.21 DRS spectra of A) TPP B) ZnTPP
1.14
6°-
60
4o-
q 30-
20
600
16 -
14 -
12
10
A
8
6
4-
2
600 700
800
Wavelength (nm)
9-
8-
7-
4 700 800
Wavelength (nm)
Fig. 4.22 DRS spectra of A) MnTPPCI B) SnTPPC12
115
B

20 -
15-
t
at 10
5
500
0
600 700
Wavelength (run)
70 -
so -
1 0
600 700
Wavelength
0 500 BOO
Fig.4.23 DRS spectra of A)TPPS 4 B) AgTPPS4
% R
efle
ctan
ce
20
18
18
14
12-
10-
8
e
4-
2-
GOO
A
1
DO 700
Wavelength (nm)
12-
10-
8
% R
efle
ctan
ce
B
6-
4-
2
760
Wavelength (nm)
600
Fig.4.24 DRS spectra of A) MnTPPS4C1 B) O-(FeTPPS4)2
117

Table 4.14 Band gap energy values of non-aqueous porphyrins
Sr.No. Porph ri n Band gap (eV )
1 TPP 1.75
2 CoTPP 1.92
3 NiTPP 1.82
4 CuTPP 1.61
5 ZnTPP 1.86
6 AgTPP 1.75
7 MnTPPCI 1.70
8 O-(MnTPP)2 1.69
9 FeTPPCI 1.71
10 SnTPPC12 1.68
113

Table 4.15 Band gap energy values for aqueous-porphyrins
Sr.No. Porphyrin Band Gap (eV )
1 TPPS4 1.66
2 CoTPPS4 1.76
3 NiTPPS4 1.83
4 CuTPPS4 1.79
5 AgTPPS4 1.74
6 MnTPPS4C1 1.68
7 FeTPPS4C1 1.75
8 O-(FeTPPS 4)2 1.73
9 SnTPPS4Cl2 1.75
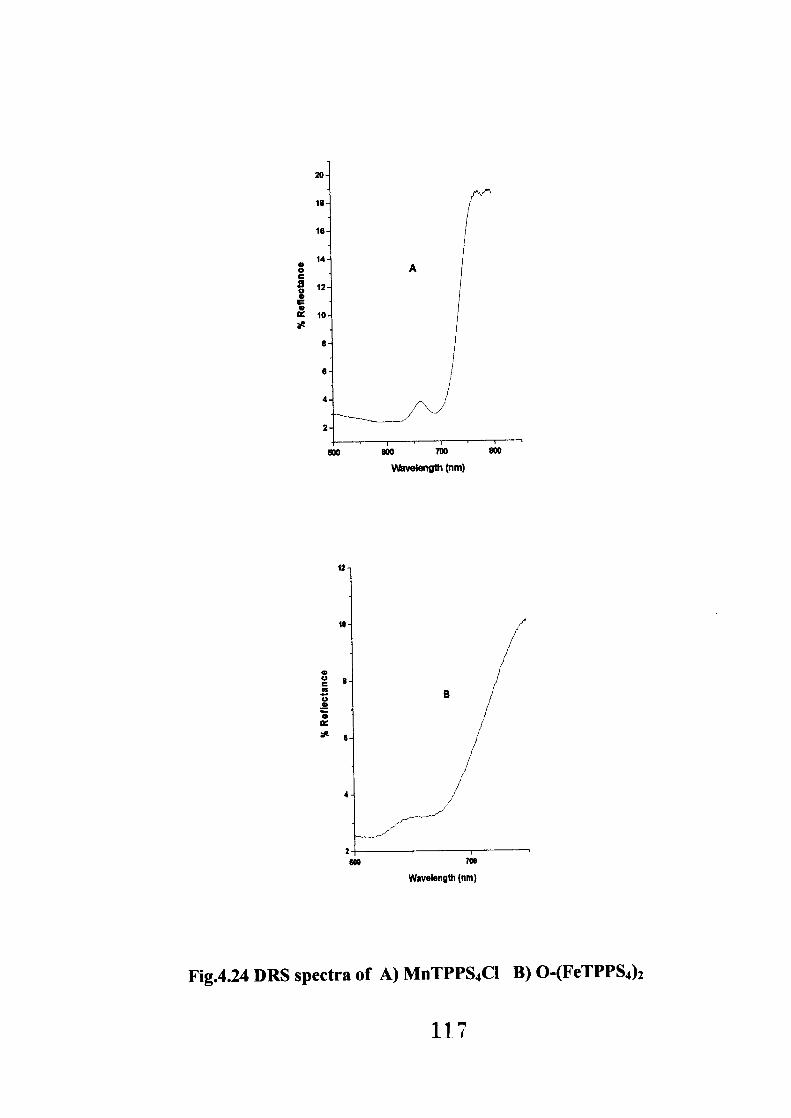
In the series of aqueous-porphyrins, it is seen that NiTPPS4 shows E g = 1.83 eV and
TPPS4 shows Eg = 1.66 eV, which are maximum and minimum for the selected series.
The other porphyrins show the Eg values in between these two extremes. The DRS curves
of TPPS4, AgTPPS4, MnTPPS4C1 and dimer 0-(FeTPPS4) 2 are shown in Fig. 4.23 and
4.24 respectively. The values of all compounds were calculated using above mentioned
formula and are summarized in Table 4.15
From the Eg values of non-aqueous and aqueous porphyrins, it is revealed that, these
compounds are narrow-band intrinsic semiconductors where E g < 2 eV. This makes them
efficient photocatalysts in the process of degradation of different dyes in the course of
photocatalysis.
1 L.