chapter 4 studying gold gravity circuits - Biblioth¨que et Archives
128
INFORMATION TO USERS This manuscript has been reproduced from the rnicmfilrn master. UMI films the texf di-y frwn the origirral or copy submitted. Thus, some thesis and dissertation copies are in typenniter face, mile othen may be f m any type of cornputer printer. The quality of mis mproduction is dependent uporr the qwlw of the copy submitted. Broken or mdistinct print. cdod or pow quality ilustrationj and photographs, print bhdthrough, substandard marghs, and improper alignment can adversely affect rieproducth. In the unlikely event that the author did not send UMI a complete manuscript and there are missing pages, these will be noted. Ako, if unauthorized copyright material had to be removed, a note will indide the deletion. Oversize materials (e.g., maps, drawings, cham) are reproduced by sectiming the original, beginning at the upper left-hsnd amer and d n u i n g frorn left to nght in equal sediorrs with small werlaps. Photographs induded in the original manuscript have been reproduoed xerographically in this -y. Higher quality 6' x W Mack and white photographie prints are availabk for any photographs or illustratims amring in this -y for an additional charge. Contact UMI diredly to order. Bell 8 Howiell Infomiation and Learning 300 Nom Zeeb Road, Ann Arbor, MI 48106-1346 USA 0ûG521-0600
Transcript of chapter 4 studying gold gravity circuits - Biblioth¨que et Archives

INFORMATION TO USERS
This manuscript has been reproduced from the rnicmfilrn master. UMI films
the texf di-y frwn the origirral or copy submitted. Thus, some thesis and
dissertation copies are in typenniter face, mile othen may be f m any type of cornputer printer.
The quality of mis mproduction is dependent uporr the qwlw of the
copy submitted. Broken or mdistinct print. c d o d or pow quality ilustrationj
and photographs, print bhdthrough, substandard marghs, and improper
alignment can adversely affect rieproducth.
In the unlikely event that the author did not send UMI a complete manuscript
and there are missing pages, these will be noted. Ako, if unauthorized
copyright material had to be removed, a note will indide the deletion.
Oversize materials (e.g., maps, drawings, cham) are reproduced by
sectiming the original, beginning at the upper left-hsnd amer and d n u i n g
frorn left to nght in equal sediorrs with small werlaps.
Photographs induded in the original manuscript have been reproduœd
xerographically in this -y. Higher quality 6' x W Mack and white
photographie prints are availabk for any photographs or illustratims a m r i n g
in this -y for an additional charge. Contact UMI diredly to order.
Bell 8 Howiell Infomiation and Learning 300 Nom Zeeb Road, Ann Arbor, MI 48106-1346 USA
0ûG521-0600


RECOVERING GOLD FROM HIGH DENSITY GANGUES
VVITH KNELSON CONCENTRATORS
Department of W n g and Metallurgical Engineering McGili University Montreal, Canada
A thesis submitted to the Faculty of Graduate Studies and Research in partial filnlment of the requirements for the degree of Masta of Engineering
OBo Zhang, 1998

National Library 1*1 of Canada Bibliothèque nationale du Canada
Acquisitions and Acquisitions et Bibliographie Services services bibliographiques 395 Wellington Street 395. rue Wellington OttawaON KlAON4 OciawaON K 1 A W Canada Canada
The author has granted a non- exclusive licence allowing the National L i b r q of Canada to reproduce, loan, distribute or sell copies of this thesis in microfom, paper or electronic formats.
L'auteur a accordé une Licence non exclusive permettant à la Bibliothèque nationale du Canada de reproduire, prêter, distribuer ou vendre des copies de cette thèse sous la forme de microfiche/film. de reproduction sur papier ou sur format électronique.
The author retains ownership of the L'auteur conserve la propriété du copyright in this thesis. Neither the droit d'auteur qui protège cette thèse. thesis nor substantial extracts fkom it Ni la thèse ni des extraits substantiels may be printed or otherwise de celle-ci ne doivent être imprimés reproduced without the author' s ou autrement reproduits sans son permission. autorisation.

ABSTRACT
This research d m the use of a 7.6 cm labontory Knelron Concentrator (LKC)
to determine the u ~ l m t of gravity recoverable gold (GRG) content in ores and evaluate the
pedormance of gravïty circuits, with an emphasis on high gangue dmsity. Two approaches
were used to Mnimize the effêct of the hi& gangue density in estirnating the GRG content,
oversize removal and 2 : 1 ratio dilution with silica flour.
The amoMt of GRG was dacmPKd in fair ore mes with an established protocol,
yielding values of 35% to 78% of total gold. Lower density aurian silver (kustelite) and high
density pyrite gangue lower the amount of GRG in Aufs Louvicoun ore, 29 - 3 9 6 , mostly
below 300 pm. Gangue dcnsity is somcwhat lower at Agnico-Eagle La Ronde Division
(AELRD), about SV/. miphide, and its GRG content is SC%, dso mostly below 300 m. The
ore of Snip contains more GRG, 58 - 61%, of ody siightly coarser size, but in a lower density
gangue. B h c k Gold's East Malartic contains very coarse gola and as a result the GRG
content cannot be detamùied accurateiy. Its stands in the range of 6û to 75%. East Malartic
has a gangue density similar to AELRD's.
Kustelite and the high dauity gangue at Louvicoun explain the very poor
performance of gravity recovay, only 1.8% otage recavery and 4.2% totai recovery.
Overload of the Plant Knelson Concentrator (PKC) was detected at AELRD and fiequent
concentrate rem04 was suggested. At East Malartic, only the table taiis were investigated,
and contained a very high amount of GRG, 91%. Table recovery was itself hi& above 95%.
This suggests thaî the high density of the ore and coarse PKC feed (screened at 1.7 mm) only
rnake it possible for the PKC to recover highiy recoverable GRG. Samples fiom the Chimo
gravity circuit were also proccsscd, but results were marred by very unreliable fire assays.
Nevertheless, it was concluded that the 76 cm PKC was very probably underfed, which
lirnited i ts ability to recover gold.
ResuIts fiorn the AELRD, Lowicoun and East Malartic mills suggest that the typid

Knelson-based gravity circuit which can r m r one haW to two thirds of GRG hoen b w
density gangues wilî ody recover one third to two mhs of the GRG fiom IQ@ ~cnucy
gangues. Simulation of gold recovery at AELRD showed that the high cirdating i. rh 'W
- 1 100%, were a signiticant factor in reducing gold recovery by gravity.

Ce projet pone sur l'utilisation d'un concentrateur Knelson de laboratoire (CKL) de
7.6 cm de diamètre pour déterminer la quantité d'or récupérable par gravimétrie (ORG)
present dans les minerais et évaluer la performance de circuits gravimétriques d'or. surtout
pour des minerais à gangue de densité élevée. Pour minimiser l'effet de la densité de gangue
élevée, on a utiIisé deux procédés, l'élimination des particules plus grossières et la dilution
avec de la farine de silice.
On a déterminé la quantité dfORG de quatre échantillons de minerais en utilisant un
protocole reconnu; ces échantillons contenaient de 35 à 78% dlORG. Dans le minerai
Louvicourt d1Aur. la densité moins élevée du minéral porteur d'or, la kustelite, et la densité
élevée de la gangue (sunout de la pyrite) limitent la quantité d'ORG a 29-3594. surtout au-
dessous de 300 Pm. La densité de la gangue est moins élevée pour le minerai de la division
La Ronde dlAgnico Eagle (DLRAE), qui contient 50°/o de pyrite, et qui contient 50% dlORG.
également en grande partie plus fin que 300 prn- Le minerai de Snip contient plus dlORG. 58-
6 1 %. légèrement plus grossier. et dans une gangue moins dense. Le minerai d ' ~ s t Malartic.
dont la densité de la gangue se rapproche de celle de DLRAE, contient de I'or très grossier,
ce qui rend très ardue la détermination de la quantité dlORG. qui de l'ordre de 60 à 75%.
A L O U ~ ~ C O U ~ , la présence de kustelite et la densité élevée de la gangue permettent
d'expliquer la récupération gravimétrique très basse, 1.8% de t'alimentation du Knelson et
4.2% de l'or total. A DLRAE. on a pu déterminer que le concentrateur Knelson d'usine
(CKU) était moins efficace en fin de cycle de récupération; nous avons recommandé d'en
raccourcir la durée. A Est Malartic. la récupération de la table à secousses est élevée, plus
de 95%. et le CKL récupère des rejets de cette table 91% de I'or présent. Ces deux
observations permettent de conclure que le CKU ne récupère que de I'ORG très facilement
récupérable. L'étude du circuit de Chimo a permis de conclure que le CKU de 76 cm était
probablement sous-alimenté. et pourrait récupérer plus d'or à taux d'alimentation plus élevé.

Les études de DLRAE, Louvicoua et Est Malartic suggèrent que le circuit de
rhpéraîion gravimétrique Knelson typique, qui permet de récupérer de 50 à 67% de I'ORG
de minerais à densité de gangue peu élevée, ne récupérera que du tien aux deux cinquièmes
de I'ORG d'un minerai dont la gangue est de densité élevée. A DLRAE, une simulation du
circuit de récupération gravimétrique a permis de conclure que la charge circulante, élevée
(700 - 1 100%) du circuit de broyage Sectait l'efficacité du circuit gravimétrique.

ACKNOWLEDGEMENTS
First of ail 1 would iikc to express rny sinartst gratitude and my dtcptst apprcciation
to rny supmisor Prof. Dr. A.R. Laplante for his wise guidance. thoughthil ad*. constant
encouragemnt and financial assistance throu@~ut tbc course of this rrseârch.
I ackmwkdge Rof. LA Finch, Z Xu d R Rao Cor th& suggestions and invaiuabk
discussions.
1 thank Mr. R Langlois, for both his technical expertise in tht hboratory and
fkiendship; my fcilow collcagucs and graduate students, Mr. L. Huang and Mr. J. Lin, for
their endless techriical diswsbns; Dr. M. Noaparast, h r bis hePIfuI advice on both laboratory
techniques and slide prcparation; Mr. A Farzancgan, for his suggestion to improve my
cornputer skin; J. Pavcnti, h r bis kip in sanpiing at Agnico-Eagk (La Ronde Division); and
aU the mineral processing group, for countkss discussions at group rri#tings a d seminars
and their fnendship.
I would like to extend rny apprcciation to thc pcopk of Cominco's Snip, Barrick
Gold's East Malartic. Aur's Louvicourt, a d Agnico-Eagit's La Rondc Division for thch
support and provision of gold suiples and h assaying servias. 1 sbaü aiways be thaaldul
to the Naturai Sciences and Engincering Rcsearch Council of Canada for the generous
research funding.
Findy. I am very grateful to my parents. F. Wu and P. Zhang. for k i r bvc a d
encouragemnt; to my bvcly fin-ycar old son, Mkhacl Liu. for his kind coopration during
my study and to my husôand. Dr. Qin@ Liu. for bis thought-provohg discussions. and
unfaüing suppon. encouragemnt and understanding.
vii
TABLE OF CONTENTS
ABSTRACI' ......................................................... i RESUME .......................................................... m
ZAIYAO ............................................................ v
ACKNOWLEDGEMENTS ............................................. vi
TABLEOFCONTENTS .............................................. vii
LISTOFFIGURES .................................................... x
LISTOFTABLES ................................................... xii
LIST OF ABBREVIATIONS . . . . . . . . . . . . . . . . . . . . . . . . . . . . . . . . . . . . . . . . . . rriii
LISTOFVARIABLES ............................................... xiv
CHAPTER 1 INTRODUCITON .................................................... 1 1.1 Background .................................................... 1 1.2 Objectives ...................................................... 3 1.3 StnicturtofthtTIitsis . . . . . . . . . . . . . . . . . . . . . . . . . . . . . . . . . . . . . . . . . . . . 4
C H r n R 2 LXTERATUREREVIEW .............................................. 5 2.1 Knelson Concentrator . . . . . . . . . . . . . . . . . . . . . . . . . . . . . . . . . . . . . . . . . . . . . 5 2.2 Applications of the 7.5 cm Knelson Conanmator . . . . . . . . . . . . . . . . . . . . . . . . 9
2.2.1 Measuring GRG in ore sanpks . . . . . . . . . . . . . . . . . . . . . . . . . . . . . . . . . 9 2.2.2 A Mcthodology for Studyiag Gravity Circuits . . . . . . . . . . . . . . . . . . . . 1 I 2.2.3 Redrting GRG Recovery . . . . . . . . . . . . . . . . . . . . . . . . . . . . . . . . . . . 12
2.3 Revious Sm&s of Gold Gtavity Circuits Mth LKC Methodology . . . . . . . . . . 15 2.3.1 Studyingcircuitswahabwdcasidygsnguc . . . . . . . . . . . . . . . . . . . . . . 15 2.3.2 S tudics of gnvity circuits with a high denaty gangue . . . . . . . . . . . . . . . 16 2.3.3 Upgriuhg of Rinnry Concentrates . . . . . . . . . . . . . . . . . . . . . . . . . . . . 16
CFiAPTER 3 CHARACTERIZING ORES FOR GRAVITY RECOVERABLE GOLD . . . . . . . 18
3-1 Introduction . . . . . . . . . . . . . . . . . . . . . . . . . . . . . . . . . . . . . . . . . . . . . . . . . . . 18 . . . . . . . . . . . . . . . . . . . . . . . . . . . . . . . . . . . . . . . . 3.2 Cominco's Snip Operations 18
. . . . . . . . . . . . . . . . . . . . . . . . . . . . . . . . . . . . . . . . . 3.2.1 Description of Snip 18 . . . . . . . . . . . . . . . . . . . . . . . . . . . . . . . . . . . . 3 .2.2 Materiab and expenments 20
. . . . . . . . . . . . . . . . . . . . . . . . . . . . . . . . . . . . . . . 3 .2 .3 Results and discussion 21 3.3 AurLouvicourt . . . . . . . . . . . . . . . . . . . . . . . . . . . . . . . . . . . . . . . . . . . . . . . . 28
. . . . . . . . . . . . . . . . . . . . . . . . . . . . . . . . . . . . . . . . . . . . . . . 3 .3. l Information 28 . . . . . . . . . . . . . . . . . . . . . . . . . . . . . . . . . . . . . . . 3 .3.2 Results and discussion 28
. . . . . . . . . . . . . . . . . . . . . . . . . . . . . . . . . . . . . . . . . . . . . . . . . . 3.4 EastMaiartic 3 0 . . . . . . . . . . . . . . . . . . . . . . . . . . . . . . . . . . . . . . . . . . . . . . . 3 .4 .1 Information 3 0
. . . . . . . . . . . . . . . . . . . . . . . . . . . . . . . . . . . . . . . 3 .4.2 Results and discussion 31 . . . . . . . . . . . . . . . . . . . . . . . . . . . . . . . . . . . 3 - 5 Agnico-Eagle La Ronde Division 33
3.5.1Introduction . . . . . . . . . . . . . . . . . . . . . . . . . . . . . . . . . . . . . . . . . . . . . . 33 . . . . . . . . . . . . . . . . . . . . . . . . . . . . . . . . . . . . . . . 3 S.2 Results and discussion 33
. . . . . . . . . . . . . . . . . . . . . . . . . . . . . . . . . . . . . . . . 3 -6 Discussion and conclusion 3 4
CEIAPTER 4 . . . . . . . . . . . . . . . . . . . . . . . . . . . . . . STUDYING GOLD GRAVITY CIRCUITS 36
4.1 Introduction . . . . . . . . . . . . . . . . . . . . . . . . . . . . . . . . . . . . . . . . . . . . . . . . . . . 36 . . . . . . . . . . . . . . . . . . . . . . . . . . . . . . . . . . . . . . . . . . . . 4.1.1 Gravity circuits 36
4.1.2 Objectives . . . . . . . . . . . . . . . . . . . . . . . . . . . . . . . . . . . . . . , . . . . . . . . 37 4.2 AurLouvicou rt . . . . . . . . . . . . . . . . . . . . . . . . . . . . . . . . . . . . . . . . . . . . . . . . . 37
4.2.1 introduction . . . . . . . . . . . . . . . . . . . . . . . . . . . . . . . . . . . . . . . . . . . . . . 37 . . . . . . . . . . . . . . . . . . . . . . . . . . . . . . . . . . . . . . . 4.2.2 Materials and method 3 8 . . . . . . . . . . . . . . . . . . . . . . . . . . . . . . . . . . . . . . 4.2.3 Results and discussion 39
. . . . . . . . . . . . . . . . . . . . . . . . . . . . . . . . . . . 4.3 Agnico-Eagle La Ronde Division 43 . . . . . . . . . . . . . . . . . . . . . . . . . . . . . . . . . . . . . . . . . . . . . . 4.3.1 Introduction 43
. . . . . . . . . . . . . . . . . . . . . . . . . . . . . . . . . . . . . . . . 4.3.2 Sampling procedure 43 . . . . . . . . . . . . . . . . . . . . . . . . . . . . . . . . . . . . . . 4.3.3 Results and discussion 44
. . . . . . . . . . . . . . . . . . . . . . . . . . . . . . . . . . . . . . . . . . . . . . 4.3.4 Conclusions 5 0 4.4 Barrick'sEstMalartic . . . . . . . . . . . . . . . . . . . . . . . . . . . . . . . . . . . . . . . . . . . . 51
. . . . . . . . . . . . . . . . . . . . . . . . . . . . . . . . . . . . . . . . . . . . . . 4.4.1 Introduction 51 . . . . . . . . . . . . . . . . . . . 4.4.2 Previous work on the 76 cm (30") CD Knelson 53
. . . . . . . . . . . . . . . . . . . . . . . . . . . . . . . . . . . . . . . 4.4.3 Materials and Method 53 . . . . . . . . . . . . . . . . . . . . . . . . . . . . . . . . . . . . . . 4.4.4 Results and discussion 54
. . . . . . . . . . . . . . . . . . . . . . . . . . . . . . . . . . . . . . . . . 4.5 Carnbior's Chimo Mine 57 . . . . . . . . . . . . . . . . . . . . . . . 4.5.1 Description of grinding and gravity circuit 57
. . . . . . . . . . . . . . . . 4.5.2 Sampling and processing with a laboratory Knelson 58 . . . . . . . . . . . . . . . . . . . . . . . . . . . . . . . . . . . . . . 4.5.3 Results and discussion 59

CHAITER 5 SIMULATION OF GOLD GRAVITY RECOVERY AT AELRD ............. 62
CHAPTER 6 ................................ CONCLUSIONS AND FUTURE WORK 69
6.1 Surrvllary and Conclusions ........................................ 69 6.1.1 Graviîy Rtcovcrabk Gold ................................... 69 6.1.2 PIantWo tL ............................................... 70 6.1.3 Recove~g gold from high gangue dnuity ores ................... 72
6.2 Recof~~ll~ndatio~~s ............................................... 72 ................................................... 6.3 Fut~rtWork 73
REFERENCES ..................................................... 74
APPENDLX A TEST RESULTS OF GRAVITY RECOVERABLE GOLD DETERMINATIONS ......................................... 1-1
Appendix A- 1 GRG tests of Snip2 Bail miil fkcd ........................... 1-2 Appcndix A-2 GRG tests of Aur Lmuvicourt2 ............................. 1-5 Appcndix A-3 GRG tests of Barrick East Malartic .......................... 1-8
APPENDIX B TESTS RESULTS OF THE G R A W W CIRCWIT INVESTIGATIONS ....... 2-1
Appendix B- 1 Aur Louvicourt ......................................... 2-2 Appendix B-2 Agnico-Eagk La R o d e Division ........................... 2-6 Appendix 8-3 Tablc tail at Barrkk East Mahrtic .......................... 2-11 Appendix B-4 Cambior's Chimo ....................................... 2- 14
APPENDIX C MASS BALANCE OF SIZE DISTRIBUTIONS AT THE GRAWI'Y CIRCUIT OF CHlMO MINE .......................... 3-1

LIST OF FIGURES
Figure 1 . 1 . Different routes for gold extraction . . . . . . . . . . . . . . . . . . . . . . . . . . . . . . 2
Figure 2- 1 A schematic diagram of the iaboratory Knelson Concentrator
with a conventional bowl . . . . . . . . . . . . . . . . . . . . . . . . . . . . . . . . . . . . . 6
Figure 2-2 The suppiy of fluidizing water . . . . . . . . . . . . . . . . . . . . . . . . . . . . . . . . . . 7
Figure 2-3 Schematic of a gold recovery circuit within a grinding circuit . . . . . . . . . 14
Figure 3 . 1 The flowsheet of Corninco's Snip gold operations . . . . . . . . . . . . . . . . . . 19
Figure 3-2 Procedure for measuring GRG content with a LKC . . . . . . . . . . . . . . . . 21
Figure 3-3 Cumulative passing as a fùnction of particle size for Snip2 . . . . . . . . . . . 22
Figure 3 3 Size-by-size recoveries for each stage for Snip2 . . . . . . . . . . . . . . . . . . . 23
Figure 3-5 Cumulative gold recoveries for each of the three stages for Snip2 . . . . . . 24
Figure 3-6 GRG content as a fùnction of F. O for Snip 1 and Snip2 . . . . . . . . . . . . . . . 24
Figure 3-7 Size-by-size cumulative recoveries for Snip 1 and Snip2 . . . . . . . . . . . . . 25
Figure 3-8 Cumulative gold recovery as a function of particle size for Hem102 . . . . . 26
Figure 3-9 Cornparison of the GRG content for both Hernlol and Hem102 . . . . . . . . 27
Figure 3- 10 Cumulative recovery for each of the three stages of Aur2 . . . . . . . . . . . . 29
Figure 3- 1 1 Cornparison of GRG between Aurl and Aur2 . . . . . . . . . . . . . . . . . . 30
Figure 3-12 Cumulative recovery for each of the three stages of Est Malartic . . . . . . . 32
Figure 3- 13 Cumulative gold recovery as a fûnction of particle size for AELRD . . . . 34
Figure 3- 14 Cornparison of the GRG in ores . . . . . . . . . . . . . . . . . . . . . . . . . . . . . . . 35
Figure 4 . 1 A general flowsheet of KC-based or jig-based gravity circuit . . . . . . . . . . 37
Figure 4-2 Size-by-size gold recovenes for PKC feeds of Aur Louvicourt . . . . . . . . . 39
Figilre 4-3 Size-by-size gold recovenes for PKC concentrates of Aur Louvicourt . . . 40

Figure 4-4 Size-by-ske gold recovenes for PKC tails of Aur L O U V ~ C O U ~ . . . . . . . . . . 40
Figure 4-5 Size-by-size head grades of the PKC tail sarnples of Aur Louvicourt . . . . 41
Figure 4-6 Sarnpling of Agnico-Eagle La Ronde Division . . . . . . . . . . . . . . . . . . . . . 44
Figure 4-7 Size-by-site gold recovenes of diluted and undiluted PKC feed of AELRD 47
Figure 4-8 Size-by-size gold recoveries of diluted and undiluted PKC tail of AELRD 47
Figure 4-9 GRG content of PKC feed and tails over a three-hour recovery cycle
0fAELR.D . . . . . . . . . . . . . . . . . . . . . . . . . . . . . . . . . . . . . . . . . . . . . . . 49
Figure 4-1 O Size distributions of PKC feed of AELRD . . . . . . . . . . . . . . . . . . . . . . . . 50
Figure 4-1 l Block flowsheet of Bamck's Est Mdartic . . . . . . . . . . . . . . . . . . . . . . . . 52
Figure 4-12 Size-by-sue gold rewvery of table tails of Barrick's Est Malartic . . . . . . . 55
Figure 4-13 Size distributions of the table tails of Bamck's Est Malartic . . . . . . . . . . . 56
Figure 4-14 A flowsheet ofthe grinding and gravity circuit of Chimo Mine . . . . . . . . . 57
Figure 4-1 5 Size distributions of PKC feed, tail and flash ceU tail of Chimo Mine . . . . 60
Figure 4-16 GRG content of PKC feed, tail and flash ceIl tail of Chimo Mine . . . . . . . 61
Figure 5- 1 Schematic of a gold gravity circuit (recovery fiom cyclone undedow) . . . 62
Figure 5-2 Selection fùnction vs . particle size . . . . . . . . . . . . . . . . . . . . . . . . . . . . . . . 64
Figure 5-3 Cumulative GRG size distribution of simulated and measured gravity stage
recovefy . . . . . . . . . . . . . . . . . . . . . . . . . . . . . . . . . . . . . . . . . . . . . . . . . 68
LIST OF TABLES
Table 3- 1 Processing conditions of LKC for GRG measurement for Aur2 . . . . . . . . . . 28
Table 3-2 Processing conditions of LKC for GRG measurement for East Malartic . . . 3 1
Table 3-3 Processing conditions of LKC for GRG measurement for AELRD . . . . . . . 33
Table 4- 1 Processing conditions and recovery of the LKC tests for Aur Louvicourt . . 38
. . . . . . . . . . . . . . . . . . . . . Table 4-2 Processing conditions of LKC tests for AELRD 44
. . . . . . . . . . . . . . . . . . . . . . . . . . . . . . . . . Table 4-3 The LKC test results for AELRD 45
Table 4-4 Table tails test results for Bamck East Malartic . . . . . . . . . . . . . . . . . . . . . 54
Table 4-5 Processing conditions with LKC for Chimo . . . . . . . . . . . . . . . . . . . . . . . . 58
Table 4-6 Overdl results of LKC tests for Chimo . . . . . . . . . . . . . . . . . . . . . . . . . . . . 59
Table 5-1 R, P. and GRG matrix F (% of the total gold in feed) and
. . . . . . . . . . . . . . . . . . . . . . . . . . . . . . . . . . main diagonal of C matrices .. 63
. . . . . . . . . . . . . . . . . . . . . . . . . . . . . . . . . . . . . . . . Table 5-2 Uncorrected H matrix 66
Table 5-3 Correction factors for the H matrix . . . . . . . . . . . . . . . . . . . . . . . . . . . . . . 66
Table 5-4 Measured and simulateci recovery . . . . . . . . . . . . . . . . . . . . . . . . . . . . . . . . 67
Table 6- 1 Recornmendations for gold plants . . . . . . . . . . - . . . . . . . . . . . . .. . . . . . . 73

LIST OF ABBREVIATIONS
AND ACRONYMS
adj. - adjustcd
AELRD - Agnico-Eagle La Ronde Division
CK>. Qc10m O/F - cy~b~lt ovafbw
C/U - Cyclone undcrflow
calc. - calculated
Conc. - Concentrate
Cyclone U2 - Cyclone UndCr flow2
Cyclone U1 - Cyclone under flowl
dis. - distribution
Dist'n - distribution of total gold
GRG - Gmvity rtcoverabk goki
KC - Knelson Concentrator
LKC - Laboratory K n e h n Conccntrator
mas. - masurcd
PCU - Plant cyclont undcrflow
PKC - Plant Knclson Conxntrator
Rec. - gold rccovcry
S.D. - Standard deviation
SAG dix. - SAG d discharge
Screen o/s - scrcen ovcrsize
Screen u/s - s m n undcrsizc
Wt. - weight
xiv
LIST OF VARIABLES
C - the classification efficiency curve of the cyclones for GRG
D - a column matrix of the free gold flowrate into the concentrate
F - a column matrix representing what arnount of gold of the ore reports as GRG in each
size class (in %, g/t or ozfst)
G, - PKC concentrate grade, g/t
G, - PKC feed grade, g/t
G, - fiesh feed grade, g/t
G, - PKC tails grade, g/t
H - a matrix representing the breakage of GRG into finer size classes
1 - identiS, matrix
LGRG - GRG loss, %
M, - the mass of PKC concentrate, kg
P - a diagonal matrix expressing the probability that free gold in size class i wiil be
pre-concentrated to be fed to the separator
Q, - PKC dry feed rate, t h
R - a diagonal matrix of fiee gold recovery in size class i
R - gold recovery, %
& - GRG content of feed
Rpc - PKC gold gravity recovery, %
R, - GRG content of tails
RT,, - total gold recovery, %
o - standard deviation
oZ - variance
Tc - PKC cycle time, hour

INTRODUCTION
1.1 Background
The draniatic Mc m tht pria of gold over the past twcnty y c v s bas b a n the driving
force of intense exploration and production activity ali over rhc world. This activity hps
resultcd not ody in the dcvclopmnt of many iiew conventional oie bodics, but also in the
deiineation and devebpmnt of more refiactory ores and the continuing seuch for
irnprovemnts in the cconomics of existing opcrations ct PL, 19911.
Rocesss for the cmrtion of gold have improved signikantiy over the yurs. Tbc
latest developmnts in goid poassmg tcchn010gy have not only focuscd on the econonrics
in temu of increased efncicncy a d duccd cosu but also on cnviromnmtal aspects,
partkukly with regard to gaseous eniissions and iiquid effiucnt discbargcs fiom gold pian&.
There is &O widc sprcad ïntmst in rcplacing cyanide by lixivhts which src nontoxic a d
O n the basis of mincraiogy, gold ores can be ckssined as two main types: non
re-ory (odes , ciay nirrrPls) d rchctmy (- carboasceous) [Haque, 19871. Tbe
various proass trcatiacnt options avaiiabk for goid proctssing arc ülustrated in Figun 1- 1.
Many refiactory goid ores do wt nspond very w e l to gravity separation and
conventional cyanidation. Such ores are characterizci by low gold recovcrks a d high
cyande consumptions when subjcacd to dircct cyanide Laching. These ores arc subjated
to oxidation pretreatrmnts such as roasting, cherrirai oxidation, pressure oxidation and bio-
oxidation prior to cyandation.

CHAPTER 1 INTRODUCTION
Gdd ores
0iad.titm Aibline Acid pmssum rcid krching pmssum Ierching
Ierching
F i g m 1-1. D i f f i t m t c a fw gold extmction
Non-rehctory ores have b a n econoniicany processeci by gravity, flotation. ami
conventional cyandation, or a combination thac of. More rccently, gold gtavity separation
has experienced a resurgence in popuiaritY, bec- of a numbcr of tcchnological innovations.
Of tks, the bison ~onccntrators'. snii-continuous ccnrrihigc uniis, arc c d y tk m s t
si&ntficant. These arc characterizcd by high goid recovcrks over a wide sizc range [Knclson,
1992; Laplante, 1993; Poulter, F i i u r i c t and Steward, 19941.
Knclsons have bctn uscd in gravity scparation in goki plants for over fifttcn ycars and
at laboratory scak for goûi ore and cimit evaluations for o m nine yws [Lapiante, Shu and
or the sake of brcvity. Kneiscm Concenartœs will in thir mcpograph be r e f d to as Knchau. KC a PKC for plant uniis and UCC for LPborrrtœy uaits.

CHAPTER 1 INTRODUCTION 3 -- - --
Marais. 1992; Liu. 19891. The Laboratory Rnelson Concentrator (LKC) mthodology
developed at McGïii University has been used for detcrtnining the m u n t of gravity
recovcrabk goid (GRG) in rclativdy hrgt sangks and evaluate thc performance of grâvity
circuits in goki piants [Liu. 1989; Lapiante a d Shu. 19921.
The efficiency of the LKC bas k e n systemticaily studied with both natura12 ami
syntheiic' fads, varying openting variables such as &cd rate, density. s i z distribution and
flwdizing wata pressure b p b n t t . Shu, Marois. 19%; Laplente. Huang d Han% 1996).
It was demonstrated that gangue density is the mst signific9nt vsriabk. High density gold
ores containhg massive sulphi& or tramp iron may also yicld a bwer gold r#x>vcry
with a PKC Aithough this is partiy o h t by the eftea of the high gold circulating bd, tbe
net effect m y weli be that di&rcnt design criteria mast k used to ~ f h k v e the spm
efkiency as that rcported for low dcnsity gangues. Aitcmatively, it m y pro= ntctssary to
lower projected gravity rccoverics.
1.2 Objectives
Previous saidics of gold gravity circuits at Mffiili have uscd and progrcssively
improved th LKC mthodobgy. 'b objectives of this woik arc to takc dvantage of &se
tools developed in house to:
(1). determine the GRG content m a kw seLmd ores, nost of which have a high density.
(2). evaluate existing gravity cirnihs. nmi of whkh pnxxss ores with a high dcnsity gangue;
(3). apply and evaluate proposed hprovemats of tbc LKC mthodobgy for high de*
gangues;
(4). investigate funher the e&ct of high dcnsity gangues using a gravity circuit simuhtor
developed at McGiU

CXAPTER 1 INTRODUCTION 4
1.3 Structure of the Thesis After this introduction, the use of tbe LKC to masure GRG m ores and study gokî
gravity circuits arin be rcviewed in Chapter two. A set of ORO tests on s~mpks from Snip,
Aur's Louvicourt, Barrkk GoWs East Mahrtic and Agnko-Eaglt's La Rondt Division
(AELRD) win be in Chapîcr thru. Chapta four wîil focus on the sndy of gravity
circuits at huvicoiirt, AELRD, East Mahrtic, and Carnbiof s Chimo Mine. In Chapter üve,
simulation of the graviîy circuit at AELRD wiü bc ptcscnted and discusscd. Fmany,
conclusions, recomricndations and future work will bc &SCfibCd in Chaptcr SU

LITERATURE REVIEW
2.1 Knelson Concentrator
Knelson Concentrators Inc. started its business in 1980. Knelsons can be used in
concentrating a very dense and very low grade phase or mineral from its gangue. The
Knelson Concentrator has k e n successfully used in gold recovery from vanous ore types,
from both placers and hard rock sources weison, 1988, and 1992; Laplante, Shu and
Marois, 1996; Luis, Me- willy Hartmann and Carios, 1994; Hendriks and Chevalier,
1995; and Cloutt, 19951. It has achieved worldwide acceptance, because of its remarkable
ability to achieve very hi$ gold recoveries over a wide size range. lts mechanical and
operational simplicity and reliability also contribute significantly to its success.
The 7.5 cm unit, or LKC, was commercialized in 1988 and rapidly became a
valuable laboratory tool for evaluating the performance of gravity circuits in gold plants and
measuring the amount of gravity recoverable gold (GRG) in ores.
A schematic diagram of the LKC with a conventional bowl is s h o w in Figure 2-1.
It uses a ringed bowl, called imer bowl, rotating clockwise in a pressurized water jacket.
Within each ring there are holes through which high pressure water is injected tangentially
from the outside of the inner bowl. Fluidization of the slurried feed takes place at the
surface of each ring in which a gold concentrate bed graduaily builds up.
Theoretically, the LKC achieves a centrifuge force sixty times that of gravity - Le.
60Gs. In practice, the number of "Gs" varies from the high forties at the bottom ring to the
Iow seventies at the top. The feed (minerals with slurrying water) is added via a downcomer
to the bottom of the inner bowl. The minerals are immediately imparted a high rotating
speed. This velocity creates a significant centrifuge force which maximizes interaction -
5

CHAPTER 2 LITERATURE REVIEW 6
bctwctn partich. Thc mst s i g i f b n t phenornenon is the percoktion of tbc fjncr partich
through the flowing slurry. This phenonmon is Pided by tk dispcrsive pressure crcated by
the shear rates gcncracd by tbc highly turbuknt fbw insidt the Iuielson.
The low density gangue particlcs arc rcpcted by thc fluîdhtion watcr and flow of
slurry on the surface of tk nnles to the top of thc b w L The rem are then cokctcd in a
circular launder and dischar@ The unit is periodically stoppcd and the concentrate
manually recoverd (the process is automtcd in the production SC& "CD" &).
Figum 2-1 A sdienaatic diagram of the IriborPtary Knelson Concentratoc
with a c o n v e n t i d bowl
It has ken suggcsted that tk fkai s l q nmr attairis the sam spctd as the bowL
If it did, it would be stagnant - ie. scparation would not happcn at all [Knclson, 19881. In
the KC, the compaction of the concentrathg bcd is avoidtd by tangentid injection of hi@
pressure auidized watcr, as illustrateci by Figure 2-2.
The water assists in kceping panicks shifting within tbc active concentrate bed: as

CHAPTER 2 LITERATURE REVlEW
long as this action takes place, so does concentration of dense particles such as gold.
Figure 2-2 The suppiy of fluidizing wrtcr
(A) Cross-sectional view (B) Top view of the Cour&b ring
Knelson claimed that this action takes place in most of the ~g melson, 19881.
Detailed photographic studies of the concentrate of individual rings suggest otherwise
@mg, 19961. Huang's test work was performed at very high feed grade, 5% hingsten (used
as a surrogate for gold). At the optimum fluidized water flow rate, concentrate within each
ring was almost completely unûuidized (very small fluidized channels were observed at the
water injection points). The concentrate of heavies laid at the surface of the rings (inner
section, closest to the rotation axis) rather than at their bottom (outer section, closest to the
wali of the bowl). Thus the role of fluidization water must be re-defined more accurately:
clearly, it does not completely 0uidize the rings, nor does it fiuidize the flowing slumng (this
is achieved by the rather turbulent upward flow of material). Fluidization water is most
important in the cntical zone between the non-fluidized portion of each ring (nearly al1 of its
volume) and the flowing slurry. This active recovery zone must accommodate incremental
concentrate, whilst rejecting fine light particles (that would easily percolate) and protecting

CHAPTER 2 LITERATURE REVIEW
the accumulated concentrate from erosion by coarse or/and dense particles. Huang showed
that for -31 2 pm feeds, bed erosion problems were negligible. For a dense and coarse feed, - 1.7 mm hematite, fluidization water could not protect the bed effectively, whereas, for coarse
light gangue (-1 -7 mm silica), this protection was effective for part of the loading cycle tested
(long enough for very long recovery cycles with actual gold ores).
From a separation point, Knelson [1988] suggested that the fluidized particulate bed
rnight make a small gold particle replace a large gangue mineral which has a lower density
than that of gold. Huang found no evidence for this replacement. He rather proposed a
mode1 of concentrate build-up until it becomes too exposed to the flowing slurry, at which
point erosion begins [Huang, 19961. Larger gold particles, which have a high percolation
velocity, are ofien concentrated in the bottom rings. Finer gold particles are harder to
concentrate and are ofien recovered further up the rings.
At low feed rate and gangue density, it has been reported that GRG recovery is
virtually independent of particle size [Liu, 1 989; Laplante and Shu, 1 993; Vincent, 19961.
Nevertheless, sorne studie~ with synthetic and natural feeds with LKCs and PKCs suggest that
the unit's ability to recover GRG may have a size dependency. This has been venfied with
both the 7.6 and 76 cm Knelson [Laplante, Shu and Marois, 1996; Laplante, Vincent,
Noaparast and Woodcwk, 19951. Increasing gangue density or feed rate can lower fine GRG
recovery, because of its lower percolation vetoçity and high wlnerability to erosion from the
concentrate bed [Laplante, Shu and Marois, 1996; Laplante, Huang and Hams, 19961.
A dip in recovery at intermediate particle sizes was also reported both for natural and
s-ynthetic feeds [Laplante, Shu and Marois, 1996; Laplante et al, 19951. The original
hypthesis for this phenomenon was linked to the flakiness of this material, but non-flaky
synthetic feeds have reproduced the phenomenon kin, 19951, which refutes the flakiness
theo- and suggests a percolation problem which is consistent with known percolation studies

CHAPTER 2 LITERATURE REVIEW 9
[Bridgwatcr and Ingrans 1971; Bridgwatcr. Sharpc and Stocker, 1969; Masliyah and
Bridgwatcr, 19741. As the coarsest tungstcn or gold particks can dispbce gangue of
equivalent partkk s k , a d exhibit o very hi& xecovcry. prn>htion pro blam only a f k t
rccovery at intcnricdiate Sue.
2.2 Applications of tbe 7.5 cm Knelson Concentrator Tk Kntbn is capabk of rcwYQing f h r gold than can be rccovaed by oLkr gravi@
umts such as jigs, s p b k and shiices mkcm, 1 W . Laphte. 19931. Wiih the advent of tk
phnt Kncison Coirennitor (PKC), industriai gravity circuits werc rtdcfintd in tanrc of how
fine gold could bc rccovcrcd. Tbus arose tbc b#d to dtvclop hboratory tools of at kast
simüar capabiiy to recover fme GRG. in order to charactcrize ores and plant performance
adequately. Putz (1994) and Vincent (1996) discusscd the ratio- of using the LKC to
evaluate circuit pcrformma and dctcnriint if it is ore. quipmnt or flowshcct liniitcd.
Typicaiiy. tk LKC is uscd as an butrumut to masure the GRG content of sarrpks 5 to 50
kg in si=. Ahhough this mthodology is, strictly spcakhg. applied only to mincral sanpks,
it c m also bt uscd to study gravity circuits, whcn applicd to sampks of ftcd, tails and
concentrates fkom these circuits.
2.2.1 M d n g GRG in om s n p b
The GRG content rcprescnt5 GRG tbat can bc rccovercd fiom an ore by gravity m a
very snian yicU urdcr kltal conditions [taphnie, 19961. Th amount of GRG in an ore is the
rnost important factor in determinkg its potcntial for gravity recovcry. Most of the GRG is
iiberated gold in the s k range of 10 to lûûû pm GRG m y atso be goki not conplnely
liberated from its gangue niimplr which reports hto tbe concentrate bcd of Kaeison.
However. studics on tabk tUls by Huang suggcst that link GRG fits this cakgory. F i
liberated goki, espccially bclow 25 may not bt gram rccoverabk [Woodcock, 19943.
Hung used SEM sndies to de- that ohnost aii of tk non-GRG gold in table taiis was

CHAPTER 2 LITERATURE REVIEW 10
indeed liberated below 25 Pm. Therefore, it rnay be concluded that the GRG content is
mostly liberated gold and some coarse incompletely liberated gold with rninor amounts of
gangue minerais.
C o n s i d e ~ g the sarnpling error, Woodcock found that the biggest problem in
Iaboratory test work aimed at measuring GRG content is the nugget effect in sampling and
assaying, whilst naîural gold traps in pilot grinding and gravity circuits constitute another bias.
The nugget effect is a result of the low concentration of the valuable matenal coupled with
the small number of particles that make up this concentration, thereby making it difficult to
obtain a representative sarnple. If ail the" nuggets" were to report to a concentrate to be hlly
assayed, then the nugget effect would not exist. This concentration is what the LKC-bas&
methodology airns to achieve.
The procedure to characterize GRG in an ore sarnple consists of a the-step recovery,
each successive step with the tails of the previous one at a liner grind. The first step is
normaliy performed on a representative 40-60 kg sample at 1000/o -850 prn (20 mesh), the
second on 24 kg at 50% -75 pm (200 mesh), and the third on 21 kg at 80% -75 pm (200
mesh). The concentrate of each stage is fùlly assayed size-by-size (as is part of the tails),
hence the claim that the nugget effect is eliminated [Woodcock, 1994; Laplante, Vincent and
Luinstra, 1 9961.
Industrial applications
Woodcock [1994] has tested nine ores and one grinding circuit, Les Mines Casa
Berardi. The fiil1 Casa Berardi grinding circuit was adjusted to fit mass balance constraints;
only minor adjustments were made to sized data. The ore contained 72% GRG, of which
88% was finer than 74 pm. Gold was fine and the coarsest was liberated below 300 Pm.
Woodcock also showed reasonable reproducibility for the GRG determination test, but with
limited data. More wili be presented in Chapter three.

CHA4PTER 2 LITERATIRE REVIEW 11
As for the characterization of GRG, to study gold gravity circuits, samples of the
relevant streams (typically the fresh feed and product of the grinding circuit, and feed, tails
and concentrate of recovery units) are extracted and their GRG content determined size-by-
size. Unlike the GRG test for ores, the samples are never ground, as the performance of
circuit units should be based on the GRG available in its feed, rather than "potential" GRG
that would be liberated by further grinding.
2.2-2 -4 methodology for studying gravity circuits
The study of gold gravity circuits also suffers frorn the statistical problem of
detemining the behaviour of particles occumng at a very low frequency. This problem
becomes particularly acute with increasing panicle size [Laplante, 1 992 3. For example, a
100 gold particle sample, which yields a 10% fundamental sampling error, would require, at
a grade of 15 dt Au, only 5 kg of 300425 pm (40/50 mesh) material, but 1000 kg of 850-
1200 pm (14120 mesh) fraction. A previous study concluded that gold content can be
determined with reasonable accuracy overall and size-by-size below 300 Pm when
- processing samples of 5 to 15 kg for most applications -plante and Shu, 19921.
Again, the LKC is used, for the reasons described in the previous section. The
application is more stringent in this case, as sarnples are processed only once: hence, it is
critical to insure that the LKC recovers al1 GRG.
There is evidence, however, that the LKC becomes less efficient as gangue density
increases [Laplante, Shu and Marois, 19961, or becomes too coarse [Pua, 19941. This
impiies that the LKC methodology, when applied to samples more refractory to gravity
recovery because of their gangue, must be refined: suitable feed preparation is required.
The first approach that was tested was to dilute high density samples with silica to
lower their gangue density. The dilution ratio used was originally 4:1, with 2 12 Pm silica.

CHAPTER 2 LITERATURE REVIEW 12
Subsequently, the dilution protocol was modified to use a 2: 1 ratio with -75 Fm silica (silica
flour). This approach always yields a lower density and finer gangue, and will be used for this
work. Shu (1993), Putz (1994) and Huang (1996) showed that feed dilution will increase
LKC recovery, especidy below 75 pm. Although dilution can rninimize the effect of high
density gangue at laboratory scale, it is unpractical at plant s d e .
A second size preparation method, the removal of oversize (ofien mostly barren) was
dso used. Woodcock [ 19941 achieved an increase of gold recovery fiom 48% to 64% with
removal of the +212 pm fractions on a plant cyclone undertlow (PCU) sample fkom Les
Mines Casa Berardi. Other benefits of oversize removal include a higher grade concentrate,
lower water consumption (iower fluidization water rquirements), easier secondary upgrading
and decreased circulating load Faplante et al, 19941.
It is concluded that with LKC methodology at laboratory scale, oversize removal is
the preferred method over dilution, which suffers the following drawbacks: (i) more rnass
must be processed, (j) sarnple grade is lowered - i.e. by a factor of 3 with a 2: 1 dilution ratio,
and (iii) natural information is lost (e.g. the sarnple size distribution). Thus, whenever
possible, oversize removal will be used to niaximize LKC recovery in this work. Dilution will
be used only when the size distribution of the original sample is too fine to benefit from
oversize removal .
2.2.3 Predicting GRG Recovtry
Behaviour of aold
Gotd, which has a hardness intermediate between that of lead and copper, should
display an intermediate behaviour in grinding units. The main characteristic of gold is its
malleability: gold is easily pounded into flaky shapes by grinding; these flakes can also fold
into spherical and cylindrical shapes panisi, Laplante and Marois, 19911. In laboratory
studies, gold has been f d to grind much slower than silica (used as a standard gangue), and
flattens, to the extent that it can move into coarser size classes. Evidence of foiding is not so
CHAPTER 2 LITERATURE REVIEW 13
readily generated, as transfen to finer size classes can also be caused by breakage, but this
phenornenon is supporteci by some photographie evidence panisi, Laplante and Marois,
19911 and a very large data base baxd of the grinding of lead (used as a surrogate for gold)
fNoaparast, 19961. At plant d e , gold gnnds more slowly than most ores: at Hemlo Golden
Gant, twenty times slower for the 850-1200 pm fiaction and six times slower at the 37-53
W. For typical circuits, more than 95% of the gravity recuverable gold that is ground to finer
size classes is still gravity recoverable moaparast and Laplante, 19931. In the absence of
gravity, fiee gold disappears siowiy fiom coarsa size classes through grinding, and reappears
in finer size classes.
Gold, particularly GRG, has a distinct behaviour in hydrocyclones, where it reports
to the underflow Stream even at very small sue. Often, as much as 98 and even 990h of the
GRG in a cyclone feed reports to its underfiow, even if most of this GRG is finer than 100
Fm panisi, Laplante and Marois, 199 1 j.
Predictina GRG
Conditions specific to an ore can be investigated with a model of GRG recovery
developed at McGill. This model makes it possible to estimate the performance of circuits
with large gold circulating loads and relatively low unit recoveries, or with high recoveries
on a bleed of the cùculating load Laplante, Woodcock and Noaparast, 19941.
The model represents gold liberation, breakage and classification behaviour and
applies pre-concentration and recovery performance curves to gravity-recoverable gold to
predict overall recovery.
For a circuit made of a single mil1 in closed circuit with recovery fiom the d l
discharge, the model is based on the block diagram s h o w in Figure 2-3. Size-by-size
recovery can be calculated as in equation 2- 1.
CHAPTER 2 LITERATIRE REVIEW
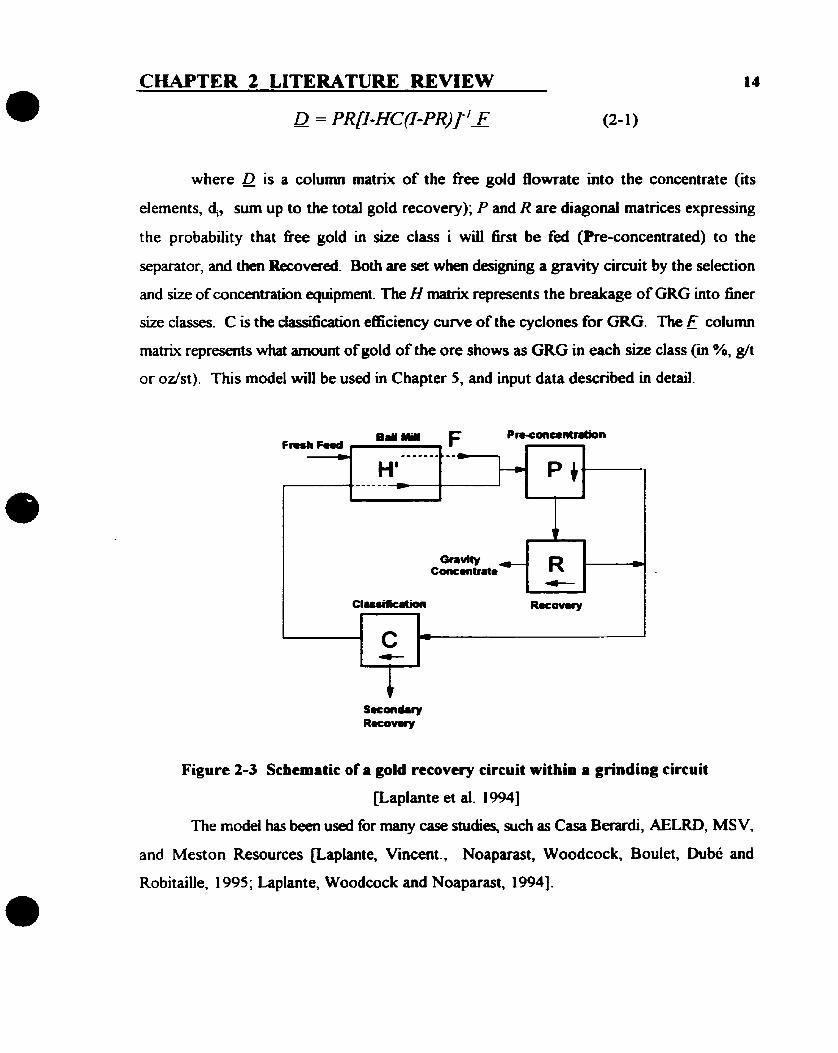
where Q is a column matrix of the fiee gold flowrate into the concentrate (its
elements, 4, sum up to the total gold recovery); P and R are diagonal matrices expressing
the probability that fiee gold in size class i will first be fed (Pre-concentrated) to the
separator, and then Recovered. Both are set when designing a gravity circuit by the selection
and size of concentration equipment. The H matrix represents the breakage of GRG into 6ner
size classes. C is the classification efficiency curve of the cyclones for GRG. The F column
matrix represents what arnount of gold of the ore shows as GRG in each size class (in %, g/t
or odst). This mode1 will be used in Chapter 5, and input data describeci in detail.
Figure 2-3 Schemrtic of a gold recovery circuit within a grinding circuit
kaplante et al. 19941
The mode1 has been used for rnany case studies, such as Casa Berardi, AELRD, MSV,
and Meston Resources kaplante, Vincent., Noaparast, Woodcock, Boulet, Dubé and
Robitaille, 1995; Laplante, Woodcock and Noaparast, 19941.
CHAPTER 2 LITERATURE REVIEW 1s
2.3 Previous Studies of Gold Gravity Circuits with the LKC Methodology
2.3.1 Studying circuits with a low density gangue
Moa studies performed at McGill have focused on low density gangue applications,
the more cornrnon and successfûl ones.
The data fiom Vincent's research work at Meston Resources, whose ore contains 3%
sdphide Woodcociq 19941, shows that 42Y0 of the total gold in the sarnple of plant Knelson
feed and 75% of the GRG was recovered. It is suggested that the 76 cm PKCs at Meston
recovered at least 50% of the GRG in their feed over the fiill size range tested [Vincent,
19971. Vincent reported that a 5 1 cm (20") Knelson at Aur's Aurbel miIl with a throughput
of 4-7 t/h yielded a GRG recovery between 70 and 93%, depending on throughput. At
Hemlo, a 76 cm PKC was reported to recover 20-25% GRG with a throughput of 60 t h
[Vincent, 19971.
The link between unit and circuit performance is gold's circulating load, which can be
very hi&. For instance, for an ore circulating load of 3OO%, the circulating load of gold c m
be as high as 2500% [Agar, 1993; Laplante, Liu and Cauchon, 19931. For a unit processing
the fùll cuculating 1 0 4 , a stage recovery of 2% would yield a circuit recovery of 50%. This
high "leverage" adds to the diiculty of rneasuring and predicting the performance of gravity
circuits.
The LKC methodology was also applied to jig circuits. For Placer-Dome's South
Porcupine mill, Putz reported a 40 - 50% GRG recovery with a circulating load of 2000%
btz , 19941, for four Duplex jigs in parailel. Unit recovery was around 2%. Jig concentrates
contained virtually no very fine (-37 pm) gold. Frorn detailed data at Corninco's Snip,
Vincent indicated that jig performance was strongly linked to particle size. Vinually al1 gold
recovered of the jig above 150 prn was unliberated and rejected by the table. Jig recovery
below 75 pm was poor and almost no gold was recovered below 25 pm [Vincent, 19971.

CHAPTER 2 LITERATUFtE REVIEW
Stage recovery varied between 2 and 4%.
2.3.2 Studits of gravity circuits with a high deiisity gangue
Refatively few studies of gold gravity circuits or units processing high density gangues
are available. Laboratory studies, however, indicate that high density gangues can reduce
both the recovery and capacity of the Knelson. Laplante, Shu and Marois report that for a
LKC treatïng a p r i m q cyclone underfiow sarnple fiom Hemlo Mines, recovery, R, is equai
to:
where D is the specific gravity of the gangue and Q the LKC d v feed rate in kg/min.
The equation suggests a significant drop of recovery as gangue specific gravity increases fiom
2.8 to 4.0 (the range tested) at high feed rates. Thus, recovery can be maintained only if
throughput is considerably decreased- Plant data support this, as reported by Putz for a flash
flotation concentrate at Lucien Betiveau (1993). A 76 cm PKC was able to match the
performance of the LKC, but only at a throughput of 1.5 th, considerably below the rated
capacity of the unit, 35 th. When the 76 cm unit was replaced by a 51 cm PKC, circuit
performance decreased significantly, even though the smaller unit is rated for 15 t/h, about
ten times its feed rate at the time of the study.
2.3.3 Upgrading of primary concentntes
Studies on primary gravity concentrates, which have a high density (even when
extracted 6om a low density gangue ore), constitute an important source of information for
the present work. Two types of studies have been performed at McGill university. First,
primary concentrates have been processed with oversize removal or silica dilution, both to
mimic eventual processing with a Knelson and to characterize the GRG content b t z , 19941.
Second, Huang has studied the scavenging of GRG fiom table tails wuang, 19961.

CHAPTER 2 LITERATURE REVIEW 17
Prirnary concentrates are normally tabled to smelting grade, 40 - 80% Au. An
alternative is to use a relatively small Kneison, such as a 1 9 or 30 cm unit, to perform the
same task or scavenge gold fiom table tails. Liu (1989) indicated that the 19 cm Knelson
previously used in the gold room at Meston Resources achieved about 90% recovery with
two stages. The rougher stage achieved a 74% gold recovery with an upgrading ratio of 9.7;
the scavenger stage achieved ody 16% goid recovery of total feed, and decreased the overall
upgrading ratio down to 5.9. The recovery of the 19 cm KC decreased wirh a increasing
particle size Piu, 19891.
Both Liu and Putz were capable of achieving very high recoveries, 89 - 95% when
processing PKC concentrates with a LKC. In the normal Knelson-based gravity circuit,
primary concentrates are normaiiy upgraded with shaking tables. Whereas PKCs can recover
fine and flaky gold effectively, tables can not, and their recovery suffers, especially below 2 12
Pm. Huang ( 1 996) used a LKC to recover GRG fiom the -2 12 pm 6action of seiected of
tails samples; recoveries of 60 - 9 1% were achieved.
In this work, both the methodology of Liu and Putz for the upgrading of primary
Knelson concentrates and Huang for the scavenging of table tails will be tested on high
density gangue samples.

CHAPTER 3
CHARACTERIZING ORES FOR GRAVITY RECOVERABLE GOLD
3.1 Introduction
In this chapter, the resubs of five GRG tests are presented. Of these, only the fun,
Snipî, was completed by the author. Others two, Aur2 and Est Malartic, were compieted
earlier, but never published. They are relevant to this work because of the high density of
their gangue and the plant work presented in the next chapter. Permission to publish these
results is gratefully acknowledged. Finally, the fourth, AELRD, was part of the first cluster
of tests (Woodcock, 1994), and is included because of the substantial test work presented in
chapter 4 and simulation presented in chanter five.
3.2 Cominco's Snip Operations
3.2-1 Description of Snip
Information
The Snip gold mine was located on the Iskut River, about 40 km upstream of its
confluence with the Stikine, and about 80 km east of the t o w of Wrangell, Alaska, USA.
At the time of sampling, the mine was operated by Cominco Metals Ltd., as a joint venture
between Cominco and Prime Resources Group Inc. The head grade of orebody was about
3 0 g/t wit h 8% sulphides. The overall gold average recovery was 9 1.6% in 199 1. About
3 5% of the total gold was recovered in a concentrate grading about 45% Au by gravity. The
balance was recovered into a flotation concentrate at an average grade of 300 g/t and a yield
of 5%. Mining and d l i n g throughput was 450 tpd in 1992. N o m s o n and Hodson, 19921.
FIuwsheet
As shown in Figure 3-1, the ore entenng the mil1 is cmshed to minus 7.6 cm (3 inch)
in a 6 1 x 91 cm (24" x 36") jaw crusha, foiiowed by secondary crushing to 100% minus 0.95
cm (318 inch) in a 130 cm (5 1 inch) shorthead cone crusher with a trommel screen in closed

CHAPTER 3 CHARACTERIZING ORES FOR GRAVITY RECOVERABLE GOLD 19
- - --
circuit. The ore is then ground in a 2.4 x 3.7 m (8' x 12') bal1 mill, whose discharge is passed
through a jig (double hutch Yuba-Richards). The concentrate of the jig goes to a
concentrahg table (Deister table with rubber sand deck) where coarse gold is extracted for
srnelting into bullion. The table ta& a gold-beazing sulphide, is retumed to the bal1 d. The
light htaction of the jig is classified by a 50.8 cm (20 inch) of prirnary cyclone. The pnmary
cyclone underflow is recycled to the bal1 mil1 and the overflow is classified in a secondary
cyclone in closed circuit with a second bal1 min (1 -5 x 1.2 m) to achieve a fineness about 80%
passing 75 prn (200 mesh). This product is treated in a bank of flotation cells to produce a
gold-bearing buk sulphide concentrate. This concentrate is pressure filtered and bagged for
sale (the concentrate is sent to a smelter in Japan). The flotation tailings go to a bacffill
circuit.
Figure 3-1 The flowshect of Cominco's Snip gold operations
CHAPTER 3 CHARACTERIZINC ORES FOR GRAVITY RECOWRABLE GOLD
~~~~~ - - --
3.2.2 Matends and expenments
A first GRG determination test ("Snip 1 ") was performed by Woodcock (1994). A
second test ("SNp2") was performed two years later in order to confirm the results of the first
test, as part of the present work.
A general description of the test procedure of GRG characterization is shown in
Figure 3-2. The sample was first dried, then crushed in a 25 cm (1 foot) Peacock cone
crusher in closed circuit with a 41 cm Sweeco 850 pxn (20 rnesh) screen. Crushing was
considered complete when less than I kg of material remained on the screen. This oversize
was then ground in a laboratory rod mil1 to pass 850 Pm.
The sample thus obtained, approximateiy 5 1 kg of Mnus 850 (20 mesh) material,
was processed with a LKC at a feed rate of 1 kg/min. A fluidizing water pressure of 2 1 kPa
(3 psi) was used. Dunng processing, six representative tail sampIes were collected at 7
minute intervals. At the end of the test, the bowl was removed and the concentrate was
washed out, filtered and dried. The bulk tail settled for 12 hours, and was decanted, filtered
and dried. From the dried buk tail, a lot of 24 kg was split for the second stage and the rest
was saved for fùrther studies.
The second stage feed was ground in three laboratory rod mills (Research Hardware
Model B- 1 O 18 x 23 cm stainiess steel) to 5 1% passing 75 Pm. The sample was then
processed with the LKC at a feed rate of 570 g h i n and 17 kPa (2.5 psi) of nuidking water
pressure. Six tails were cut during the test. Both concentrate and tails (the six cuts and bulk)
were processed using the procedure presented above.
For the third stage, al1 the bulk tail of the second stage was ground to 81% -75 pm,
and processed with the LKC at a fgd rate of 490 g/min and a 14 kPa (2 psi) fluidizing water
pressure. Incrementai tails samples and the concentrate were recovered.

CHAPTER 3 CHARACTERIZINC ORES FOR GRAVITY RECOVERABLE GOLD 21
For each stage, fiactions of six tails samples totalling 600 g were combined, then wet
screened at 25 p and dry screened h m 25 to 850 Pm. The fractions coarser than 1 05 Fm
were p u l v d . The LKC concmtrate, devoid of slimes, was dry screened directly. Finally,
al1 size fiactions for both concentrate and tails were analyzed for gold content at the Snip
assay laboratory.
Figure 3-2 Procedure for mcasuring GRG content with a LKC
3.2.3 Results and discussion
Caiculations
Stage recoveries were based on the concentrate and tail assays of each stage. The
overaii metallurgical balance was calculated fkom the concentrate assays of each stage and the
final tail assays of the last stage (the most reliable ones because of the fineness of the
matenal).

CHAPTER 3 CHARACTERIZINC; ORES FOR GRAVITY RECOVERABLE GOLD 22
Results and discussion
Figwe 3-3 shows the ske distribution of the feed to the three stages of the S ~ p 2 test.
The F,,s were 430, 170 pm and 75 Pm.
100 1000
Particle Size ( p rn)
Figure 3-3 Cumulative passing as a function of partide size for Snip2
Figure 3-4 shows gold recovery as a function of particle size for the three stages.
This diagram indicates that most gold in stage ï was recovered in the particle size range of
25 to 1 50 pm. The highest recoveries of the second stage were obtained between 25 to 1 05
~ m , those of the third stage below 75 vm. The highest recoveries siightly shifted toward to
the finer size from stages 1 to 3. Fine GRG which was locked in the first two stages was
liberated by funher grinding and recovered in the fast stage. Gold recovery was extremely
size dependent in stage 1 (on account of poor liberation in the couse sizes and poor LKC
performance below 25 pm), whereas it was vimially independent of particle size in stage
three.

CHAPTER 3 CHARACTERIZING ORES FOR GRAVITY RECOVERABLE GOLD 23
Figure 3-4 Sizoby-size recoveria for u c h stage for Snip2
The cumulative stage-by-stage recovery is shown in Figure 3-5. In stage 1, the
cumulative recovery was 22%, and increased by 20% in stage 2 to 42%. The overall GRG
content still increased in the last stage to a total of 57% (detailed information can be found
in Appendix A- 1). Only 2% of gold was coarser than 300 Pm; 42% of the total gold (74%
of the GRG) was finer than 105 p. Most of the GRG finer than 25 pm was recovered in
stage 3, 13%. compared to only 2% in stage 1.
The F,,s for each stage of the Snipl and SMp2 tests are shown in Figure 3-6. The
differences are siight, and should not introduce significant variations in the GRG content.

CHAPTER 3 CHARACTERIZING ORES FOR GRAWTY RECOVERABLE GOLD 24
- Stages 1 +2 -A- Stages 1 +2+3
Figure 3-5 Cumulative gold moveries for each of the thne stages Cor SnipZ
Figure 3-6 GRG content as a function of Fm for Snipl and Snipt

CHAPTER 3 CHARACTERIZINC ORES FOR GRAWTY RECOVERABLE GOLD 2s
Figure 3-7 compares the overall results of Snipl and SNp2. There was siightly more
GRG content in the first sample, 61% vs. 58%. It is quite apparent that the difference is in
the coarse sizes, as was observed for the two MSV, Chimo and Hemlo sarnples Laplante,
19961. The higher GRG content of SNp 1 could be due to its higher gold content, 45 g/t vs.
27 g/t. Another possible explanation is that afler the SNp 1 test, the procedure was modified,
using more feed mass to Mnimize the nsk of overestimating GRG content: compare the 5 1
kg used for stage 1 of SNp2 to the 16 kg used for SNp 1. This change would slightly decrease
the amount of GRG measured. Nevertheless, differences are so small that for al1 practical
purposes, test results can be considered identical. For samples taken more than two years
apart, this is a strong validation of the reproducibility of the test.
Figure 3-7 Siztby-size cumulative recovcries for Snipl aad Snip2
Compared with the Snip samples, Hernlo Gold's Golden Giant ore, whose GRG is
describeci in Figure 3-8 (the second test), shows a different behaviour. In the first stage, 47%

CHAPTER 3 CHARACTERIZINC ORES FOR GRGVITY RECOVERABLE GOLD 26
of gold was recovered, as was 2û% in the second stage and only 10% in the last. In the four
coarsest particle size classes, there was no apparent contribution fiom stages 2 and 3. About
90% of the total GRG was recovered in the first two stages, compareci with 72% for Snip2.
As discussed above, Hemlo's gold is coarser than Snip's, and liberates at a coarser grind.
Prirnary gravity recovery takes place in the first of two grinding loops at Hemlo, an approach
that yields acceptable results because of how easily GRG is liberated. The same approach
would nomialfy be unacceptable at Snip, whose GRG is liberated at a finer grind. Yet Figure
3- 1 shows that gfavity recovery does also take place in the first of two loops at Snip. It is
probably because very little grinding is achieved in the second loop (on account of the much
smaller bal1 rnill), that Snip still achieves satisfactory gravity recoveries.
J - -x- Stages 1 +2 -
*
- d
- - - -
100 lm
Figure 3-8 Cumulative gold recovcry as a Cunction of partide size for Htmlot
[Laplante et al., 19961
Figure 3-9 shows that a repeat test was also carried out at Hemlo's Golden Giant
(Hemiol and Hemlo2). The difference in GRG between the two samples is found at the
coarse end, above 425 Pm. The first Hemlo sample weighed only 8 kg, and contained very

CHAPTER 3 CHARACTERIZING ORES FOR GRAWTY RECOVERABLE GOLD 27
iittle coarse gold; the dinerence would probably have been smaller had the first simple been
of adequate size. Even H d o 2 is not fùly representative of the ore, where extremely coarse
gold (particles in excess of 1 cm in size) is occasionally encountered. Such very coarse gold
is statistically rare, and would require sarnple sizes of many tomes to be adequately
represented.
Since there is about 58% (SNp2) to 6 1% (Snipl) GRG content in the Snip gold ore
and most of the GRG is in the finer size classes where jigs are well known not to perform
well, a higher gravity recovery rnight be obtained by installing a centrifuga1 device, such as
a Knelson. A potential of 40 - 45% recovery by gravity at Snip has been suggested [Laplante,
19961. The projected increase in recovery is entirely in the fine range.
Figure 3-9 Cornpirison of the GRG content for both Hemlol and Hem102
[Laplante, 1 9961

CHAPTER 3 CHARACTERIZING ORES FOR GRAVITY RECOVERABLE GOLD t a
3.3 Aur Louvicourt (Aur2)
3.3.1 Information
The ore of Aur's Louvicourt contains 4.4% of Cu, 1.2% of Zn, 20% of Fe, 25 g/t of
Ag, and 1 -2 g/t of Au [Racme, 1 9951. Miil throughput was 1 75 th as of January 1 995. The
most abundant gangue minerals are pyrite, c halcopyrite and some sphalerite. The circulating
load of the grinding circuit also contains signiticant amounts of tramp iron (typical of SAG
circuits). Gold is present mostly as aurian silver, or kustelite [Gasparrini, 19931, which is
atypicai; kustelite, as Ag*, has a gold content of 45% Au, and a density of 13.5 g/cm3. At
Aur's Louvicourt, aurian gold has a gold content of 43% to 74% [Sinclair, 19951, which
makes it intermediate between electrum (or argentian gold) and kustelite, but closer to the
latter. The lower gold content yields a specific density of 13.1 to 15.8, which is lower than
that of electnim, and will hinder recovery, especially since gangue density is hg!!.
A first GRG test was performed in 1994 ( Aur 1 ), which yielded 28% GRG at a head
grade of 1.7 g/t. A second sample, Aur2, was analyzed in 1995, and will be the focus of this
discussion. It was processed under the conditions shown in Table 3-1. The tests followed
the procedure descnbed in section 3.1 -2.
Table 3-1 Processing conditions of LKC for GRG mersurement for Au12
II 1 Feed rate 1 Water pressure 1 Feed mass 1 Fieness 1 Feed grade
Stage 1
3.3.2 Results and discussion
Aur2 had 35% GRG with a fine GRG distribution, only 1 1% GRG coarser than 105
Pm ( 1 50 mesh). The recoveties from stages one to three were 1 1%. 16% and 1 1 %,
Stage 2
Stage 3
(p/min ) 1 kPa(psi)
, 14 (2)
500
340
(kg) 5 5 1130
(y0 ) (gt)
100% -850 prn 9.8 30 (4.4)
21 (3) 29
22
63% -75 pm
82% -75 pm
8.8
6-8

CHAPTER 3 CHARACTERIZINC ORES FOR GRAVITY RECOVERABLE COLD 29
respectively. The sire-by-size cumulative recoveries for each stage are illustrated in Figure
3- 10. The Aur2 sarnpie had a head grade of 9 g/t, much higher than that of Aurl, which was
more representative of the entire ore body. The test had been requested because it was felt
that the much higher head grade would yield much more GRG. Evidently this was not the
case.
Figure 3- I O shows that cumulative recovery increased significantiy fiom stages 1 to
2, especially below 105 Pm. The contribution of stage 3 to the GRG content was modest.
This rnight have been caused in part by the fineness of the feed in the second stage, 63%
minus 75 jm, as opposed the typical 50% (details are shown in Appendix A-2).
- Stage1 - Stages 1 +2 - Stages 1 +2+3
Figure 3-10 Cumulative recovery for erch of the three stages of Aur2
Figure 3-1 1 shows that the Aurl and Aur2 tests yielded similar results. Aur2
contained only slightly more GRG t h Aurl, 35% vs. 27%, despite the significant difference
in head grade, 9.3 (Aur2) vs. 1.7 g/t (Aur 1 ).

CHAPTER 3 CHARACTERIZING ORES FOR GRAVITY RECOVERABLE GOLD
- Aurl Au12
Particle size (pm)
Figure 3-11 Cornparison of GRG between Aurl and Aur2
3.4 East Malartic
3.4.1 Information
The East Malartic d l treats a massive sulphide coppedgold ore fiom the Bousquet
2 mine, to produce a gravity gold concentrate, a copper flotation concentrate and a gold
precipitate mope, McMullen, and Green, 19931. The current ore reserves total 9 million
tonnes at 7 g/t (0.2 O&) gold and 0.7 % Cu. Ore fiom the high grade massive sulphide core
has run over 2.5 % Cu and carried 1 oz/st of gold. Rimming of gold pahdes by fine mantles
of hematite, or other iron oxides, is common and may cause some metallurgical difficulties,
especidy for flotation. The major copper rninerals are chalcopyrite, bomite and tennantite.
A sample of rod miil discharge at East Malartic was sarnpled for GRG determination
at McGill, using the procedure described in section 3.1.2. Tests were performed at
conditions described in Table 3-2.

CK4PTER 3 CHARACTERIZING ORES FOR GRAVITY RECOVERABLE GOLD 31
Table 3-2 Processing conditions of LKC for GRG mcrsurcmcnt for East Malartic
3.4.2 Results and discussion
The test results indicate a GRG content of 78%, of which 43% was contained in one
0.43 g nugget. The 'nugget' effèct raises a problem of statistical reliability. With it, the grade
of the sarnple is 2 1 g/t, much higher than the typical head grade of the ore, 7 g/t mope and
McMuUen, 19931. ifthe nugget is disregarded, the remaining sample grades 13 g/t, more in
Iine with the average ore grade, and contains 61% GRG. The ore GRG content lies
çomewhere between 61 and 78% - i-e. very coarse gold is occasionally, but not systematically
encountered in the ckculating load WpIante, 1995; Hayek, 1995; vincent, 19961. The
presence of such coarse gold in the normal sample size used for the GRG test is only
occasional. This can be illustrated if it is assumed that 20% of the gold is present as very
coarse gold (particle mass: 0.4 g of pure gold), in an ore assaying 10 g/t (the average head
gmde at East Malartic at the tirne of sampling). This would correspond 5 nuggets per tonne,
or an average of 0.25 nugget per 50 kg sample (i.e. the mass normally used for the test). If
we assume a Poisson distribution, this corresponds roughly to four samples out of five
without any coarse gold, and the fifth one with a single nugget. Thus the presence of a very
Stage 1
Stage 2
coarse gold particle is the exception rather than the nile, and the actual GRG content of the
ore is probably much closer to 61% (obtained when excluding the large nugget). The test
data will now be presented without considering the nugget (details are shown in Appendix
A-3).
Feed rate
@/min) ,
940
3 20
Water pressure Feed mas Fineness Feed grade
(kg) -2 28 (4) 52 100% -850 pm 20
21 (3) 20 64% -75 pm 7
14 (2) Stage 3 330

CHAPTER 3 CHARACTERIZING ORES FOR GRAVITY RECOWRABLE GOLD 32
Stage recoveries were 29% for the first stage and 16% for both the second and the
last stage. As Figure 3-1 2 shows, about 87% of GRG was finer than 300 Pm. Therefore,
treating the fine fhctions becornes important. Primary cyclone underfiow samples (the PKC
feed) aiso contained GRG mostly below 300 pm Kaplante, 19951.
-StaBQel - stages i+2
Figure 3-12 Cumulative recovery for eacb OC the thrtt stages of Est Mdartic
The feed grades of each stage of the test were calculated to 12.5 g/t, 7.0 g/t and 5.9
g/t, respectively. Ideally. the tail grade of previous stage should be identical with that of the
feed in the foliowing stage. This is not the case for the tail of the first stage, 9.5 g/t, and the
calculateci head grade of the second, 7.0 gh. ïhis problem can be traced to some coarse gold
in the tails of cycle one: 25% of the gold is warser than 300 pm, which causes a smdl nugget
effect. This problem is less likely to arise with low gangue density ores, which generaily
contain less GRG in the first stage tails.

CHAPTER 3 CHARACTERIZINC ORES FOR G U V I T Y RECOVERABLE GOLD
3.5 Apico-Eagle La Ronde Division
3.5.1 Introduction
Woodcock (1992) characterized GRG in a sample of bal1 miii feed of Agnico-Eagle
La Ronde &sion (AELRD). The main characteristic of the ore is its high sulphide content
(50%). The sample was processed under the conditions s h o w in Table 3-3.
Table 3-3 Processing conditions of LKC for GRG measurement for AELRD
3.5.2 Results and discussion
The AELRD ore contains 50% of GRG with a head grade of 10 g/t woodcock,
1 9931. Figure 3- 13 shows that the stage recovenes were 10, 27, and 34%, respectively.
The mass used for the last two stages was much lower than what is now uses, 24 to 28 kg.
This rnight have yielded a slight positive bias in recovery.
Water pressure
kPa (psi)
Only 13% of the gold in the -25 p fiaction was recovered. This could be caused by
a synergistic effect of a low GRG content below 25 pm and the low Knelson recovery below
25 pm with a high density gangue. However, gold present in the other size fiactions was
recovered very weU. About 60% of the gold present is coarser than 25 Pm; thus, the use of
a gravity circuit to reduce the amount of gold reporting to the flotation circuit appears
feasible.
Feed mass
, (kg)
25
9
5
Stage 1
Stage 2
Stage 3
Fineness
(%)
1W!% -850 pm
45% -75 p
78% -75 pm
593
172
212
Feed grade
(g/t)
7.1
9.1
10.1
35 ( 5 )
28 (4)
14 (2)

CHAPTER 3 CHARACTERIZING ORES FOR GRAVITY RECOVERABLE GOLD
Figure 3-13 Cumulative gold recove y as i function of partide size for AELRD
The hi& gangue density has a negative impact on the o v d recovery since al1 gravity
concentration devices loose their effectiveness as gangue density increases murt, 19841.
Although the recovery is lower than most other gold ores amenable to gravity recovery,
normally 60 - 95% GRG Faplante, 19961, the gold that is recovered will not be subject to
losses in the subsequent flotation and cyanidation processes, and will benefit from a higher
econornic return than gold in the flotation concentrate.
3.6 Discussion and conclusion
Based on thirty-eight sarnples tested at McGill, Laplante (1996) reported that the
lowest GRG cantent was found to be 25% and the highest 94%. The average GRG content
was 63% with a standard deviation of 19%. This places the Est Malartic ore above-average
(if the nugget is included), Snip slightiy below-average, AELRD well below-average, but still

CHAPTER 3 CHARACTERIZING OFtES FOR GRAVITY RECOVERGBLE GOLD 35
treatable by gravity, and Aur Louvicourt in the group clearly refiactory to gravity recovery.
Figure 3-14 compares the GRG of the four ores tested to Hemlo's. AuR contains the
least GRG, and Hem102 the most, 73%. Al1 curves, with the exception of AELRD, are
roughly parailel, which suggests the relationship between gold particle sire and GRG content
which was reported by Laplante (1996).
--
- AELRO - Hedo2
Particle sire (pm)
Figure 3-14 Comprrison of the GRG in ores
A low GRG content can be related to (i) a low density for the gold-bearing species
(Le. kustelite, or aunan silver), (ii) massive sulphides yielding high density gangues, (iii) fine
gold or gold intimately associated with sulphides. Generally, the coarser the gold, the more
it is recovered in the first stage of the GRG test, such is the case for Hemlo2. When gold is
fine, the recovery of the first stage will be low (e.g. Snip), particularly with high density
gangues (Aur, AELRD).

CHAPTER 4
STUDYING GOLD GRAVITY CIRCUITS
4.1 Introduction
4.1. f Gravity circuits
Gravity separation not only assists gold recoveries of flotation and cyanidation, but
also decreases gold's circulating load. Ahead of flotation, increases of totai gold recovery
of 1 to 3% have been observeci at Meston Resources [Laplante, 19941. Without a gravity
circuit, gold builds up to considerable circuiating loads, such as 6700% in the prïmary
cyclone underflow of Golden Gant panisi, Laplante and Marois, 199 11 and 3700% in the
secondary cyclone underflow of AELRD [Buonvino, 19931. Gravity lowers the circulating
loads considerably, especially when efficient circuits are used. This is the case at Meston
Resources, whicb reported gold circulating loads of 500 - 600 % CLaplante, Shu and Marois,
1 9961.
in North America, the two units that dominate gold recovery in grinding and gravity
circuits for primary gravity recovery are the KC and the jig. A general flowsheet of KC-
based or jig-based gravity circuit is shown in Figure 4-1.
The SAG or rod mill and ball mill discharges feed the cyclone or cyclopak. Cyclone
overflows go to flotation or cyanidation. Most of the underflow is fed to the ball mil1 but a
bleed is processed by the gravity unit. Its concentrate is upgraded on a shaking table (e.g.
Gemeni, Wilfley, Deister) to a srneltable grade and the tails retum to the grinding circuit.
The tails of the gravity unit are combined with the ball mill discharge for m e r
classification. With jigs, an alternative is to treat the full ball mill discharge. With Knelsons,
the feed is ofien, if not always, screened at cut sizes of 600 to 1700 p. The KC has now
established itself as possibly the most logical choice for gold gravity recovery. Many plants,
such as Hemlo's Golden Giant, which once boasted a jig, are now ushg Koelsons; others are
contemplating the move. Vincent (1 997) details a cornparison of the two units. in this work,

CHAPTER 4 STUDYING GOLD GRAVITY CIRCUITS 37
o d y KC-based circuits will be investigated.
SAG or Rod mill &schrg. ( - - - - - - - - - - - - - - - - - - - - - - - - - - - - - - - - - - - - - - - - - - - - - - - - - - #
I : I I
Figure 4-1 A generat flowsbeet of KC-based or jig-based gravity circuit
(- : Knelson; - : j ig)
4.1.2 Objectives
The objectives of this chapter are:
(i). to evaluate the performance of plant units ushg the LKC methodology;
(ii). to extend the data base of plant Knelson performance; and
(iii). to recommend modifications to existing flow sheets to increase their
performance.
4.2 Aur Louvicourt
4.2.1 Introduction
The 76 cm CD Knelson used in Aur Resources's Louvicourt Project treated a bleed
of the circulating load screened at 1.7 mm (1 0 mesh) feed. Failure of the circuit to recover
significant gold led the Aur personnel to request McGill's assistance in assessing its

CHAPTER 4 STUDYING GOLD GRAVITY CIRCUITS 38
performance and recomrnerrding an appropriate course of action. Samples were extracteci by
Louvicoun personnel and sent to McGill for funher processing.
4.2.2 Materials and method
Samples of PKC feed (25 kg), concentrate (1 0 kg) and taiis (1 7 kg) were received
at McGill. Because of the low GRG content in the ore of Aur Louvicourt, the dilution
method was niled out, and fine screening was used to maximite LKC performance. Tests
were conducted on the three sarnples - Knelson feed, concentrate, and tail, &er oversize
removal at 850 pm (20 mesh) and 300 pm (50 mesh).
All the samples were screened at 850 Pm (20 mesh) with a Sweeco screen. The
oversize (+MO pm) was saved for tùrther work. The undersize (-850 pm) was split in half
the first was processed with a LKC; the second was screened at 300 Mm (50 mesh) and
processed with LKC. The unprocessed +3OO Mm was saved for fùrther studies. Tails, feed
and then concentrate were processed in order to minimize contamination problems. The LKC
concentrates and tails were processed as for previous tests (section 3 -2.2). The concentrates
and tails of LKC were uialyted for gold content-at the Bourlamaque assay laboratory. Table
4- 1 shows the LKC processing conditions and recovery.
Table 4-1 Processing conditions and recovery of the LKC tests for Aur Louvicourt
~ 1 Feed 1 Water 1 Feed 1 Top l
' Produa 1 rate 1 pressure 1 mass 1 sire
PKC
Feed PKC
Conc. PKC
Tails
(@min) kPa (psi) (kg) (W)
5 16 28(4) 17 850
460 2N3) 14 300
546 28(4) 6 850
430 21(3) 5 300
Feed
grade
(dt)
12
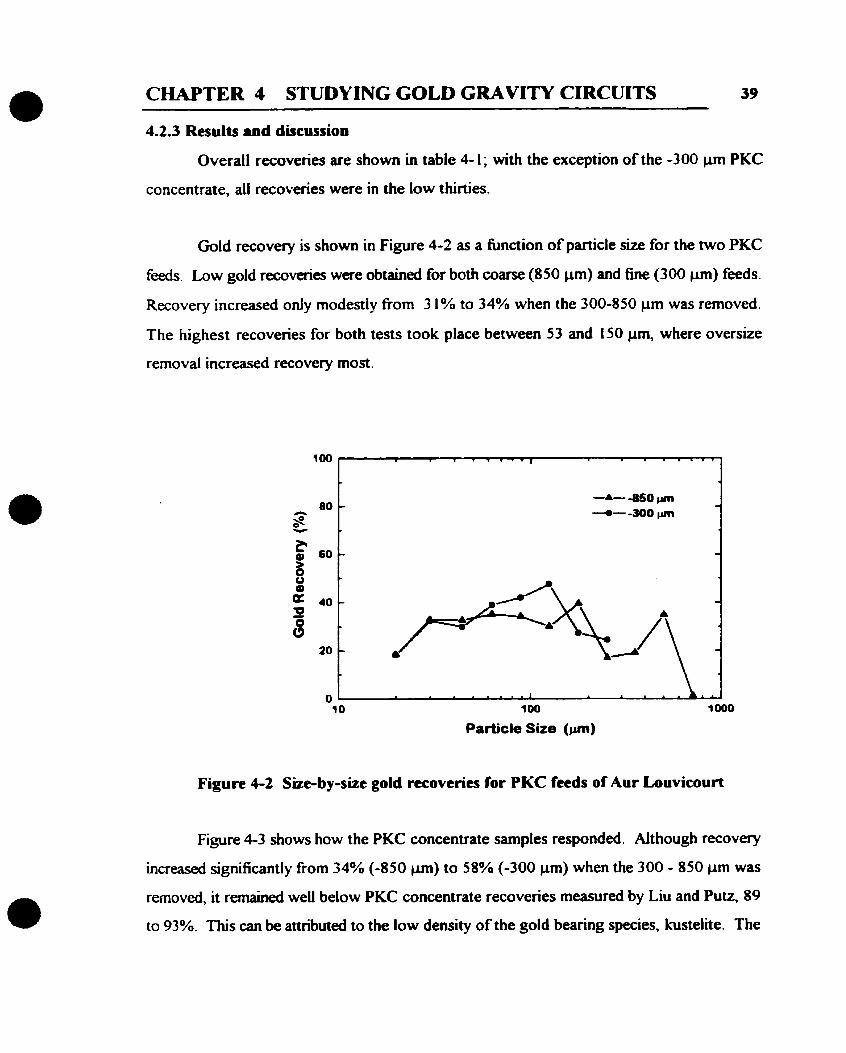
CHAPTER 4 STUDYING GOLD GRAVITY CIRCUITS 39 -- - - - -
4.2.3 Results and discussion
Overall recovenes are shown in table 4- 1; with the exception of the -300 pm PKC
concentrate, aii recoveries were in the low thirties.
Gold recovery is shown in Figure 4-2 as a function of pariicle size for the two PKC
feeds. Low gold recoveries wae obtained for both coarse (850 pm) and fine (300 pm) feeds.
Recovery increased only modestly fiorn 3 1% to 34% when the 300-850 pm was removed.
The highest recoveries for both tests took place between 53 and 150 pm, where oversize
removai increased recovery most.
100
Particle Size (pm)
Figure 4-2 Size-by-sue gold m o v c r i a for PKC ieeds of Aor Louvicourt
Figure 4-3 shows how the PKC concentrate sarnples responded. Although recovev
increased significantly from 34% (-850 pm) to 58% (-300 pm) when the 300 - 850 pm was
removed, it rernained well below PKC concentrate recoveries measured by Liu and Putz, 89
to 93%. This can be attributed to the low density of the goid bearing species, kustelite. The

CHAPTER 4 STUDYING GOLD GRAVITY CIRCUITS 40
hghest recoveries were measured between 53 and 2 12 pm, where oversize removal also had
the most beneficial effect.
100
Partich Size (pm)
Figure 4-3 Sbe-by-size gold recoveries for PKC concentrates o f A u r Louvicourt
Particle Size (pm)
Figure 4-4 Suoby-size gold recoveries for PKC tails of Aur Louvicourt

CHAPTER 4 STUDYING GOLD GRAVITY CIRCUITS 41
For the PKC tails (size-by-size recovery is shown in Figure 4-4), LKC recovery was
35% for the -850 prn and 34% for the -300 Pm. Recovery of the -850 pm test was higher
for the PKC tails, 35%, than the feed, 31%, because the mass processed by the LKC was
lower, 7.9 kg vs. 16.8 kg. Some of the gold captured by the LKC was eroded fiom the
concentrate bed, and this amount increased as more mass was treated [Huang, Laplante and
Harris, 19931. This would not be a significant factor for most ores, but it was amplified by
the high gangue density and low kustelite density of the Louvicoun ore. When the +300 pm
fiaction was removed, the recovery of the PKC feed and tails became identicai, 34%.
For the PKC tails -300 pm test, the size-by-size head assays below 75 Pm were
siaiificantly higher than those of the -850 pm, or those of the -850 and -300 Pm test for the
PKC feed (al1 these three data sets were in good agreement, as shown in Figure 4-5).
1
A -e- 300 p n Tai k
-+- 850 pm Feed
Particle sue (pm)
Figure 4-5 Sizeby-set head grades of the PKC tail samples of Aur Louvicourt
CHAPTER 4 STUDYING GOLD GRAWTY CIRCUITS 42
This cm be traced to the -300 pm LKC tails assays, which were very likely too hi&,
and artificially reduced the recovery of this test. This explains why the recovery of the test,
34%,was less than that of the -850 prn test, 35% (removing the 300 - 850 p m fraction should
increase recovery).
PKC performance can be calculated from the grade of its feed, concentrate and tails
( G , G,, and G, respectively 12.5, 1292 and 1 1.2 g/t), the mass of concentrate, M, (4 1 kg),
i ts dry feed rate, Q, (39 th) , and cycle tirne, Tc (6 hours). Using the feed and concentrate
grades:
Equation 4-2 yields. with the -850 pm data, a stage recovery for total gold of 1.8%.
Recovery based on fksh feed to the plant is calculated fiom the fresh feed grade, G,
( 1 .Z g/t Au), and fiesh feed rate, Q, (1 75 th):
Equation 4-3 yields, with the -850 pm data, a circuit recovery of 4.2% for total gold.
This is much lower than the GRG content of 27% of the Aur 1 sample'. Further gains
in recovery could be achieved with a h e r PKC feed, but even doubling recovery would result
in a iow overall recovery below 1%, with Linle econornic impact. Further. the poor recovery
of the PKC concentrate, even without the +300 pm fraction, indicates that hrther upgrading
I 'The Aur2 sample is unrepresentativc of thc hl1 ore body, as it onginated from one very lu& gradc stope

CHAPTER 4 STUDYING GOLD GRAVITY CIRCUITS 43
to smeltable grade (to maximk the gonomic impact of gravity recovery) would be extremel y
dificult.
Based on these results, discontinuing gravity recovery at Louvicourt was
rgomrnended. It shouid be emphasized that this was the result of a number of unfavourable
factors: the low gold grade of the ore, the high throughput of the miIl, the low and relatively
fine GRG content, and last but not least, the high density of the gangue and low density of
the gold-bearing mineral.
4.3 Agnico-Eagle La Ronde Division
4.3.1 Introduction
B a d on work perfiormed by Woodcock (1994), Laplante had suggested that a GRG
recovery in the low thirties was a reasonable objective (1994). However, typical performance
since the gravity circuits were implemented has been in the high teens, with an occasional
excursion in the low twenties. This warranted additional work. Sampling of the unit was
initiated to measure its efficiency. At the time of sampling, automatic flushing of the unit's
concentrate had not yet been implemented, and a recovery cycle of three hours was used.
One objective of the test work was t o evaluate the impact of this prolonged cycle on PKC
performance.
4.3.2 Sampiing procedurt
Samples of Knelson feed (cyclone undedow) and tails in the AELRD gold plant were
extracted by AELRD personnel over the three-hour recovery cycle, as shown in Figure 4-6,
during the summer of 1995. McGill received about 30 kg of dry cyclone undedow (as
Knelson feed) and Knelson tails ftom each hour of the recovery cycle. The six sarnples were
screened at 850 Mm; the -850 pm fiaction was split into two parts: one part (about 15 kg) was
used for direct processing with the LKC and the other one for a dilution test.
The dilution test was chosen because of the hi& density of the ore and the relatively
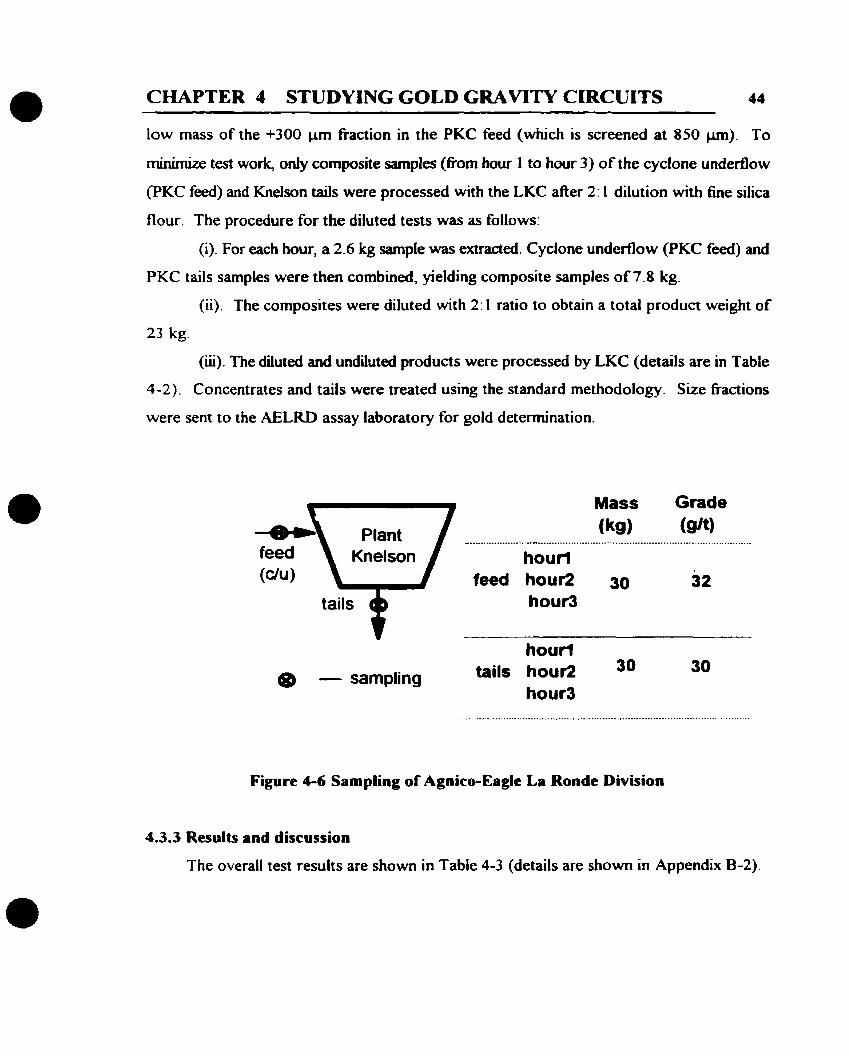
CHAPTER 4 STUDYING GOLD GMVITY CIRCUITS 44
low mass of the +300 Pm fiaction in the PKC feed (which is screened at 850 pm). To
mhhüze test work, oniy composite sarnples (fiom hour I to hour 3) of the cyclone underflow
@KC feed) and Knelson tails were processed with the LKC after 2: 1 dilution with fine silica
flour. The procedure for the diluted tests was as follows:
(i). For each hour, a 2.6 kg sarnple was extracted. Cyclone underfiow (PKC feed) and
PKC tails sarnples were then combined, yielding composite samples of 7.8 kg.
(ii). The composites were diluted with 2: 1 ratio to obtain a total product weight of
2 3 kg.
(ui). The diluted and undiluted products were processed by LKC (details are in Table
4-2). Concentrates and tails were treated using the standard methodology. Size fiactions
were sent to the AELRD assay laboratory for gold detennination.
- Mass Grade
Kneison hourl feed hour2 30 32
hourl
- sampling tails hout2 30 30 hour3
Figure 4-6 Sampling of Agnico-Eagle La Ronde Division
4.3.3 Results and discussion
The overall test results are shown in Table 4-3 (details are shown in Appendix B-2).

CHAPTER 4 STUDYING GOLD GRAVITY CIRCUITS 45
Table 4-2 Processing conditions o f LKC tests for AELRD
1 Cyclone ( hour 1
II Undertlow 1 hour 2 hour 3 11 (PKC feed) 1-
Dilution
I hour 1
II 1 hour 2
II tails I hour 3
Table 4-3 LKC test results for AELRD
~ a t e r 1 Sample
pressure I """' &Pa) (kg)
2 1 19
- -
Cydonc Undenlow ( Plant Knelson Feed)
hour 1 31.6 48.4 16.4
hour 2 33.6 51.8 16.4
hour 3 33.7 48.4 17.6
Average 32.9 49.5 16.8 . diluted 1 11.3 1 55.1 1 5.1
Plant Knelson Tails
hour 1 1 26.1 1 41.4 1 15.4
II hour 2 1 1 t
1 29.9 1 47.2 1 15.9
11 hour 3 1 1 1
1 32.9 1 5 1.4 1 16.1 II Average
1 1 1
1 29.6 1 46.7 1 15.8
I -
1 1 1
diluted 1 10.3 1 55.6 1 5.7
In the colurnn of overall grade for the PKC feed, no trend is detected except for a
small increase between the first and second hours. For the PKC tails, grades are lower and

CHAPTER 4 STZTDYING GOLD GRAVITY CIRCUITS - -
increase fiom 26 to 33 g/t. The difference between feed and tail. which is indicative of
recovery, decreases 6om 5.5 (hour 1) to 0.8 g/t (hour 3). This is a strong indication that PKC
performance detenorates signiticantl y as the recovery cycle progresses. The average
difference is 3.3 g/t. The same dserence for the diluted composite samples should be one-
third of this average since the dilution is a 2: 1 silica : ore. This is indeed the case, 1.0 g/t,
although the diluted grade in both cases is slightly superior to what it should be, but by only
0.3 - 0.4 g/t.
in the coiumn of LKC recovery, o r %GRG, there is a trend in the PKC tails data, as
the GRG content increases fiom hours 1 to 3 (4 1 -4 to 5 1.4%). For the feed, there is no such
trend, which indicates that the increase in GRG content in the plant Knelson tail is not due to
a change in mineralogy but to a drop in PKC performance as the recovery cycle progresses.
The diluted tests yield additional information, as they show how the density of the
gangue can affect Knelson performance, not only at lab but ako at plant scaie. As expected,
the relatively fine distribution of the € i d limits the negative impact of the suiphides, and lab
Knelson recovery increases only by 6%, fiom 49.5 to 55.1, with the cyclone underflow
samples. For the plant Knelson taiis, the increase is more important, 9% (from 46.7 to
5 5.6%), which can probably be explained by the more refiactory nature of this material to
gravity (since the PKC has recovered some of the GRG).
The effect of ditution on size-by-size gold recovenes for PKC feed and tails is shown
in Figures 4-7 and 4-8, respectively. Dilution significantly increases recoveries in the fine
particle size range, typicdy minus 75 pm, for the PKC feed and even more for the tails. Since
about half of the gold is finer than 75 pm, the overall recovery increase in GRG content of
diluted sarnples is about half that of the -75 Pm, - i.e. 5% for the PKC feed and 9% for the
tails.

CHAPTER 4 STUDYING GOLD GRAVITY CIRCUITS
10 100 4000
Particle site (pm)
Figure 4-7 Suc-by-sue gold rtcovtries of diluttd and undilutcd PKC f e d of AELRD
I O 100
Partidesite (pm)
Figure 4-8 Sizeby-suc gold recovcrics of dilutcd and undiluted PKC tail of AELRD

CHAPTER 4 STODYING GOLD GRAVITY CIRCUITS 48
Ideally, the LKC tail gold grade of the PKC feed and tail should be identical, if the
PKC recovers only GRG. This is tantamount to sayïng that the non-GRG content of the PKC
feed and tails should be identical, and equal to the LKC tails gold grade Cie. the LKC
recovers al1 GRG and only GRG). This is not exactly the case, as the cyclone underflow
averages 16.8 g/t, 1.0 g/t above the tails of the plant tails, 15.8 g/t. The difference is small
and c m not be explained by diffaences in size distribution or LKC operating conditions (feed
mass or rate, fluidization water pressure). For the diluted sarnples, the difference is smaller
(as expected), 0.6 g/t, and this time favours the PKC tails. The differences are probably the
result of experimentd and assaying error.
Total gold recovery can be calculated from the feed and tail grade of the PKC, since
its yield is very small Liu, 19891:
Eq. (4-3)
This yields, for total gold, recoveries of 17, 1 1 and 2% for hours 1, 2 and 3,
respectively. For GRG, the same equation is applied to GRG content (in g/t), rather than
total gold. This yields recoveries of 30, 19 and -4% for the three hours. The last one is
negative because the GRG content of the PKC tails exceeds that of its feed. This raises the
issue of experimental error.
ExperimentaI errors:
For the thud hour of the cycle, GRG losses can be calculated fiom the grades of the
PKC tails, G, (30 * 0.5 g/t) and feed G, (33 * 0.5 g/t), and the GRG content of tails, R, (4 L
i 2%), and feed R, (48 * 2%). as shown in Equation 4-4.

CHAPTER 4 STUDYING GOLD GRAVITY CIRCUITS 49 - ~p - - ~
With these data a GRG recovery o f 6% is calculated. Its variance, 8, can be
calculated by Equation 4-5, which is a partial Taylor series [Chatfield, 198 11:
This yields an expenmental standard deviation, a, of 6%. The standard deviation is
greater than GRG recovery, 2%, which explains why a negative value can be calculated (-4%
in this case).
Figure 4-9 illustrates PKC efficiency by represenring the GRG content in its feed and
tails over the fiil1 recovery cycle. Whdst the drop fiom the second to the third hour in
efficiency between hours 1 and 2 is small, it is severe between hours 2 and 3, to the extent
that the amount of GRG in the PKC tail slightly exceeds that of the feed (probably because
of sampling, sarnple processing and assaying errors, as was demonstrated above). Thus, the
recovery cycle should be shortened to a maximum o f two hours, and possibly less. This is
reflected by present practice at AELRD, a 45 minute cycle on weekdays and 60 minute cycle
during weekends.
Recovery time (hour)
Figure 4-9 GRG content o f PKC C d and tails over a thr-hour recovery cycle
of AELRD

CHAPTER 4 STUDYING GOLD GRAVITY CIRCUITS so
Figure 4-10 Size distributions of PKC Id of AELRD
To increase the low gravity recovery of gold, Figure 4-10 suggests the possible
solution of oversize removal. Less than 6% of the GRG (10% of go1d)'is found in the
coarsest 20% of the mas, the +212 prn (70 mesh) fiaction. Thus screening at or around 2 12
pm would not oniy increase PKC recovery, but also upgrade the PKC feed.
4.3.4 Conclusions
1 . The AELRD data set is the first high quality sampling test of a Knelson-based
gravity circuit treating a relatively coarse high density gangue with the laboratory Knelson
met hodology developed at McGill.
2. An illustration of the adequacy of the study is the reproducibility of the sire-by-size
grades of the laboratory Knelson for the plant unit feed and tails samples. There was also
good reproducibility between undiluted and diluted sarnples.

CHAPTER 4 STUDYING GOLD GRAVITY CIRCUITS
3. Test work the presence of signincant GRG, of which relatively little was
recovered by the plant Knelson. Recovery dropped dramatically fiom the first to the third
hour of the loading cycle, suggesting that fiequent concentrate removal will be necessary.
4. The +212 Pm fiaction of the plant Knelson feed contained a much lower GRG
content than the -2 12 Hm. Feed grade and screening at a finer size would increase both the
stage recovery of the Knelson and gold production by gravity.
5. Dilution of the Knelson f d yielded only a moderate hcrease in laboratory Knelson
recovery, indicating that the effect of the high gangue density was sornewhat limited, at least
for the LKC.
4.4 Barrick's Est Malartic
4.4.1 Introduction
The Bamck's Est Malartic gold plant recovers both gold and copper The presence
of 0.7 to L.5 % Cu, some of it bornite (a more potent cyanacide than chaicopyrite), required
the removal of the copper ahead of cyanidation to mi~mize the copper concentration in the
leach solution. It was found that most gold (up to 85 %) reponed to the copper concentrate
and with the normal 3-month srnelter settlement terms, delayed payment for the gold had a
negative impact on the cash flow. The coarse gold contained in the copper concentrate also
decreased sampling acairacy and resulted in significant uncenainty in gold payments. Gravity
concentration was thus considered necessary, and a Knelson based circuit was installed
[Hope, McMullen, 1 9931.
The flowsheet of Barrick's Est Malartic is shown in Figure 4- 1 1. The ore, which is
directly cmshed by a conventional three stage circuit consisting of a jaw and two cone
crushers, is ground in an open circuit rod miif and a closed circuit bal1 mil1 to 80% passing 70
W. A portion of the classifjring cyclone underflow is fed to a gravity concentration circuit

CHAPTER 4 STUDYING GOLD GRAVITY CIRCUITS 52
consihg of two 76 cm (30") Knelson cornentraton operating continuously and two ûemhi
tables for final upgrading. The gravity circuit tailings are pahdly dewatered using cyclones
before retuming to the bal1 d l . The copper flotation circuit consists of a combination of
Outokumpu high grade tank cells and conventional cells. The high grade tank cells are used
in both roughing and cleaning duties while the conventional cells are used as scavenger and
scavenger cleaners. The copper flotation tailing is thickened to 50% solids and cyanide
leached for approximately 12 hours in open top agitaton. Leaching is foUowed by solidniquid
separation and pulp washing on dnim filters and goid recovery bv Ànc precipitation. The
filter residue is treated in an iNCO SO Jair circuit to remove copper and cyanide pnor to
discharge to a flooded tailings area. A flooded tailings deposition scheme was adopted to
etiminate the onset of acidification due to sulphide oxidation.
d
- Cyclone Cu RougherL - savenger - Cu Cleaner
ClbsslbSSlfier - Flotahion Rotation
1 I
To Retïnery To Tailings
Figure 4-1 1 Block flowshett of Bamck's Est Malartic

CHAPTER 4 STUDYING GOLD GRAVITY CIRCUITS
4.4.2 Previous work on tbe 76 cm (30") CD Knelson
A fim evaluation of Knelson performance was made by Vincent ( 1996); the Knelson-
based methodology was applied to one feed and one tail sarnple. A gold recovery of 16%
was estimated, with a GRG recovery of 57%. Because no concentrate sample had been
extracted, size-by-size data proved unreliable, but suggested a decrease in recovery with
decreasing particle size. To remedy this problem, a second survey, which included a PKC
concentrate sample, was completed Kaplante, 19951. Total gold recovery was estimated at
18 to 26%, and GRG recovery at 25 - 32%. As the feed rate to the unit might have decreased
(fiom that of Vincent's work), there is not apparent discrepancy between the two data sets.
Laplante (1995) estimated size-by-size total gold recovery, which was 14% for the -25 prn
fraction and increased to 24 to 30% range for the +105 Pm fiaction. Data above 105 pm
were noisy because of the nugget effect and lower gold grades than in the h e r sïze classes.
A sarnple of the table tails was extracted as part of the same sampling effort, to estimate table
efficiency and evaluate the potential for tiirther recovery fiom the table tails with a PKC. This
work will now be descnbed.
4.4.3 Materials and Method
Soiid densitv measurement
Tramp iron with a density of 7 g/cm3 and pyrite with a density of 5 gcm3 are
recovered preferentialiy in the PKC concentrate, and increase the density of the table feed and
tails. This density was determined using a 100 ml flask as a pycnometer; five rneasurements
averaged 3.5 g/cm3.
S a m ~ i e preparation and tests with LKC
A composite sample (50 kg) of table tails from Barrick Est Malartic was received at
McGill University. It was screened at 850 Pm (20 mesh). The undersize fiaction was split
into two. Part of the -850 pm sample was fùrther screened at 212 pm (70 mesh).
Subsarnples ofthe -850 pm and -212 pn fiactions were processed with a LKC to determine
GRG content at feed rate of 400 g h i n and a fluidization pressure of 28 kPa (4 psi) for the

CHAPTER 4 STUDYING GOLD GRAVITY CIRCUITS 54
-850 Vrn (20 mesh), and 28 kPa and 21 kPa (3 psi) for -212 Pm sarnples. Al1 of the
concentrate and sarnples of the tails were screened down to 25 pm and the tails size fiactions
above 105 pm were pulvenzed. Al1 fractions were assayed at the Bamick Est Malartic
laboratory.
4-4.4 Results and discussion
Overall metailurgical balances, Table 4-4, show that the highest recovery, 91%, was
achieved with the -212 Pm at a fluidization water pressure 28 kPa. Recovery at the same
pressure for the -850 pm was 76%. Both are high, when compared to the work of Huang,
who measured table tails samples fiom eight Canadian plants, the recovenes of 30 -55% for
-850 fractions, and 60 - 91% for -212 pm fractions puang, 19961. Agreement between the
head grade of the two -212 prn tests is good, 559 gh vs. 565 g/t. The -850 Pm feed has a
lower gold content, 339 g/t, because the 2 12 - 850 pm fraction assays only 3 5 g/t, whereas
the -212 pm assays 492 g/t, in reasonable agreement with the head grade of t h e two -2 12 prn
tests. Laplante (1995) reported a Knelson concentrate assaying 14,600 g/t (-850 pm) at Est
Malartic; the table tail grade of 339 g/t would correspond to a goid recovery of 98% for the
Gemeni table, considerably higher than the 90% (at a concentrate grade of 85% Au) reporte d
by Hope and McMullen (1993). This discrepancy may be the result of a lower table feed or
concentrate grade, or unaccounted losses (in the rniddhgs or magnetic product, for example).
LKC recovery on the table tails is very high, which implies that scavenging additional gold
from the Gemeni table tails is technically feasible. It is not likely that it would be
econornically justifiable, given the already high recovery of the table-
Table 4-4 Table tails test results for Barrick's Est Malartic
11 Product

CHAPTER 4 STUDYING GOLD GRAVITY CIRCUITS 5s
The high GRG content of the Gemeni tails and its high recovery result likely fiom
ciBicuit PKC operations, on account of the coarseness (- 1.7 mm) and high density of its f d .
Consequently, oniy gold that is highly gravity recoverable is captured by the Knelson, and this
gold is easily reçovered agaîn by gravity, either by the Gemeni table itseif, or by the LKC kom
the Gemeni table tails.
Size-by-size recovenes of the three LKC tests are shown in Figure 4-12. The
increased recovery of the -2 12 pm test at 28 kPa (fiom 2 1 kPa) was not achieved in the fine
sizes (-37 pm), where little gold is distnbuted, but in the 53 - 2 12 pm fiaction, presumably
because of better fiuidization of the PKC feed. The lowest recovery, 69%, was obtained with
the -2 12 pm test at 2 1 kPa, and was probably the result of an inadequate Buidization of the
flowing sluny, as the recovery drop was most severe above 75 Pm. A similar drop in
recovery had been reported by Laplante, Shu and Marois (1996), when fluidization water
pressure was lowered below the optimum range.
Figure 4-12 Size-by-size gold recovery OC table t r i ls o f Birrick's Est Malartic

CHAPTER 4 STUDYING GOLD GRAWTY CIRCUITS 56
The Iowa fluidization pressure increases fines recovery (below 37 pm), but so littie
gold is h e r than 37 Pm that the impact on overall gold recovery is negligible. There is an
apparent inconsistency below 37 pm for the two 28 kPa tests, as recovery curves cross at 25
p.m. How could the 25 - 37 mm hction recovery be higher with the -850 pm feed? This can
be traced to a suspicious assay for the LKC 25 - 37 pm concentrate of the test at 28 kPa. The
assay is too low, and results in a calculated head of 1474 g/t for this size class, compared to
2537 and 2368 g/t for the two other tests.
This short disaission highi~ghts the importance of accurate assaying and the usefblness
of multiple tests on the same feed. Reiiable assaying is especially criticai for LKC concentrate
&actions, which can not be re-assayed (as they are completely assayed to eliminate the nugget
effèct). A similar situation had arisen for the fine fiaction of the LKC tails for one of the Aur
Louvicourt tests (Fig. 4-5).
Figure 4-13 Size distributions of the table tails of Bamck's Est Mdartic
Figure 4-13 shows that gold in the table tails is finer than its gangue, and narrowly
distributed: only 3% i s coarser than 300 pm (but 24% of the gangue). An analysis of the
PKC concentrate bplante, 19951 repoited, for the same size classes. 14% of the gold in the

CHAPTER 4 STUDY ING GOLD GRAVITY CIRCUITS 57
+300 Pm, and 8% below 37 prn, for the PKC concentrate feeding the Gemeni table at the
time of the table tails were sampled. Thus, gold in the G ~ E N table tails is even more
narrowly distributed than in its f d . This is largely because the Gemeni recovers coarse gold
very efficiently. Above 212 pm, the arnount of GRG in the Gemeni table tails drops rapidly
(Figure 4-12 -850 pm test): this is rnostly udiberated gold, probably associated with pyrite.
Hope and McMuiien ( 1 993) had reported the m e problern in the jigs that were replaced wit h
the PKC, but to a much greater extent - Le. jigs have an even higher tendency to recover
coarse udiberated gold.
4.5 Cambior's Chimo Mine
4.5.1 Description of grinding and gravity circuit
In the grinding and gravity circuit of Chimo, shown in Figure 4- 14, the SAG mil1
discharge is classifieci by cyclones. Part of the underflow is screened at 3 .4 mm (6 mesh); the
undersize is processed by a 76 cm (30") Knelson Concentrator. The tails of the KC feed a
- flash ceU whose concentrate is fhhe r treated by a 5 1 cm (20") Knelson Concentrator. The
screen oversize and the balance of the cyclone underfiow flow by gravity to the SAG miIl.
The combined cyclone overflow goes to a conventional flotation circuit. The flash ce11 tail
retums to cyclone. CvcloneaYem~~~
Figure 4-14 A flowshcet of the grinding and grivity circuit of Chino Mine

CHAPTER 4 STUDYING GOLD GRAVITY CIRCUITS 58
4.5.2 Sampiing and processing with a labontory Kndson
Nme streams of the grinding and gravity circuit at Chimo were sampled; three for their
size distributions (cyclone underflow, screen oversize and SAG mil1 discharge) and six for
their GRG content (cyclone overflow, 76 cm KC feed and tail, 5 1 cm KC feed and tail, and
flash ce11 tail). The sample m a s varied between 4 and 20 kg.
Site distribution tests
Cyclone underflow (13 kg), SAG miIl discharge (6 kg) and screen oversize (5 kg)
were sequentially split, using a Jones rif3e spher, into two 600 g samples. Each sample was
screened with the same screen set tiom 9,500 pm to -25 Pm. The average size distributions
obtained are shown in Figure 4- 14.
LKC tests
The six LKC test samples were screened with a Sweeco at 850 pm, and the +8 50 prn
fraction was stcred for fiirther studies. The -850 pm fiaction was processed with a LKC
under the conditions shown in Table 4-5 (details are shown in Appendix B-4). The LKC
concentrate and tails were processed as for the previous tests (section 3.2.2), and the size
fractions anaiyzed for gold content at the Bourlamaque assay laboratory.
Table 4-5 Processing conditions with LKC for Chimo
Cyclone ovedow 1 3 -6 250 18
76 cm Feed 10.8 480 2 1
Knelson Tai1 1 19.6 520 21
5 1 cm Feed 6.0 300 18
Knelson Tail 5.5 400 18
Flash cell tail II 6.7 1 420 1 21

CHAPTER 4 STUDYING GOLD GRAVITY CIRCUITS 59
4.5.3 Results and discussion
Table 4-6 shows the overail results of LKC tests (details are shown in Appendix B-4).
Perusal of the data identifies blatant inconsistencies. Fust, the cyclone overflow grade, 16 g/t,
is much higher than what is routinely reported at Chimo, 1-3 g/t (the ore assays 2-5 glt). Its
GRG content, 76%, is also unrealistically high, as cyclone overflows typically contain 15 - 20% GRG. Both problerns are caused by the hi@ assays of the LKC concentrate size classes,
which must be rejected as grossly overestimated.
Table 4-6 OverrU results o f LKC tests for Cbimo
Cyclone ovedow
76 cm Feed
Knel son Tail
51 cm Feed
Knelson Tail
Head 1 LKC 1 LKC tail
Grade 1 Recovery 1 grade
A similar probiem is encountered in the 5 1 cm PKC feed, whose head grade, 5 14 g/t,
is far above reported values, typicaily around 50 - 100 g/t; its GRG content, 86%, is also
excessive (values of 19 to 36% have been reponed by Putz, 1994). Again, only very hi&
biased LKC concentrate assays can explain these data.
The 76 cm PKC feed and tail data are much more plausible: both are in the expected
order of magnitude, with high but plausible GRG content (the GRG was measured twice for
the ore, at 83 and 94%). Further, the LKC tail grades, 2.5 and 2.3 g/t, are very similar, as
they should for the feed and tails of a PKC (as discussed in section 4.3.3). The size

CHAPTER 4 STUDYING GOLD GRAVITY CIRCUITS 60
distribution of the PKC feed and tails are aiso in good agreement (Appendix B-4), as PKC
produces a very low yield.
The flash cell tails sarnple yields plausible GRG and size distribution data, as s h o w
in Figures 4- 1 5 and 4- 16 (its sue distribution compares well to that of the 76 cm PKC feed
and tails). Whereas the 76 cm PKC can not reduce the quantity of non-GRG in its feed (the
drop fiom 2.5 to 2.3 g/t is within experimental errors), the flash ce11 does so, to 1 .O gh, as it
floats gold-bearing sulphides. Size-by-sire analyses show that flash ce11 dropped gold content
below 300 pm, as was reported by Putz' work put% 19941. About 50% of the total gold
in the flash ce11 tail reported to the 300 - 850 Pm Fraction.
Particle Size ()rm)
Figure 4-15 Size distributions oCPKC ked, taü and flash cell tail of Chimo Mine
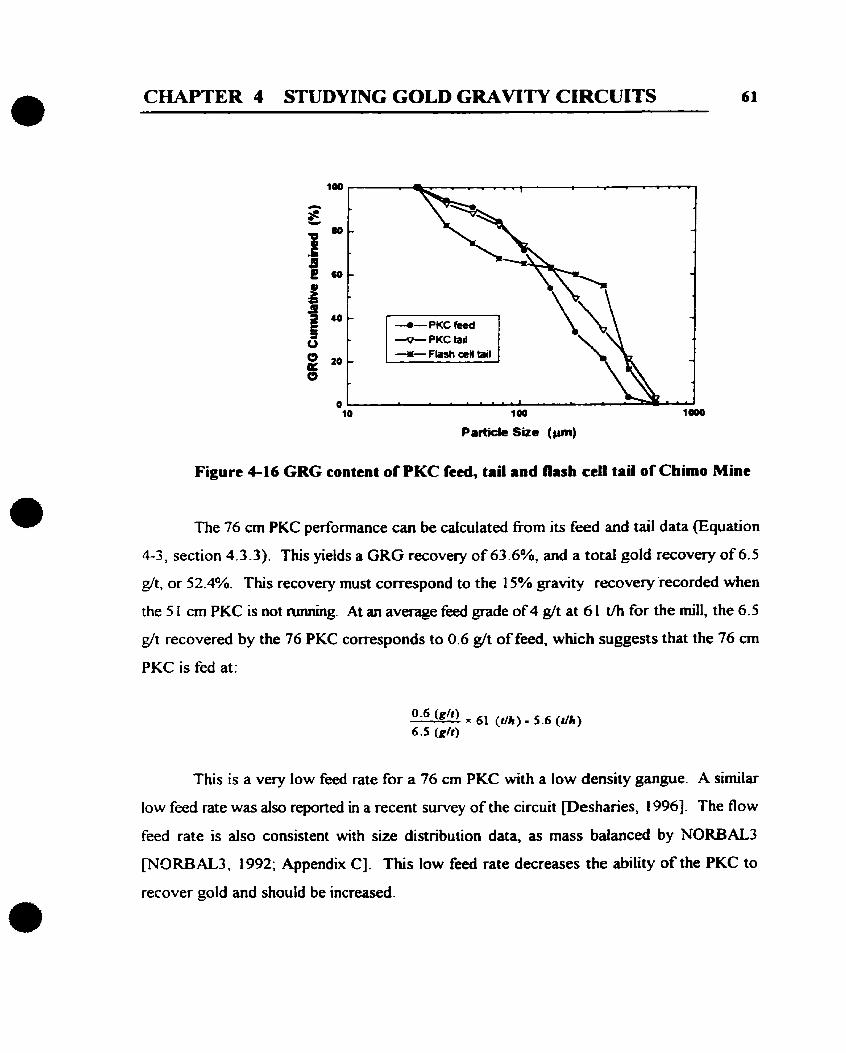
CHAPTER 4 STUDYING GOLD GRAVITY CIRCUITS 61
100
Partide sue (v)
Figure 4-16 GRG content of PKC C d , taü and flash cell tail of Chimo Mine
The 76 cm PKC performance can be calculated corn its feed and tail data (Equation
4-3, section 4.3 -3). This yields a GRG recovery of 63.6%, and a total gold recovery of 6.5
g/t, or 52.4%. This recovery must correspond to the 15% gravity recoveryrecorded when
the 5 1 cm PKC is not running. At an average feed grade of 4 g/t at 6 1 t/h for the d l , the 6.5
g/t recovered by the 76 PKC corresponds to 0.6 g/t of feed, which suggests that the 76 cm
PKC is fed at:
This is a very low feed rate for a 76 cm PKC with a low density gangue. A similar
low feed rate was also reportai in a recent survey of the circuit pesharies, 19961. The flow
feed rate is also consistent with size distribution data, as mass baianced by NORBAL3
[NORBAL3, 1992; Appendix Cl. This low feed rate decreases the ability of the PKC to
recover gold and should be increased.

CHAPTER 5
SIMULATION OF GOLD GRAVITY RECOVERY AT AELRD
Lapiante et PL (1994) popseci an aigorithm to estmiPtc gold reconry from a
description of the gridhg and ciassincption behaviour of go& couplecl w&b an estirmte of
t h GRG cwtent of tk ore and a masun or predrtion of tk effxicncy of GRG refovay.
Aii data were desfnxd ske-by-sizc and m g e d m a rclstively sinple n i a h algorithm For
a cim& such as AELRIYs, sctitiriatitkû m Figure 5- 1, with goid recovery from a bkaî of tbe
cyclone underfiow, the foiiowing equation (5- 1) is easiiy derivcd:
Eq. 5- 1
Fiprc 5-1 Sebernatic d a goid gravity cimait (mm- hm ~ ~ c i m e undanoll)
Tbe variabies of equation 5- 1 arc identicai to those of eqution 2-1 (section 2.2.1).
and therrsuttirmfMvaysniilrr,rroalythcbcuionoft& Cmatrix, whicb isacarlyequai
to unity (as 99% of GRG reports to the cycbnc uada8ow). has changd. This reflects the
fact that recovery bom the nrül discharge (Eq. 2-1) wiiî ykld sirnüar nsults to the

CHAPTER 5 SIMULATION OF GRAVITY RECOVERABLE
OLD AT AELRD 63
recovery h m a cycbac umkdow (Eq. 5-1). 'Thus. c o ~ n s other than mtallurgy (ie.
layout and pumping) can dktatc tbe location of tbe priripry recovery unit.
Equatjon 5-1 wiû now be iued to mDdel gravity recovery on the basis of the Knelson
results reporteà in Chapter 4 (saaion 4-3) snd previously pub- daîa (Buonvino. 1993;
Vincent, 1996; Woodcock, 1994). First, t h e l matrix will be that which Woodcock (1994)
gemmed, as show in Figure 3-13. The diagonal of tbc rccovery rnatrix will be tbat which
was gerierated at Es Mahtk. a d used to mode1 H e W s gravity circuit (Lapiante, V i n t
and Luinstra, 19%). A second recovery mirk win also be used to simuhte b l s o n
operation with a low âensity gangue. It is based on data fkom Meston Resources's 76 cm
PKC operation (Laplante. Putz, Huang and Vincent, 1994). nie rmin diagonal of the
preconcentxation rmtrix. P. is aiso shown in Table 5-1; it was estimated fiorn the b w n
ckculating load. 800- 1000%. of whkh the 76 cm PKC un only treat 10% at the fresh fced
rate of 40 t/h for each of AELRD's two grinding lincs.
Tabk 5-1 R, P, and GRG tnatrix F (% of the total gdd in Id) and main
diagod of C matri-
vork) 1 C (Vincent

CHAPTER 5 SIMULATION OF GRAVITY RECOVERABLE GOLD AT AELRD 64
This value is slighdy less for the 600.850 pn fraction, which is p d y rejected by the
screen ahead of the Knelson. Finally, two classification matrices will be tested, that
measured by Vincent at AELRD (19961, and one which reflects existing classification
problems, with double the fraction of GRG reporting to the overf'low. Both are shown in
Table 5- 1.
Since the H matnx is more difficult to extract from plant data, the grinding data from
Buonvino (1993) will be used. The selection function of the ore is difficult to extract, as
many of the coarser size classes present in the fresh feed are not in the mil1 discharge. Figure
5-2 shows the selection function of the ore for a limited size range, which has been
extrapolated to cover the full size range of interest - Le. 25 or 37 pm to +850 p m Figure 5-2
also shows what the projected selection function of GRG would be, using the assumptions
of Banisi, Laplante and Marois (1991) (presented in chapter 2). The relationship between
the selection function of the ore and that of GRG is similar to that reported by Buonvino in
AELRD's regrind mill, which then processeci a sluice concentrate with a high GRG content.
Figure 5-2 Selectian function vs. particle size

CHAPTER 5 SIMULATION OF CRAVITY RECOVERABLE GOLD AT AELRD 6s
From this information a first estimate of the H matrix, s h o w in Table 5-2, is
computed using the algorithm proposed by Au& and Luckie (l9M). The last three elements
of the main diagonal must be corrected to account for GRG that becomes non-gravity
recoverable without k ing ground because of excessive flaking, to values of 0.995, 0.99 and
0.98, respectively, as proposed by Laplante, Noaparast and Woodcock (1 995). The elements
below the main diagonal, which correspond to GRG beuig ground into finer s k classes, must
also be corrected for loss of gravity recoverability due to smearing, flaking, or breakage into
very fine fragments. This is achieved with the equation (Eq. 5-2) proposed by Noaparast
(1 996):
where x is particle size (the geomean of each size class. in pm) and &, is a
correction factor. Further, for high density gangue ores, a more conservative estimate of
recoverability will be used to account for the high gangue density, which may decrease the
recoverability of fragments. Both estimates are shown in Table 5-3. Whereas the colurnns
of the uncorrected H matrix (Table 5-2) sum up to unity (since the pan size fiaction is
included), those of the corrected H matrk do not, once each element below the main diagonal
has been corrected with the factors of Table 5-3.
For the base case, the recovery data of Est Malartic, the poor classification function
and the recoverability data of Noaparast will be used. Matrices will then be changed, only
one at the tirne, to assess their impact on predicted recovery. More specifically, poor
classification, poorer fiagrnent recoverability, and better PKC performance (on account of
low gangue density) will be simulated.

CHAPTER 5 SIMULATION OF GRAVITY RECOVERABLE GOLD AT AELRD
Table 5-2 Uncorrected H matrix
Table 5-3 Correction factors for the H matrix
Size Noaparast's This
am) data work

CHAPTER 5 SIMüLATION OF GRAVlTY RECOVERABLE GOLD AT AELRD 67
Simulation results are suLnmanzed in Tabie 5-4, which also includes plant recovery
data for the f m t s u rnonths and the surnmer of 1996 [Robitaille, 19961, which experienced
a s harp drop in gravi ty recovery (it has since climbed back to its original 1 8 - 2 1 % levels).
The low recovery of the summer 1996 was traced to a lower GRG content in the ore
(Laplante, et al., 1997). This problem has since largely disappeared.
Table 5-4 Measured and simdated recovery
Measured, Summer of 1996 12
Measured, before and after Sumrner of 1996 18-2 1
Simulated base case 1 22
S imuiated, Vincent's classification rnatrix 1 28
Sirnulated, low density gangue performance (Meston) 1 27
The base case yielded a recovery of 22%. which is slightly higher thàn chat measured
in the plant, as it does not take table losses into account. When Vincent's classification
matrix is used, the predicted recovery climbs to 2896, significantly higher than plant
performance. Poorer classification has been used for the base case, because the classification
circuit has been modified to accommodate gravity, and has yet to be optimized. This
s ugges ts that addi tional recovery gains can be achieved with improvements in classification.
Table 5 4 also shows that poorer fragment recoverability has little impact on total
gold recovery, within the range it was tested. This is not the case for Knelson performance,
as the recovery data of Vincent for the low gangue density Meston ore significantly increases
predicted recovery. Clearly, the effect of gangue density on PKC performance has a
significant effect of circuit recovery.

CHGPTER 5 SIMüLATION OF GRAVITY RECOVERABLE GOLD AT AELRD 68
Figure 5-3 Cumulative GRG size distribution of sirnulated and measured
gravity stage recovery
Figure 5-3 compares the simulated (base case) and measured size distribution of the
Knelson concentrate (Huang, 1997). Agreement is not very good, mostly because thete was
no GRG measured above 300 pm in the original sample, which does not reflect the ore being
mined today. As a result, the mode1 c m not generate the 12% +300 pm gold recovered in
the Knelson concentrate with recently mined ore. The coarsening of GRG at La Ronde had
been expected, as mining has proceeded h m the outside to the core of the ore body over the
past four years. A GRG test should be performed to obtain a more upto-date estimate of the
GRG distribution.

CHAPTER 6
CONCLUSIONS AND FUTURE WORK
6.1 Summary and ConcJusiolis
6.1.1 Gravity l p c o v ~ b k gold
The distinct behaviour of gold m giiidiag circuits is dictpted by its malkabiiity a d
density. whkh influe- lil inportant ~lccbanks: beakage. chssification and libcratkn.
These will affkct goki's rcsidence tim in tk griadiag circuit and its recovery by gravity
[Banisi 19911. %y far the mst signincant inpikation is that iadividuai goki partkks arc
recycM a iarge numbcr of thms (averages of up to 80 t i m s bave bcen masund) in tbe
circulating load of gridhg circuits, wben gold priniary gravity ~ o v a y no-y takes
place. As a result, gravity rccovcxy performance depends nostly on the anmunt of GRG m
the ore. A siavey of fbrty ore types yklded an average of 63% ORO [Laplsate. 19%]. which
suggests that most gold ores are omnabk to grrvity recovery. However. the p n s n t work
clearly showed that gangue density also plays a critical rok in detewning âow succeshi
gravity recovery will be.
At the AELRD plant, the GRG content (50%) is k l o w average. parthiiy because of
a very high suiphide content of 50%. mainly in pyrite with a specik gravity of five. Despite
the dense gangue, the Dm1 of goki is tbrce t i m s s m a k than that of the gangue [Buonviw.
19931, anci gold builds up significantly in t& circulatuig baâ. This indicates that m r h fh
gold reports to the cyclone undcrflow and could evennially be mvered by tbe gravity.
At Aur's Louvicourt Mine. a very low GRG content (28 - 35%) was obtaincâ,
compareci to tk otha ores discusstd m Qiaper 3. This indlcates that the potential of gravity
recovery is extremly low. Hindcring gold recovery is the silver-rkh goki bearing mheral,

CHAPTER 6 CONCLUSIONS AND FUTURE WORK 70 . - -- . - - . - . . -
kustelite, with a density as bw as 13.5 g/cm3 ( s h gold and silver have very simiiar crystal
structures and bth are isormpic with a face antred cubic iattice, t k e is w strlctly defincd
composition for e- iîs p l d to silm ratio. and s p d duisity GUI vary). This is
mnsiâerabiy ûebw that of pure gold. 19.3 glnn). ami makes gravity recovery difacult sincc
the concentration ctitaion betwecn kustelite and pyrite drops to 3.2 6om a value of 4.8 for
pure gold. Wiüs [1988] stated that tbe large? the concentration criterion, the wia the
recovery by gravity. Neverthekss. Burt suggests tbat with a concentration criterion of 3.2
gravity recovery is s t i i l possibk in t& sirc range of mterest (tht is mt to say that tbc
reiatively "soft" approach of treating only a bled of the Cpcuhting load wiil k sumsshil) .
Snip's GRG is also chanrmiEcd by its kness . Laboriatory tests show tbat 53% of
the GRG (58% in Sr@ 2) is below 2 12 pn GRG is nlntiveiy dif6cult to likrate. as 36%
GRG was recovered in the second and third stages of the test, at finer grind. To conpoud
the problem, Snip's fine goid is poorly rccovemi by the jig in the fine p h l e siIc range
Fincent, 19961- The test work of Vincent suggested that an installation of a Knelson in tht
gravity circuit wodd increase the graviîy recovery. Neverthekss. the Snip circuit stiii
recovers about 38% of the goid, ad 60% of the GRG.
At Bar* Gold's East Mahrtk. th ore contains at kast 6096 GRG, som of it very
coarse. Piant data suggest that the v u y coarse goid is episodic; when absent, the size
distribution of the GRG prernt in tk circulatïng Lod is stin coarser than that of Aur. Snip
or AELRD.
6.1.2 Plant worlr
At Aur Louvkourt, the plant Knelson achieved a stage recovery of 1.8% and a total
gold recovery of 4.2%. The poor perfomnnce was pndictobk. given tbe low density of
histelite and the hi@ gangue density. Although a k r PKC feed wouki boost recovery, it
would sti l l rennin bebw tbat whkh is apmmsl ad upgndiag would be difncult (as shown
with LKC tests). An obvious conclusion is îbat the stpnia+ri PKC is not suitable at

CHAPTER 6 CONCLUSIONS AND FUTURE WORK
Louvicourt. A unit capable of a better performance, possibly a Knelson operating at a faster
rotation velocity, would increase recovery, but it is unlikely that the increase would be high
enough to make gravity economidy justifiable.
At AELRD, the feed is of intermediate particle sue (-850 pm), but high gangue
density, hence the plant gravity recovezy, 20%, is only 40% of the measured GRG content.
PKC performance was limited by an overioad over a 3-hour recovery cycle. Previous studies
indicated that the concentrate bed erodes fmer for coarser andor high density gangue than
for fine andor lower density gangue wuang, 19961. As discussed above (section 4.3), the
recovery of PKC would be improved by diminishing the cycle time. In addition, since a GRG
test at AELRD has show that the ore contains a large amount of fine goid, removing the plus
300 pm fiaction fiom the PKC feed would also increase gravity recovery. Another increases
in gravity recovery would result fiom decrease in the circulatîng loads, which would make it
possible to treat a higher fiaction of the circulating loads.
At Barrick Gold's East Malartic, the plant Knelson has a stage GRG recovery of 16%
and most gold recovered by PKC is above 300 pm [Vincent, 19961. The dense concentrate
is upgraded by a Gemeni table. it is known that tables do not effectively recover gold fiom
primary concentrates in the fine particle size range and normdly leave the fine gold in the
table tail [Huang, et al., 19931. Laboratory work shows that the 90% of the gold rejected
by the table is finer than 212 pm, compared to only 40% of the gangue. Because the PKC
feed is both coarse and dense, it recovers only very highly recoverable GRG, which yields
a high Gemeni table recovery above 95%, and a very high GRG content in the table tail, 9 1 Oh.
One conclusion is that difficult primary upgrading may resuIt in easier cleaning, as the cleaner
feed contains mostiy gold very amenable to gravity recovery. On the down side, the gravity
circuit recovers only 20% gold, fiom a GRG content above 60%.
At Chirno, the circuit survey was marred by assaying problems. Unfortunately, the
high gangue density part of the survey, treating the flash flotation concentrate with a 5 1 cm

CHAPTER 6 CONCLUSIONS AND FUTURE WORK
PKC, was the most aEected.
6.1.3 Recovering gold from high gangue density ores
The surveys presented in this work point in the same direction: recovering gold fiom
high density gangue is much more challenging than from their low density counter-parts.
Work at Snip, Meston Kaplante, Huang and Noaparast, 19931, Hemlo paplante, 19961
indicates that at least 50% and as much as 70% of the GRG measured in the ore can be
recovered by a conventional, Knelson-based gravity circuit: screening of 1 5 to 25% of the
circulating load, at 850 to 1700 pm, and processing the undersize with a PKC. This
approach, when applied to high density ores, yields recoveries that total 30 to 40% of the
GRG content (East Malartic, AELRD), or even much less (Louvicourt). Part of the problem
is linked to the performance of the Knelson, which, at constant feed rate, is much lower with
higb density gangues, either at lab wplante, Shu and Marois, 19961 or at plant scale putz,
Laplante and Ladouceur, 19931. The test used to measure GRG in ores does not reflect this
problem, as the LKC is not operated at high capacity, especially for the 1st two stages.
Hence, it may not fiilly reflect the increased difficulty of recovering GRG fiom high density
gangues. Whilst inserting a screen to remove the coarser sue fraction (where little GRG is
often found) prior to PKC in Les Mines Casa Berardi was recomrnended mapiante, Putz,
19941, other work suggested using a higher rotating velocity KC to improve the recovery
paventi, 19951.
6.2 Recommendations
Table 6- 1 shows recommendations for the gold plants evaluated in this work. For
AELRD and East Malartic, a finer feed and a shorter cycle are suggested. High density
gangue and low density kustelite result in the recomrnendation of discontinuing gravity
recovery at Aur Louvicourt. Increasing feed rate to the 76 cm PKC might increase gold
gravity recovery at the Chimo Mine.

CHAPTER 6 CONCLUSIONS AND FUTURE WORK 73
Gold Plant
AELRD
1 1 to 76 cm PKC
6.3 Future Work
(1). Rernovmg of the CO- s k Wons. where most gold is not conpktely
h i and shoRcNng recovery cycks sbouki irrrose recovery. This must be verificd a d
documented.
(2). The variable speed LKC should be tested on goki ores with a high deasity
gangue.
(3). b s i o n of tbe Knelson Concentrate bed is closely hked to the size distribution
and grade of the high density gangue niinerals. typically sulphidcs. This should k hrrtber
investigated at kboratory SCPL to detenMC tbe opthmm scnening site.
(4). Tbtre is cvidcna tfiat histclite might a f k t PKC perbnriancc e n n more so than
that of the LKC. The GRG d c t e ~ t i o n test, as it is pieseotly designed, is incapabk of
detecting kustelite. A supplemntal stcp should k included; 5 couki k as skqk as an
atornic adsorption analysis of tbe gold and sihm content of a fk fiaction of the LKC
concentrate. A high silver to gold ratio would iden@ tbe pmence of kustelite.
Finerfad 1 Shortercyck
Yes I Yes
East Mahrtic
aiim,
Othcrs
-
Ycs
- Ycs
- -
ïncreasc fced rate

Austin, L.G., Klimpei, RR, and Luckie, P.T., 1984, "Process engineering of size reduction: Bail millinq", Society for Mining Engineers, AIME Inc., New York.
Banisi, S., Laplante, AR and Marois, J., 199 1, "The behaviour of gold in Hernlo mines Ltd. grinding circuit", C M Bull., vol. 84 (959, pp. 72-78.
Bridgwater, J. and Lngram, N.D., 197 1, "Rate of spontaneous inter-particle percolation ", Trans. Inst'n Chem. Enms, vol. 49, pp. 163-169.
Bridgwater, J. Sharpe N.W. and Stocker, D.C., 1969, "Particle mixing by percolation", Trans. Inst'n Chem. Enms, vol. 47, pp. T 1 14-T 1 19.
Buonvino, M., 1993, "A studv of the Falcon concentrator", M. Eng. Thesis, McGill University, 152 pp.
Chatfield, C., 198 1, "Statistics for tectuioloy - A course in apulied statistics", Chapman and Hall, 2nd Ed., New York, 370 p.
Desharies, 1996, "Intemal report on the nding and eravitv circuit at the Chimo Mine", 10
P -
Gasparrini, C., 1993, "Gold and other ~recious metais - fiom ore to market", Springer - Verlag; Berlin, pp. 98- 109.
Haque, K.E., 1987, "Gold leaching fiom refiactory ores - literature su&ey", Mineral Processina and Extractive Metallurav Review, No.2, pp. 23 5-253.
Hayek, C., 1995, "Identification B du cycle Knelson #2 (AlimentatiodRe-let)"? Internal technical report, Mine Est Malartic, 22 p.
Hope, G.H., McMullen J. and Green D., "Process advances at Lac Minerds Ltd. - Est Malartic Division", 1993, Proceedinas - 25 Annual Meetina of the Canadian Mineral processors, The Canadian Institute of mining, Metallurgy and Petroleum, 13 p.
Huang, L., 1997, " Amico-Eade La Ronde survev", Technical report, 12 p.
Huang, L., 1996, "Upgradinn of aold gravitv concentrates: A studv of the Knelson Concentrator ", Ph.D. Thesis, McGill University, 200 p.
Knelson, B.V., " 1988 - Centrifùgal concentration and separation of precious metals", 1988, Gold Minina' 88. Ed. C.O. Brawner, pp. 303 - 3 17.

REFERENCES 75
Laplante, A R , Huang, L. and Harris, G.B., 1996, "Defining overload conditions for the 7.6 cm Knelson Concentrator, using synthetic feeds", Trans. Inst. Min. MetaIl. (Section c: Mineral Process. Extr. Metall.), vol. 105, pp. cl26 - c132.
Laplante, A.R. & Shu, Y., Marois, J., "Experimental characterization of a laboratory centrifuga1 separator" 1996, Canadian Metallurgical Ouaileriy. Vol. 3 5, No. 1, pp. 23-29.
Laplante, AR., Huang, L., and Noaparast, M., and Nickoletopoulos, N., 1995, "A philosopher's Stone: Tuming tungsten and lead into gold -The use of synthetic ores to study gold gravity separation" Proceedings-27th Annual Meeting of the Canadian Minerai Processors, Ottawa, Ontario, Section 6, No. 28, pp. 379 - 394.
Laplante, A R , Put& A and Huang, L., May 1993, "Samphg and sample processing for gold gravity circuits," Professional Deveio~ment Serninar on Gold Recovery by gravi^, McGill University, 22 p.
Laplante, A.R., 1995, "Evaiuation of gravitv circuit at East Malartic", Technical report, September, 1995, Montreal, 29 p.
Laplante, A.R., Huang, L. and Noaparast, M., 1993, "Report of the work ~erformed for Meston Resources" Internai Re~ort to Meston Resources, Montreal, 25 p.
Laplante, A R Vincent, F. and Luisntra, W., 1996, "A laboratory procedure to determine the arnount of gravity recoverable gold - a case study at Hernlo Gold Mines", Proceedinns--28th Annual Meeting of the Canadian Mineral Processors, Ottawa, Ontario, pp. 69 - 82.
Laplante, A.R., h t z , A., Huang, L. and Vincent, F., 1994, "Practical considerations in the operations of gold gravity circuits", Proceedinas--26th Annual Meeting of the Canadian Mineral Processors, Ottawa, Paper 23, 2 1 p.
Laplante, A. R. and Zhang, B., February 1996, "Re~ort on two laboratow tests with tabk tails samples from East Malartic", Technicai report, McGill University, 6 p.
La plante, A.R., 1 993, "A comparative study of two centnhgal concentrators", Proc. 25th Annual Meeting of CMP, Ottawa, Paper 5, 18 p.
Laplante, AR, Vint, P. Noaparast, M., Woodcock, 1 995, "Predicting gravity separation gold recoveries", Proceedinas of the MX international Mineral Processing Congress, Vol. 4, Littleton, Colorado, U S 4 pp. 19-25.
Laplante, A.R., 1996, "Characterization and behaviour of gold in grinding and gravity circuits", Final technical report for Sni operations, McGill University, 82 p.

REFERENCES 76
Laplante, AR and Shu, Y., January 1992, "The use of a laboratory centrihigal separator to study gravity recovery in industrial circuits", 24th Annual Meeting of the Canadian Mineral Processors Conference, Ottawa, paper No. 1 2.
Laplante, AR, Nov., 1996, "Characterization of gravity recoverable gold in a second sarnple of Agnico-Eagle La Ronde Division", Internal revoit, 8 p.
Lin, J., 1995, "Variable speed Knelson Concentrator", A document for Ph. D. preliMnaw oral examination, McGiii University, pp. 30 - 35.
Liu, L., 1989, "An investigation of aold recoverv in the Prindine and ~ravitv circuit at Les Mines Carnchib Inc.", M. Eng. Thesis, McGill University, 180 p.
Masliyah, J. and Bridgwater, 1.. 1974, "Particle percolation: a numerical study", Trans. Instn Chem. Enars, vol. 52, pp. 3 1-42.
Momson, T. A, Hodson, T. W ., 1992, "The Snip Mine Cominco Metals LtdJPrime Resources Group h c . ", Presented at Minerals North 1992, Terrace, B.C..
Noaparast, M., 1 996, "The behaviour of malleabte rnetds in tumbling mills", Ph. D. Thesis, McGill University, 350 p.
Paventi, J., 1995,"Characterization of operation of a gravity circuit at Les Mines Casa Berardi ", Research ~roiec t revoit, McGill University, 45 p.
Prasad, M.S., Mensah-Biney, R and Pizarto, RS., 199 1, "Modern trends in gold processing - O v e ~ e w " , Minerals Enaineerinq, Vol. 4, No. 12, pp. 1257- 1277.
Putz. A., Laplante, A.R. and Ladouceur, G., 1993, "Evaluation of a gravity circuit in a Canadian gold operation", Randol Gold Forum, Ed. Hans von Michaelis, Beaver Creek, pp. 145- 149.
Putz, A., 1994, "An investigation - of the gravitv recovery of University, 230 p.
Robitaille, J., 1996, Private communication, Agnico-Eagle La Ronde Division, Cadillac, Quebec.
Sinclair, G., 1995, "Mineraloeical studv of mil1 ~roducts fkom the Louvicoun Mine-Pan 4: mode of occurrence of aold and silver in a Knelson Concentrate" Report submitted to Aur Louvicourt Inc. by Min Scan Consultants Ltd., Apnl 1995, 1 1 p.

REFERENCES 77 - - - - - -
Spring, R., 1992, "NORBAL3 - software for material balance reconciliation", Noranda technology centre, Quebec, Canada, 62 p.
Vincent, F., 1998, "Com~ari jia and Knelson concentrator erformance for gold aravity recoverv", M-Eng. Thesis in preparation, McGill University .
Wills, B.A., 1988, "Mineral ~rocessing technoloqy", 4th edition, Pergamon press, London, pp. 357-358.
Woodcock, F., 1994, "Use of a Kneison unit to quanti- gravi% recoverable eold in an ore sam~le", M.Eng. Thesis, McGill University, 124 p.
Woodcock, F. and Laplante, A.R., 1993, "A laboratoly method for detemiining the amount of gravity recoverable gold", Randol Goid Forum, Ed. Hans von Michaelis, Beaver Creek 1993, pp. 151-155.

APPENDIX A Test results of gravity recoverable gold determinations
Appendix A 4 GRG tests of Snipf Bal1 mil1 feed Appendk A-2 GRG tests of Aur LouvicourU AppendU A-3 GRG tests of Barrick East Malartic

Appendix A-1
GRG tests a t Snip2 Baîl miIl feed


Appendix A 3
GRG tests at Aur Louvicourt2


Appendix A-3
GRG tests at Barrick East Malartic

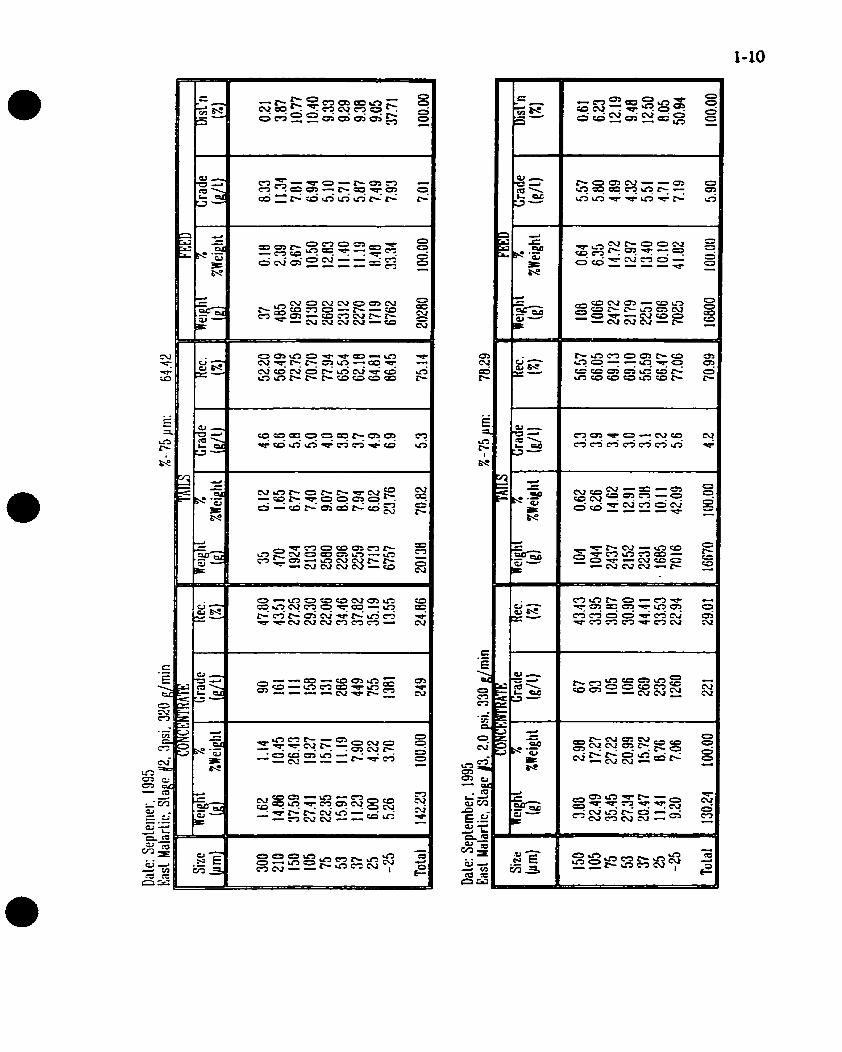

Size (um)
600 420 300 210 1 50 105 75 53 37 25 15
Total O P Yield Grade
Calc.: ICL
East Malartic, Ovcrall Rcsulls 1 ~irsl SLakc: IOOZ -850 pm
rn
l S1aee - Rec.
~ e c o v . Disl'n g/t
kcond Stage: 64.4X -75 pin Slage Rec. Recov. Disl'n g/t
hird Stage: 70.R -75 prn Stage Ikc. hsses Recov. Disl'n dl g/L
-Txr Rccov, g/t
0.383 0.204 0.212 0.373 0.584 0,688 0.759 0.708 O.fl37 0.523 1.162
6.491
ml- Recov. Z
3.6 1.9 2.6 3.5 5.5 6.3 7.1 6.7 7.9 4.9 10.9
61 .O


APPENDIX B Test results of the gravity circuit investigations
Appendix &1 Aur Louvicourt Appeadix B-2 Agnico-Eagle La Ronde Division Appendin B-3 Table tail at Barrick East Malartic AppendUr B4 Cambior's Chimo

Appendu El
Aur Louvicourt


Dale: March 21. 1995 ur Ilou1 I
EL 600 420 300 210 150 1 O5 75 53 37 25 - 25
Tolal -
Rec A
4.55 16,22 37.50 29.01 29.03 4 1.99 42.5 1 46.72 40.92 30.63 23.86
207 302 404 39 1 490 499 688 70 1 780 fil 1 729
Date: March 21, 1995 iriceritrate. 100% -50 rnesh, 3 psi, 430 g/rnin
I T A ~ S ur Inu - &
2 1 O 150 1 OS 75 53 37 25 - 25
Total -
ourt. 30" Knclson i - . . . - . . . I
Grade 1 Hec. 1 Weinht % I Grade I Rec,

ale : March 16, 1995 ur luuvicoiirt. 30" Kiielson Tail. 100% -20 iiicsh, 4 I L
& 600 420 300 210 150 1 O5 75 55 37 25 - 25
Tolal -
Cradc A L
I .O 3.8 5,6 4.2 4.4 6.6 8.6 9.4 10.0 9.8 6.2
7.3 I_
Date: March 17, 1995
Ueieht X I Cradc
! Total 1 112.32 100.00 1 337 1 34.46 1 6242 100,OO 1 11.5 1 65.54

Appendu B 2
Apico-Eagle La Ronde Division

L-Z

111ic;
Sizc III)
600 120 300 210 150 105 75 53 37 2 5 - 25
Total -
~ l c Cyeloiic underllow 31ioiir. 3.0 psi. 59f c m .
-
Grade
15313 100.00 1 17.56 f i t .65
Date: October 20, 1995 p i c o - 1
Size a
600 420 300 210 150 1 O5 75 53 37 25 - 25
Total -
Grade Rec. ( d t ) (Z) (R/ t) (A)
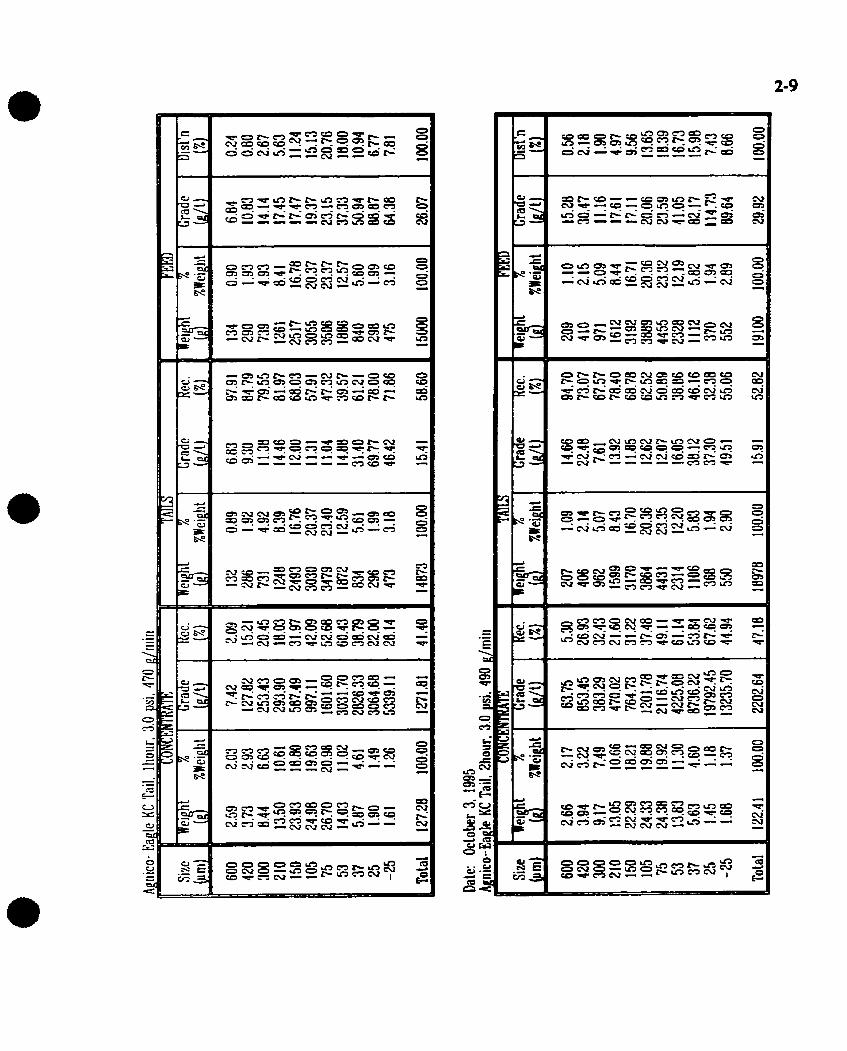

atc: October 3. 1995 p i c u - 1
& 600 420 300 210 150 1 O5 75 53 31 25 - 25
Total I
Cradc 1 Kcc. Grade Rcc. Grade Uist'n
Dale: Oclober 20, 1995 ith 2:l fine silicai. 2.0 psi, SOtl drnin
- , - Beiehl Z
m .
;fMK Crade 1 Rec. Grade Kec.
600 420 300 210 150 1 O5 75 53 37 25 - 25
Total -
Grade Dist'n
Appendix B-3
Table tail at Barrick East Malartic

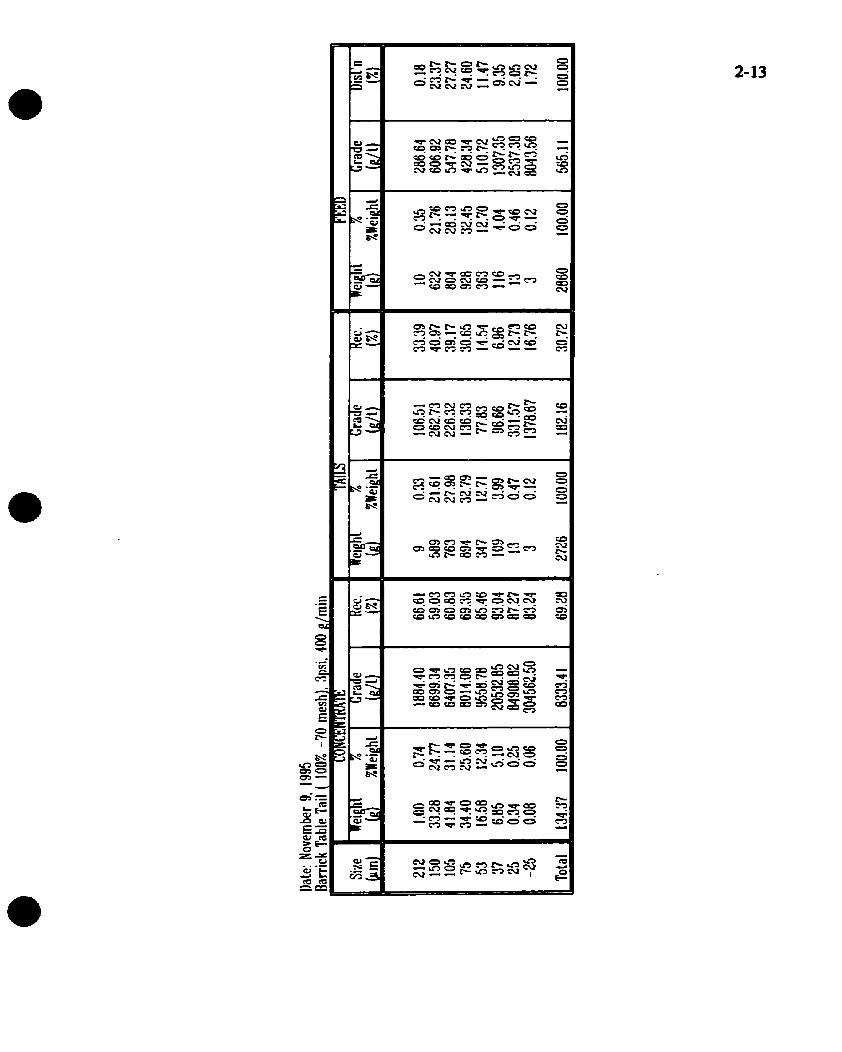
Appendix B-4
Cambior's Chimo
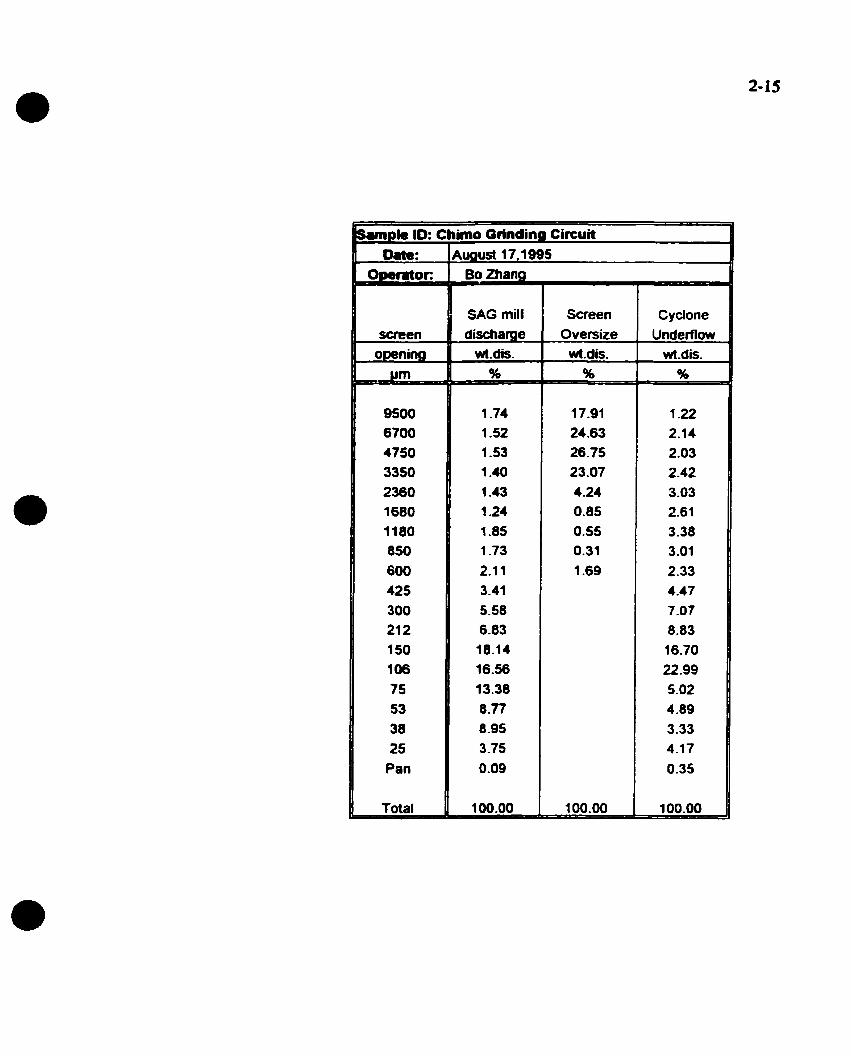
m p l s 10: c Date:
Olwmtoc
m e n opening
9500 6700 4750 3350 2360 1680 1180 850 600 425 300 21 2 150 106 75 53 38 25 Pan
Total
&no Grinding Circuit 4ugust 17,1995
Bo Zhang
SAG mil1 discharge
wt-dis.
Cyclone Undeflow
wt-dis. %
C
1 22 2.14 2.03 2.42 3.03
2.61 3.38 3.01 2.33 4.47 7.07 8.83 16-70 22.99 5.02 4.89 3.33 4.17 0.35
100.00


- Size & 600 4 20 300 210 150 1 O5 '75 53 37 - 37
Tolal -
Dale: Octobcr 10, 1995 Chiino 3
Cradc Rec. Grade A L
I .BO 1.50 4.10 1-15 3.30 1.20 2.05 1 ,?O 2.20 3.20
2.26 -


Residual sum of squares: 14.48856 Final Results
1 Absolute Solids I Pulp Mass Flowrate I I
Stream I Flowrate 1 Meas ( Calc 1 S.D. 1 Adjust
Feed SAG disc Cyclone U1 Cyclone 02 Screen O/S Screen U/S KC30 Tails Cell Conc. Cyclone O/
f Relative Solids 1 Stream I Flowrate I
Feed SAG disc Cyclone U1 Cyclone W 2 Screen O/S Screen U/S RC30 Tails Ce11 Conc. Cyclone O/
I
S i z e 1 Meas = = = = = = P I D = = P I I I = I I I
20 m e s h 1 12.43 30 m e s h i 2.11 40 m e s h 1 3.41 50 m e s h 1 5.58 70 rnesh 1 6 -83
S i z e ===--- ---=====
20 m e s h 30 m e s h 40 m e s h 50 m e s h 70 m e s h
SAG disc Calc f SD,
: t = = = = = r P I I = Z I
13.10 1 0.5 1-50 0 .s 2.98 0.S 4.74 ' 0.5 5.99 / 0 . 5
A d j . r P L = = I I
O. 7* -0.6* -0.4 -0.8* -Osa*
Cyclone U2 I I I I Screen O/S I
Meas 1 Calc 1 SD. 1 A d j . I I Meas 1 Calc SD. 1 A d j . :IIIZI1=LIZl===ttfltfttPr*==========================s=======
19.84 1 19-SO 1 0.5 1 -0.3 1 1 98-31 1 98.32 1 0 . S 0.0 1 2.33 1 2.05 0.5 ' -0.3 0.90 1 0.95 1 0.5 ( 0.0 f
4.34 0 1 0.60 1 0.61 1 0.3 ' 0.0 1 :::: 1 6.90 1 0.5 , -0.2 1 , 0.10 1 0.10 1 0.1 1 0.0 8.83 1 8.77 0.5 f -0.1 1 1 0 . 00 f 0.00 1 0.1 1 0.0 f
I Screen U/S I I KC30 Tails I 1 1
Sise j Meas 1 Calc 1 SD. 1 A d j . 1 1 Meas 1 Calc 1 SD. A d 1 - - - - - - - - - - - - - - -
2 0 m e s h 1 9.90 110.03 1 0 . 5 - 1 0.1 1 1 10.10 110.03 10.5 1-0.1 i 30 m e s h ' 1.70. 1 2.18 1 0.5 1 0.5 , 1 2.20 1 2.18 ' 0.5 1 -0.0 f 40 m e s h j 4.50 1 4.78 1 0.5 1 0.3 1 : 1.80 , 4-76 1 0.5 1 -0.0 1 50 m e s h 1 7.30 1 7.72 1 0 . 5 1 0.4 1 1 7.70 1 7.72 1 0.5 I 0.0 1 70 m e s h 1 9.40 1 9.82 1 0.5 1 0.4 ( 1 9.90 1 9.82 1 0.5 1 -0.1 1

- - - -
20 mesh 1 0.00 ) -0.00 1 0.1 - 0 . 0 1 30 mesh 1 0.00 1 0.00 1 0.1 0 . 0 1 40 mesh 1 0.00 1 0.00 0.1 ( 0.0 , SO mesh 1 0.00 1 0.00 1 0.1 1 0 . 0 1 70 mesh 1 0.10 1 0.11 1 0-1 0.0 1


![arXiv:1405.1692v1 [hep-th] 7 May 2014 · that the standard quantum formalism is valid for studying particles and fundamental interactions, provided one of these interactions, gravity,](https://static.fdocuments.net/doc/165x107/5b6e76347f8b9a3b388e6402/arxiv14051692v1-hep-th-7-may-2014-that-the-standard-quantum-formalism-is.jpg)