Chapter 4 - Probability Tools and Techniques 4 - Probability...- 3 - Chapter 4 - Probability Tools...
44
- 1 - Chapter 4 - Probability Tools and Techniques.wpd Rev. 13 vgs/ps Oct 12, 2009 Chapter 4 - Probability Tools and Techniques Introduction Chapter Content This chapter presents basic probability tools and techniques, drawing heavily from McCormick 1 for the basic probability theory. Alan Monier guided the bulk of the remainder. Paul Santamaura contributed to improving the chapter. The objective of this chapter is to provide the basic probability tools and techniques needed to explore reactor safety analysis. This will allow the quantification of the concepts and designs developed in the rest of the course. Chapter Layout First, the general rules of probability (AND and OR rules) and Bayes Equation are introduced but, for the most part in this course, we will rely on the approximations of rare and independent events. Time dependent systems are addressed, covering failure rates, repair, continuous operation, and demand systems. We encounter a simple shutdown system, illustrating the concept of testing to increase system availability. We also consider the basic ‘2 out of 3’ system so prevalent in reactor safety systems. By way of contrast to the shutdown system, which is a demand type system, the emergency core cooling system is also examined as an example of a demand system with a mission time.
Transcript of Chapter 4 - Probability Tools and Techniques 4 - Probability...- 3 - Chapter 4 - Probability Tools...
- 1 -
Chapter 4 - Probability Tools and Techniques.wpd Rev. 13 vgs/psOct 12, 2009
Chapter 4 - Probability Tools and Techniques
Introduction
Chapter Content
This chapter presents basic probability tools and techniques, drawing heavily from McCormick1 for thebasic probability theory. Alan Monier guided the bulk of the remainder. Paul Santamaura contributed toimproving the chapter.
The objective of this chapter is to provide the basic probability tools and techniques needed to explorereactor safety analysis. This will allow the quantification of the concepts and designs developed in therest of the course.
Chapter Layout
First, the general rules of probability (AND and OR rules) and Bayes Equation are introduced but, forthe most part in this course, we will rely on the approximations of rare and independent events. Timedependent systems are addressed, covering failure rates, repair, continuous operation, and demandsystems.
We encounter a simple shutdown system, illustrating the concept of testing to increase systemavailability. We also consider the basic ‘2 out of 3’ system so prevalent in reactor safety systems. Byway of contrast to the shutdown system, which is a demand type system, the emergency core coolingsystem is also examined as an example of a demand system with a mission time.
- 2 -
Chapter 4 - Probability Tools and Techniques.wpd Rev. 13 vgs/psOct 12, 2009
(1)
(2)
(3)
(4)
(5)
Definitions and Rules
First, you may want to refresh your memory with the basic rules of Boolean algebra in Appendix 3.
If event A occurs x times out of n repeated experiments then:
In other words, an event must either occur or not occur - there is no third possibility..
The intersection of 2 events, A1 and A2, is denoted:
A1A2 means that both events occur, so P(A1A2) is the probability that both events occur.
The conditional probability P (A1 | A2) means the probability of A1 given that A2 has occurred.
The product rule for probabilities states:
For example, if A1 is the probability that part 1 fails and A2 is the probability that part 2 fails thenP(A1 A2) = probability that both part 1 fails and part 2 fails
= probability that part 2 fails and (probability that part 1 fails given that part 2 fails)
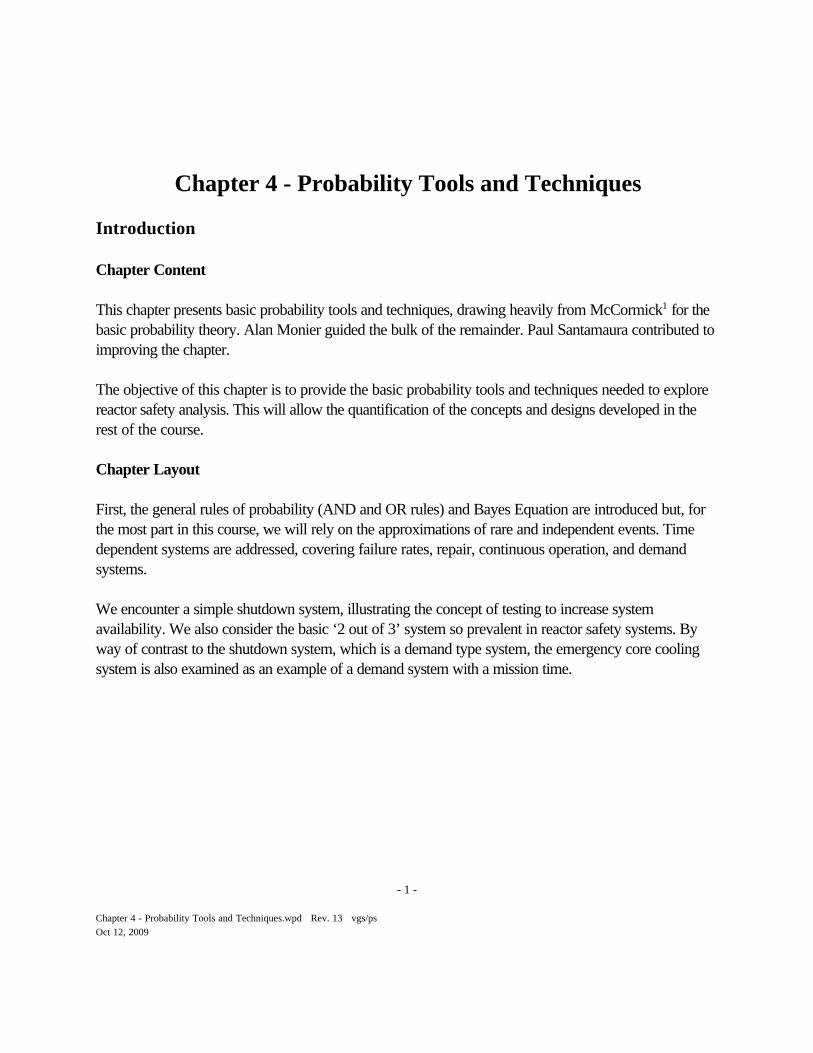
The attached Figure 4-1 shows this graphically; yellow represent all events; green those events with
- 3 -
Chapter 4 - Probability Tools and Techniques.wpd Rev. 13 vgs/psOct 12, 2009
(7)
(8)
Figure 4-2 - Probability of Either of two Events
(6)
outcome A1; blue with outcome A2; red, with outcome both A1 and A2.
See Appendix 1 for an example.
If the failures are independent,
P(A2 | A1) = P(A2).
This can be extended to give:
If events are independent:
The union of two events is denoted:
This means the cases where either event occurs, including the cases where both events occur.
We have:
Figure 4-1 - Probability of Both of two Events
- 4 -
Chapter 4 - Probability Tools and Techniques.wpd Rev. 13 vgs/psOct 12, 2009
(9)
(10)
(11)
(12)
(13)
(14)
as shown in Figure 4-2. The reason for subtracting P(A1A2) is because what you want is the total areaencompassed by the combination of the blue and green ovals in the diagram. If you just add P(A1) andP(A2), you count the intersection where both events occur (in red) twice. So you have to subtract oneof them away.
In general:
If events are independent:
See Appendix 2 for an example.
Rare events approximation means P(An)<<1, and assuming they are independent:
and we previously had (equation 7):
The Bayes Equation
Given an event or hypothesis, B, and An mutually exclusive events or hypotheses (n=1, 2....N):
- 5 -
Chapter 4 - Probability Tools and Techniques.wpd Rev. 13 vgs/psOct 12, 2009
(15)
(16)
(17)
(18)
Now, since the events, An are mutually exclusive:
Multiplying by P(B):
Substituting (17) into (15):
So if we know P(B|An) then we can calculate P(An |B). This is an important result because it enablesyou to “reverse” the order of information. This is especially useful for analysing rare events.
Example - Pipe Inspection
Suppose you are radiographing a Class I pipe for a defect. You know from past experience that thelikelihood of a defect is one per 100,000 radiographs. You also know that the likelihood of theinstrument indicating a defect when there is no defect (false positive) is 1%, and the likelihood ofindicating a defect when there is a defect is 99%. Your test indicates a defect. What is the probabilitythat the pipe actually has a defect?
Solution:
Apply Bayes theorem to two events:A: pipe has a defect, so P(A) = 0.00001
a This is a bit of a simplification using the fact that P(A) is small.. ActuallyP(B) = P(B|A) P(A) + P(B|notA) P(notA)
= 0.99 x .00001 + 0.01 x 0.99999 = 0.0100098
or approx = 0.01 as statedIn English, the first term is the 99% chance of detecting the defect in the one pipe in 100,000 that has thedefect; plus the second term, which is the 1% chance of indicating a false positive in the remaining 99,999pipes out of 100,000.
- 6 -
Chapter 4 - Probability Tools and Techniques.wpd Rev. 13 vgs/psOct 12, 2009
B: instrument says that pipe has a defect, so P(B)=0.01a
B|A: instrument says pipe has a defect when it has a defect, so P(B|A) = 0.99
What we want is P(A|B), the probability that the pipe actually has a defect when the instrument says ithas one.
Using Bayes theorem:
P(A|B) = [P(B|A)][P(A)]/P(B)
= 0.99 x 0.00001 / 0.01
= 0.00099
Comment:
This seems counterintuitive and suggests the test is not very good in detecting defects, despite theinstrument’s good accuracy rate. However the fact that the defect is so rare (we need about a hundredthousand samples before we have chance at seeing a real positive) magnifies the small false positive rateso that most positive tests are false positives.
This is quite important in medical tests - even a very accurate test for a rare cancer will often give farmore false positives than real ones.
- 7 -
Chapter 4 - Probability Tools and Techniques.wpd Rev. 13 vgs/psOct 12, 2009
(19)
(20)
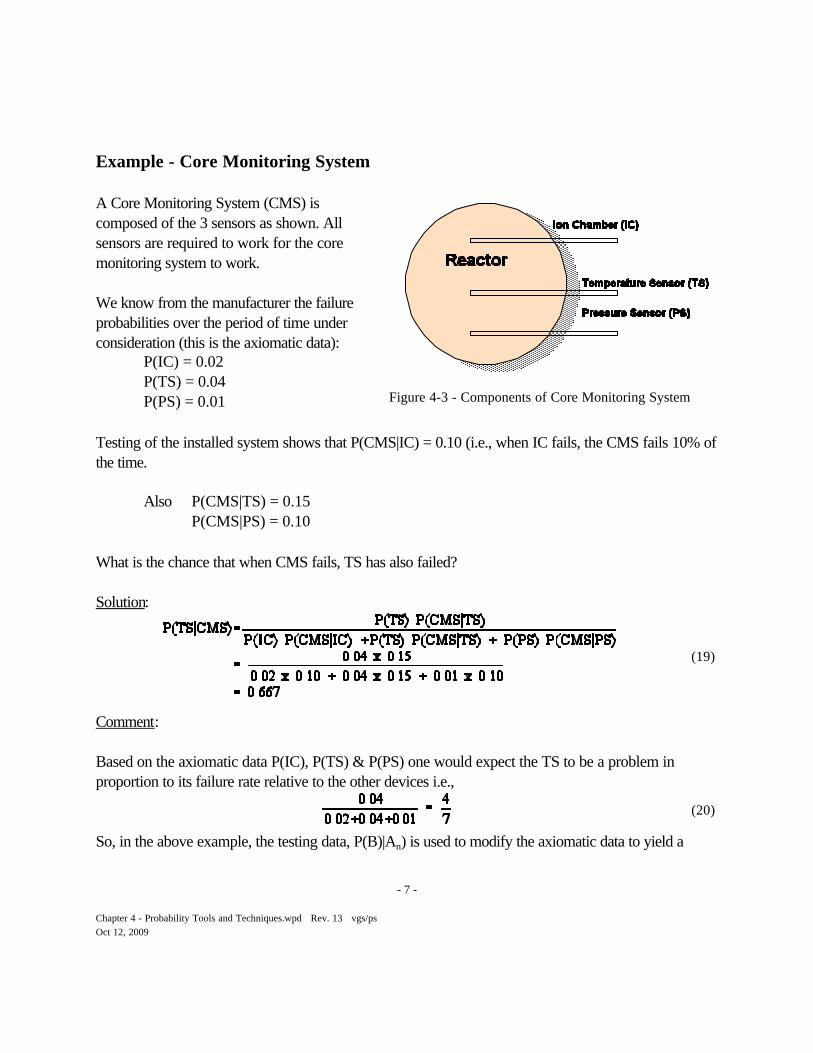
Figure 4-3 - Components of Core Monitoring System
Example - Core Monitoring System
A Core Monitoring System (CMS) iscomposed of the 3 sensors as shown. Allsensors are required to work for the coremonitoring system to work.
We know from the manufacturer the failureprobabilities over the period of time underconsideration (this is the axiomatic data):
P(IC) = 0.02 P(TS) = 0.04P(PS) = 0.01
Testing of the installed system shows that P(CMS|IC) = 0.10 (i.e., when IC fails, the CMS fails 10% ofthe time.
Also P(CMS|TS) = 0.15 P(CMS|PS) = 0.10
What is the chance that when CMS fails, TS has also failed?
Solution:
Comment:
Based on the axiomatic data P(IC), P(TS) & P(PS) one would expect the TS to be a problem inproportion to its failure rate relative to the other devices i.e.,
So, in the above example, the testing data, P(B)|An) is used to modify the axiomatic data to yield a
- 8 -
Chapter 4 - Probability Tools and Techniques.wpd Rev. 13 vgs/psOct 12, 2009
revised relative frequency of sensor failure, given a system failure, by P(An|B). This is called aposteriori probability.
- 9 -
Chapter 4 - Probability Tools and Techniques.wpd Rev. 13 vgs/psOct 12, 2009
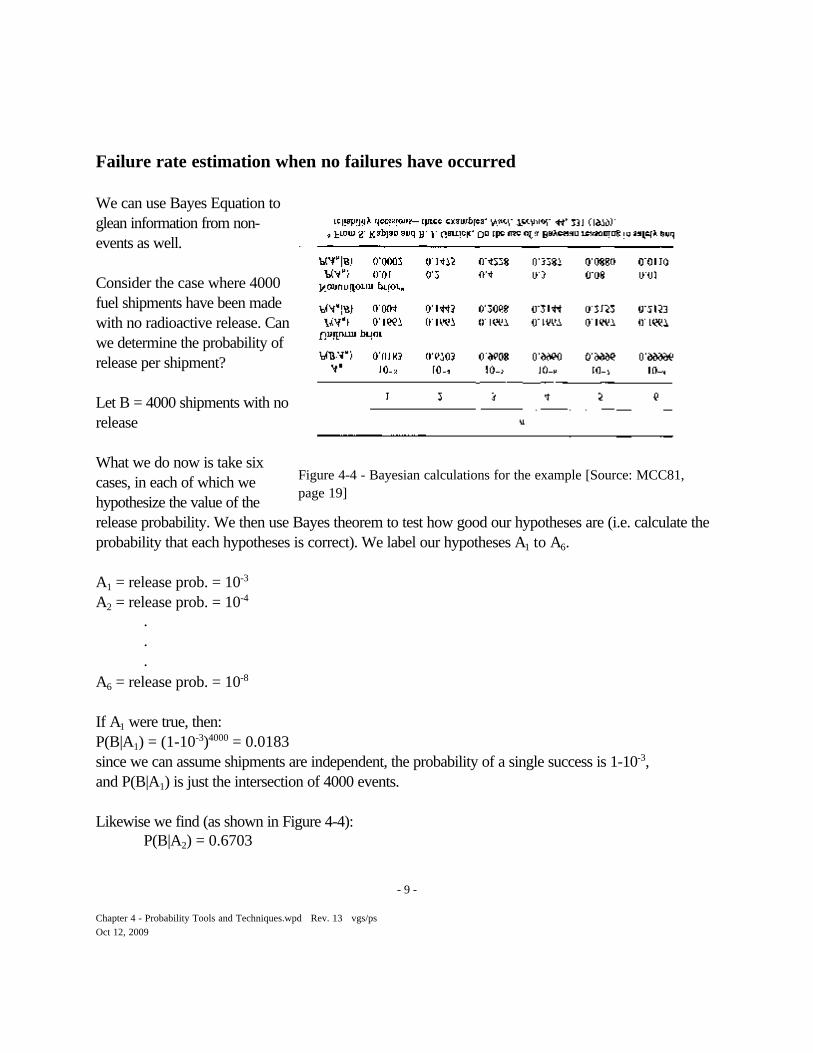
Figure 4-4 - Bayesian calculations for the example [Source: MCC81,page 19]
Failure rate estimation when no failures have occurred
We can use Bayes Equation toglean information from non-events as well.
Consider the case where 4000fuel shipments have been madewith no radioactive release. Canwe determine the probability ofrelease per shipment?
Let B = 4000 shipments with norelease
What we do now is take sixcases, in each of which wehypothesize the value of therelease probability. We then use Bayes theorem to test how good our hypotheses are (i.e. calculate theprobability that each hypotheses is correct). We label our hypotheses A1 to A6.
A1 = release prob. = 10-3
A2 = release prob. = 10-4
.
.
.A6 = release prob. = 10-8
If A1 were true, then:P(B|A1) = (1-10-3)4000 = 0.0183 since we can assume shipments are independent, the probability of a single success is 1-10-3, and P(B|A1) is just the intersection of 4000 events.
Likewise we find (as shown in Figure 4-4):P(B|A2) = 0.6703
- 10 -
Chapter 4 - Probability Tools and Techniques.wpd Rev. 13 vgs/psOct 12, 2009
(21)
P(B|A3) = 0.9608
If we know P(A1),...P(A6) we could calculate P(An|B) or the probability of our statement An beingactually true. If we assume P(An) = 1/N = 1/6, we find that P(A1|B) = 0.04, ie, it is not too likely. If weuse a more likely P(An) we see that P(An|B) is adjusted downwards and we conclude that the failurerate is significantly less than 10-3. The practical application of this is in assigning a frequency - e.g., largepipe break - in a Probabilistic Safety analysis, when none have actually occurred and all we have is thenumber of reactor-years of experience.
Note that one of the criticisms of Bayes theorem when used this way is that the answer depends on theappropriateness of the initial hypotheses. If there is little data and you put in strange hypotheses, you getback strange answers.
Probability Distributions
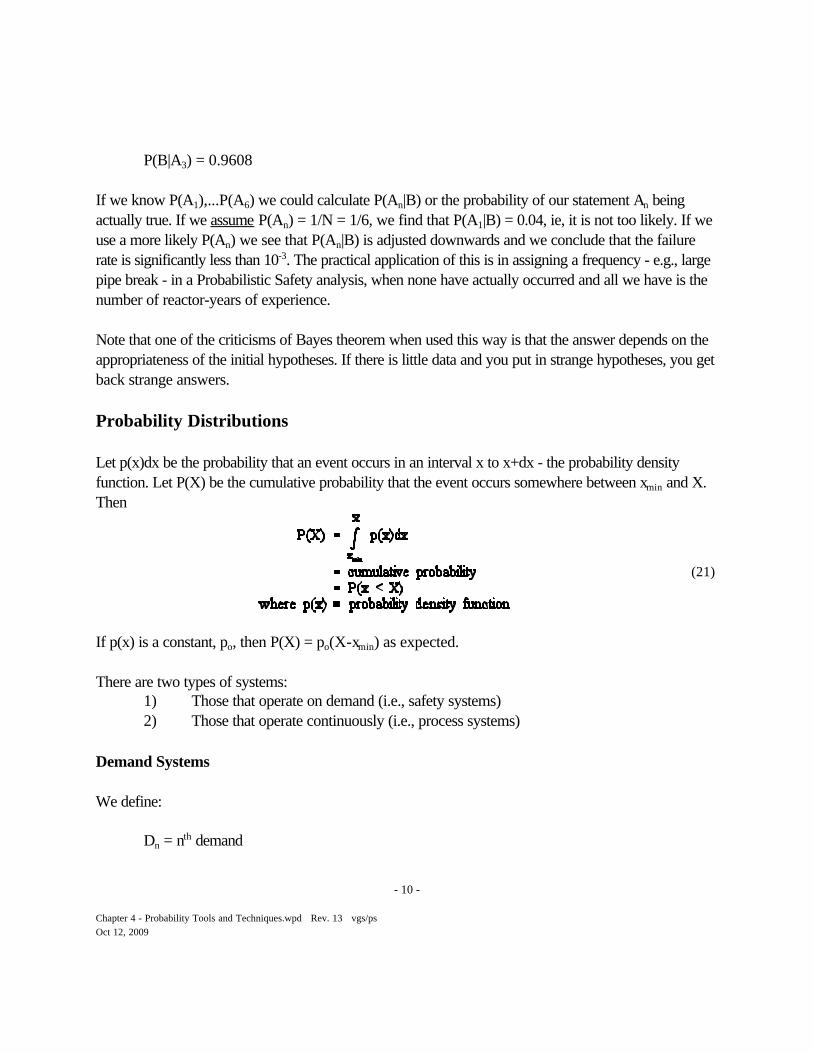
Let p(x)dx be the probability that an event occurs in an interval x to x+dx - the probability densityfunction. Let P(X) be the cumulative probability that the event occurs somewhere between xmin and X.Then
If p(x) is a constant, po, then P(X) = po(X-xmin) as expected.
There are two types of systems:1) Those that operate on demand (i.e., safety systems)2) Those that operate continuously (i.e., process systems)
Demand Systems
We define:
Dn = nth demand
- 11 -
Chapter 4 - Probability Tools and Techniques.wpd Rev. 13 vgs/psOct 12, 2009
(22)
(23)
(24)
(25)
(26)
P(Dn) = probability of success on demand n
Wn = case where system works for each demand up to and including demand n.
What is the probability that it works for n-1 demands and fails on demand n?
So
If all demands are alike and independent, this reduces to:
Data for demand failure is often published using the symbol Qd.
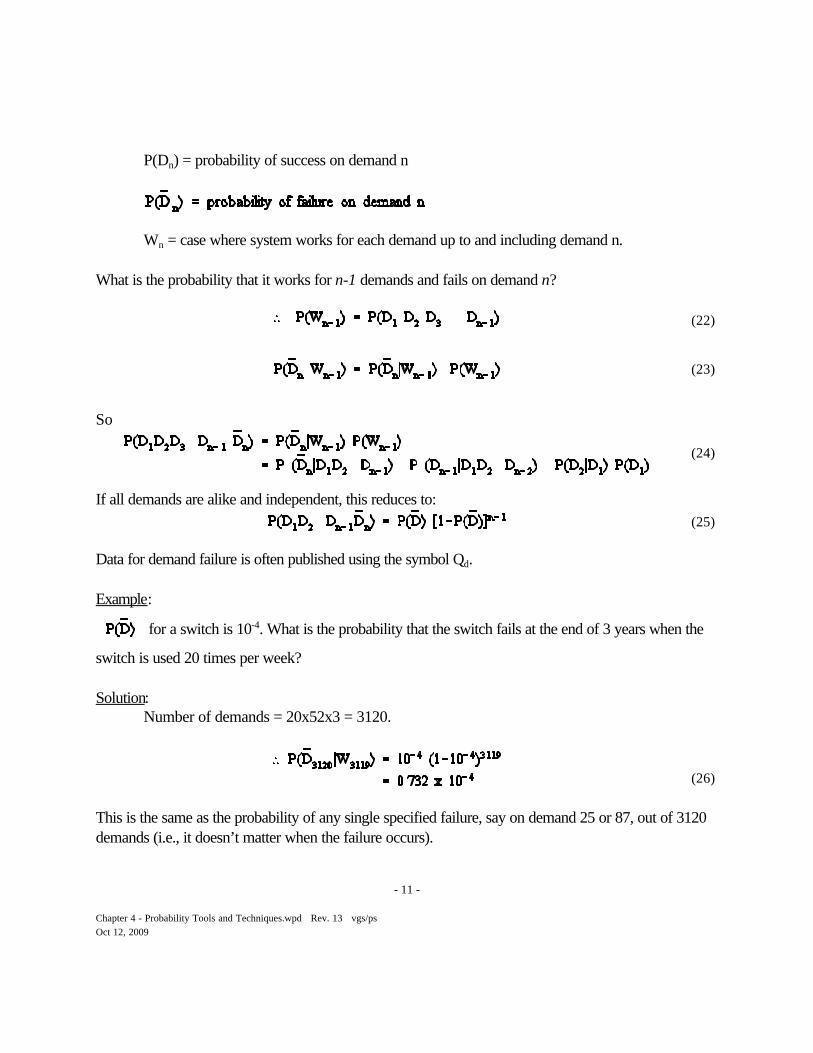
Example:
for a switch is 10-4. What is the probability that the switch fails at the end of 3 years when the
switch is used 20 times per week?
Solution:Number of demands = 20x52x3 = 3120.
This is the same as the probability of any single specified failure, say on demand 25 or 87, out of 3120demands (i.e., it doesn’t matter when the failure occurs).

- 12 -
Chapter 4 - Probability Tools and Techniques.wpd Rev. 13 vgs/psOct 12, 2009
If the switch were repaired immediately upon any failure, then the probability that it would fail once atanytime within the 3 years is just 3120 times the probability that it would fail at any specified demand,i.e., 3120 x 0.732 x 10-4 = 0.228.
- 13 -
Chapter 4 - Probability Tools and Techniques.wpd Rev. 13 vgs/psOct 12, 2009
(27)
(28)
(29)
(30)
(31)
(32)
(33)
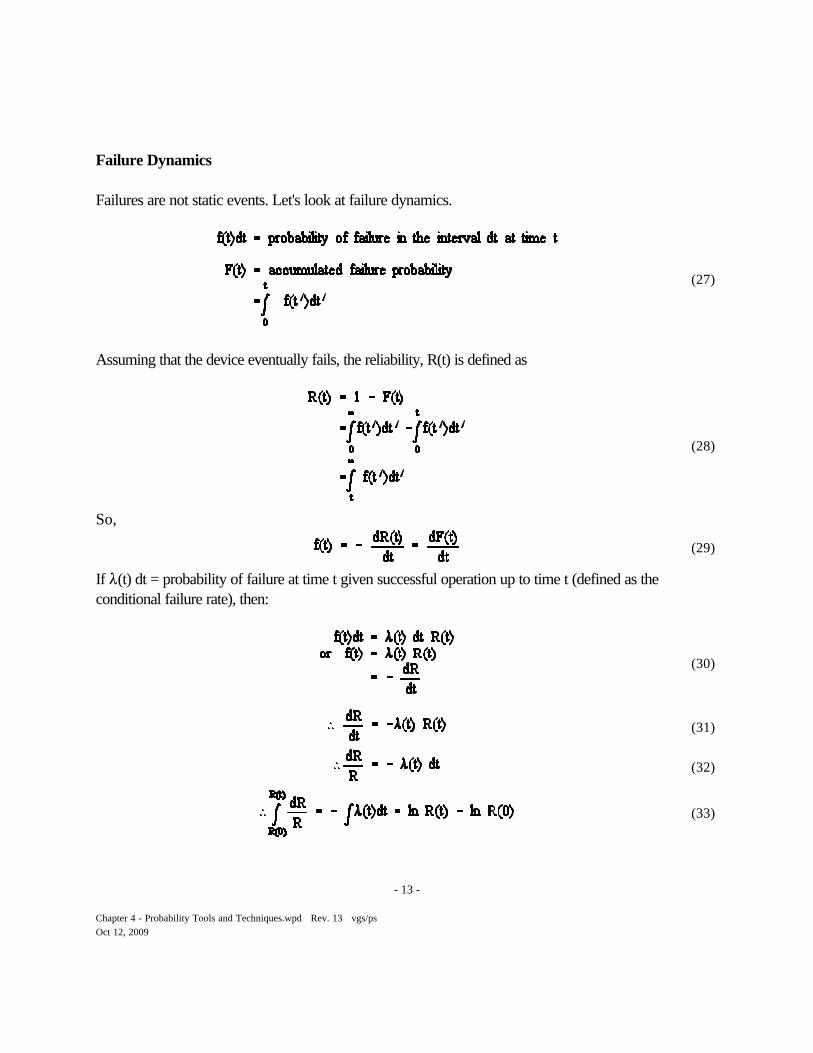
Failure Dynamics
Failures are not static events. Let's look at failure dynamics.
Assuming that the device eventually fails, the reliability, R(t) is defined as
So,
If 8(t) dt = probability of failure at time t given successful operation up to time t (defined as theconditional failure rate), then:
- 14 -
Chapter 4 - Probability Tools and Techniques.wpd Rev. 13 vgs/psOct 12, 2009
(34)
(35)
(36)
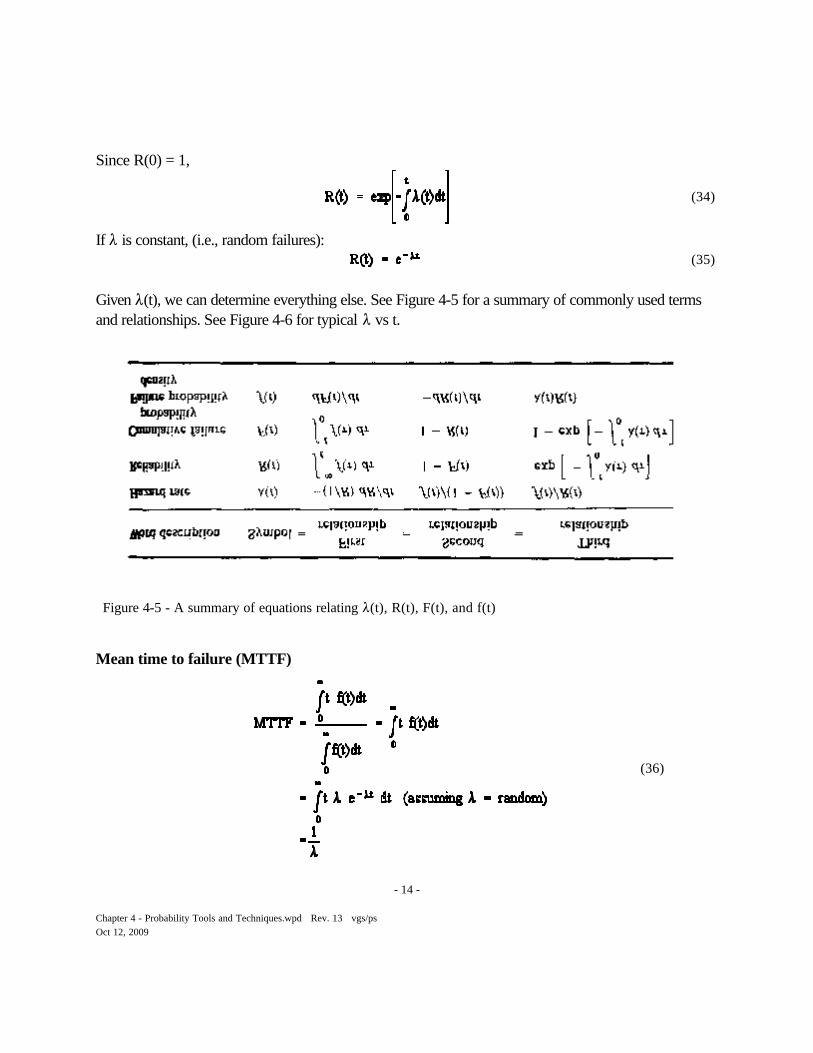
Figure 4-5 - A summary of equations relating 8(t), R(t), F(t), and f(t)
Since R(0) = 1,
If 8 is constant, (i.e., random failures):
Given 8(t), we can determine everything else. See Figure 4-5 for a summary of commonly used termsand relationships. See Figure 4-6 for typical 8 vs t.
Mean time to failure (MTTF)
- 15 -
Chapter 4 - Probability Tools and Techniques.wpd Rev. 13 vgs/psOct 12, 2009
(37)
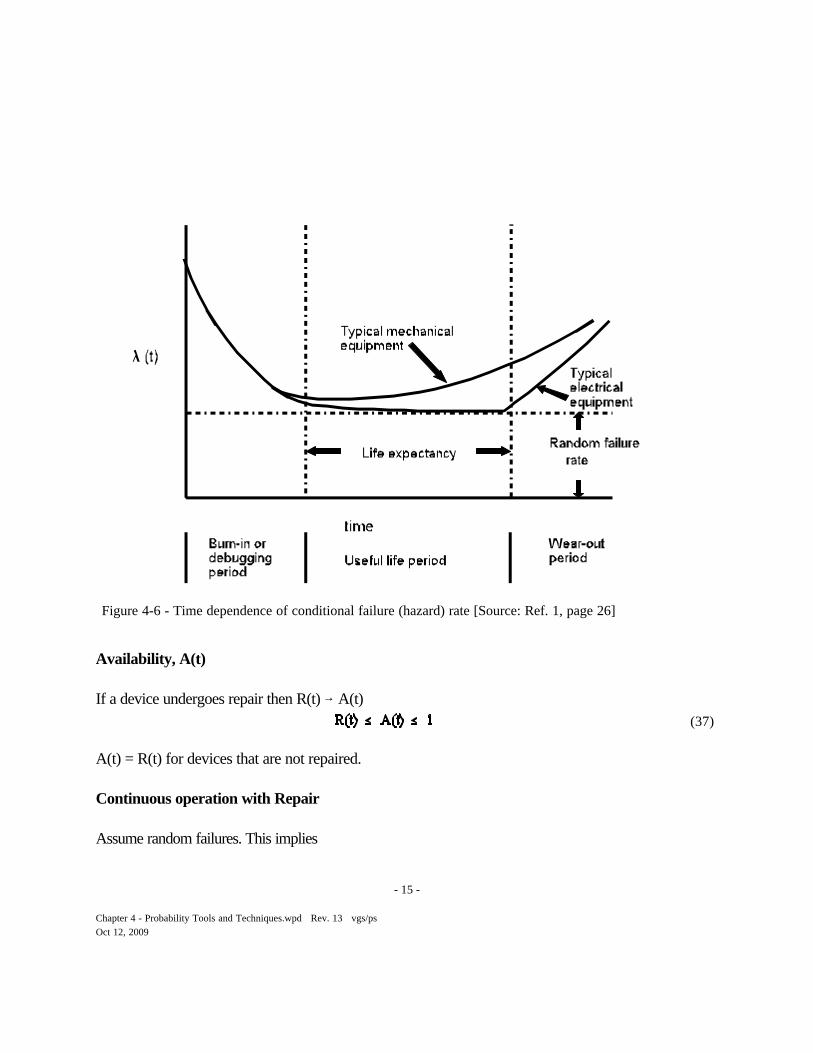
Figure 4-6 - Time dependence of conditional failure (hazard) rate [Source: Ref. 1, page 26]
Availability, A(t)
If a device undergoes repair then R(t) 6 A(t)
A(t) = R(t) for devices that are not repaired.
Continuous operation with Repair
Assume random failures. This implies
- 16 -
Chapter 4 - Probability Tools and Techniques.wpd Rev. 13 vgs/psOct 12, 2009
(38)
(39)
(40)
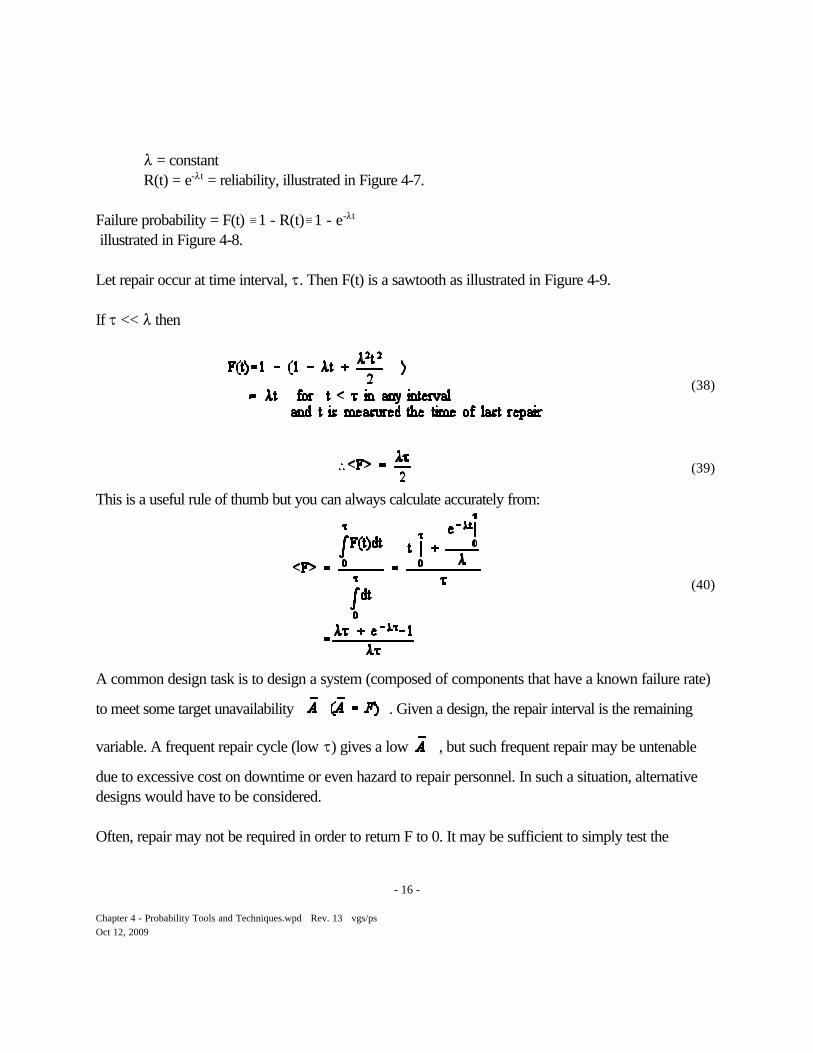
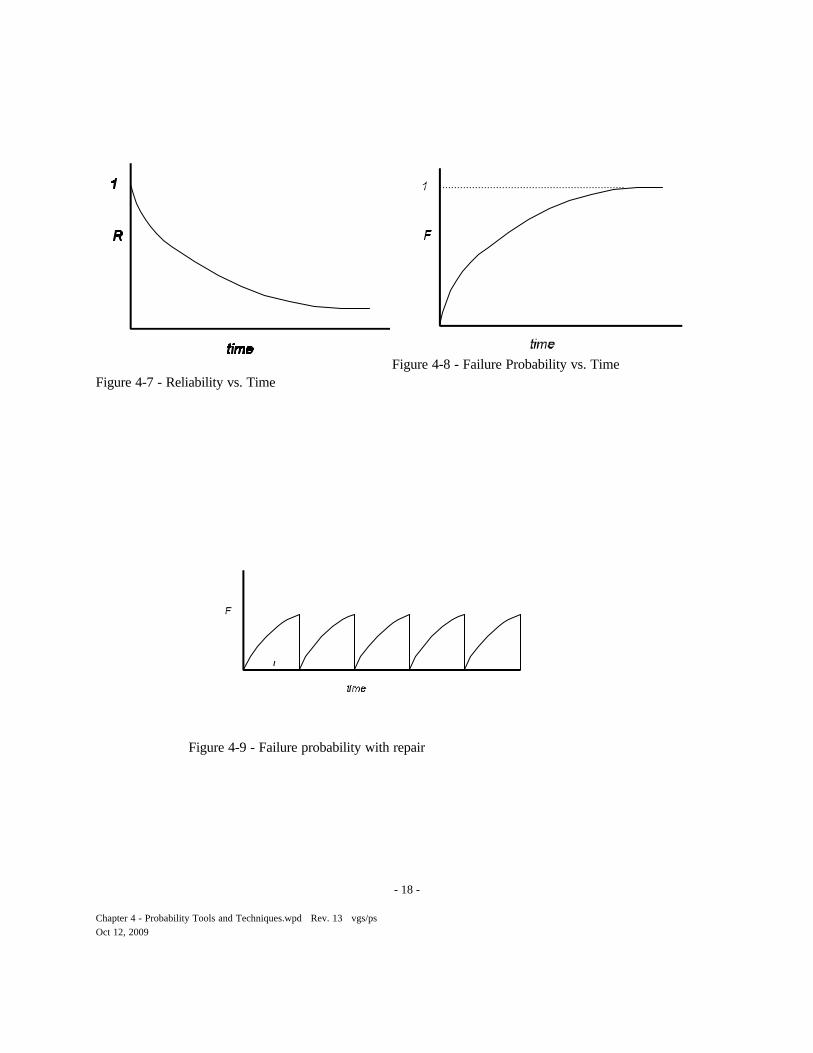
8 = constantR(t) = e-8t = reliability, illustrated in Figure 4-7.
Failure probability = F(t) /1 - R(t)/1 - e-8t
illustrated in Figure 4-8.
Let repair occur at time interval, J. Then F(t) is a sawtooth as illustrated in Figure 4-9.
If J << 8 then
This is a useful rule of thumb but you can always calculate accurately from:
A common design task is to design a system (composed of components that have a known failure rate)
to meet some target unavailability . Given a design, the repair interval is the remaining
variable. A frequent repair cycle (low J) gives a low , but such frequent repair may be untenable
due to excessive cost on downtime or even hazard to repair personnel. In such a situation, alternativedesigns would have to be considered.
Often, repair may not be required in order to return F to 0. It may be sufficient to simply test the

- 17 -
Chapter 4 - Probability Tools and Techniques.wpd Rev. 13 vgs/psOct 12, 2009
components to ensure that they are available. This is usually the case for “demand” systems.
- 18 -
Chapter 4 - Probability Tools and Techniques.wpd Rev. 13 vgs/psOct 12, 2009
Figure 4-7 - Reliability vs. TimeFigure 4-8 - Failure Probability vs. Time
Figure 4-9 - Failure probability with repair
- 19 -
Chapter 4 - Probability Tools and Techniques.wpd Rev. 13 vgs/psOct 12, 2009
(41)
(42)
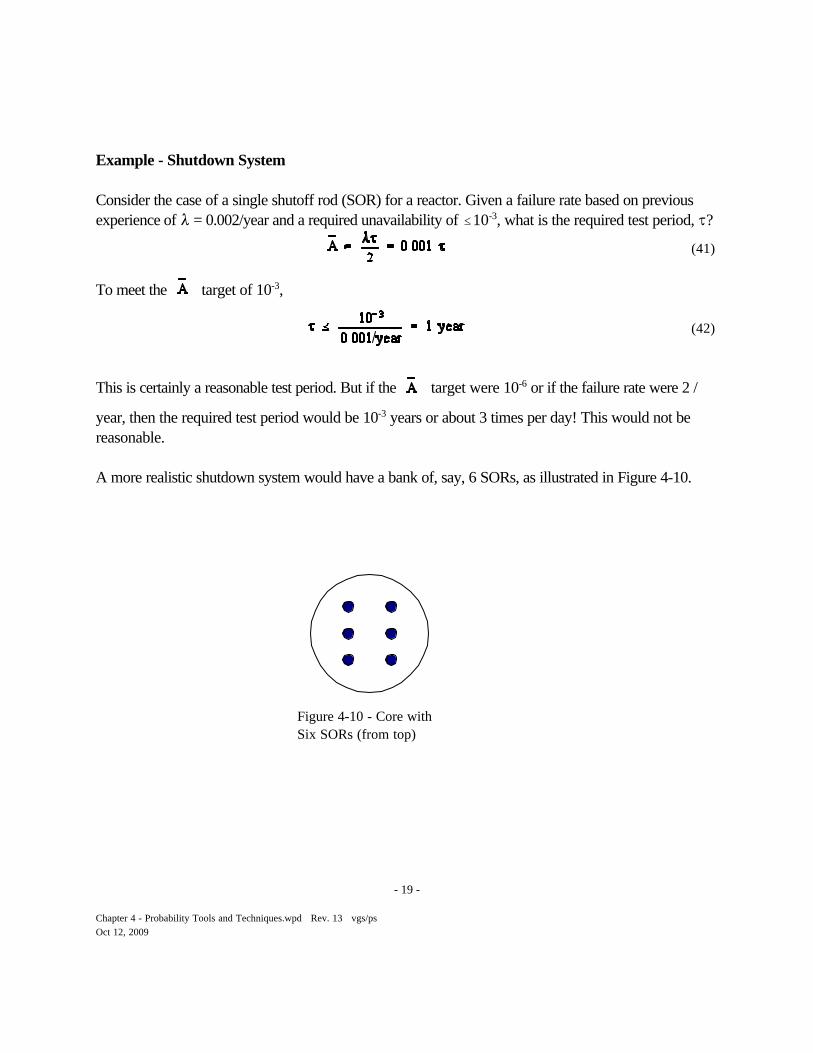
Figure 4-10 - Core withSix SORs (from top)
Example - Shutdown System
Consider the case of a single shutoff rod (SOR) for a reactor. Given a failure rate based on previousexperience of 8 = 0.002/year and a required unavailability of #10-3, what is the required test period, J?
To meet the target of 10-3,
This is certainly a reasonable test period. But if the target were 10-6 or if the failure rate were 2 /
year, then the required test period would be 10-3 years or about 3 times per day! This would not bereasonable.
A more realistic shutdown system would have a bank of, say, 6 SORs, as illustrated in Figure 4-10.
- 20 -
Chapter 4 - Probability Tools and Techniques.wpd Rev. 13 vgs/psOct 12, 2009
Event # rodsdrop
# rods failto drop
E0 6 0
E1 5 1
E2 4 2
E3 3 3
E4 2 4
E5 1 5
E6 0 6
Table 4-1 - SDS event possibilities
(43)
(44)
(46)
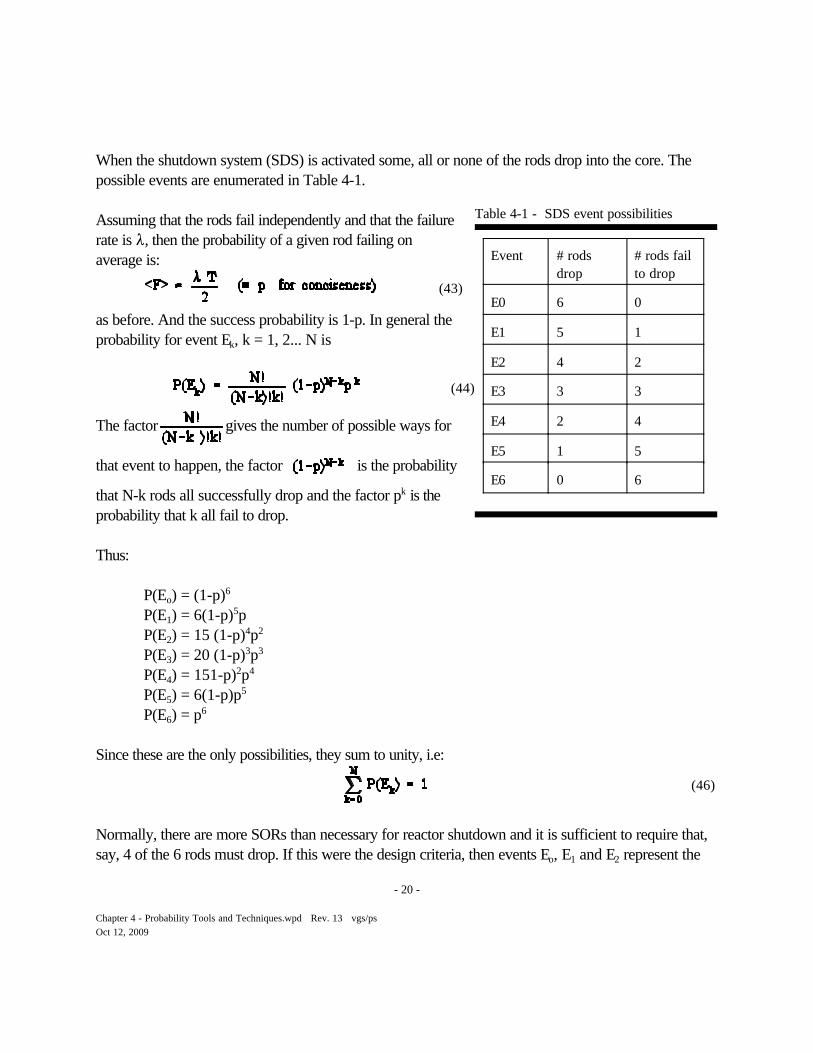
When the shutdown system (SDS) is activated some, all or none of the rods drop into the core. Thepossible events are enumerated in Table 4-1.
Assuming that the rods fail independently and that the failurerate is 8, then the probability of a given rod failing onaverage is:
as before. And the success probability is 1-p. In general theprobability for event Ek, k = 1, 2... N is
The factor gives the number of possible ways for
that event to happen, the factor is the probability
that N-k rods all successfully drop and the factor pk is theprobability that k all fail to drop.
Thus:
P(Eo) = (1-p)6
P(E1) = 6(1-p)5pP(E2) = 15 (1-p)4p2
P(E3) = 20 (1-p)3p3
P(E4) = 151-p)2p4
P(E5) = 6(1-p)p5
P(E6) = p6
Since these are the only possibilities, they sum to unity, i.e:
Normally, there are more SORs than necessary for reactor shutdown and it is sufficient to require that,say, 4 of the 6 rods must drop. If this were the design criteria, then events Eo, E1 and E2 represent the
- 21 -
Chapter 4 - Probability Tools and Techniques.wpd Rev. 13 vgs/psOct 12, 2009
(47)
(48)
successful deployment of the SDS. Events E3 6 E6 represent system failures.
The system unavailability for a 4 out of 6 criterion is thus:
Given a 8 and an assumed J, the is calculated and compared to the required unavailability.
The J is then adjusted until the target (say 10-3) is met. For a 8 of, say 0.02/year, we find that
is 2 x10⁻⁵ for a J of 1 year. Thus testing every year is more than enough for this design to meet the
unavailability target.
The above assumes that, when testing occurs, any deficiencies are immediately and instantaneouslyrepaired so that the “clock” is effectively reset and the failure probability is reset to zero. However,repairs cannot usually be made right away. The plant will have to operate with less than 6 SORsavailable and the unavailability target must still be met.
For instance, assume that the operator finds that one rod fails the test and has to be declared “out ofservice”. The above calculation needs to be repeated based on a 4 out of 5 criterion rather than a 4 outof 6.
Thus:
A J of 1 year gives = 0.00098, which just meets the target of 10-3.
We continue in this way by also considering the case where 2 rods fail their test and are taken out ofservice. Now the SDS must operate on a 4 out of 4 basis. All remaining rods must drop. In this case
- 22 -
Chapter 4 - Probability Tools and Techniques.wpd Rev. 13 vgs/psOct 12, 2009
Case J (per year)
Operator Action
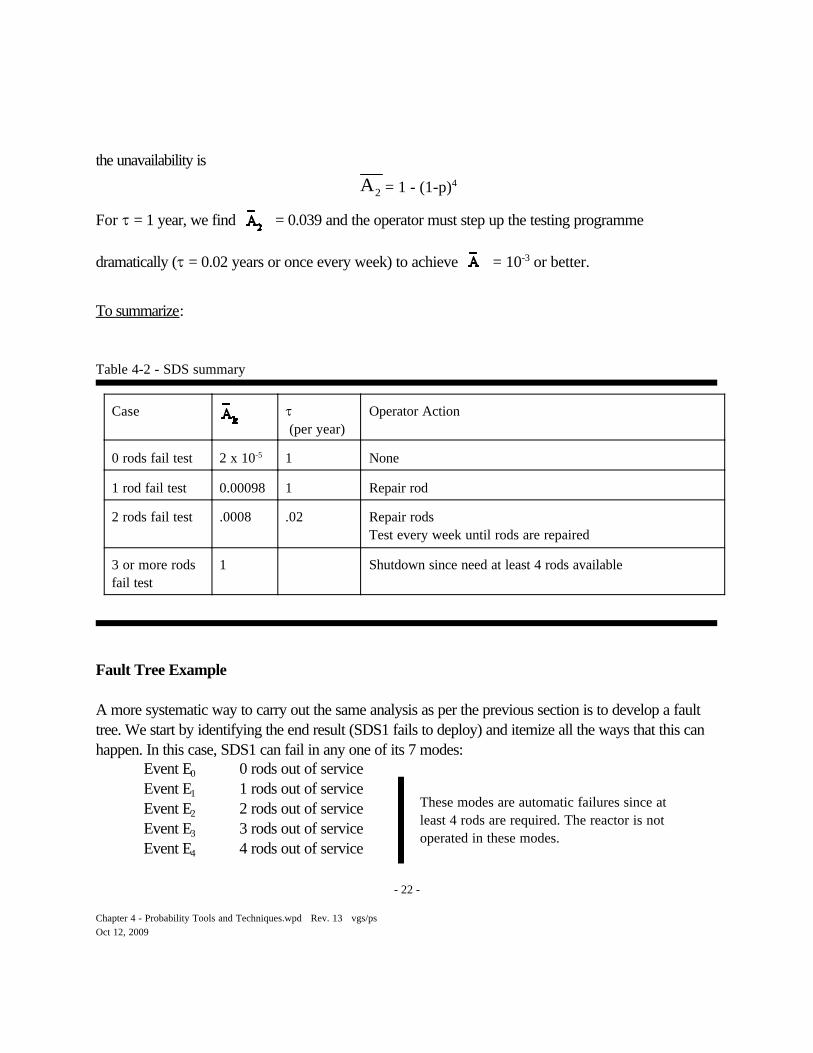
0 rods fail test 2 x 10⁻⁵ 1 None
1 rod fail test 0.00098 1 Repair rod
2 rods fail test .0008 .02 Repair rods Test every week until rods are repaired
3 or more rodsfail test
1 Shutdown since need at least 4 rods available
Table 4-2 - SDS summary
These modes are automatic failures since atleast 4 rods are required. The reactor is notoperated in these modes.
the unavailability is
= 1 - (1-p)4A2
For J = 1 year, we find = 0.039 and the operator must step up the testing programme
dramatically (J = 0.02 years or once every week) to achieve = 10-3 or better.
To summarize:
Fault Tree Example
A more systematic way to carry out the same analysis as per the previous section is to develop a faulttree. We start by identifying the end result (SDS1 fails to deploy) and itemize all the ways that this canhappen. In this case, SDS1 can fail in any one of its 7 modes:
Event E0 0 rods out of serviceEvent E1 1 rods out of serviceEvent E2 2 rods out of serviceEvent E3 3 rods out of serviceEvent E4 4 rods out of service
- 23 -
Chapter 4 - Probability Tools and Techniques.wpd Rev. 13 vgs/psOct 12, 2009
O R
A B
C
O R
A B
C
Figure 4-11 - OR Gate
A N D
A B
C
A N DA N D
A B
C
Figure 4-12 - AND Gate
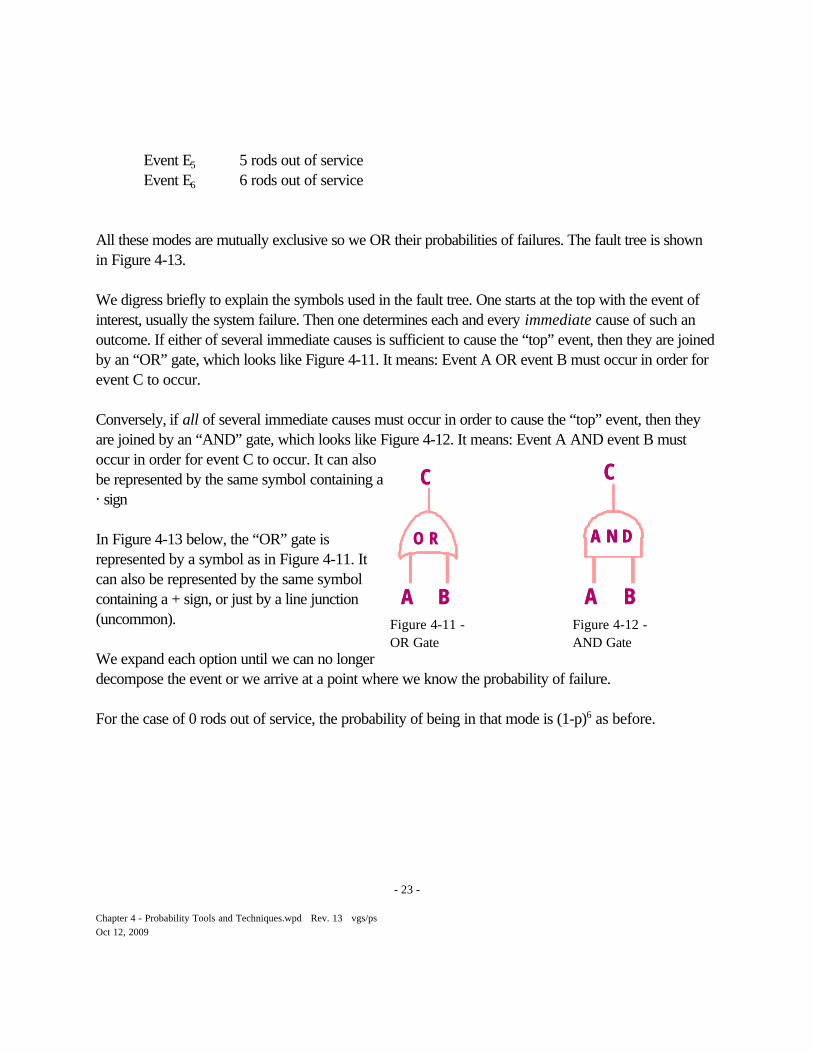
Event E5 5 rods out of serviceEvent E6 6 rods out of service
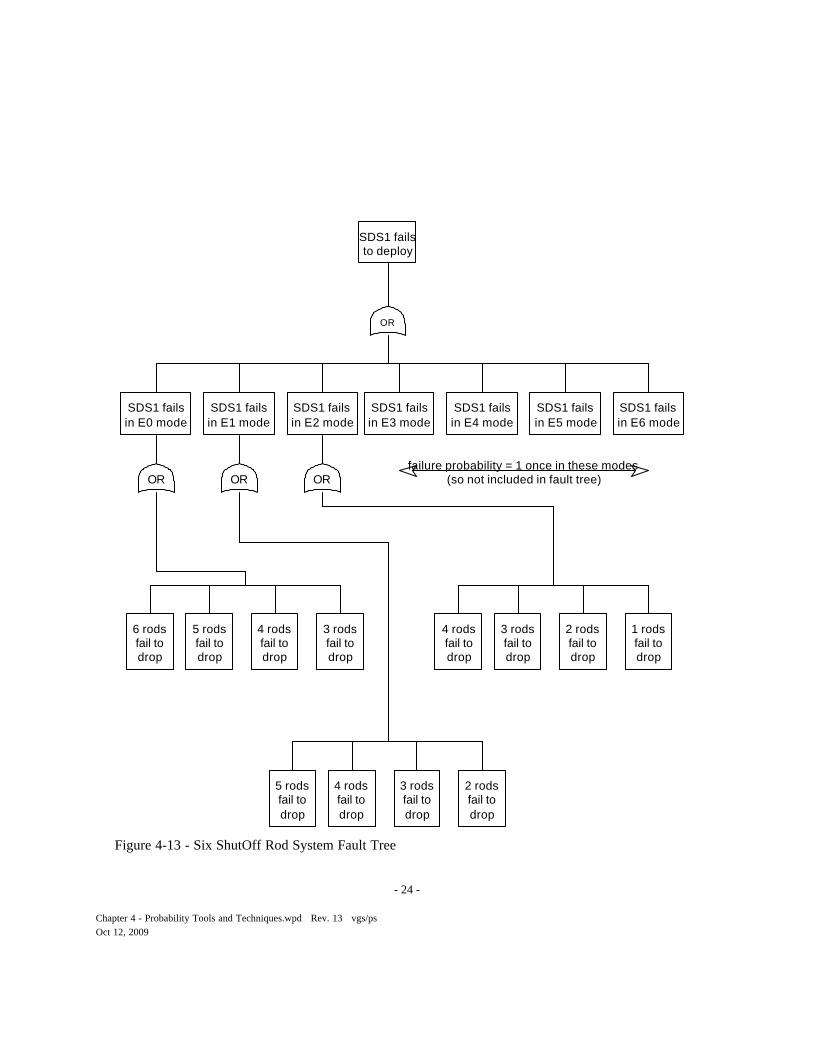
All these modes are mutually exclusive so we OR their probabilities of failures. The fault tree is shownin Figure 4-13.
We digress briefly to explain the symbols used in the fault tree. One starts at the top with the event ofinterest, usually the system failure. Then one determines each and every immediate cause of such anoutcome. If either of several immediate causes is sufficient to cause the “top” event, then they are joinedby an “OR” gate, which looks like Figure 4-11. It means: Event A OR event B must occur in order forevent C to occur.
Conversely, if all of several immediate causes must occur in order to cause the “top” event, then theyare joined by an “AND” gate, which looks like Figure 4-12. It means: Event A AND event B mustoccur in order for event C to occur. It can alsobe represented by the same symbol containing a@ sign
In Figure 4-13 below, the “OR” gate isrepresented by a symbol as in Figure 4-11. Itcan also be represented by the same symbolcontaining a + sign, or just by a line junction(uncommon).
We expand each option until we can no longerdecompose the event or we arrive at a point where we know the probability of failure.
For the case of 0 rods out of service, the probability of being in that mode is (1-p)6 as before.
- 24 -
Chapter 4 - Probability Tools and Techniques.wpd Rev. 13 vgs/psOct 12, 2009
SDS1 failsin E6 mode
SDS1 failsin E0 mode
SDS1 failsin E5 mode
SDS1 failsin E4 mode
SDS1 failsin E3 mode
SDS1 failsin E2 mode
SDS1 failsin E1 mode
5 rodsfail todrop
4 rodsfail todrop
3 rodsfail todrop
6 rodsfail todrop
5 rodsfail todrop
4 rodsfail todrop
3 rodsfail todrop
2 rodsfail todrop
4 rodsfail todrop
3 rodsfail todrop
2 rodsfail todrop
1 rodsfail todrop
failure probability = 1 once in these modes(so not included in fault tree)
SDS1 failsto deploy
OR
OR OR OR
Figure 4-13 - Six ShutOff Rod System Fault Tree
- 25 -
Chapter 4 - Probability Tools and Techniques.wpd Rev. 13 vgs/psOct 12, 2009
(49)
(50)
(51)
(52)
(53)
(54)
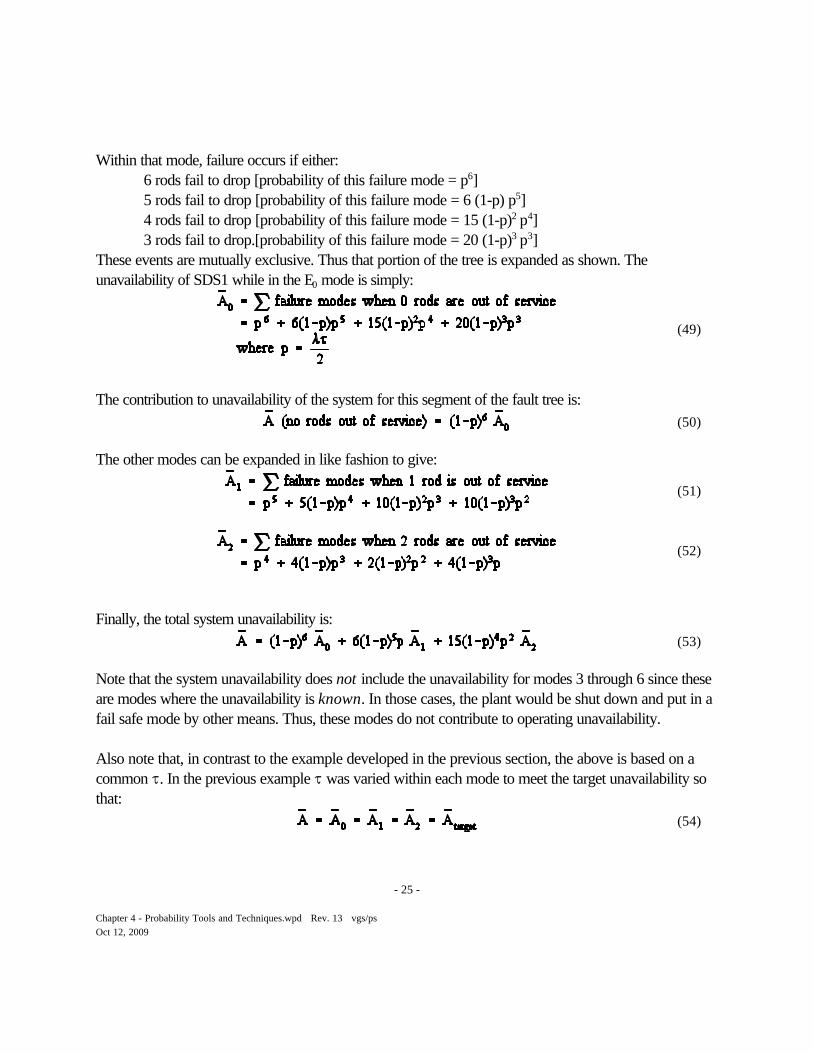
Within that mode, failure occurs if either:6 rods fail to drop [probability of this failure mode = p6]5 rods fail to drop [probability of this failure mode = 6 (1-p) p5]4 rods fail to drop [probability of this failure mode = 15 (1-p)2 p4]3 rods fail to drop.[probability of this failure mode = 20 (1-p)3 p3]
These events are mutually exclusive. Thus that portion of the tree is expanded as shown. Theunavailability of SDS1 while in the E0 mode is simply:
The contribution to unavailability of the system for this segment of the fault tree is:
The other modes can be expanded in like fashion to give:
Finally, the total system unavailability is:
Note that the system unavailability does not include the unavailability for modes 3 through 6 since theseare modes where the unavailability is known. In those cases, the plant would be shut down and put in afail safe mode by other means. Thus, these modes do not contribute to operating unavailability.
Also note that, in contrast to the example developed in the previous section, the above is based on acommon J. In the previous example J was varied within each mode to meet the target unavailability sothat:
- 26 -
Chapter 4 - Probability Tools and Techniques.wpd Rev. 13 vgs/psOct 12, 2009
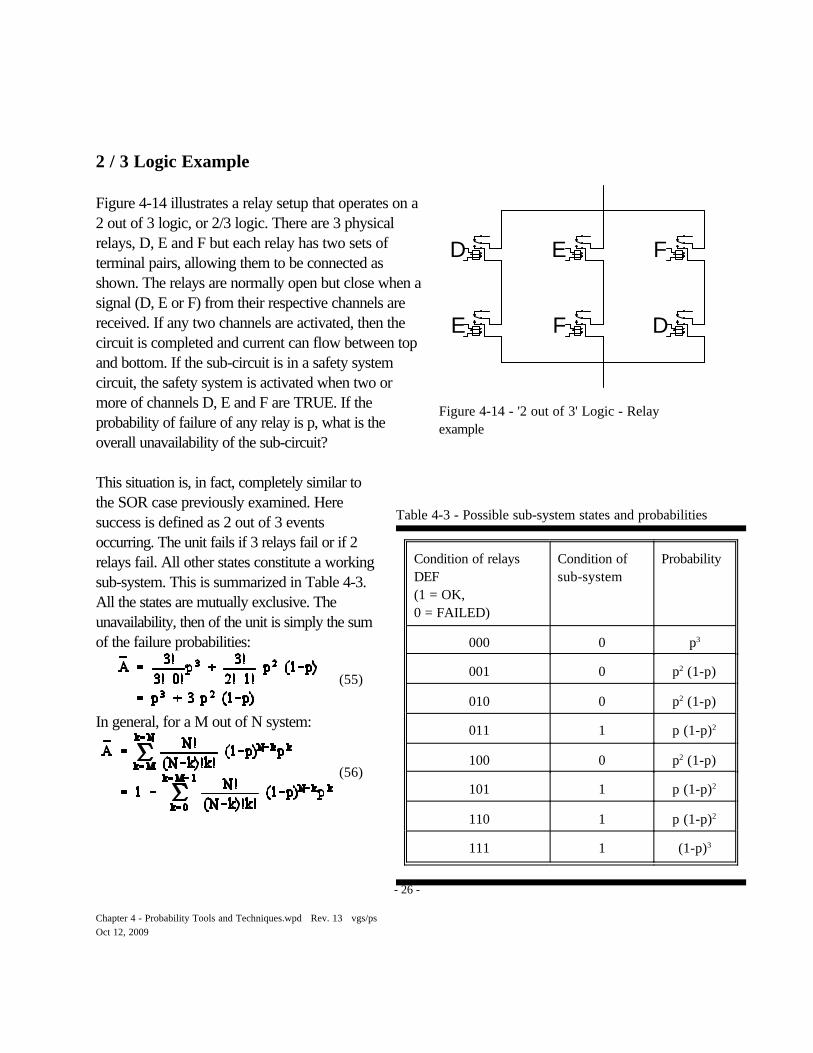
Condition of relaysDEF(1 = OK, 0 = FAILED)
Condition ofsub-system
Probability
000 0 p3
001 0 p2 (1-p)
010 0 p2 (1-p)
011 1 p (1-p)2
100 0 p2 (1-p)
101 1 p (1-p)2
110 1 p (1-p)2
111 1 (1-p)3
Table 4-3 - Possible sub-system states and probabilities
(55)
(56)
D
D
E
E
F
F
Figure 4-14 - '2 out of 3' Logic - Relayexample
2 / 3 Logic Example
Figure 4-14 illustrates a relay setup that operates on a2 out of 3 logic, or 2/3 logic. There are 3 physicalrelays, D, E and F but each relay has two sets ofterminal pairs, allowing them to be connected asshown. The relays are normally open but close when asignal (D, E or F) from their respective channels arereceived. If any two channels are activated, then thecircuit is completed and current can flow between topand bottom. If the sub-circuit is in a safety systemcircuit, the safety system is activated when two ormore of channels D, E and F are TRUE. If theprobability of failure of any relay is p, what is theoverall unavailability of the sub-circuit?
This situation is, in fact, completely similar tothe SOR case previously examined. Heresuccess is defined as 2 out of 3 eventsoccurring. The unit fails if 3 relays fail or if 2relays fail. All other states constitute a workingsub-system. This is summarized in Table 4-3.All the states are mutually exclusive. Theunavailability, then of the unit is simply the sumof the failure probabilities:
In general, for a M out of N system:
- 27 -
Chapter 4 - Probability Tools and Techniques.wpd Rev. 13 vgs/psOct 12, 2009
(57)
D
E
F
D
F
E
D
E
F
F
D
E
(a) (a)(b)
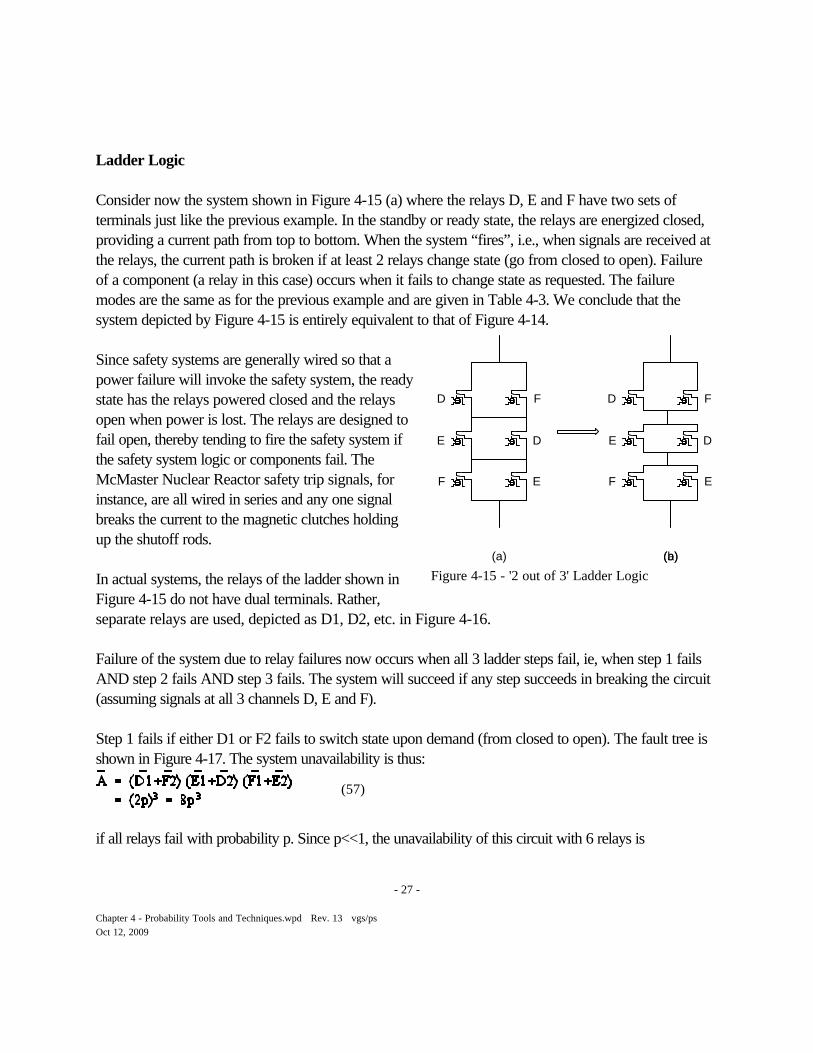
Figure 4-15 - '2 out of 3' Ladder Logic
Ladder Logic
Consider now the system shown in Figure 4-15 (a) where the relays D, E and F have two sets ofterminals just like the previous example. In the standby or ready state, the relays are energized closed,providing a current path from top to bottom. When the system “fires”, i.e., when signals are received atthe relays, the current path is broken if at least 2 relays change state (go from closed to open). Failureof a component (a relay in this case) occurs when it fails to change state as requested. The failuremodes are the same as for the previous example and are given in Table 4-3. We conclude that thesystem depicted by Figure 4-15 is entirely equivalent to that of Figure 4-14.
Since safety systems are generally wired so that apower failure will invoke the safety system, the readystate has the relays powered closed and the relaysopen when power is lost. The relays are designed tofail open, thereby tending to fire the safety system ifthe safety system logic or components fail. TheMcMaster Nuclear Reactor safety trip signals, forinstance, are all wired in series and any one signalbreaks the current to the magnetic clutches holdingup the shutoff rods.
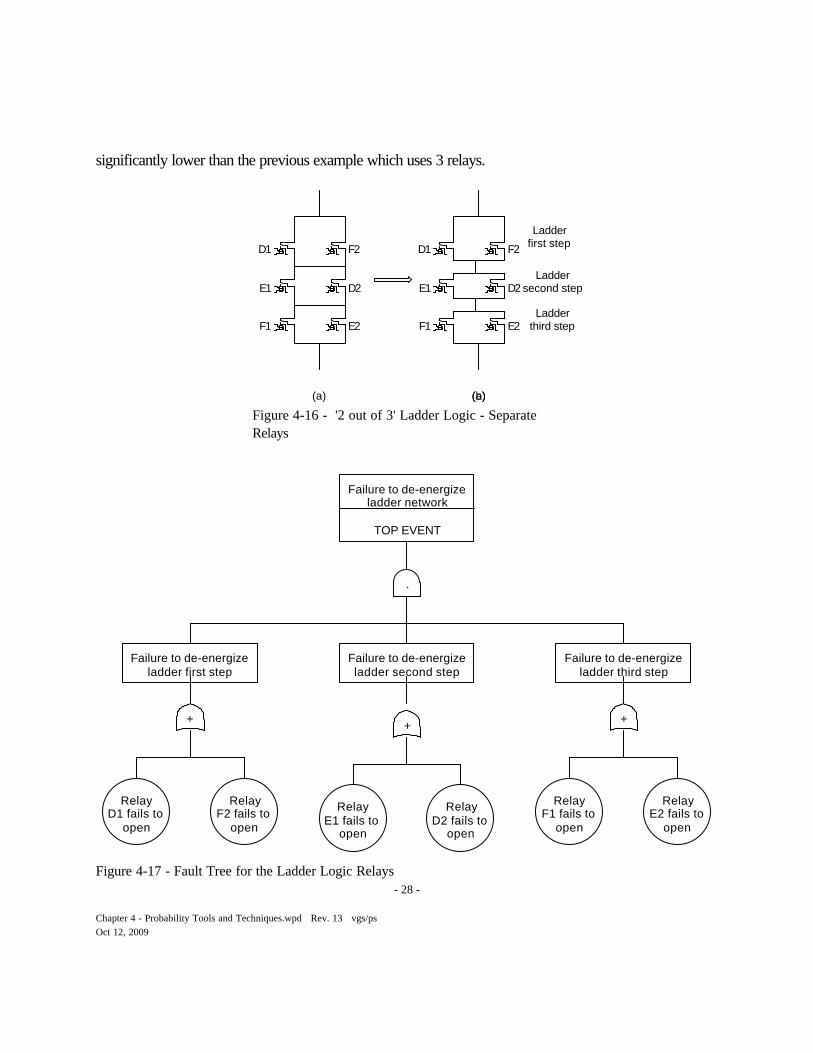
In actual systems, the relays of the ladder shown inFigure 4-15 do not have dual terminals. Rather,separate relays are used, depicted as D1, D2, etc. in Figure 4-16.
Failure of the system due to relay failures now occurs when all 3 ladder steps fail, ie, when step 1 failsAND step 2 fails AND step 3 fails. The system will succeed if any step succeeds in breaking the circuit(assuming signals at all 3 channels D, E and F).
Step 1 fails if either D1 or F2 fails to switch state upon demand (from closed to open). The fault tree isshown in Figure 4-17. The system unavailability is thus:
if all relays fail with probability p. Since p<<1, the unavailability of this circuit with 6 relays is
- 28 -
Chapter 4 - Probability Tools and Techniques.wpd Rev. 13 vgs/psOct 12, 2009
+
.
Failure to de-energizeladder first step
Failure to de-energizeladder second step
Failure to de-energizeladder third step
Failure to de-energizeladder network
TOP EVENT
RelayD1 fails to
open
RelayF2 fails to
open
+ +
RelayE1 fails to
open
RelayF1 fails to
open
RelayD2 fails to
open
RelayE2 fails to
open
Figure 4-17 - Fault Tree for the Ladder Logic Relays
(a) (a)(b)
D1
E1
F2
D2
F1 E2
D1
E1
F1
F2
D2
E2
Ladderfirst step
Laddersecond step
Ladderthird step
Figure 4-16 - '2 out of 3' Ladder Logic - SeparateRelays
significantly lower than the previous example which uses 3 relays.
- 29 -
Chapter 4 - Probability Tools and Techniques.wpd Rev. 13 vgs/psOct 12, 2009
_A
time
_<A> in the time interval
d:\teach\ep7xx\a_aver.flo
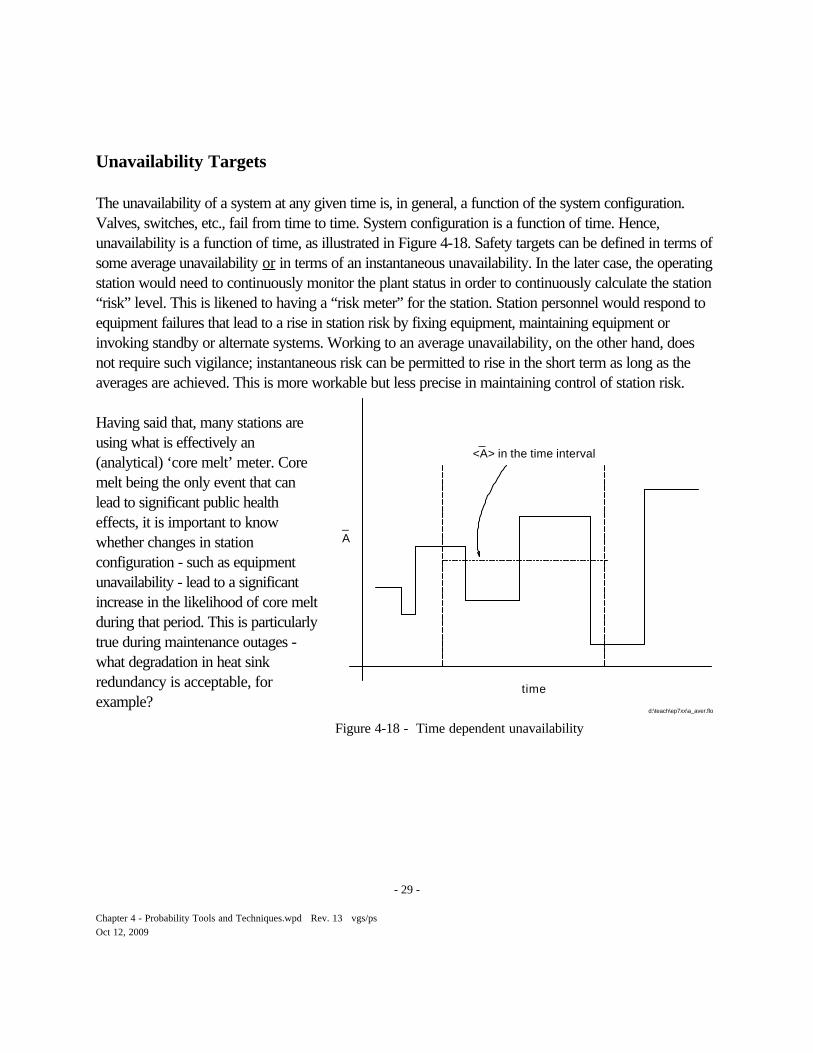
Figure 4-18 - Time dependent unavailability
Unavailability Targets
The unavailability of a system at any given time is, in general, a function of the system configuration.Valves, switches, etc., fail from time to time. System configuration is a function of time. Hence,unavailability is a function of time, as illustrated in Figure 4-18. Safety targets can be defined in terms ofsome average unavailability or in terms of an instantaneous unavailability. In the later case, the operatingstation would need to continuously monitor the plant status in order to continuously calculate the station“risk” level. This is likened to having a “risk meter” for the station. Station personnel would respond toequipment failures that lead to a rise in station risk by fixing equipment, maintaining equipment orinvoking standby or alternate systems. Working to an average unavailability, on the other hand, doesnot require such vigilance; instantaneous risk can be permitted to rise in the short term as long as theaverages are achieved. This is more workable but less precise in maintaining control of station risk.
Having said that, many stations areusing what is effectively an(analytical) ‘core melt’ meter. Coremelt being the only event that canlead to significant public healtheffects, it is important to knowwhether changes in stationconfiguration - such as equipmentunavailability - lead to a significantincrease in the likelihood of core meltduring that period. This is particularlytrue during maintenance outages -what degradation in heat sinkredundancy is acceptable, forexample?

bSuch a distinction is made in Canada but most other places just use ECC
cThe mission time is calculated as the time beyond which the decay heat can be removed fromthe fuel to the moderator without any water in the fuel channel, so as to prevent any further fuelfailures due to overheating.
- 30 -
Chapter 4 - Probability Tools and Techniques.wpd Rev. 13 vgs/psOct 12, 2009
Dormant vs active systems
So far we have focussed on systems that are normally dormant and are required to operate on demand.Safety systems generally fall into this category. However, some systems, like the Emergency CoreCooling System (ECCS), are required to activate on demand and to continue to function for somedefined mission time. The normal response of the ECC to a Heat Transport System (HTS) break (Lossof Coolant Accident or LOCA) is for the ECC to detect the event and initiate the injection of highpressure (HP) cooling water (strictly speaking the water injection function of ECC is called ECI, orEmergency Coolant Injection, since it has other functions such as steam generator cooldown and loopisolationb). Then, after the HTS has depressurized, medium pressure and finally low pressure water isinjected. The HP water is supplied, for example, from a water tank (accumulator) pressurized by hugegas cylinders. Medium pressure cooling water can be supplied from a water tank via ECC pumps; andlow pressure water is retrieved from the sumps, cooled and pumped back into the HTS. For CANDUreactors a mission time of 1 to 3 months has been setc. The ECCS is consequently divided into twoseparate fault trees for the purposes of analysis: Dormant ECC and Long Term ECC (designatedDECC and LTECC respectively). The DECC fault tree focusses on failure to detect the LOCA event,failure to initiate high pressure (HP) cooling water, failure to distribute the flow, and failure to providemedium and low pressure water. The LTECC fault tree focusses on the failure to provide long term lowpressure cooling due to pump failure, valve failure, flow blockage, loss of electrical power and loss ofcoolant supply.
- 31 -
Chapter 4 - Probability Tools and Techniques.wpd Rev. 13 vgs/psOct 12, 2009
Exercises
1. For the example fault tree of shutoff rods, calculate from the success modes. Which way isbettera. in the 4/6 caseb. in the 26/28 case?
2. From Ref. 1: A horn on a car operates on demand 99.96% of the time. Consider each eventindependent from all others. How many times would you expect to be able to honk the hornwith a 50% probability of not having a single failure?
3. From Ref. 1: A light bulb has a 8(t) = 5x10 -7 t, where t is the time in days. What is the MTTFfor the bulb?
4. What can you say quantitatively about the probability of a large LOCA in a CANDU?
5. In a fuel plant, two assembly lines, L1 and L2 produce 40% and 60% respectively of the fuelpellets. From past experience, it is known that 0.1% of L1 and 2% of L2 of the fuel pellets aredefective. If a fuel pellet was chosen randomly and found defective, what is the probability thatit was produced by L1?
6. Describe the advantages and disadvantages of Bayesian techniques for risk evaluations. Whatapplications could you use Bayesian techniques in an operating nuclear power plant?
7. Two x 100% electrical motor driven auxiliary feedwater pumps are located in the turbinebuilding and depend on recirculated cooling water and two independent power supplies. Identify common mode and cause failures. The utility wants to extend the life of the plant and isplanning refurbishment. What mitigation features or modifications would you do to reduce oreliminate these failures?
8. Based on the slide below showing a simple emergency coolant injection system and the resultsof the fault tree analysis below, identify any weaknesses of the design. Draw a schematic of thesystem to improve the system reliability. Calculate the unavailability if the pump and valves
- 32 -
Chapter 4 - Probability Tools and Techniques.wpd Rev. 13 vgs/psOct 12, 2009
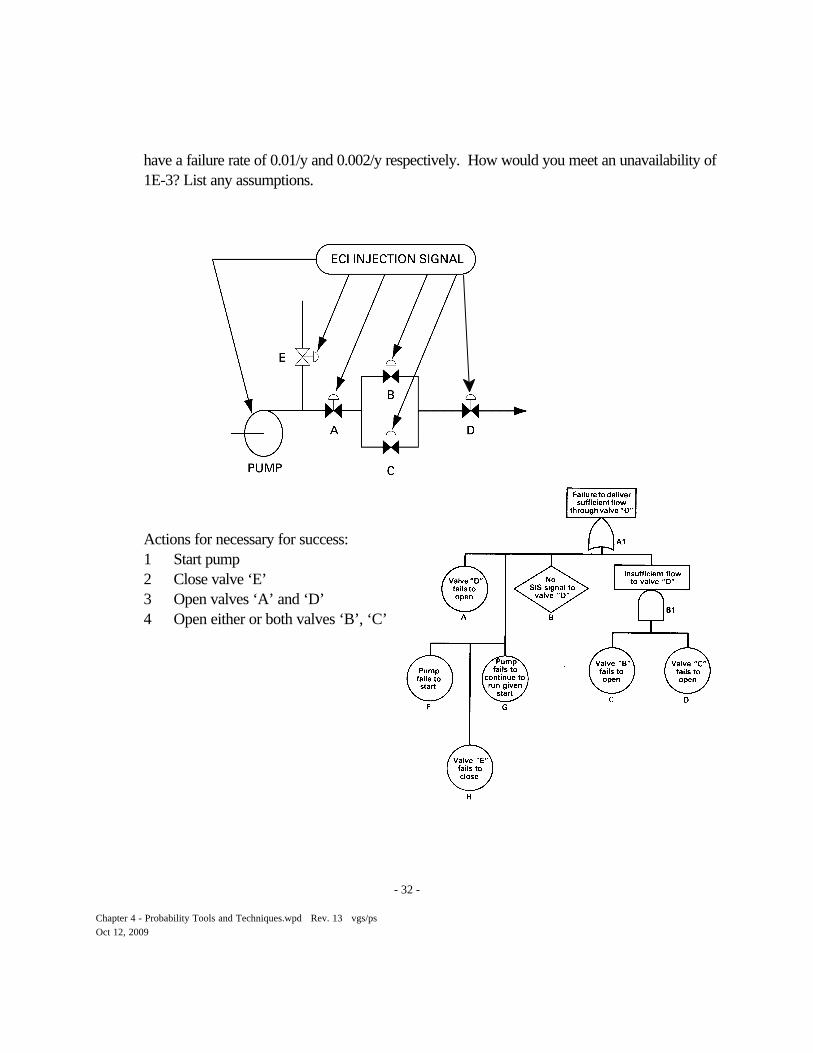
have a failure rate of 0.01/y and 0.002/y respectively. How would you meet an unavailability of1E-3? List any assumptions.
Actions for necessary for success:1 Start pump2 Close valve ‘E’3 Open valves ‘A’ and ‘D’4 Open either or both valves ‘B’, ‘C’

- 33 -
Chapter 4 - Probability Tools and Techniques.wpd Rev. 13 vgs/psOct 12, 2009
- 34 -
Chapter 4 - Probability Tools and Techniques.wpd Rev. 13 vgs/psOct 12, 2009
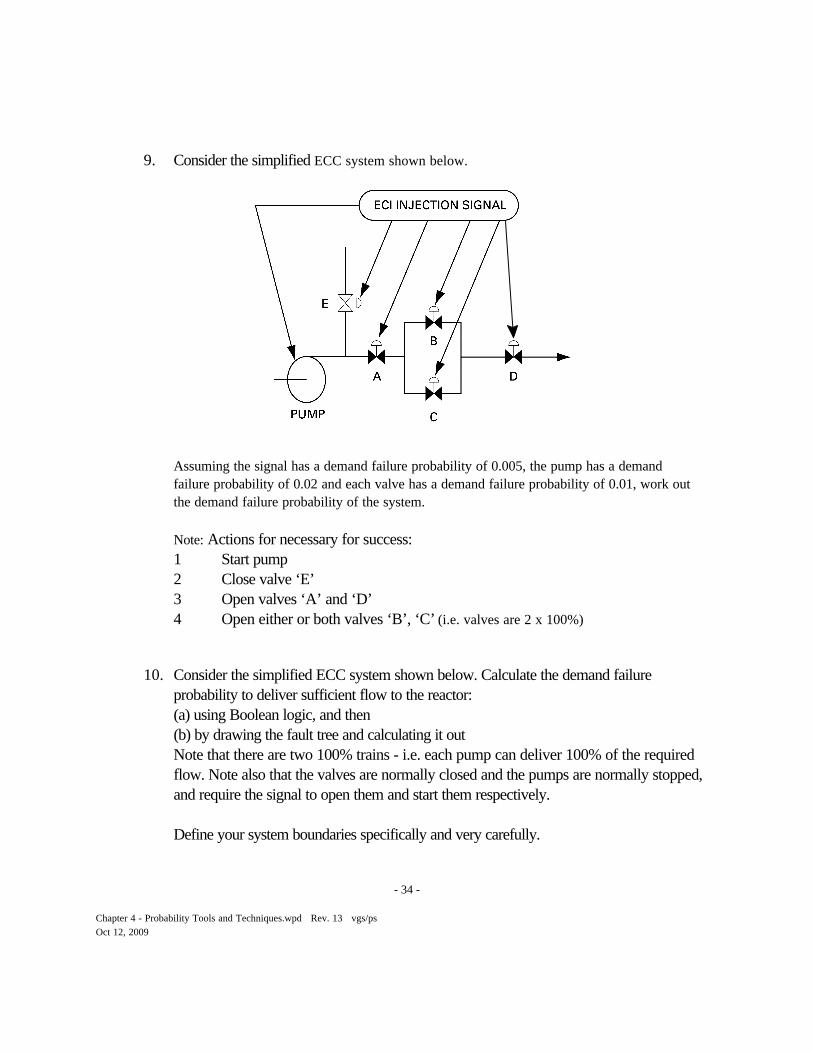
9. Consider the simplified ECC system shown below.
Assuming the signal has a demand failure probability of 0.005, the pump has a demandfailure probability of 0.02 and each valve has a demand failure probability of 0.01, work outthe demand failure probability of the system.
Note: Actions for necessary for success:1 Start pump2 Close valve ‘E’3 Open valves ‘A’ and ‘D’4 Open either or both valves ‘B’, ‘C’ (i.e. valves are 2 x 100%)
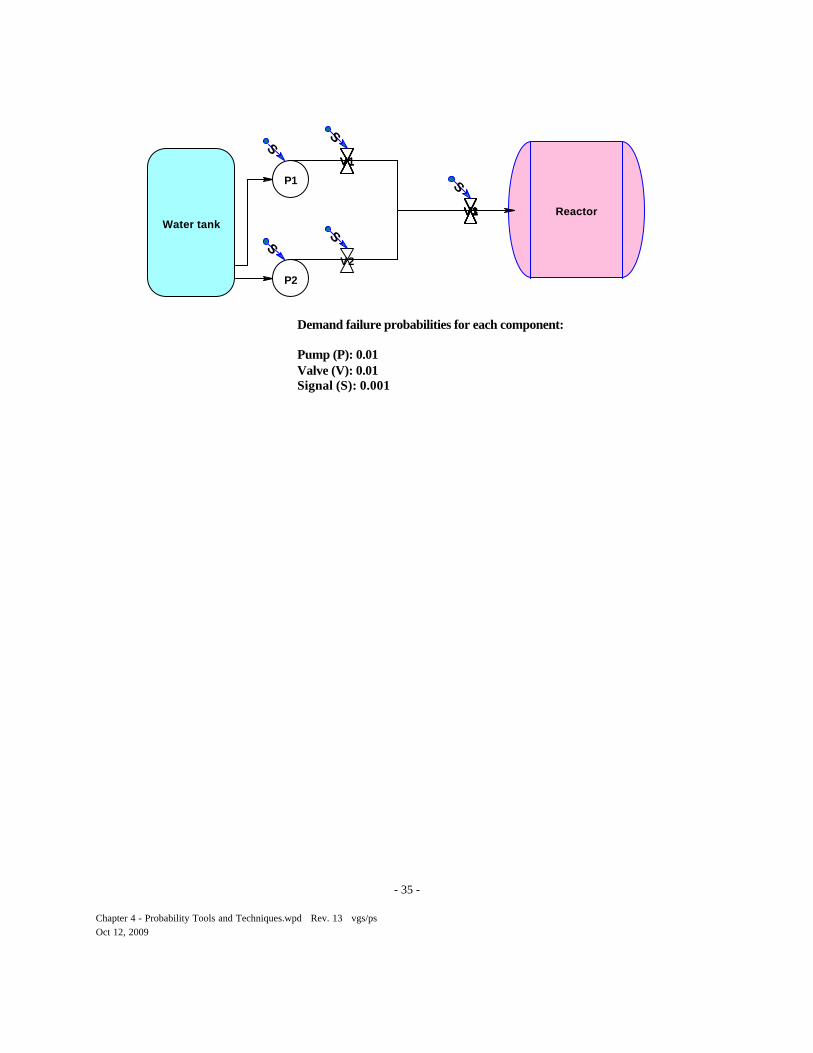
10. Consider the simplified ECC system shown below. Calculate the demand failureprobability to deliver sufficient flow to the reactor:(a) using Boolean logic, and then(b) by drawing the fault tree and calculating it outNote that there are two 100% trains - i.e. each pump can deliver 100% of the requiredflow. Note also that the valves are normally closed and the pumps are normally stopped,and require the signal to open them and start them respectively.
Define your system boundaries specifically and very carefully.
- 35 -
Chapter 4 - Probability Tools and Techniques.wpd Rev. 13 vgs/psOct 12, 2009
V1V1
V2
V1V1
V1V1V1V1V1V3 Reactor
S
S
S
P2
S
P1
S
Water tank
Demand failure probabilities for each component:
Pump (P): 0.01Valve (V): 0.01Signal (S): 0.001
- 36 -
Chapter 4 - Probability Tools and Techniques.wpd Rev. 13 vgs/psOct 12, 2009
Appendix 1 - Example of Common Cause Failure
Consider two shutoff rods, each of which as a probability of failure of 0.001 per demand.What is the probability that they both fail when required?
If they are independent, then P(A1A2) = P(A1)P(A2) = (0.001)2 = 10-6 per demand.
Suppose there is a common cause failure 10% of the time. That is:
P(A1) = P(A2) = 0.0009 (random) + 0.0001 (CC)
so the probability of one rod failing given that the other has failed is 90% random and 10%common cause (with probability 1):
P(A1|A2) = 0.9 * 0.001 + 0.1 * 1 = 0.1009or
P(A1A2) = 0.1009 * 0.001 = 0.0001009 ~ 10-4
Thus a 10% common cause probability has increased the combined failure by a factor of 100!
- 37 -
Chapter 4 - Probability Tools and Techniques.wpd Rev. 13 vgs/psOct 12, 2009
(58)
(59)
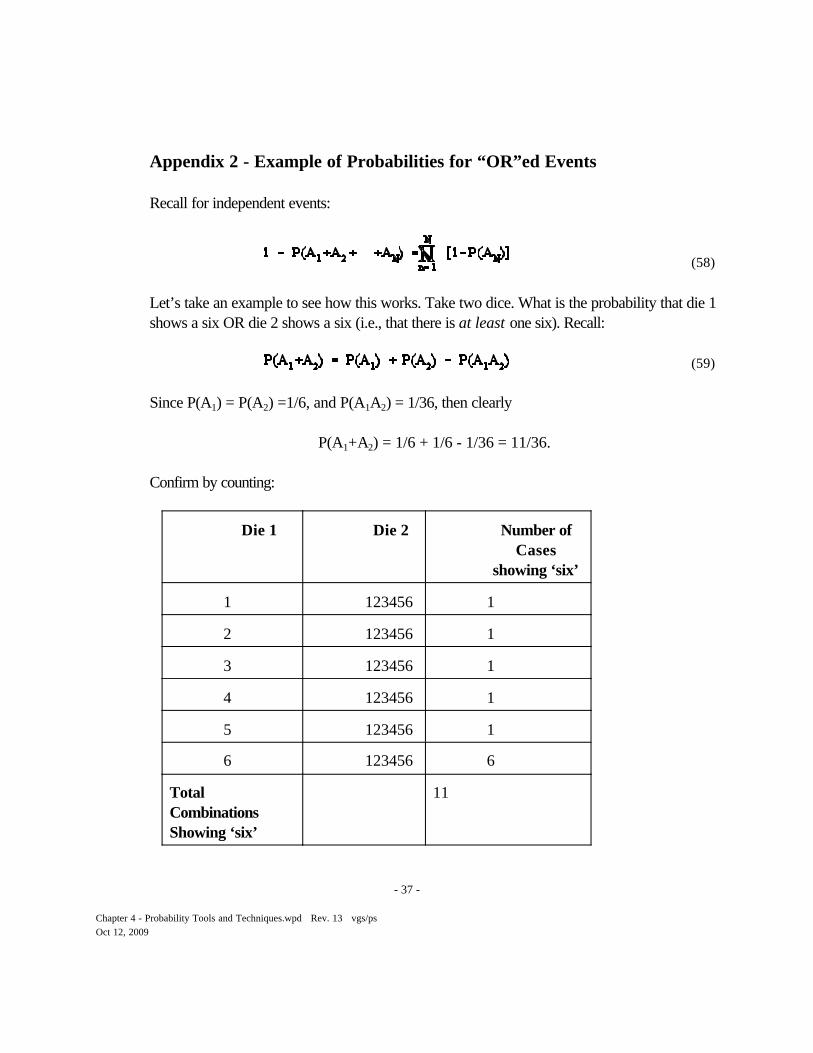
Appendix 2 - Example of Probabilities for “OR”ed Events
Recall for independent events:
Let’s take an example to see how this works. Take two dice. What is the probability that die 1shows a six OR die 2 shows a six (i.e., that there is at least one six). Recall:
Since P(A1) = P(A2) =1/6, and P(A1A2) = 1/36, then clearly
P(A1+A2) = 1/6 + 1/6 - 1/36 = 11/36.
Confirm by counting:
Die 1 Die 2 Number ofCases
showing ‘six’
1 123456 1
2 123456 1
3 123456 1
4 123456 1
5 123456 1
6 123456 6
TotalCombinationsShowing ‘six’
11
- 38 -
Chapter 4 - Probability Tools and Techniques.wpd Rev. 13 vgs/psOct 12, 2009
(60)
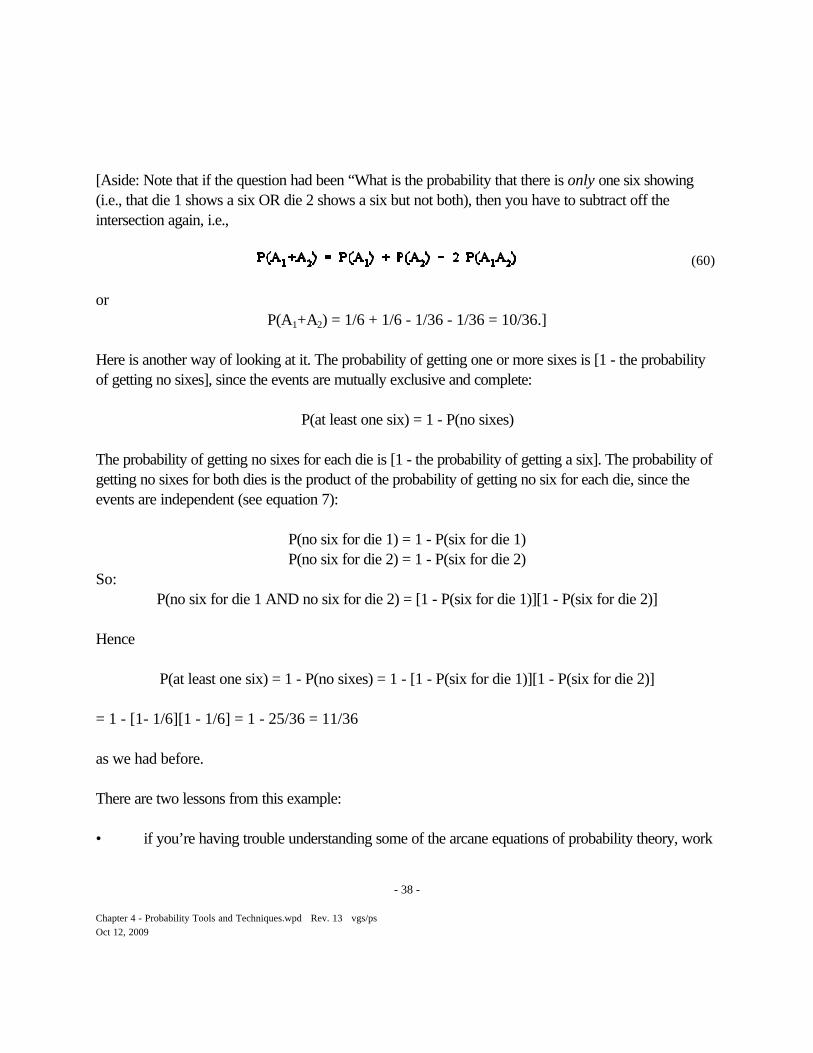
[Aside: Note that if the question had been “What is the probability that there is only one six showing(i.e., that die 1 shows a six OR die 2 shows a six but not both), then you have to subtract off theintersection again, i.e.,
orP(A1+A2) = 1/6 + 1/6 - 1/36 - 1/36 = 10/36.]
Here is another way of looking at it. The probability of getting one or more sixes is [1 - the probabilityof getting no sixes], since the events are mutually exclusive and complete:
P(at least one six) = 1 - P(no sixes)
The probability of getting no sixes for each die is [1 - the probability of getting a six]. The probability ofgetting no sixes for both dies is the product of the probability of getting no six for each die, since theevents are independent (see equation 7):
P(no six for die 1) = 1 - P(six for die 1)P(no six for die 2) = 1 - P(six for die 2)
So:P(no six for die 1 AND no six for die 2) = [1 - P(six for die 1)][1 - P(six for die 2)]
Hence
P(at least one six) = 1 - P(no sixes) = 1 - [1 - P(six for die 1)][1 - P(six for die 2)]
= 1 - [1- 1/6][1 - 1/6] = 1 - 25/36 = 11/36
as we had before.
There are two lessons from this example:
• if you’re having trouble understanding some of the arcane equations of probability theory, work
- 39 -
Chapter 4 - Probability Tools and Techniques.wpd Rev. 13 vgs/psOct 12, 2009
through some examples. Mathematicians and purists may cringe - but real science goes fromexample to theory, not the other way around.
• sometimes it is easier to work from the probability of the complementary event - P(not A) or
- rather than the probability of the event - P(A), remembering thatP A( )= 1 - P(A)P A( )
In this example it didn’t make much difference. However suppose you had a thousand dice and askedthe same questions - which approach (equation 10 or equation 11) would be easier to use?
- 40 -
Chapter 4 - Probability Tools and Techniques.wpd Rev. 13 vgs/psOct 12, 2009
Appendix 3 - Boolean Logic
This is a quick refresher in the basics of Boolean logic.
Boolean Algebra is a set of laws formulated by the British mathematician George Boole. It deals withstatements (here represented by A, B, C, etc.) which can be either true or false - often denoted by thenumbers 1 and 0 respectively. So for example A=0 means the statement A is false.
E.g. Let A represent “the earth is flat”. Then A=0.
OperatorsThere are several operators which act on these statements:
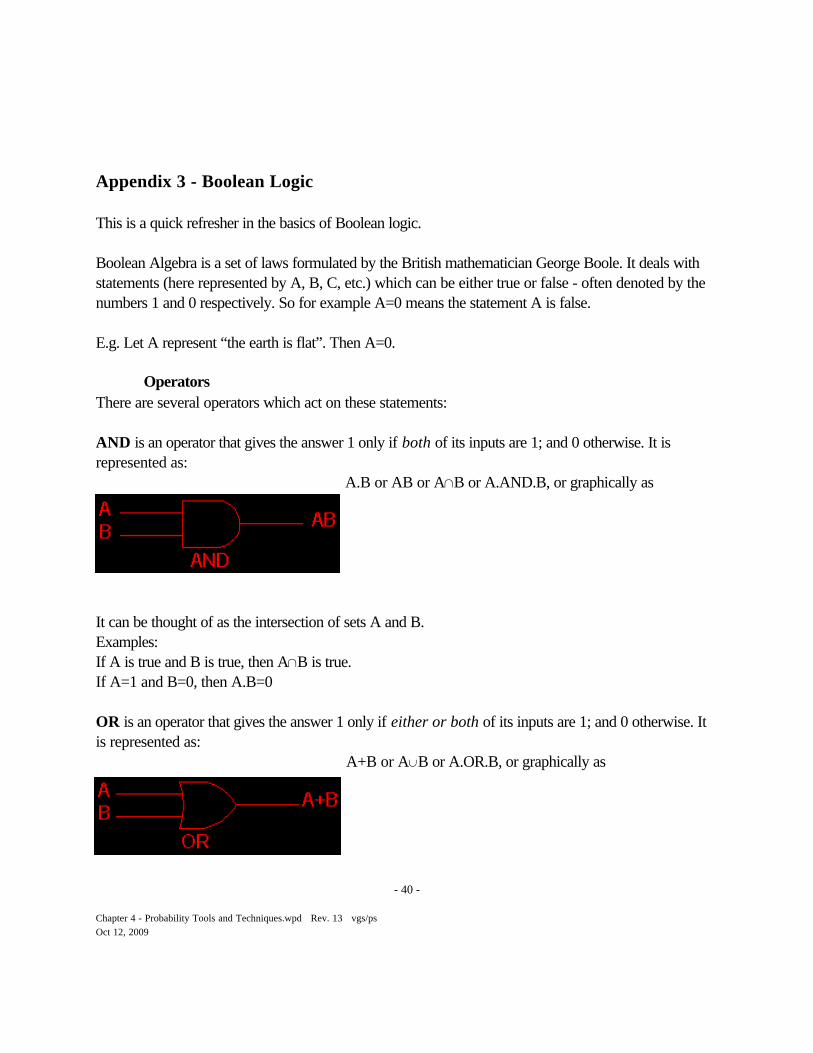
AND is an operator that gives the answer 1 only if both of its inputs are 1; and 0 otherwise. It isrepresented as:
A.B or AB or A1B or A.AND.B, or graphically as
It can be thought of as the intersection of sets A and B.Examples:If A is true and B is true, then A1B is true.If A=1 and B=0, then A.B=0
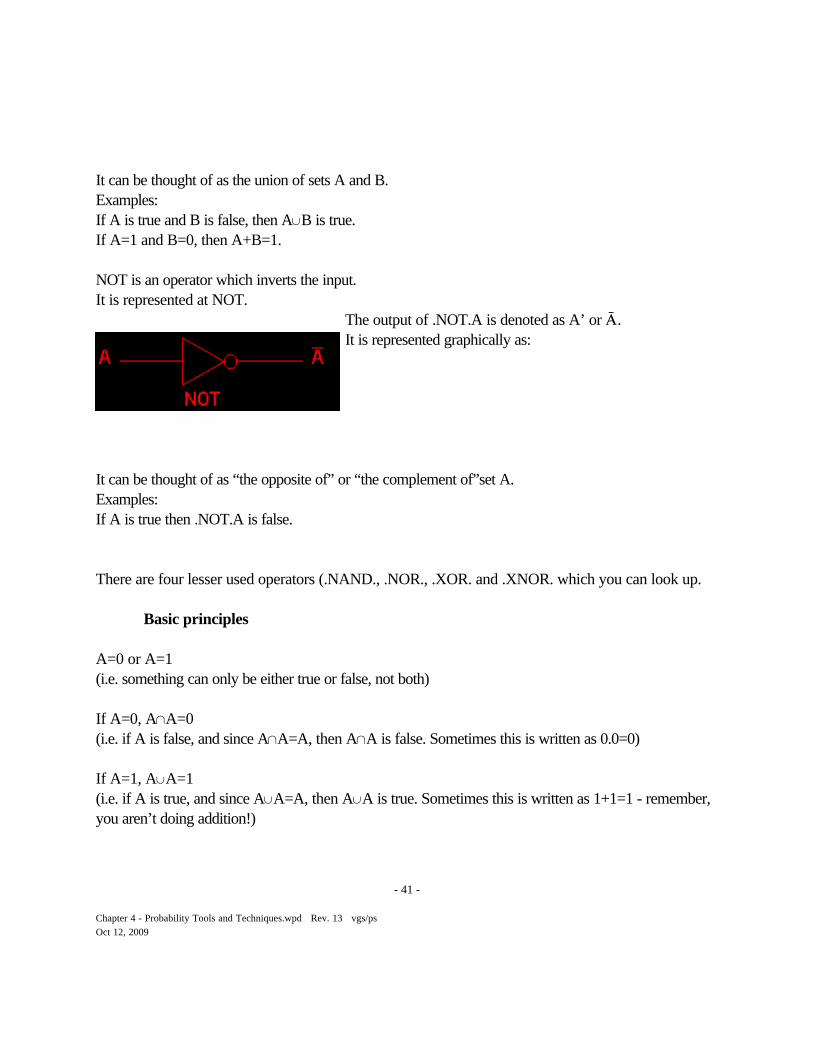
OR is an operator that gives the answer 1 only if either or both of its inputs are 1; and 0 otherwise. Itis represented as:
A+B or AcB or A.OR.B, or graphically as
- 41 -
Chapter 4 - Probability Tools and Techniques.wpd Rev. 13 vgs/psOct 12, 2009
It can be thought of as the union of sets A and B.Examples:If A is true and B is false, then AcB is true.If A=1 and B=0, then A+B=1.
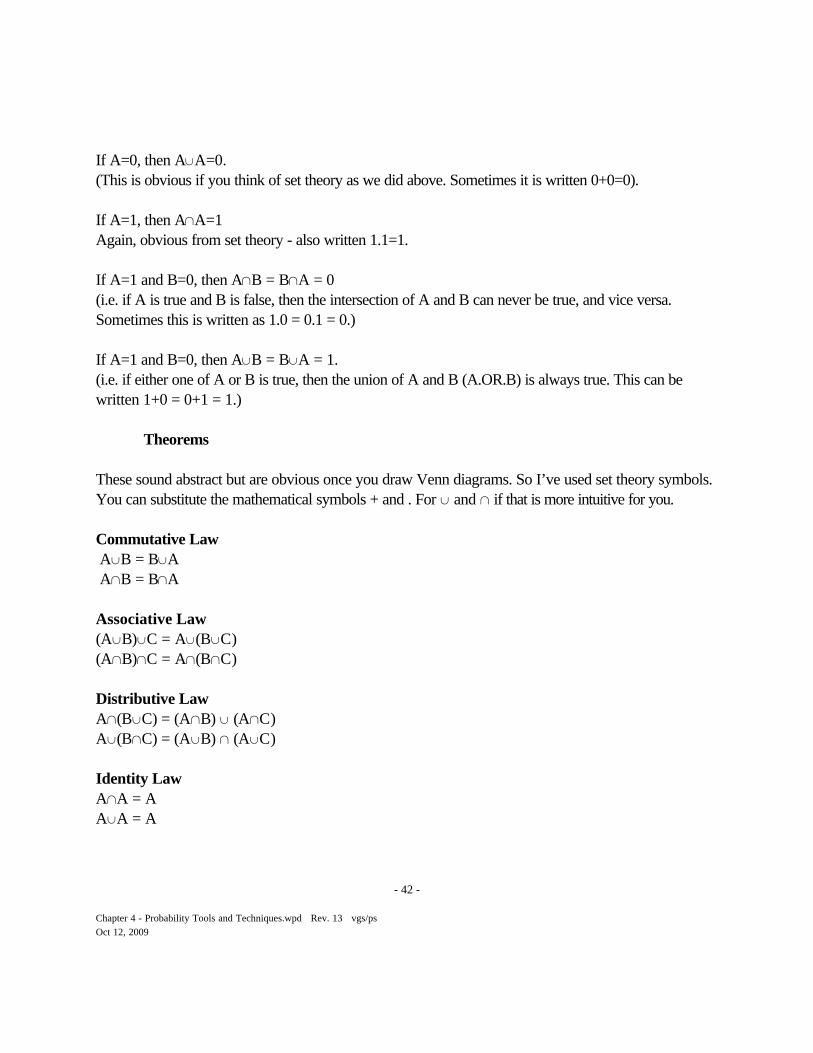
NOT is an operator which inverts the input.It is represented at NOT.
The output of .NOT.A is denoted as A’ or }.It is represented graphically as:
It can be thought of as “the opposite of” or “the complement of”set A.Examples:If A is true then .NOT.A is false.
There are four lesser used operators (.NAND., .NOR., .XOR. and .XNOR. which you can look up.
Basic principles
A=0 or A=1(i.e. something can only be either true or false, not both)
If A=0, A1A=0(i.e. if A is false, and since A1A=A, then A1A is false. Sometimes this is written as 0.0=0)
If A=1, AcA=1(i.e. if A is true, and since AcA=A, then AcA is true. Sometimes this is written as 1+1=1 - remember,you aren’t doing addition!)
- 42 -
Chapter 4 - Probability Tools and Techniques.wpd Rev. 13 vgs/psOct 12, 2009
If A=0, then AcA=0.(This is obvious if you think of set theory as we did above. Sometimes it is written 0+0=0).
If A=1, then A1A=1Again, obvious from set theory - also written 1.1=1.
If A=1 and B=0, then A1B = B1A = 0(i.e. if A is true and B is false, then the intersection of A and B can never be true, and vice versa.Sometimes this is written as 1.0 = 0.1 = 0.)
If A=1 and B=0, then AcB = BcA = 1.(i.e. if either one of A or B is true, then the union of A and B (A.OR.B) is always true. This can bewritten 1+0 = 0+1 = 1.)
Theorems
These sound abstract but are obvious once you draw Venn diagrams. So I’ve used set theory symbols. You can substitute the mathematical symbols + and . For c and 1 if that is more intuitive for you.
Commutative Law AcB = BcA A1B = B1A
Associative Law(AcB)cC = Ac(BcC)(A1B)1C = A1(B1C)
Distributive LawA1(BcC) = (A1B) c (A1C)Ac(B1C) = (AcB) 1 (AcC)
Identity LawA1A = AAcA = A

- 43 -
Chapter 4 - Probability Tools and Techniques.wpd Rev. 13 vgs/psOct 12, 2009
Completeness(A1B)c(A1B’) = A(AcB)1(AcB’) = A
RedundancyAc(A1B) = AA1(AcB) = A
Mathematical1 + A = 11.A = A
0 + A = A0.A = 0
A + } = 1A.} = 0
A + }B = A + BA.(} + B) = A.B
DeMorgan’s Theorem(A+B)’ = A’.B’(AB)’ = A’ + B’
These will be useful when you work out fault trees mathematically.
- 44 -
Chapter 4 - Probability Tools and Techniques.wpd Rev. 13 vgs/psOct 12, 2009
1. Norman J. McCormick, Reliability and Risk Analysis, Academic Press, 1981, ISBN 0-12-482360-2.
References