Chapter 4 Plan/LVPC_Regional... · 12 Wegmans 1,803 13 Guardian Life Insurance Company of America...
20
34 Chapter 4 Economic Profile
Transcript of Chapter 4 Plan/LVPC_Regional... · 12 Wegmans 1,803 13 Guardian Life Insurance Company of America...

34
Chapter 4Economic Profile

Cha
pter
4E
cono
mic
Pro
file
35

36
50,000
100,000
150,000
200,000
250,000
300,000
Tota
l Em
ploy
men
t
Lehigh County Northampton County Lehigh Valley
Figure 19 - Private Sector Employment Lehigh Valley; 2002-2013
0
50,000
100,000
150,000
200,000
250,000
Goods-Producing Services
EMPLOYMENT AND INDUSTRIES
Among the key indicators related to economic growth and development within the Lehigh Valley over the last decade is the change in employment, represented in Figure 18, which includes both private sector and governmental jobs. As illustrated by this data, the Valley added approximately 2,500 jobs annually for the period of 2002 to 2012, representing an average annual increase of 0.8%. In contrast, the state’s employment grew by 0.1% annually. With the exception of 2008-2009, the Valley had positive job growth throughout the decade, indicating that a recovery occurred following the recessionary conditions. By 2012, the region had erased the 3.5% loss of its employment base induced by the 2008 Recession. A similar recovery trend is occurring at the state level. Northampton County’s growth rate of 1.3% outperformed Lehigh County, which had a rate of 0.5%. However, Lehigh County maintains the majority (63%) of the regional job base.
Figure 19 provides further insight into the overall employment growth in the Valley during this time period. The trend lines seen in Figure 19, which separate private sector growth into goods-producing and service related jobs, show that the net growth in jobs was in the service sectors, while goods-producing jobs sustained a moderate but steady decline throughout the decade. This is consistent with trends at the national level.
Figure 20 presents a detailed perspective on changes in sector employment for Lehigh and Northampton counties from 2002
Figure 18 - Average Annual Total Employment Lehigh Valley; 2002-2013
Tota
l Em
ploy
men
tTo
tal E
mpl
oym
ent
Source: U.S. Bureau of Labor Statistics and RKG Associates, Inc.
Source: U.S. Bureau of Labor Statistics and RKG Associates, Inc.

Cha
pter
4E
cono
mic
Pro
file
37
by 2.5%. A major source of this differential were two sectors, Construction and Manufacturing, which suffered greater losses in Lehigh than in Northampton County.
Of the Valley’s 17 sectors for which employment data was available, 10 experienced positive growth while 7 had a net loss from 2002-2013. The Management of Companies sector had substantial growth of over 200% and, despite losses in this sector in Lehigh County during the second half of the decade, added over 6,300 jobs in total, though a reclassification of the Utilities sector largely explains this shift (see “The Utilities Sector” inset box). Health Care had the largest actual increase of jobs with 10,700 and had sustained growth throughout the decade, which led to total growth in the sector approaching 30%. Additionally, of the top 25 non-governmental employers in the Lehigh Valley, eight are in the Health Care industry as seen in Figure 21. On the declining side, the Construction (-17.6%), Real Estate (-32.9%), Manufacturing (-33.3%) and Information (-37.4%) sectors, as in many parts of the country, lost employment fairly steadily throughout the decade despite a slowing in the rate of decline after 2007, which suggests a general inherent weakness in these portions of the regional economy.
to 2013. These sectors are based on the North American Industrial Classification System (NAICS), and the data is derived from the U.S. Bureau of Labor Statistics’ (BLS) annual compilation of covered employment jobs.1 The data represents an approximation of pre- and post-recessionary changes in employment.2
From an overall perspective, total employment in the Valley increased by 5.8%, or about 15,000 jobs, from 2002 to 2013. All growth occurred in the first period (7.5%), with a loss of employment (-1.6%) in the second period. The private sector added over 12,600 jobs (5.5%), while government employment increased by about 2,400 (8.1%) throughout the decade.
As noted in Figure 18, Northampton County’s job base expanded more rapidly than Lehigh County’s, with respective total employment growth rates of 10% and 3.6% from 2002 to 2013. In fact, Northampton County seems to have recovered more quickly than Lehigh County following the recession, posting a positive net gain in employment of 0.1% from 2007-2013 (a time when most of the nation suffered considerable job loss), while Lehigh County continued to lose employment
1 The BLS data includes all employees who are covered in the Unemploy-ment Insurance (UI) program. It does not include self-employed individuals or sole proprietors, military personnel or part-time employees.
2 Changes to the NAICS system reclassified certain employment in the Utili-ties sector to Management of Companies and Enterprises. Employment in those categories shows significant increases or decreases as a result of the classification. Please refer to the inset article in the orange box on page 39 for more details.

38
-100.0% -50.0% 0.0% 50.0% 100.0% 150.0% 200.0% 250.0%
Real estate
Professional/Tech services
Information
Utilities
Construction
Accommodation/food services
Other services
Finance and insurance
Wholesale trade
Retail trade*
Manufacturing
Administrative
Healthcare/social assistance
Arts, entertainment/recreation
Educational services
Transportation/warehousing
Management of companies
Average Annual Employment by Industry SectorLehigh Valley; Percent Change 2002 - 2011
Northampton County Lehigh County
Figure 20 - Average Annual Total Employment Lehigh Valley; 2002-2013
*Retail trade had a change of -0.6.Sources: U.S. Bureau of Labor Statistics and RKG Associates, Inc.

Cha
pter
4E
cono
mic
Pro
file
39
The Utilities Sector:
The Utilities sector is comprised of establishments engaged in the provision of the following utility services: electric power, natural gas, steam supply, water supply, and sewage removal. Within this sector, the specific activities associated with the utility services provided vary by utility: electric power includes generation, transmission and distribution; natural gas includes distribution; steam supply includes provision and/or distribution; water supply includes treatment and distribution; and sewage remov-al includes collection, treatment and disposal of waste through sewer systems and sewage treatment facilities.
Please note that, after a reclassification in 2002, this sector does not include the employees involved in the management of utility companies, as those employees are allocated in the Management of Companies industry sector. The Utilities sector includes only the employees involved in the production or provision of a utility such as power line repair and installation, meter readers and me-chanics and technicians that maintain the specific utility, regardless of power source (electricity or gas) or function (water, sewer or energy production). This explains much of the employment loss in Utilities from 2002 to 2013, as many of these workers simply became reclassified from Utilities to Management of Companies—a shift which had particular impact in Lehigh County.
According to the Bureau of Labor Statistics, increased competition, conservation, improved equipment and ap-pliances, technological advancements and more efficient power plants will require fewer employees in this industry in the future.
Source: Lehigh Valley Employment Forecast…2040, pre-pared by the Lehigh Valley Planning Commission, October 25, 2012.
Largest Non-Governmental EmployersLehigh Valley; 2012Rank Employer Employees1 Lehigh Valley Hospital and Health Network 11,6592 St. Luke's Hospital and Health Network 8,9003 Air Products 3,5004 Giant Food Stores 2,4495 PPL 2,4136 Sands Casino Resort Bethlehem 2,2007 Sodexo 2,1708 B. Braun 1,9429 Amazon.com 1,93710 Mack Trucks 1,90011 Lehigh University 1,88412 Wegmans 1,80313 Guardian Life Insurance Company of America 1,57414 Weis Markets, Inc. 1,40015 Northampton Community College 1,35516 HCR Manorcare 1,29817 Easton Hospital 1,28918 Good Shepherd Rehabilitation Network 1,24819 Sacred Heart Healthcare System 1,21920 KidsPeace 1,18721 Lutron Electronics Co., Inc. 1,10022 Crayola 1,10023 Wells Fargo 1,05724 Walmart 1,00025 Lehigh Carbon Community College 961Source: The Morning Call , February 3, 2013
Figure 21

40
Figure 22 illustrates the relative strength of industry sectors in the Lehigh Valley in comparison to the national economy based on their Location Quotient (LQ). The LQ relates the portion of the local employment in a given industry sector to the portion of that industry sector in the national economy. For example, if a sector’s LQ is equal to 1.0 in Figure 22, it indicates that the Lehigh Valley has the same percentage of employees as found at the national level. An LQ above or below 1.0 indicates stronger or weaker employment performance in comparison to the national economy.
As shown in Figure 22, there is variation between Lehigh and Northampton counties with regard to their individual LQs within a number of sectors, most notably Management of Companies and Health Care/Social Assistance, where Lehigh’s LQ is high and Northampton’s is below 1.0, and Educational Services, where Northampton far surpasses Lehigh. Among the sectors that particularly underperform when compared to national levels are Real Estate, Professional/Technical Services, Information, Utilities, Construction and Accommodation.
Figure 23 presents the total annual wages paid within each industry sector in the Valley as of 2011 and also illustrates the competitiveness of area wage rates in comparison to statewide averages. Overall, the total average annual wages paid by Valley businesses ($44,826) are approximately 5% below the state annual wages ($47,035). Although about one-third of the Valley’s sectors paid wages in 2011 that are below the average
but still competitive (i.e. those between 94%-99% of the state average), an additional one-third pay less than 91% of the statewide average. Such low wages in relation to the state has the potential to make hiring new employees more difficult, especially if they need to relocate from another geographic area. Lower annual wages also suggest that workers in these sectors may find it more challenging to support cost of living requirements in a growing economy.
Projections by the Lehigh Valley Planning Commission to 2040 anticipate a 37.7% total increase in employment between 2010 and 2040. Figure 24 presents projected total employment for all industry sectors. Economic trends are projected to have a mixed impact on regional industries. Overall job losses in Manufacturing, Farming, Utilities and Information are projected to be small in comparison to the job growth in other sectors of the economy, such as Construction, Health Care and Professional/Technical Services.
By 2040, the forecasts anticipate job expansion in the majority of occupations. Occupational classifications describe the type of work a person performs, rather than the industry they work in. Industries may have a large variety of occupations, encompassing a wide range of skill sets and requiring different levels of education. Figure 24 summarizes the sectors projected to experience the greatest gain or loss from 2010 - 2040.

Cha
pter
4E
cono
mic
Pro
file
41
Sources: U.S. Bureau of Labor Statistics and RKG Associates, Inc.
0 1 2 3
Real estate
Professional/Tech services
Information
Utilities
Construction
Accommodation/food services
Other services
Finance and insurance
Wholesale trade
Retail trade
Manufacturing
Administrative
Health care/social assistance
Arts, entertainment/recreation
Educational services
Transportation/warehousing
Management of companies
Lehigh ValleyNorthampton County
Lehigh County
Lehigh Valley Above U.S.Lehigh Valley Below U.S.
Figure 22 - Location Quotients Lehigh Valley & Counties, 2011

42
Total and Average Annual WagesLehigh Valley and the State of Pennsylvania; 2011
NAICS IndustryTotal Annual
Wages % Total StateLehighValley % State
Total, Covered $12,265,420,552 — $47,035 $44,826 95.3%Government $1,452,962,124 11.8% $49,569 $45,197 91.2%Private $10,812,458,428 88.2% $46,662 $44,777 96.0%
55 Management of companies $1,179,991,620 10.9% $106,939 $125,866 117.7%62 Health care and social assistance $2,200,903,081 20.4% $43,369 $47,180 108.8%48-49 Transportation and warehousing $553,414,450 5.1% $39,788 $41,922 105.4%22 Utilities $92,785,134 0.9% $100,310 $104,961 104.6%31-33 Manufacturing $1,598,151,948 14.8% $55,239 $55,716 100.9%44-45 Retail trade $790,083,878 7.3% $25,287 $24,971 98.8%72 Accommodation and food services $311,256,236 2.9% $15,485 $15,127 97.7%42 Wholesale trade $757,096,115 7.0% $68,717 $66,447 96.7%23 Construction $506,781,511 4.7% $54,652 $52,614 96.3%81 Other services $223,407,248 2.1% $28,133 $26,593 94.5%51 Information $253,021,623 2.3% $65,805 $61,833 94.0%61 Educational services $346,071,571 3.2% $49,667 $44,840 90.3%56 Administrative and waste services $547,585,552 5.1% $31,313 $28,248 90.2%71 Arts, entertainment, and recreation $133,484,792 1.2% $29,452 $23,126 78.5%53 Real estate and rental and leasing $87,194,233 0.8% $48,648 $37,136 76.3%54 Professional and technical services $611,392,083 5.7% $79,112 $59,811 75.6%52 Finance and insurance $590,805,696 5.5% $75,016 $55,423 73.9%Sources: U.S. Bureau of Labor Statistics and RKG Associates, Inc.
Average Annual Wages
Figure 23

Cha
pter
4E
cono
mic
Pro
file
43
Figure 24 - Employment Projections by Industry Sector
Sources: U.S. Bureau of Labor Statistics, LVPC
Empl
oym
ent

44
LABOR FORCE CHARACTERISTICS
Changes in the Valley’s labor force and unemployment rates from 2002 to 2012 are illustrated in Figure 25, based on BLS Local Area Unemployment Statistics (LAUS). As shown, the Lehigh Valley’s labor force increased steadily from the beginning of the decade through 2008 when the recession began to have an impact as workers left the area or exited the job market. However, over the course of the entire decade, the Valley experienced a net increase in labor force of more than 31,000, or 10%, resulting in a 2012 total of approximately 341,000 workers. At a rate of 8.6%, Lehigh County’s labor force increased more rapidly than Northampton County’s 6.7%, while the latter county’s overall employment growth rate was higher. This dichotomy suggests that Lehigh County’s total labor force participation rate was greater.
Unemployment rates have fluctuated over the decade but remain considerably higher since 2009 than those in 2002. Overall, unemployment rates in Lehigh and Northampton counties trended fairly consistently with the state but peaked slightly higher in 2010 at approximately 9% for the counties compared to 8.5% for the state. The counties have retained a higher unemployment rate than the state since 2007, as shown in Figure 25.
Sources: U.S. Bureau of Labor Statistics and RKG Associates, Inc.
0.01.02.03.04.05.06.07.08.09.010.0
290,000295,000300,000305,000310,000315,000320,000325,000330,000335,000340,000345,000
2002 2003 2004 2005 2006 2007 2008 2009 2010 2011 2012
Une
mpl
oym
ent R
ate
Labo
r For
ce
Labor Force and Unemployment RatesLehigh & Northampton Counties, State of Pennsylvania
Lehigh Valley Labor Force Northampton County
Lehigh County Pennsylvania
Figure 25 - Labor Force and Unemployment Rates, Lehigh and Northampton Counties, Pennsylvania

Cha
pter
4E
cono
mic
Pro
file
45
employment, unemployment rates for American Indians and Alaska natives in Lehigh and Northampton counties were significantly higher (10.0% and 12.5%, respectively) than the state as a whole (3.8%). Higher unemployment rates for certain groups, however small a portion of the population they may be, will significantly impact the financial ability of these constituents to find affordable housing in the Lehigh Valley.
Unemployment RateCivilian Labor Force; 2012
LehighCounty
NorthamptonCounty Pennsylvania
U.S. CENSUS [1]Male (Age 20 - 64) 8.4% 8.2% 8.4%Female (Age 20 - 64) 7.9% 6.6% 7.1%PENNSYLVANIA DEPT. LABOR & INDUSTRY2012 Annual Unemployment Rate 8.5% 8.4% 7.9%April 2014 Unemployment Rate 5.9% 6.1% 6.0%[1] American Community Survey, 2008-2012Sources: U.S. Census Bureau, PA Dept of Labor & Industry and RKG Associates, Inc.
Figure 27
Sources: U.S. Census Bureau, PA Dept of Labor & Industry and RKG Associates, Inc.
0.0%
5.0%
10.0%
15.0%
20.0%
25.0%
White Black orAfrican
American
AmericanIndian and
AlaskaNative
Asian NativeHawaiianand Other
PacificIslander
Some otherrace
Two ormore races
Hispanic Latinoorigin
% o
f Pop
ulat
ion
Unemployment RateCivilian Labor Force; 2012
Lehigh County Northampton County Pennsylvania
Figure 26 - Unemployment Rate Civilian Labor Force; 2012
Census data provides further insight into unemployment rates by categorizing unemployment by race/ethnicity, sex and other demographic characteristics as seen in Figures 26 and 27. The most recent unemployment rate for males is higher than females in the Lehigh Valley and Pennsylvania as a whole—a national trend in which many of the most significant job losses during the 2008 Recession occurred in male-dominated occupations and industries. Among racial differences in

46
The educational attainment levels of the region’s labor force are presented in Figure 28. For the most part, the percentage of Valley residents with post-secondary school degrees from 2000 to 2010 was essentially equivalent to the state’s
Figure 28
percentage as a whole. Generally, this data suggests that the distribution of highly-trained and semi- to low-skilled workers can support a range of occupational skills that area businesses may require.
Less than 9th Grade
5%
9th-12thGrade, No Diploma
9%
High School Graduate
35%
Some College, No Degree
17%
Associate's Degree
8%
Bachelor's Degree
16%
Graduate or Professional
10%
Sources: U.S. Census Bureau and RKG Associates, Inc.
Educational Attainment, Population 25+ Years of Age Lehigh Valley; 2010
Less than 9th Grade
4%
9th-12th Grade, No Diploma
9%
High School Graduate
38%Some College, No Degree
16%
Associate's Degree
7%
Bachelor's Degree
16%
Graduate or Professional
10%
Sources: U.S. Census Bureau and RKG Associates, Inc.
Educational Attainment, Population 25+ Years of Age Pennsylvania; 2010

Cha
pter
4E
cono
mic
Pro
file
47
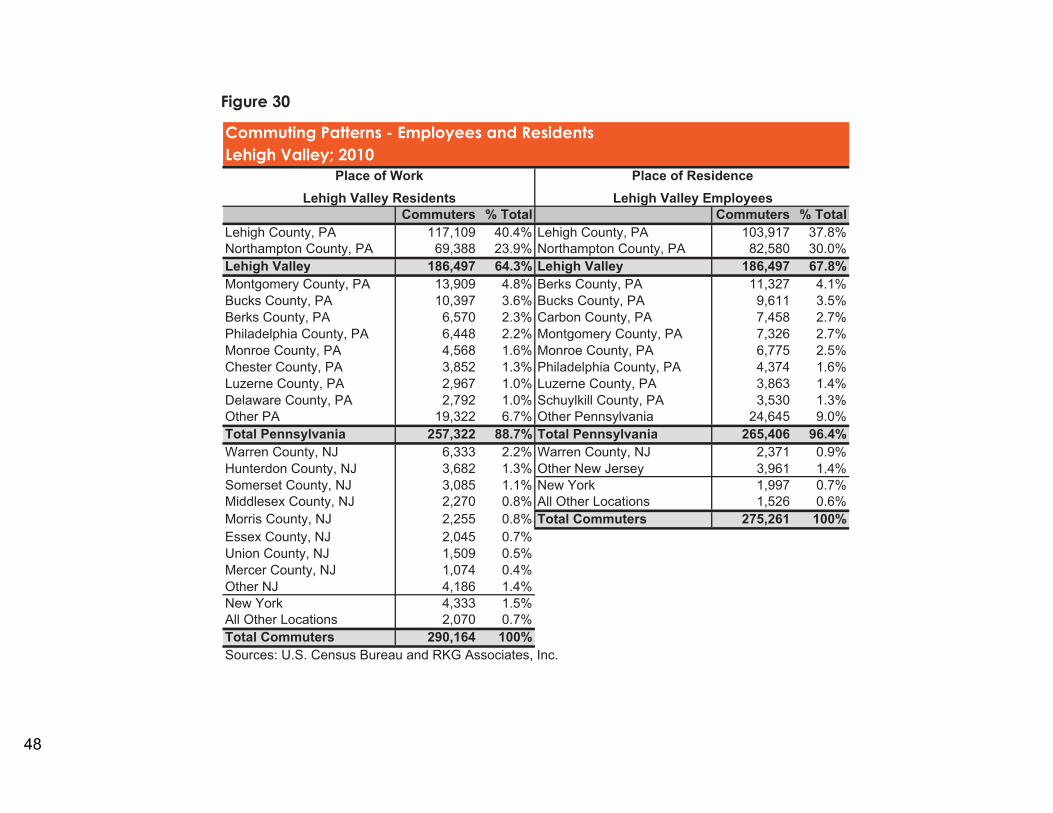
Figures 29 and 30 present commuting-to-work patterns for the Lehigh Valley. The figures depict the overall number of commuters who live and/or work in the Valley as of 2010. Figure 29 illustrates that 186,497 residents of Lehigh and Northampton counties both live and work within the Valley,
Sources: U.S. Census Bureau and RKG Associates, Inc.
Figure 29 - Job Flows; 2010
while 103,667 Valley residents commute to locations outside the region for work, and 88,764 workers who reside outside the Valley commute inward for their jobs. The Valley is a net exporter of labor.
48
Commuting Patterns - Employees and ResidentsLehigh Valley; 2010
Commuters % Total Commuters % TotalLehigh County, PA 117,109 40.4% Lehigh County, PA 103,917 37.8%Northampton County, PA 69,388 23.9% Northampton County, PA 82,580 30.0%Lehigh Valley 186,497 64.3% Lehigh Valley 186,497 67.8%Montgomery County, PA 13,909 4.8% Berks County, PA 11,327 4.1%Bucks County, PA 10,397 3.6% Bucks County, PA 9,611 3.5%Berks County, PA 6,570 2.3% Carbon County, PA 7,458 2.7%Philadelphia County, PA 6,448 2.2% Montgomery County, PA 7,326 2.7%Monroe County, PA 4,568 1.6% Monroe County, PA 6,775 2.5%Chester County, PA 3,852 1.3% Philadelphia County, PA 4,374 1.6%Luzerne County, PA 2,967 1.0% Luzerne County, PA 3,863 1.4%Delaware County, PA 2,792 1.0% Schuylkill County, PA 3,530 1.3%Other PA 19,322 6.7% Other Pennsylvania 24,645 9.0%Total Pennsylvania 257,322 88.7% Total Pennsylvania 265,406 96.4%Warren County, NJ 6,333 2.2% Warren County, NJ 2,371 0.9%Hunterdon County, NJ 3,682 1.3% Other New Jersey 3,961 1.4%Somerset County, NJ 3,085 1.1% New York 1,997 0.7%Middlesex County, NJ 2,270 0.8% All Other Locations 1,526 0.6%Morris County, NJ 2,255 0.8% Total Commuters 275,261 100%Essex County, NJ 2,045 0.7%Union County, NJ 1,509 0.5%Mercer County, NJ 1,074 0.4%Other NJ 4,186 1.4%New York 4,333 1.5%All Other Locations 2,070 0.7%Total Commuters 290,164 100%Sources: U.S. Census Bureau and RKG Associates, Inc.
Place of Work Place of ResidenceLehigh Valley Residents Lehigh Valley Employees
Figure 30

Cha
pter
4E
cono
mic
Pro
file
49
Figure 30 shows the place of work of Lehigh Valley residents as of 2010, based on U.S. Census Bureau 1-year estimates. As shown, approximately 64% live and work in the region. Of those who commute elsewhere, about 24% work in other Pennsylvania counties and 9% commute to locations in New Jersey, where approximately 26,400 Valley residents are employed. For Valley residents who work in-state, a large concentration is employed to the south along the highway corridors linking the Valley with Montgomery, Bucks and Philadelphia counties, as well as the adjoining counties of Berks and Monroe to the west and north.
The other portion of the table shows the place of residence for employees who work in the Lehigh Valley. Of the 275,261 who are estimated to commute to work in the region, approximately 68% reside in the Valley while approximately 29% live in other parts of Pennsylvania. Less than 4% commute to the
region from out-of-state, a considerable contrast to commuting patterns of Valley residents noted above. The most likely explanation for this disparity is that while housing prices and taxes in New Jersey tend to be more onerous, wages are often higher, thereby compelling people with jobs in New York City or New Jersey to seek Pennsylvania as their place of residence. The in-commuters also reflect the strong linkage to the south towards Philadelphia. The data also indicate a greater draw of employees from northern counties, such as Carbon, Schuykill and Monroe, than is evident in the out-commuting patterns that are more oriented towards New Jersey.
From a financial perspective, the Valley’s median household income (MHI) has been slightly above 110% of the statewide MHI for the three Census years examined (1990, 2000 and 2010 (1-yr estimates)), as shown in Figure 31. The Valley’s nominal MHI increased by 36% and 27%, respectively, for the two decades presented in the table.
Figure 31
Median Household IncomesInflation Adjusted Table
Nominal Real Nominal Real Nominal Real Nominal Real Nominal RealLehigh County $32,455 $62,266 $43,449 $62,044 $53,541 $58,413 33.9% -0.4% 23.2% -5.9%Northampton County $32,890 $63,101 $45,234 $64,593 $58,762 $64,110 37.5% 2.4% 29.9% -0.7%Lehigh Valley $32,673 $62,684 $44,342 $63,319 $56,152 $61,262 35.7% 1.0% 26.6% -3.2%Pennsylvania $26,069 $43,492 $40,106 $57,270 $50,398 $54,984 53.8% 31.7% 25.7% -4.0%
1990 2000 2010 % Change 00-10% Change 90-00
Sources: Lehigh Valley Trends Reports 1990, 2000, 2010; U.S. Census Bureau American Community Survey, 2010Note: Inflation for the real income figures in each decade was calculated using the CPI differentials on the inflation calculator published by the BLS. For more information on real and adjusted income, please refer to the inset article in the orange box on page 53.

50
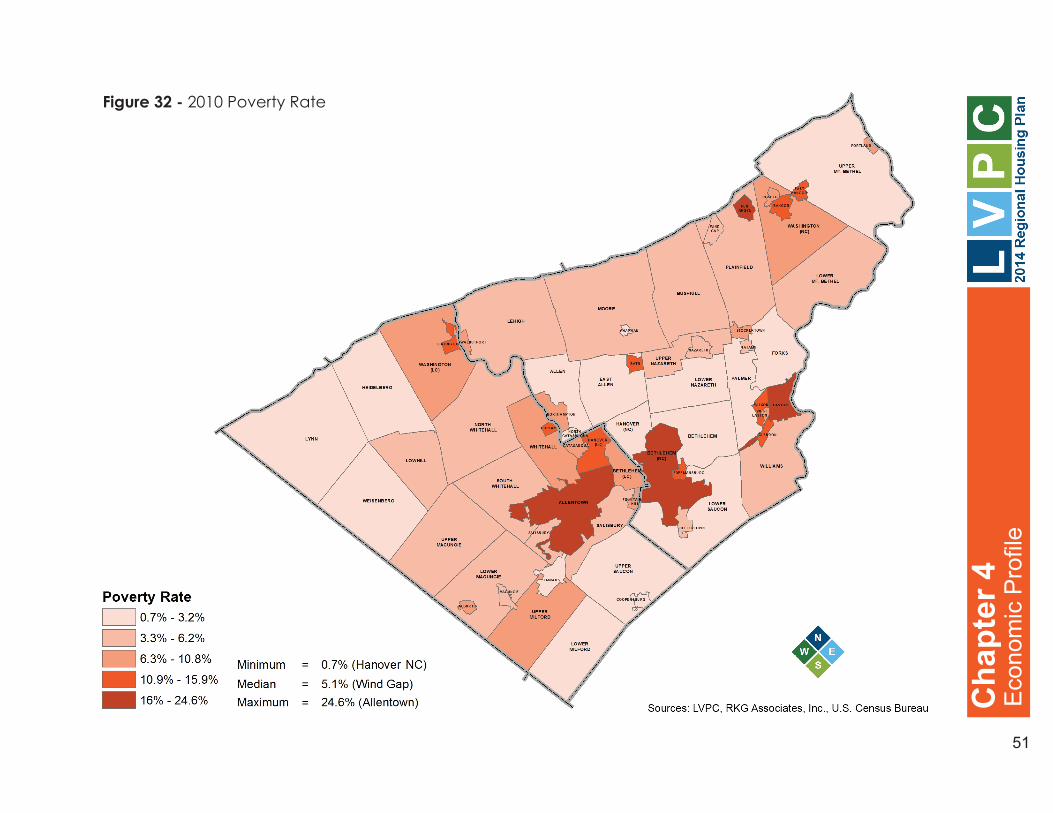
Despite the household income increases noted above, the number of persons living below the poverty threshold, as determined by the U.S. Department of Housing and Urban Development (HUD), increased in the Valley over the last decade. The number of persons in poverty increased from 8.7% to 10.5% between 2000 and 2010 (5-year estimates). This represents approximately 16,000 additional persons. Despite this regional increase in the poverty rate, the Valley’s rate remains below the state’s, which increased from 11% to 12.4% during this time period. The Valley’s three cities of Allentown, Bethlehem and Easton are home to about 68% of the region’s residents in poverty, with the remaining 32% disbursed throughout the Valley, seen in Figure 32. Besides the three cities, a number of boroughs have poverty rates equivalent to or higher than the region as a whole, but only one township, Hanover in Lehigh County, shares this distinction. Meanwhile, several communities experienced significant declines in the poverty rate, most notably Heidelberg Township in Lehigh County (a 4.0% decrease), and the boroughs of
Chapman, North Catasauqua and Wind Gap in Northampton County (4.0%, 4.8% and 6.8%, respectively), as seen in Figure 33.
Population and employment growth over the last few decades have presented opportunities and challenges to the region. The fact that Northampton County’s employment grew slightly, even during the peak of the 2008 Recession, suggests a resiliency to the local economy that favorably distinguishes it from other jurisdictions. In keeping with the shifts from previous decades, certain industries are poised to grow or shrink in the future, putting new demands upon the labor force in terms of particular skill sets and levels of educational attainment. Meanwhile, the favorable cost of living has impelled both high and low income people to move to the region, concurrently altering the markets for certain types of housing. All of these socioeconomic variables have influenced how the Lehigh Valley has grown and will continue to shape the cost, character and construction of the region’s housing.
Cha
pter
4E
cono
mic
Pro
file
51
Figure 32 - 2010 Poverty Rate

52
Figure 33 - Change in Poverty Rate; 2000-2010

Cha
pter
4E
cono
mic
Pro
file
53
This chapter has emphasized employment and wages in the Lehigh Valley, as well as how these compare to the state as a whole. Figure 23 observes that, at $44,826, the Lehigh Valley’s average annual wages are approximately 5% below the wages for Pennsylvania ($47,035). While this statistic could cause concern, it does not account for the fact that median household incomes paint a more optimistic picture, as evidenced from Figure 31. Viewed from this angle, household incomes for the Valley have remained higher than for Pennsylvania, both nominally (actual income received) and real (those same numbers adjusted for inflation).
The explanation for these differences is semantic. Wages refer exclusively to earnings from employment; income includes earnings as well as other money received, either through investments, pensions,
accrued interest or other dividends. Therefore, income metrics should always be higher than wages. In addition, the median household income refers to households rather than individuals. A household includes all the individuals that make up a single residential unit, which can involve more than one wage earner (i.e., a husband and wife). The inclusion of both households and incomes as variables should nearly always result in higher numbers for household incomes than for annual wages.
Both of these figures will prove important for the subsequent analyses. The household income has more bearing on most of the studies performed in the housing affordability analysis, while annual wages prove more influential in the jobs-housing balance analysis.
DISTINgUISHINg AvERAgE ANNUAL WAgES FROM MEDIAN HOUSEHOLD INCOME