CHAPTER 4 Mortality Rates Part 1. Were Mortality-Rates ...
12
CHAPTER 4 Mortality Rates --- The Responses in the Dose-Response Studies Part 1. Were Mortality-Rates Always Recorded? Part 2. Our Sources for Mortality Rates Part 3. Estimated Frequency of Misdiagnosis on Death Certificates Part 4. Age-Adjustment: "Matching" of the Nine Census Divisions Part 5. Causes of Death Reported in Grove 1968, with Subsets and Numbers Box 1. The "Standard Million Population, 1940." Box 2. Illustrative Calculation of an Age-Adjusted MortRate. Box 3. Age-Specific Mortality-Rates for Breast Cancer, 1950-1990. Box 4. The Age-Groups Accounting for 93 % of the 1990 Age-Adjusted National Cancer Death-Rate. Definition of Mortality Rate From here on, we will abbreviate "age-adjusted annual mortality-rate, per 100,000 population (everyone)" as mortality rate. For brevity, MortRate. When pressed for space: MR or mr. The word "annual" is rarely expressed in connection with mortality rates, but they are rates per year. By "everyone," we mean there are no exclusions by color or "race." Location of MortRate Tables in This Book Unlike the Universal PhysPop Table 3-A, which is used repeatedly in chapter after chapter, the tables of mortality rates have to be specific for each cause of death studied. So readers will find such rates located at the end of the appropriate chapters. The first one occurs at the end of Chapter 6. Because age-adjusted mortality rates include ALL AGES at death, the MortRates are designated "male" or "female," rather than "rates for men" or "rates for women." Meaning and Utility of High-5 and Low-4 MortRates Readers will see High-5 and Low-4 MortRates in our MortRate tables. The High-5 MortRate always refers to the average MortRate in the Pacific, New England, West North Central, Mid-Atlantic, and East North Central Census Divisions combined. The Low-4 MortRate always refers to the average MortRate in the Mountain, West South Central, East South Central, and South Atlantic Census Divisions combined. UNLIKE the MortRates for individual Census Divisions, the High-5 and Low-4 MortRates are not population-weighted. They are approximations, useful in checking trends. For instance, as the Hi5/Lo4 ratio for male All-Cancer MortRates falls from 1.44 in 1940 to 0.96 in 1988 (Table 6-A), a reader knows instantly that major changes are occurring in the geographical distribution of cancer MortRates. Chapter 3, Part 4, explains how the permanent order in our list of Census Divisions was set in the first place. o Part 1. Were Mortality-Rates Always Recorded? We start our dose-response studies by comparing the behavior of CANCER mortality-rates and PhysPop values. Then we must do identical analyses of noncancer mortality-rates, to find out if cancer and noncancer MortRates behave DIFFERENTLY with respect to PhysPop values. (They do.) For our proposed dose-response studies, we would like to know the age-adjusted cancer MortRates and the PhysPops in the Nine Census Divisions, all the way back at least to 1895 --- the year in which Roentgen published his discovery of the xray (Roentgen 1895). But that is not possible. Although it is pleasant to assume that Vital Statistics on births, deaths, causes of death, and so forth, have "always" been there, reality is very different. The death registration-system evolved gradually, from only 10 states in 1900, to all 48 states in 1933 --- with Alaska added in 1959 and Hawaii in 1960. From the 1968 Grove book (p.7), we quote: - 77 -
Transcript of CHAPTER 4 Mortality Rates Part 1. Were Mortality-Rates ...

CHAPTER 4
Mortality Rates --- The Responses in the Dose-Response Studies
Part 1. Were Mortality-Rates Always Recorded? Part 2. Our Sources for Mortality Rates Part 3. Estimated Frequency of Misdiagnosis on Death Certificates Part 4. Age-Adjustment: "Matching" of the Nine Census Divisions Part 5. Causes of Death Reported in Grove 1968, with Subsets and Numbers
Box 1. The "Standard Million Population, 1940." Box 2. Illustrative Calculation of an Age-Adjusted MortRate. Box 3. Age-Specific Mortality-Rates for Breast Cancer, 1950-1990. Box 4. The Age-Groups Accounting for 93 % of the 1990 Age-Adjusted National Cancer Death-Rate.
Definition of Mortality Rate
From here on, we will abbreviate "age-adjusted annual mortality-rate, per 100,000 population (everyone)" as mortality rate. For brevity, MortRate. When pressed for space: MR or mr. The word "annual" is rarely expressed in connection with mortality rates, but they are rates per year. By "everyone," we mean there are no exclusions by color or "race."
Location of MortRate Tables in This Book
Unlike the Universal PhysPop Table 3-A, which is used repeatedly in chapter after chapter, the tables of mortality rates have to be specific for each cause of death studied. So readers will find such rates located at the end of the appropriate chapters. The first one occurs at the end of Chapter 6. Because age-adjusted mortality rates include ALL AGES at death, the MortRates are designated "male" or "female," rather than "rates for men" or "rates for women."
Meaning and Utility of High-5 and Low-4 MortRates
Readers will see High-5 and Low-4 MortRates in our MortRate tables. The High-5 MortRate always refers to the average MortRate in the Pacific, New England, West North Central, Mid-Atlantic, and East North Central Census Divisions combined. The Low-4 MortRate always refers to the average MortRate in the Mountain, West South Central, East South Central, and South Atlantic Census Divisions combined. UNLIKE the MortRates for individual Census Divisions, the High-5 and Low-4 MortRates are not population-weighted. They are approximations, useful in checking trends. For instance, as the Hi5/Lo4 ratio for male All-Cancer MortRates falls from 1.44 in 1940 to 0.96 in 1988 (Table 6-A), a reader knows instantly that major changes are occurring in the geographical distribution of cancer MortRates. Chapter 3, Part 4, explains how the permanent order in our list of Census Divisions was set in the first place.
o Part 1. Were Mortality-Rates Always Recorded?
We start our dose-response studies by comparing the behavior of CANCER mortality-rates and PhysPop values. Then we must do identical analyses of noncancer mortality-rates, to find out if cancer and noncancer MortRates behave DIFFERENTLY with respect to PhysPop values. (They do.)
For our proposed dose-response studies, we would like to know the age-adjusted cancer MortRates and the PhysPops in the Nine Census Divisions, all the way back at least to 1895 --- the year in which Roentgen published his discovery of the xray (Roentgen 1895). But that is not possible. Although it is pleasant to assume that Vital Statistics on births, deaths, causes of death, and so forth, have "always" been there, reality is very different.
The death registration-system evolved gradually, from only 10 states in 1900, to all 48 states in 1933 --- with Alaska added in 1959 and Hawaii in 1960. From the 1968 Grove book (p.7), we quote:
- 77 -

(ˇICˇCC A
- 78 -
"The annual collection of mortality statistics for the national death-registration area began with the calendar year 1900. For the year 1900, figures were obtained from well-established registration areas which had adopted model laws and where it was believed that registration was at least 90% complete. [Example: Mass 1890 in our Reference List.] Each area had been requested to adopt a recommended death certificate by January 1, 1900. The death registration area for 1900 consisted of 10 states, the District of Columbia, and a number of cities located in nonregistration states ... From this time on, the Bureau [of the Census] completely abandoned the 50-year effort to obtain mortality information by census counts and relied solely on registration records." From Grove's Table B, we identify (below) the sequence in which the nationwide registry-system evolved, by Census Divisions. We exclude Alaska, Hawaii, and the District of Columbia, as stated in Chapter 3, Part 3b.
e EAST NORTH CENTRAL: Illinois 1918, Indiana 1900, Michigan 1900, Ohio 1909, Wisconsin 1908.
"* EAST SOUTH CENTRAL: Alabama 1925, Kentucky 1911, Mississippi 1919, Tennessee 1917.
"* MIDDLE ATLANTIC: New Jersey 1880, New York 1890, Pennsylvania 1906.
"* MOUNTAIN: Arizona 1926, Colorado 1906, Idaho 1922, Montana 1910, Nevada 1929, New Mexico 1929, Utah 1910, Wyoming 1922.
e NEW ENGLAND: Connecticut 1890, Maine 1900, Massachusetts 1880, New Hampshire 1890, Rhode Island 1890, Vermont 1890.
"* PACIFIC: California 1906, Oregon 1918, Washington 1908.
"* SOUTH ATLANTIC: Delaware 1890 (dropped in 1900, re-admitted in 1919), Florida 1919, Georgia 1922, Maryland 1906, North Carolina 1916, South Carolina 1916, Virginia 1913, West Virginia 1925.
9 WEST NORTH CENTRAL: Iowa 1923, Kansas 1914, Minnesota 1910, Missouri 1911, Nebraska 1920, North Dakota 1924, South Dakota 1906 (dropped in 1910; re-admitted in 1930).
9 WEST SOUTH CENTRAL: Arkansas 1927, Louisiana 1918, Oklahoma 1928, Texas 1933.
e Part 2. Our Sources for Mortality Rates
The age-adjusted mortality rates in this book, per 100,000 population (all colors) come from
three sources.
2a. Mortality Rates for 1940, 1950, 1960
The rates for 1940, 1950, and 1960 come from Grove 1968 in our Reference List. The book is "Vital Statistics Rates in the United States 1940-1960" by Robert D. Grove and Alice M. Hetzel, of the U.S. Public Health Service, National Center for Health Statistics (NatCtrHS).
In Grove 1968 is Table 67, entitled Age-Adjusted Death Rates for 32 Selected Causes by Color and Sex: United States, Each Division and State, 1940, 1950, and 1960. In Part 5 of this chapter, we show what Table 67 covers. The mammoth table begins on page 663 of Grove 1968, and continues through page 770.
Table 67 presents MortRates for 1940, 1950, 1960 which are age-adjusted to 1940 (discussion in Part 4, below). We use the rates for everyone combined (no exclusions by color or "race"). Our exclusion of Alaska, Hawaii, and the District of Columbia (Chapter 3, Part 3b) merits a comment, here:
Grove states explicitly (p.40) that the 1940 and 1950 MortRates exclude Alaska and Hawaii, and that Alaska and Hawaii are both INCLUDED in the 1960 rates. So, 1960 is the one year in this book for which the MortRate (Pacific Census Division) includes Alaska and Hawaii. Although we would have preferred to be absolutely consistent, this 1960 exception must be inconsequential, since the
1

Chap.4 Radiation Medical in tie Patho enesis of Cancer and Ischemic Heart Disease John W. Gofman 1960 populations of Alaska and Hawaii (226,167 and 632,772 respectively) were too small to have much impact on the 1960 population-weighted MortRate of the entire Pacific Census Division (population = 21 million, from Table 3-B). As for the District of Columbia (which is part of the South Atlantic Census Division), Grove's handling is unclear to us. What is clear is that the population of the District (663,091 in 1940, 763,956 in 1960) was too small to have much impact on the 1940-1960 population-weighted MortRates of the entire South Atlantic Census Division (population = 18 million in 1940, 21 million in 1950, and 26 million in 1960; from Table 3-B). By contrast with the post-1960 MortRates by CENSUS DIVISIONS, the 1960 and post-1960 consolidated NATIONAL MortRates in our tables do include Alaska, Hawaii, and the District of Columbia. As readers observe what we do with all these numbers, they will see that this inconsistency can be of no consequence in testing Hypotheses 1+2.
2b. Mortality Rates for 1970, 1980, 1990 Unfortunately, there is no publication comparable to Grove 1968 for the years after 1960. The reason is said to be insufficient funding for the work. 9 1980: The National Center for Health Statistics in Hyattsville, Maryland, has an exemplary policy of trying to provide data for research anyway. We extend our deepest appreciation for the cooperation of Dr. Harry Rosenberg and Dr. Jeff Maurer of the Center. They provided data for 1979-1981 which is comparable to Table 67 of Grove 1968. These data (over 150 pages of printout) are NatCtrHS 1980 in our Reference List. The printout covers many, but not all, of the causes of death we examined from Grove 1968. Each page begins with the following header: "Average age-adjusted death rates and standard errors (SE) for major causes, by race and sex; United States and rank for each state, 1979-1981. Based on age-specific death rates per 100,000 population ... using as standard population the age distribution of total U.S. population as enumerated in 1940." So these data (all "races" combined) provide input which can be regarded as 1980 data.
* 1970: At the time we needed all these data, Drs. Rosenberg and Maurer were unable to provide for 1970 what they had provided for 1980. Therefore, we produced synthetic values for 1970 by taking the average of 1960 and 1980 in each Census Division. As readers observe what we do with all these numbers, they will see that the approximation for 1970 is of no consequence in testing Hypotheses 1+2.
* 1990: If we were starting this project NOW, the acquisition of 1990 health data would be much easier. But when we DID start, Drs. Rosenberg and Maurer recommended that we patch together whatever we could find for 1990 from a feature called State Maps in the publication "Monthly Vital Statistics Report," which is MVS in our Reference List. On an irregular basis, issues of MVS used to provide (until recently) age-adjusted mortality rates with the 1940 reference year, by gender and states, for variable sets of years such as 1987-1989 and 1989-1991 --- for many but not for all of the entities in Grove's Table 67. One of the missing entities: Ischemic Heart Disease. As our work progressed, so did the online resources of the National Center for Health Statistics (which is a subdivision of the federal CDC --- Centers for Disease Control and Prevention). Ultimately, it became possible to extract the 1993 Ischemic Heart Disease MortRates (all-race males, all-race females, age-adjusted to 1940, by states) from the CDC's online "WONDER" database. We are comfortable about treating MortRates in the 1988-1993 range as if they were 1990 MortRates, because such rates seldom change appreciably over short periods of time. Unlike the 1940, 1950, and 1960 data from Grove 1968, the MortRates per 100,000 population for 1980 and "1990" were not "pre-packaged" by Census Divisions. They were obtained by states. We grouped states into their proper Census Divisions (Part 1), and then used the 1980 or 1990 populations of each state to obtain population-weighted MortRates for each Division.
2c. Some Incomplete Sections in Our Mortality-Rate Tables Some of the MortRate tables in this book are incomplete, our entries for 1970 are interpolations between 1960 and 1980, and instead of all-1990 rates, sometimes we obtained 1988 or 1993 rates, as
- 79 -

Cm. Radiation (Medical in the Pathoenesis of Cancer and Ischemic Heart Disease john W. Gofman
noted above. If we were starting NOW "from scratch," we are confident that we would be able to
acquire more of the missing data, because recently the federal government has greatly improved online
access to its current health statistics. See, for instance: < http://wonder.cdc.gov/WONDER/>, and
also the "FedStats" site, < http://www.fedstats.gov >. Online availability of older data may (or may
not) improve too.
As readers see the nature of our analyses, they will see for themselves why we are correct in
asserting that the remaining gaps or interpolations in our MortRate tables are only marginally relevant
to examining Hypotheses 1+2. For instance, the MVS Reports did not provide the 1990 MortRates by
Census Divisions for Urinary-System Cancers, for female Genital Cancers, and for male
Buccal/Pharynx Cancers. These arbitrary gaps have no effect on Hypothesis-i, which concerns All
Cancer Combined --- for which we do have data. Out of curiosity (not out of necessity), we opted to
examine as many components of All Cancers Combined as the available data permitted at the time.
The fact that some data were not available does not weaken the examination of Hypothesis-I.
In Section Three, we undertook to find out if cancer and noncancer MortRates behave
differently with respect to PhysPop values. We found ample data (Chapter 24) to establish that they
do. Again out of curiosity (not out of necessity), we opted to examine as many components of All
Noncancers Combined as the available data permitted at the time. The fact that we are missing
post-1 9 6 0 MortRates for Appendicitis, Hypertensive Disease, Rheumatic Fever & Rheumatic Heart
Disease, Syphilis, Tuberculosis, and Ulcers, cannot undermine what we needed to establish (and did
establish) in Chapters 24 and 25, with respect to Hypotheses 1+2.
2d. Changes in ICD Numbers over Time
In our MortRate tables, we show numbers from the International Classification of Diseases
(ICD) whenever possible, so that anyone can check exactly what the MortRates cover. In Part 5 of this
chapter, we show in detail how disorders are grouped together.
Most of our MortRate tables cover 1940-1990. During those decades, the numbers assigned to
various diseases were altered in the ICD system. ICD/7 indicates the Seventh Revision of ICD, and
ICD/9 indicates the Ninth Revision. In the MortRate tables of this book, the ICD numbers for the
1940-1960 entries (ICD/7) often differ from the ICD/9 numbers stated for 1980. The continuity in
MortRates from decade to decade is maintained by definition of the named entities, not by ICD
numbers.
2e. Are There Worrisome Discrepancies between Sources?
It is easy to conjure up APPARENT disparities in mortality rates among various sources: The
government's publications, its online databases, and non-government publications. We have a few
comments about this:
e - Most often, apparent discrepancies disappear when one stops trying to compare two
non-comparable tables!
o - In Part 2a of this chapter, we inform readers that MortRates in our tables, by Census
Divisions, exclude Alaska, Hawaii, and the District of Columbia --- which means that our tables are
not comparable to tables which include those entities.
o - In Part 4a of this chapter, we remind readers never to compare two sets of MortRates which
are age-adjusted to different reference years.
9 - In Chapter 23, Part 2b, we warn readers not to compare death-rates from
3 2-Causes-of-Death-Combined, with death-rates in other publications for ALL Causes of Death
Combined.
* - In Section Five, we warn readers not to compare MortRates for Ischemic Heart Disease (or
Coronary Heart Disease) with MortRates for "Diseases of the Heart" in other publications. These are
not the same entities. Apples and oranges.
- 80 -
Chap.4 Radiation (Medical) in the Pathogenesis of Cancer and lschemic Heart Disease John W. Gofman 9 - The National Center for Health Statistics deserves enormous credit for the overwhelming agreement among its own databases. Apparent discrepancies are rare, and seem to have explanations if one pursues the issue far enough.
* - The minor discrepancies which remain among various databases certainly do not have a magnitude capable of invalidating the findings in this book. The discrepancies are inconsequential. e Part 3. Estimated Frequency of Misdiagnosis on Death Certificates
Some efforts have been made to estimate the rate at which Cancer is under-reported on death certificates. For example, the handlers of the Atomic-Bomb Survivor Database decided that they needed to multiply the reported rates for malignancies by a factor of 1.23, in order to compensate for "incomplete death-certificate ascertainment of cancer" (discussion in Gofman 1990, p. 11-3). Their decision was based on a 1973 study comparing autopsy and death-certificate diagnoses (Steer 1973; BEIR 1980, p. 196; additional references in Pierce 1996-b, p.3). Such underascertainment in the past is not surprising to us. We are directly aware that, in some circles, there was almost a taboo against admitting that a family member died of Cancer. In addition, it can be medically difficult sometimes, without an autopsy, to distinguish between various causes of death. For instance, undoubtedly some death certificates saying cirrhosis of the liver really should say metastatic Cancer, and some certificates attributing death to stomach ulcer should really say Cancer.
3a. USA: Estimated Frequency of "Missed Cancer Diagnoses"
On the problem of under-reporting of Cancer, and misdiagnosis of a cancer's original site, Rolla B. Hill and Robert E. Anderson contributed an eye-opening article entitled "The Autopsy in Oncology" (Hill 1992). In their article, they provide Table 2, entitled "Literature Sources for Clinical Cancer Diagnosis Compared with Autopsy Findings." The table describes eleven reports, covering various years between 1917 to 1988. The first report in their list is by H.G. Wells (Wells 1923). They state (Hill 1992, p.48):
"H.G. Wells reviewed 578 autopsies of cancer patients from Chicago hospitals during 1917 to 1922 and found that in 31 percent, Cancer was first discovered at autopsy (clinical false negatives) and that 6 percent of those diagnosed clinically were not present at autopsy (clinical false positives)." And (Hill 1992, p.48):
"It is difficult to accept the fact that subsequent studies, including the most recent, have revealed only slight improvement in the overall incidence of missed cancer diagnoses. It would certainly seem that modern advances and invasive techniques have improved diagnostic ability. Yet the data in Table 2 indicate that this instinctive reaction is faulty ... Parallel findings have been reported for non-oncologic diagnoses, including evidence that modem imaging and invasive techniques must have had little overall effect on the discrepancy rate (Goldman 1983)." And (Hill 1992, p.51): "Unfortunately, studies of the validity of death-certificate diagnoses suggest that they may be wrong up to 50 percent of the time." For this assertion, Hill and Anderson cite 12 references not already cited in their Table 2. The opportunity to learn from autopsies has diminished dramatically. "In 1950, more than one half of the patients dying in U.S. hospitals were autopsied (Roberts 1978); in 1985, the comparable figure was only 10 percent (MMWR 1988), and it seems to have dropped slightly since then" (Hill 1992, p.47).
3b. Specific Cancers: "We Do Not Know the True Prevalence of Any Type of Cancer"
Referring to Cancer, Hill and Anderson state (Hill 1992, p.49): "Although it is discouraging ... to recognize that there has been little improvement during the past six to seven decades in overall diagnostic discrepancy rates in cancer patients, this does not mean that the situation has been static. Improvements with one type of tumor are matched by erosions elsewhere (Anderson 1989). Leukemia, for example, is currently rarely missed or overdiagnosed in patients who die and are autopsied, and the ability to make this diagnosis correctly has improved considerably over the past 50 years. In contrast, gastric carcinoma and carcinoma of the bronchus and lung have become appreciably harder to diagnose." Hill and Anderson point out (Hill 1992, p.51):
- 81 -

Chap.4 Radiation (Medical) hi the Pathopenesis of Cancer and Ischemic Heart Disease John W. Gofman
"Millions of dollars are committed each year to protocol studies, often funded by the National
Cancer Institute, in which patients with specific cancers are entered randomly into clinical trials. The
results of various approaches to treatment are compared, and the one that seems to hold the most
promise becomes the treatment of choice ... It is an arresting fact, however, that performance of
autopsy is not built into these studies, and there is no funding to cover the autopsy costs." They report
the cost at about $1,000 per autopsy (p. 5 4 ). Their article makes a compelling case for the
recommendation (p.4 9 ): "A program must be designed to evaluate the diagnostic error, determine its
cause, provide feedback to the appropriate persons, and ensure that the situation improves (Anderson
1990)." Hill and Anderson warn (1992, p.5 2 , emphasis in the original):
"The truth is that WE DO NOT KNOW the true prevalence of any type of cancer. We do not
even know how bad our present data are --- we just know that they are inaccurate and probably
unreliable." Burton 1998 presents additional data supporting that view (Burton 1998).
It seems reasonable to assume that, when clinicians create a death certificate in the absence of
an autopsy, they correctly distinguish Cancer from NonCancer as the cause more often than they
correctly name the ORIGINAL SITE of a fatal Cancer.
9 Part 4. Age-Adjustment: "Matching" of the Nine Census Divisions
In our dose-response studies, the nine sets of people who receive different average doses of
medical radiation are the populations of the Nine Census Divisions. The responses we are examining
are the nine separate mortality-rates, by Census Divisions, per 100,000 population.
In order to evaluate the extent to which variation in medical radiation explains variation in
MortRates, the MortRates must be validly COMPARABLE among the Nine Census Divisions. If the
Pacific Division were populated ONLY by children and the South Atlantic Division were populated
ONLY by retired people, their mortality-rates per 100,000 population would clearly not be comparable
--- because increased age is such an important correlate of death. In reality, every Census Division
has a mixture of all possible ages, but not in the same proportions. The distribution of ages is never
identical ("matched") across all Nine Census Divisions. Nor is age-distribution constant over the decades.
4a. The Reference Year for Age-Adjusted MortRates
Because the age-distribution differs among the populations of the Census Divisions, and
because age-distributions change with time, what we need to study are AGE-ADJUSTED mortality
rates --- always adjusted to a standard population of a specified reference-year. Our sources use 1940
as the reference year, and so we use 1940 consistently throughout the MortRate tables of this book.
Age-adjustment of MortRates can be done to any reference year, so it is important never to
ASSUME that mortality-rates are age-adjusted to the same reference year, and never to compare
mortality rates which have been age-adjusted to DIFFERENT reference years. While the National
Center for Health Statistics and the American Heart Association use 1940 as the reference year for
mortality-rates (confirmed in PHS 1995, p.2 9 8 , and in AHA 1995, p.23), the National Cancer Institute
and the American Cancer Society generally use 1970 as the reference year for their recent publications.
Some of the difficulties, caused by use of two standards, are apparent in a 1992 report of the Public
Health Service, entitled "Health: United States 1992" (PHS 1992, discussion at pages 327-330). We
note that in a 1997 article, "Cancer Undefeated," Bailar and Gornik have opted to age-adjust their data
to 1990 as the reference year (Bailar 1997, p. 15 7 0).
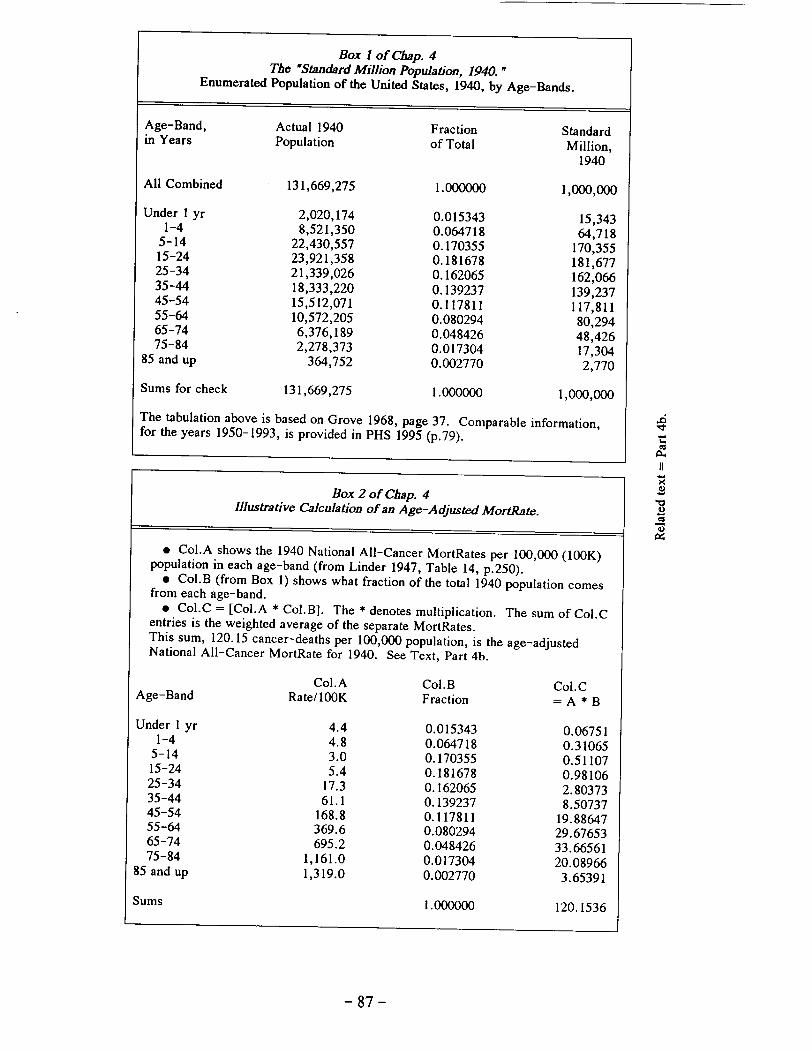
4b. Illustrative Calculation of an Age-Adjusted MortRate: Boxes 1 and 2
When 1940 is the reference year, the actual population of 1940 provides the Standard Million
Population. Grove 1968, p.37, provides the "Enumerated Population of the United States, 1940," by
age-bands. We show it in Box 1. The same data are available in PHS 1995 (p. 2 9 8).
In Box 2, we show an example of how the Standard Million Population of 1940 can be applied,
to arrive at an age-adjusted mortality rate. The illustration in Box 2 is generic. Column A could be
used for age-specific MortRates from any disease, in any year, in any geographical unit. We chose to
use, in Column A, the actual 1940 MortRates by age-bands, due to "Cancer and Other Malignant
- 82 -
I I

Chap.4 Radiation (Medical) in the Pathogenesis of Cancer and Ischemic Heart Disease John W. Gofman Tumors (45-55)" in the United States, from Linder 1947, Table 14, p.250. The sum of 120.15 in Box 2 is in excellent agreement with the 1940 national rate of 120.3 per 100,000 in Linder's Table 14. The small discrepancy is undoubtedly due to trailing digits.
Policy on Trailing Digits, Significant Figures
Calculations can never yield answers which are more precise than the least precise of the input numbers. Nonetheless, during a series of calculations, it is wise to retain all the trailing digits to the right of the decimal point. For example, when a measured value of 2 is divided by 3.1, the computer obtains an answer of 0.6451612. We, and most other sources, show readers SOME of the extra digits --- so that readers can reach answers which resemble the answers yielded by calculations done with the trailing digits. When readers and their sources reach slightly different answers, the reason almost certainly lies in additional "trailing digits." Extra digits provided in this book (and in many other sources) do NOT signify that measurements are highly precise. In other words, they are not "significant figures" in the formal sense.
Grove's Note about Table 67
Mortality rates for 1940, 1950, and 1960 in this book are taken from Table 67 of Grove 1968, as stated in Part 2a above. Grove comments (at p.35) that "The age-adjusted rates shown in Table 67 are computed from specific rates of the following broad age groups: Under 25, 25-44, 45-64, and 65 and over. Consequently, the age-adjusted rates shown in this table differ from those shown in other tables [which used the age-bands shown in our Box 1]. The rates for the total population and for each color-sex group are adjusted separately, using the same standard population."
Grove's Definition of Age-Adjusted Death Rates Grove defines age-adjusted death rates at p.35: "Age-adjusted death rates published in this volume are computed by the direct method. They are the death rates that would have been observed if the age-specific rates for the given year, computed for specified age intervals, had prevailed in a population whose age distribution was the same as that of the standard population. The entire enumerated population of the United States in 1940 is used as the standard."
4c. Comparability of Census Divisions: Matched for Age
The use of age-adjusted mortality rates is the equivalent of matching the populations of all Nine Census Divisions for age. In our dose-response studies, the MortRates from one Census Division to another are properly comparable with respect to the age-issue, because age-adjusted MortRates apply to 100,000 people with the SAME distribution of ages. If the population of one Census Division has a higher fraction of babies than another, or more elderly people, it does not matter --- because the actual number of deaths for a given age-band has been adjusted to conform to the age-distribution of the Standard Million Population of 1940, as illustrated in Part 4b above.
Changes in Population-SIZES over Time
As our studies progress from 1940 to later decades, the input remains comparable over TIME --- despite some rather dramatic changes in the relative population-sizes among the Nine Census Divisions (shown in Table 3-B of Chapter 3) --- because the comparisons are based on Physicians per 100,000 population and age-adjusted MortRates per 100,000 population.
4d. Age-Specific vs. Age-Adjusted MortRates; Boxes 3 and 4
The need for age-adjustment of MortRates does not occur if analysts are comparing rates per 100,000 people of the SAME age, of course. For example, a mortality rate per 100,000 people of age 45 could be directly compared across Census Divisions and across time. The need for age-adjustment occurs when comparisons involve populations having mixtures of ages (for instance, entire populations of Census Divisions).
Box 3 uses Breast Cancer mortality rates to illustrate the relationship among three types of MortRates: Age-adjusted, crude, and age-specific --- over the 1950-1990 period, by decades. While
- 83 -

Chap.4 Radiation (Medical) in the Pathogenesis of Cancer and Ischemic Heart Disease John W. Gofman
the age-adjusted National MortRate changes very little over time, age-specific rates are falling over
time in some age-groups and rising in others, per 100,000 persons of those age-groups.
Box 4 shows how the age-specific 1990 National All-Cancer MortRates (a) provide the basis
for the age-adjusted 1990 National All-Cancer MortRate, and (b) provide the basis for learning which
age-groups account for various FRACTIONS of the age-adjusted 1990 National All-Cancer MortRate.
We needed to know such fractions in Chapter 2, Part 3.
9 Part 5. Causes of Death Reported in Grove 1968, with Subsets and Numbers
In Grove 1968, Table 67 ("Age-Adjusted Death Rates," pp. 6 6 3 - 7 7 0) covers a wide range of
entities of interest for our work in this book: Malignancies, acute infections, chronic infections, metabolic disorders, cardiovascular disorders, and accidental deaths --- "32 selected causes" in all.
The list below of the 32 causes is compiled by us from Grove's Table 65, Section F,
pp.59 5 - 6 0 3 . The numbers in parentheses are the numbers assigned to the various entities in the
International Statistical Classification of Diseases, Injuries, and Causes of Death: Seventh Revision,
1958 --- a publication of the World Health Organization (WHO). So far, nine revisions exist. Their
dates of adoption and of use are presented in our Reference List, under the entry WHO 1958.
Grove notes (p.4 4 ) that differences between the Sixth and Seventh Revisions are minor, but
warns that changes initiated by the Sixth Revision (1949) in "the method followed in selecting the
underlying cause of death ... significantly affected the statistics for some causes, e.g. diabetes and
nephritis."
In the list of 32 selected causes of death, below, the ICD numbers in parenthesis are from the
Seventh Revision. Some causes listed below are subsets of larger groups, and others are combined
when they are reported in Grove's Table 67.
1. Tuberculosis, all forms (001-019) Tuberculosis of respiratory system (001-008) Tuberculosis of meninges and central nervous system (010) Tuberculosis of intestines, peritoneum, and mesenteric glands (011) Tuberculosis of bones and joints (012,013) Tuberculosis of other organs and systems (014-018) Disseminated tuberculosis (019)
2. Tuberculosis of the respiratory system (001-008)
3. Syphilis and its sequelae (020-029) Congenital syphilis (020) Early syphilis (021) Aneurysm of Aorta (022) Other cardiovascular syphilis (023) Tabes Dorsalis (024) General paralysis of the insane (025) Other syphilis of central nervous system (026) All other syphilis (027-029)
4. Malignant Neoplasms, including neoplasms of lymphatic and hematopoietic tissues, (140-205). Also see entries 5 through 12, below.
5. Malignant Neoplasm of buccal cavity and pharynx (140-148) Of lip (140) Of tongue (141) Of other and unspecified parts of buccal cavity (142-144) Of pharynx (145-148)
6. Malignant Neoplasm of digestive organs and peritoneum, not specified as secondary (150-156A, 157-159)
- 84 -

Chap.4 Radiation (Medical) in the Pathogenesis of Cancer and Ischemic Heart Disease John W. Gofman
Of esophagus (150) Of stomach (151) Of small intestine, including duodenum (152) Of large intestine, except rectum (153)
Diverse segments given as 153.1, 153.2, etc. Of rectum (154) Of biliary passages and of liver (stated to be primary site) (155)
Liver (155.0) Other and multiple sites of biliary passages (155.1, 155.8)
Of liver not stated whether primary or secondary (156A) Of pancreas (157) Of peritoneum and unspecified digestive organs (158, 159)
7. Malignant Neoplasm of respiratory system, not specified as secondary (160-164) Of larynx (161) Of bronchus and trachea, and of lung specified as primary (162) Of lung, unspecified as to whether primary or secondary (163) Of other parts of of respiratory system (160, 164)
8. Malignant Neoplasm of breast (170)
9. Malignant Neoplasm of genital organs (171-179) Of cervix uteri (171) Of other and unspecified parts of uterus (172-174) Of ovary, fallopian tube, and broad ligament (175) Of other, and unspecified female genital organs (176) Of prostate (177) Of testis, and of other and unspecified genital organs (178,179)
10. Malignant Neoplasm of urinary organs (180,181) Of kidney (180) Of bladder and other urinary organs (181)
11. Leukemia and Aleukemia (204)
12. Lymphosarcoma and other neoplasms of lymphatic and hematopoietic tissues, (200-203, 205) Lymphosarcoma and reticulosarcoma (200) Hodgkin's Disease (201) Other neoplasms of lymphatic and hematopoietic tissues (202, 203, 205)
13. Diabetes Mellitus (260)
14. Major cardiovascular-renal diseases (330-334, 400-468, 592-594). Also see entries 15 through 21, below.
15. Vascular Lesions Affecting Central Nervous System (330-334)
16. Rheumatic Fever and Chronic Rheumatic Heart Disease (400-402, 410-416) Rheumatic Fever (400-402) Chronic Rheumatic Heart Disease (410-416)
17. Arteriosclerotic Heart Disease, including coronary disease (420) Arteriosclerotic heart disease so described (420.0) Heart Disease specified as involving coronary arteries (420.1) Angina Pectoris without mention of coronary disease (420.2)
18. Nonrheumatic Chronic Endocarditis and other myocardial degeneration (421, 422)
19. Hypertensive Disease (440-447)
- 85 -

Chap.4 Radiation (Medical) in the Pathogenesis of Cancer and Ischemic Heart Disease John W. Gofman
20. Hypertensive Heart Disease (440-443) Hypertensive heart disease with arteriolar nephrosclerosis (442) Other hypertensive heart disease (440, 441, 443)
Other hypertensive disease (444-447)
21. Chronic and Unspecified Nephritis and other renal sclerosis (592-594)
22. Influenza and Pneumonia, except Pneumonia of newborn (480-493) Influenza (480-483) Pneumonia, except pneumonia of newborn (490-493)
23. Ulcer of stomach and duodenum (540, 541)
24. Appendicitis (550-553)
25. Hernia and intestinal obstruction (560, 561, 570)
26. Gastritis, duodenitis, enteritis, and colitis, except diarrhea of newborn (543, 571, 572)
27. Cirrhosis of liver (581)
28. Hyperplasia of prostate (610)
29. Motor vehicle accidents (E810-E835)
30. Other accidents (E800-E802, E840-E962)
31. Suicide (E963, E970-E979)
32. Homicide (E963, E970-E879)
>>>>>>>>>>
- 86 -
Box 1 of Chap. 4 The "Standard Million Population, 1940."
Enumerated Population of the United States, 1940, by Age-Bands.
Age-Band, in Years
All Combined
Under 1 yr 1-4
5-14 15-24 25-34 35-44 45-54 55-64 65-74 75-84
85 and up
Actual 1940 Population
131,669,275
2,020,174 8,521,350
22,430,557 23,921,358 21,339,026 18,333,220 15,512,071 10,572,205 6,376,189 2,278,373
364,752
Sums for check 131,669,275 1.000000 1,000,000
The tabulation above is based on Grove 1968, page 37. Comparable information, for the years 1950-1993, is provided in PHS 1995 (p.79).
Box 2 of Chap. 4 Illustrative Calculation of an Age-Adjusted MortRate.
* Col.A shows the 1940 National All-Cancer MortRates per 100,000 (100K) population in each age-band (from Linder 1947, Table 14, p.250). * Col.B (from Box 1) shows what fraction of the total 1940 population comes
from each age-band. e Col.C = [Col.A * Col.B]. The * denotes multiplication. The sum of Col.C
entries is the weighted average of the separate MortRates. This sum, 120.15 cancer-deaths per 100,000 population, is the age-adjusted National All-Cancer MortRate for 1940. See Text, Part 4b.
Age-Band
Under 1 yr 1-4
5-14 15-24 25-34 35-44 45-54 55-64 65-74 75-84
85 and up
Col.A Rate/lOOK
4.4 4.8 3.0 5.4
17.3 61.1
168.8 369.6 695.2
1,161.0 1,319.0
Col.B Fraction
0.015343 0.064718 0.170355 0.181678 0.162065 0.139237 0.117811 0.080294 0.048426 0.017304 0.002770
Col.C =A*B
0.06751 0.31065 0.51107 0.98106 2.80373 8.50737
19.88647 29.67653 33.66561 20.08966 3.65391
Sums 1.000000 120.1536
- 87 -
Fraction of Total
1.000000
0.015343 0.064718 0.170355 0.181678 0.162065 0.139237 0.117811 0.080294 0.048426 0.017304 0.002770
Standard Million,
1940
1,000,000
15,343 64,718
170,355 181,677 162,066 139,237 117,811 80,294 48,426 17,304 2,770
N JI
0
Cu

Box 3 of Chap. 4 Age-Specific MortRates for Female Breast Cancer, 1950-1990.
9 These annual National Breast-Cancer MortRates, per 100,000 resident population (all "races," no exclusions) are in "Health: United States 1995" from the Public Health Service (PHS 1995 in our Reference
List), Table 41, p. 13 8 . The National rates in Row 1 are age-adjusted to the 1940 reference year, and are in
very close agreement with the female National rates in Table 8-B. The "crude" National rates in Row 2 are per
100,000 population without any age-adjustment. 9 While the age-adjusted National MortRate hardly changes during the 1950-1990 period, the MortRates
rose in some age-bands, and declined in others --- as quantified by the ratios in the righthand column. I Ratio
Row Age 1950 1960 1970 1980 1990 1991-93 1990 / 1950
1 All ages, age-adju 22.2 22.3 23.1 22.7 23.1 I 22.1 1.04 2 All ages, crude 24.7 26.1 28.4 30.6 34.0 I 33.2 I 3 Under 25 years .............. 4 Ages 25-34 3.8 3.8 3.9 3.3 2.9 2.8 0.76 5 Ages 35-44 20.8 20.2 20.4 17.9 17.8 16.1 0.86 6 Ages 45-54 46.9 51.4 52.6 48.1 45.4 43.0 0.97 7 Ages 55-64 70.4 70.8 77.6 80.5 78.6 75.0 1.12 8 Ages 65-74 94.0 90.0 93.8 101.1 111.7 107.9 1.19 9 Ages 75-84 139.8 129.9 127.4 126.4 146.3 144.1 1.05
10 Ages 85+ 195.5 191.9 157.1 169.3 196.8 199.9 1.01
Box 4 of Chap. 4 The Age-Groups Accounting for 93 % of the 1990 Age-Adjusted National Cancer MortRate.
e Col.A entries are the observed age-specific 1990 National All-Cancer MortRates per 100,000
population of each age-band, for both sexes combined. Source: "Health: United States 1995" from
the Public Health Service (PHS 1995, Table 39, p. 13 2 ). e Col.B is the weighting factor, from the "Standard Million Population, 1940" (see Chapter 4, Box
1, "Fraction of Total"). * Col.C is the product of Col.A times Col.B, and the SUM of Col.C is the 1990 age-adjusted
MortRate: 135 per 100,000 population. This rate matches the entry for Both Sexes in our Table 6-B.
e Col.D divides each entry in Col.C by 135, and thus determines the fraction of the National
Age-Adjusted Rate (135 per 100,000) contributed by each age-band. The sum of the fractions for age
45 and older = 0.92780, or 93 %.
Col.A Col.B Col.C Col.D =
Age-Band AgeSpecific Weighting = A times B Col.C
Rate/100K Factor (A * B) / 135
Under I yr 2.3 0.015343 0.03529 0.00026
1-4 3.5 0.064718 0.22651 0.00168
5-14 3.1 0.170355 0.52810 0.00391
15-24 4.9 0.181678 0.89022 0.00659
25-34 12.6 0.162065 2.04202 0.01513
35-44 43.3 0.139237 6.02896 0.04466
45-54 158.9 0.117811 18.72015 0.13867
55-64 449.6 0.080294 36.10002 0.26741
65-74 872.3 0.048426 42.24182 0.31290
75-84 1,348.5 0.017304 23.33411 0.17285
85 and up 1,752.9 0.002770 4.85591 0.03597
Sums 1.000000 135.0031 1.0000
- 88 -