Chapter 4 Demand, Supply and the Market characteristics of customer base ... Perfect competition:...
30
Chapter 4 Demand, Supply and the Market ______________________________________ Learning Outcomes Upon completion of this chapter, you will be able to: 1. Explain the law of demand: how the price of a good affects the quantity demanded 2. Identify what other factors affect demand (the non-price determinants of demand) 3. Explain the law of supply: how the price of a good affects the quantity supplied 4. Identify other factors that affect supply (the non-price determinants of supply) 5. Show how to derive the demand and supply curves from demand and supply tables 6. Demonstrate how supply and demand interact to determine equilibrium price and quantity of goods 7. Explain situations of market disequilibria and show how the market reaches new equilibrium 8. Show how Government interventions in the market (such as price supports or price ceilings) affect the operations of markets. Overview This chapter deals with the functioning of competitive markets by analysing demand and supply, two of the most fundamental concepts in economics. As analysed in Chapter 1, the price mechanism determines how goods and services are allocated in a market economy like that of Cyprus. Thus, we need to know how prices are determined. We will analyse the factors that determine the behaviour of individuals with regard to demand for goods, the respective behaviour of business firms with regard to the supply of goods, as well as show what happens in the market when demand and supply forces interact to determine the quantities of goods produced and the prices at which each one is sold at each moment in time. As we mentioned in Chapter 1, in every market, it is the price mechanism (what Adam Smith called the “invisible hand”) which guides and facilitates a society of individuals in choosing what, how and for whom to produce. The Market Recall from our discussion in Chapter 2 that a market is a set of arrangements or a mechanism by which households’ decisions about consumption of alternative goods and services, firms’ decisions about WHAT, HOW and HOW MUCH to produce, and workers’ decisions about FOR WHOM to work, are all reconciled by the price system, in other words by adjustments in relative prices of resources and of goods and services. The Extent of the Market A market does not necessarily have to have a physical existence where buyers and sellers come into face-to-face contact to exchange goods. Of course, some markets do have a physical existence, like the fruit market at Ayios
-
Upload
nguyenhanh -
Category
Documents
-
view
220 -
download
2
Transcript of Chapter 4 Demand, Supply and the Market characteristics of customer base ... Perfect competition:...

Chapter 4
Demand, Supply and the Market
______________________________________
Learning Outcomes
Upon completion of this chapter, you will be able to:
1. Explain the law of demand: how the price of a good affects the quantity demanded
2. Identify what other factors affect demand (the non-price determinants of demand)
3. Explain the law of supply: how the price of a good affects the quantity supplied
4. Identify other factors that affect supply (the non-price determinants of supply)
5. Show how to derive the demand and supply curves from demand and supply tables
6. Demonstrate how supply and demand interact to determine equilibrium price and quantity of goods
7. Explain situations of market disequilibria and show how the market reaches new equilibrium
8. Show how Government interventions in the market (such as price supports or price ceilings) affect the
operations of markets.
Overview
This chapter deals with the functioning of competitive markets by analysing demand and supply, two of the most
fundamental concepts in economics. As analysed in Chapter 1, the price mechanism determines how goods and
services are allocated in a market economy like that of Cyprus. Thus, we need to know how prices are determined.
We will analyse the factors that determine the behaviour of individuals with regard to demand for goods, the
respective behaviour of business firms with regard to the supply of goods, as well as show what happens in the
market when demand and supply forces interact to determine the quantities of goods produced and the prices at
which each one is sold at each moment in time. As we mentioned in Chapter 1, in every market, it is the price
mechanism (what Adam Smith called the “invisible hand”) which guides and facilitates a society of individuals in
choosing what, how and for whom to produce.
The Market
Recall from our discussion in Chapter 2 that a market is a set of arrangements or a mechanism by which
households’ decisions about consumption of alternative goods and services, firms’ decisions about WHAT, HOW
and HOW MUCH to produce, and workers’ decisions about FOR WHOM to work, are all reconciled by the price
system, in other words by adjustments in relative prices of resources and of goods and services.
The Extent of the Market
A market does not necessarily have to have a physical existence where buyers and sellers come into face-to-face
contact to exchange goods. Of course, some markets do have a physical existence, like the fruit market at Ayios
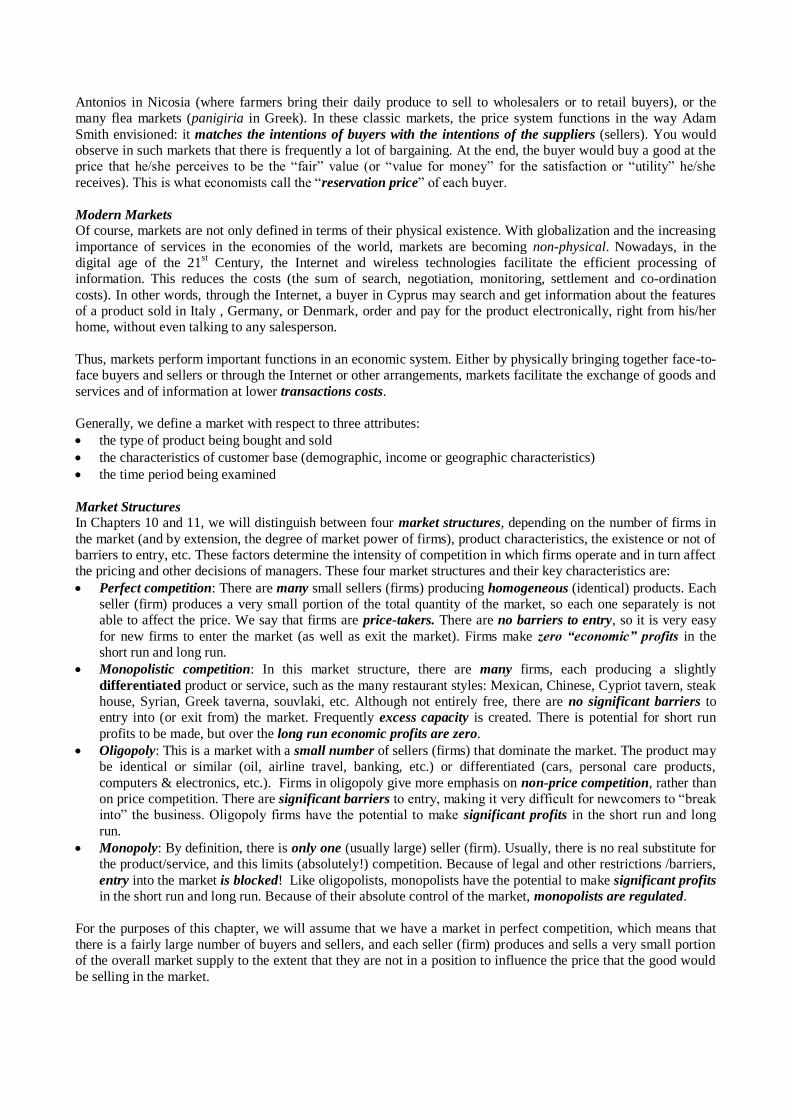
Antonios in Nicosia (where farmers bring their daily produce to sell to wholesalers or to retail buyers), or the
many flea markets (panigiria in Greek). In these classic markets, the price system functions in the way Adam
Smith envisioned: it matches the intentions of buyers with the intentions of the suppliers (sellers). You would
observe in such markets that there is frequently a lot of bargaining. At the end, the buyer would buy a good at the
price that he/she perceives to be the “fair” value (or “value for money” for the satisfaction or “utility” he/she
receives). This is what economists call the “reservation price” of each buyer.
Modern Markets Of course, markets are not only defined in terms of their physical existence. With globalization and the increasing
importance of services in the economies of the world, markets are becoming non-physical. Nowadays, in the
digital age of the 21st Century, the Internet and wireless technologies facilitate the efficient processing of
information. This reduces the costs (the sum of search, negotiation, monitoring, settlement and co-ordination
costs). In other words, through the Internet, a buyer in Cyprus may search and get information about the features
of a product sold in Italy , Germany, or Denmark, order and pay for the product electronically, right from his/her
home, without even talking to any salesperson.
Thus, markets perform important functions in an economic system. Either by physically bringing together face-to-
face buyers and sellers or through the Internet or other arrangements, markets facilitate the exchange of goods and
services and of information at lower transactions costs.
Generally, we define a market with respect to three attributes:
the type of product being bought and sold
the characteristics of customer base (demographic, income or geographic characteristics)
the time period being examined
Market Structures In Chapters 10 and 11, we will distinguish between four market structures, depending on the number of firms in
the market (and by extension, the degree of market power of firms), product characteristics, the existence or not of
barriers to entry, etc. These factors determine the intensity of competition in which firms operate and in turn affect
the pricing and other decisions of managers. These four market structures and their key characteristics are:
Perfect competition: There are many small sellers (firms) producing homogeneous (identical) products. Each
seller (firm) produces a very small portion of the total quantity of the market, so each one separately is not
able to affect the price. We say that firms are price-takers. There are no barriers to entry, so it is very easy
for new firms to enter the market (as well as exit the market). Firms make zero “economic” profits in the
short run and long run.
Monopolistic competition: In this market structure, there are many firms, each producing a slightly
differentiated product or service, such as the many restaurant styles: Mexican, Chinese, Cypriot tavern, steak
house, Syrian, Greek taverna, souvlaki, etc. Although not entirely free, there are no significant barriers to
entry into (or exit from) the market. Frequently excess capacity is created. There is potential for short run
profits to be made, but over the long run economic profits are zero.
Oligopoly: This is a market with a small number of sellers (firms) that dominate the market. The product may
be identical or similar (oil, airline travel, banking, etc.) or differentiated (cars, personal care products,
computers & electronics, etc.). Firms in oligopoly give more emphasis on non-price competition, rather than
on price competition. There are significant barriers to entry, making it very difficult for newcomers to “break
into” the business. Oligopoly firms have the potential to make significant profits in the short run and long
run.
Monopoly: By definition, there is only one (usually large) seller (firm). Usually, there is no real substitute for
the product/service, and this limits (absolutely!) competition. Because of legal and other restrictions /barriers,
entry into the market is blocked! Like oligopolists, monopolists have the potential to make significant profits
in the short run and long run. Because of their absolute control of the market, monopolists are regulated.
For the purposes of this chapter, we will assume that we have a market in perfect competition, which means that
there is a fairly large number of buyers and sellers, and each seller (firm) produces and sells a very small portion
of the overall market supply to the extent that they are not in a position to influence the price that the good would
be selling in the market.

The Law of Demand
Economists use the term demand to indicate the willingness to buy and the ability to pay. In other words, when the
manufacturers of Mercedes-Benz CLK model are considering the demand for this model in order to know how
many cars to produce, they should count (perhaps through a market survey) how many people like this model.
This is indeed significant information. But it is only part of the story. The company has to also ask how many
those that declared that they like this model whether they can afford a CLK Mercedes car, in other words, how
many have the ability to pay.
Economists also distinguish between demand and quantity demanded.
Quantity demanded refers to the quantity that is demanded at a specific price.
Demand, on the other hand, refers to the set of possible quantities that would be purchased at every possible
price. It represents and reflects the behaviour of people with respect to price changes.
The Law of Demand The demand for a product depends upon many different factors. The most obvious factor, and perhaps the most
important factor, is price. The law of demand states that, for the majority of goods (which we call normal goods),
there is an inverse relationship between changes in the price of a good and changes in the quantity demanded of
the good per time period. More specifically, we have the following situations:
As the price of the good decreases, all other things remaining constant (or ceteris paribus, in Latin), we
would expect that, on average, the quantity demanded for that good will increase; or
As the price of the good increases, ceteris paribus, we would expect that, on average, the quantity
demanded for that good will decrease.
The fact that prices and quantities demanded move in opposite directions is shown in Figure 4.1. This behaviour
of people has been observed and empirically tested over the centuries by economists and have found that it holds
true in the vast majority of cases. Due to this regularity of consumer behaviour under the scrutiny of empirical
testing has let economists to elevate this behavioural regularity to “Law”.
Figure 4.1: Inverse Relationship between Price and Quantity Demanded of a Good
Law of Demand The law of demand says that there is an inverse relationship between changes in the price of a good and changes
in the quantity demanded of the good per time period.
The Ceteris Paribus Concept
Let’s examine now this concept of “ceteris paribus” or “other things being equal”. What does the phrase “all
other things remaining the same (or held constant)” mean? What purpose does it serve? Even though the law of
demand examines the relationship between price and quantity demanded, we know very well from our personal
experience and behaviour that there are frequently other factors that motivate us to buy more or less of a product,
even if prices don’t change. The ceteris paribus concept is credited to economist Alfred Marshal who first used it
Quantity
demanded
Price

in his book Principles of Economics (1890). So, if we want to isolate the specific impact that price changes have
on quantities demanded, we assume that “all other things are held constant” (or ceteris paribus, to use the Latin
phrase). Otherwise, if we allow other factors (such as income, for example) to change at the same time as prices,
we would simply observe a total change in quantity demanded without being able to separate the impact that price
changes have on quantity demanded from the impact that income changes have on quantity demanded.
The Individual Demand
Let’s examine the demand for laptop computers by Maria, in order to understand the behaviour of one individual
buyer. To do that let’s assume that we ask Maria if she would buy a certain laptop computer at various prices
during a time period (say a year). Note that in order for the answers to be valid, Maria has to be able and willing
to buy the computer. In other words, she must like the laptops and also have the money to pay for it.
For simplicity, let’s assume that we show Maria three alternative prices (€900, €500, and €100) and ask her to tell
us how many laptops she would be willing and able to buy within a year at each price. Let’s assume that the
answers we get from Maria are those shown in Table 4.1, showing the quantities demanded at the three alternative
prices. This table is referred to as the individual’s demand schedule. The demand schedule helps us see what
happens when the price of the laptop computer changes (in terms of the number of laptops Maria will buy).
Table 4.1: Maria’s Demand Schedule for Laptop Computers
Price (€ per laptop) Quantity Demanded (Number of laptops)
€100 2
500 1
900 0
Drawing the Individual Demand Curve When we plot the data from Table 4.1 in a graph we will construct the demand curve. This is presented in Figure
4.2. Review Chapter 3, if you are not sure how we plot data from tables. Note that the demand “curve” does not
necessarily have to have a “curvature” (!). It may well be a straight line, in which case we refer to it as “linear
curve”.
Figure 4.2: Maria’s Demand Curve for Laptop Computers
We can see from Figure 4.2, the demand curve slopes downwards from right to left, indicating that indeed, as
stated by the law of demand, there is an inverse relationship between the price and the quantity of laptops that
Maria is “willing and able” to demand (to buy). We see, for instance, that a decrease in the price from €500 to
€100 (from point A to point B on the demand curve), all other things held constant, causes an increase in the
quantity demanded (from 1 laptop to 2 laptops).
Quantity
Price
Demand Curve
At €500, 1 laptop
is demanded At €100, 2 laptops
are demanded A
B
€100
2 1 0
€500
€900
At €900, zero laptops
are demanded

The Substitution and Income Effects There are two reasons/effects why the relationship between price and quantity demanded is inverse: the
substitution effect and the income effect. We explain these briefly below:
Substitution Effect: If the price of a laptop computer decreases, relative to the price of a tabletop computer
(or an iPad or other tablet, or any other substitute product), then the quantity demanded of the specific laptop
computer would be expected to increase. This is because some customers would switch from buying tabletop
computers, iPads, tablets, or other substitute products to buying laptops. Thus, as P falls Q rises.
Income Effect: If the price of laptop computers decreases (say from €500 to €100), the quantity demanded for
laptops would be expected to increase, because when people have to spend less on laptops (because of lower
prices) they have more to spend on other things (food, rent, recreation, etc.). In other words, the purchasing
power of Maria’s income has increased. In this case, Maria can buy one laptop at €100 and still have €400 to
spend on other goods. Thus, as P falls Q rises.
The Market Demand
From the point of view of a business, say the manufacturers or retail sellers of laptops, it is more meaningful to
look at the market demand, rather at simply one individual’s demand. In that respect, we need to demonstrate
how we go from an individual demand curve to the market demand curve for a particular good. Let us consider
the market for laptops. We assume for simplicity that there are only two buyers in the market, Maria and Andreas.
We already know from Table 4.1 and Figure 4.2 how Maria behaves to price changes in laptops. We observe and
record now the behaviour Andreas. At €900 Andreas is willing and able to buy 1 laptop, at €500 he is willing and
able to buy 2 and at €100 he is willing to buy 3. We collect all the data and put in a table as in Table 4.2.
Table 4.2: Market Demand Schedule for Laptop Computers
Price (€ per laptop) Maria’s Demand for
laptops
Andreas’ Demand
for laptops
Market Demand for
laptops
€100 2 3 5
500 1 2 3
900 0 1 1
Graphically, the total market demand curve is found by the horizontal summation of the demand curves of the two
individual. This is shown in Figure 4.3.
Figure 4.3: From Individual Demand Curve to Market Demand Curve
The Market Demand Schedule
In order to understand the behaviour of a group of buyers, we need to examine how they respond to price changes,
just like we did with Maria’s individual demand curve. To do that let’s assume that we conduct a market survey
by asking 5,000 people in the Nicosia area if they are willing to buy a certain laptop computer at various prices
during a time period (say during a year). Note again that in order to consider the responses as valid, every person
€100
2 QMaria
P P P
QAndreas QMarket 3 5
Maria’s Demand
Curve
Andreas’ Demand Curve
Market Demand Curve
€500
1 3
2

has to be able and willing to buy the computer. In other words, they must like the specific computer and also have
the money to pay for it.
To be more realistic, the number of different prices that we show the potential buyers in the sample (the people
that take part in the survey) is no longer three price options (as we did for simplicity in the case of Maria), but
nine price options. The demand schedule helps us see what happens when the price of the laptop computer
changes (in terms of the number of laptops people will buy).
When we finish the survey, we present the various answers we get from the people in the market survey into a
table. This table showing the set of alternative quantities and prices is referred to as the demand schedule. Let’s
assume that the responses we get from the survey are those shown in Table 4.3.
Table 4.3: Market Demand Schedule for Laptop Computers Price (€ per laptop) Quantity Demanded (Number of laptops)
€100 4500
200 4000
300 3500
400 3000
500 2500
600 2000
700 1500
800 1000
900 500
Notice from Table 4.3 that even at very low prices there are some people who would not buy a laptop. For
instance, when the price is €100 the quantity demanded is 4,500 computers, which means that there are 500
people from the sample of 5,000 that would not buy a laptop. Why? They may be people that don’t know how to
use computers, or don’t like laptops, or they prefer to use iPads, tablets, smartphones, etc. At the other extreme,
some people may be willing to buy a laptop computer even at very high prices! Obviously, these may be the
laptop-lovers! We can observe the inverse relationship of price and quantity demanded from the demand schedule
(Table 4.3). We notice, for example, that as the price increases from. €200, to €300, then to €400 … and so on,
the quantity demanded falls from 4000 laptops, to 3500, then to 3000 … and so on.
Drawing the Market Demand Curve
When we plot the data from Table 4.3 in a graph we will construct the market demand curve. This is presented in
Figure 4.4. Figure 4.4: Market Demand Curve for Laptop Computers
0
200
400
600
800
1000
1200
0 1000 2000 3000 4000 5000 6000 Quantity
Price
Demand Curve
At €600, there are
2,000 laptops
demanded
At €400, there are
3,000 laptops
demanded
A
B

We observe that the demand curve in Figure 4.4 slopes downwards from right to left, indicating that indeed there
is an inverse relationship between the price and the quantity of laptops that people are “willing and able” to
demand (buy), as stated by the law of demand. We see, for instance, that a decrease in the price from €600 to €400
(from point A to point B on the demand curve), all other things held constant, causes an increase in the quantity
demanded from 2000 to 3000 laptops. This is shown in the graph by the fact that the two arrows (representing the
direction of change in price and quantity demanded) point in opposite directions: When the arrow on the price axis
points towards zero (indicating a fall in price), the arrow on the horizontal axis points away from zero (indicating
an increase in quantity demanded).
Demand Curve The demand curve is a graphical representation of the inverse relationship between price and quantity demanded
of a good.
Non-Price Determinants of Demand In the above analysis, we looked only at the relationship between prices and quantity demanding, holding all other
factors (or determinants) constant. But, what other factors (things) did we assume to remain constant? Using the
example of laptop computers, we can find what these non-price determinants are by asking the participants in our
survey what would make them buy more laptops without the price changing, that is, at a constant price. The
possible answers we would get are:
1. Changes in the tastes and preferences of laptop computer users;
2. Changes in the income level of people;
3. Changes in the prices of related goods (substitutes and complementary goods);
4. Changes in people’s expectations about future price changes of laptop computers;
5. Changes in the number of potential buyers (size of the market).
Let’s explain these non-price determinants (or factors) in more detail.
(1) Tastes and Preferences The tastes and preferences of the buyers depend on their perceptions about how useful and desirable goods are
(with respect to quality, features, practicality, etc.), as determined by buyers’ personalities and prior experiences.
Smart advertising (using modern psychographics) aims to influence our preferences (our mindset) so that we buy
specific goods (fashion clothing, cosmetics, computers, cars, personal care products, mobile phones, etc.).
Advertising for women seek to appeal to the feminine, aesthetic, sensitive, and whatever other characteristic is
perceived by the social norms of the time. Advertising for men, on the other hand, tries to appeal to the tough,
macho, action-related image that is “expected” from a man (whether this concerns colognes, sports cars,
deodorants, or clothing).
These tastes and preferences, of course, are constantly changing. Over time, many things are coming into
“fashion”, while others are going out of fashion. For example, people nowadays consume a lot more healthy foods
(low-fat, dietetic, organic, etc.) than in the past. As a result, the shelve spaces in supermarkets for these items is
considerably more than what it was 25 year ago. People are careful about their appearance so they need to
exercise more. As a result, nowadays we see many more exercise gyms and spas than 25 years ago. In the same
way, as tattoo and nose rings (and anywhere-else-rings!) are more acceptable by society, more and more young
people visit the many more tattoo and ear-and-nose piercing shops. On the other hand, with the coming of the
computer, the “old” typewriter is found only in museums! With the coming of the digital cameras, the traditional
cameras and the traditional film are no longer demanded. Also, due to the increasing sensitivity of people about
“animal rights” the demand for natural furs is dropping!
(2) Income
As the income of people increases, it is reasonable to expect that they would be buying more goods and services.
We refer to the goods for which demand increases income increases as normal goods. If the demand for laptops
increases as people get richer, then laptops are considered to be a normal good. The vast majority of goods are
normal goods. On the other hand, if the quantity demanded of a good falls as income increases, then we consider
that good to be an inferior good. We may consider a used car as an inferior good, not because of poor quality, but
because we expect that as people’s incomes increase they would not be buying used cars, but new cars!

Additionally, we may consider a hamburger as an inferior good because we expect that as people earn more
money they would not go to McDonalds for dinner but likely go to a steak house or to a Japanese restaurant or
other “regular” restaurant. Isn’t that what you hope (and look forward!) to do when you graduate and start your
career?
Normal goods Normal goods are the goods whose demand increases when income increases.
Inferior goods
Inferior goods are the goods whose demand decreases when income increases.
(3) Prices of Related Goods The prices of related products may also influence the demand for a good. The keen competition that exists in
modern free market economies ensures that the majority of consumer goods have some (or many) substitutes and
complements.
a) Substitutes are the goods that provide the consumers with about the same usefulness (satisfaction, or utility as
we will call it in Chapter 6). If goods A and B are substitutes and the price of good A rises, then it is likely
that some people would purchase good B instead of good A, or vice versa. Classic examples of substitute
goods are “Pepsi and Coke”, or “Pepsi and any of the many “energy” drinks like Red Bull”, “coffee and tea”,
“a laptop and an iPad or tablet”, etc. For example, if the price of an iPad drops to €100 (!?), then it is likely
that the sales laptop computers would fall significantly.
Substitute goods (or simply substitutes) Substitute goods are the goods that provide the consumer with about the same usefulness (satisfaction, or utility)
and can therefore be substituted for one another. Classic examples of substitute goods are “Pepsi and Coke”.
b) On the other hand, complementary goods are any two goods which generate more satisfaction if consumed
together. “Cars and gasoline”, or “cars and tires” are examples of complementary goods. They are goods that
are typically consumed or used together in relatively fixed proportions. A laptop (the hardware) and the
operating system (the software) are also complementary goods. We cannot imagine the one without the other!
Computer workstations, special accessories for laptops such as webcam, Skype, headphones, special software
programs, etc. are additional complementary product for laptops.
Complementary goods (or simply complements)
Complementary goods are sets of goods that generate more satisfaction if consumed together. Examples are “Cars
and gasoline” or “cars and tires”.
(4) Expectations about the Future Prices of Goods If buyers expect that there in the short run there will be an increase in the price of a good (note that the actual
price has not increased yet), then we expect that they would rush to buy more of the good now (assuming of
course that they can store it), before the price increases. Thus, at current prices, demand will increase. For
example, if people expect that the Government will impose in three months a €200 tax on laptops, we expect that
buyers would rush now to buy a laptop (if they were planning to buy one anyway) rather than wait and pay in
three months €200 more due to the tax.
(5) Number of Buyers (size of the Market) Population growth, the incoming migration (as is the case in Cyprus) or the opening of foreign markets increases
the numbers of potential buyers and, therefore, the demand for the good in question increases.
In Table 4.4 we summarize the various situations where changes in any of the non-price determinants would
change the demand for laptops (either to decrease or to increase). Recall that by change in demand we mean that
the behaviour of individuals changes over the whole range of prices, not only for a specific price. Remember also
that we keep prices constant in order to examine the impact of each of the non-price determinants.

Table 4.4: Impact on Demand of Changes in Non-Price Determinants
The demand for laptop computers will increase: The demand for laptop computers will decrease:
If consumers’ income rises (assuming laptop computers are normal goods)
If consumers’ income falls
If the price of substitutes (like desktop computers or
iPads) rises
If the price of substitutes decreases (falls)
If the number of substitutes decreases. This is
unlikely, but for example there may be a Government
decision to restrict the imports of iPads, tablets,
Blackberries, etc. (!!??)
If the number of substitutes increases. Ten or even
five years ago iPads were not available. Now they are
the new big thing!
If the price of complements (such as webcams,
headphones, Skype, special software, etc.) falls
If the price of a complement rises
If buyers expect that the price of laptop computers
will rise in the near future
If consumers expect that the price of laptops will fall
in the near future
If consumers’ tastes change in favour of laptop
computers and away from desktops
If consumers’ tastes change away from laptops, for
example, because of reports that they are dangerous.
If the size of the market (population) increases. Also,
the age composition of the population will impact on
demand (as younger people are users of laptops)
If the size of the market decreases. This is unlikely to
happen, unless we have massive emigration
Shift of the Market Demand Curve A change in any of the above determinants (factors or variables), assuming price remains constant, will shift the
demand curve. If the change in one of the factors impacts positively on the demand, then there will be a parallel
shift of the demand curve to the right. The opposite will happen if the change has a negative impact on demand:
the demand curve will shift to the left.
Let us assume that the 5,000 people in the survey receive a “permanent” increase in their annual salaries. We ask
them again how many laptop computers they would buy at each of the same set of prices we showed them before.
We expect in such a case that at each price more people now would say that they would buy a laptop. Let’s
assume that at a price of €400 the number of people that would now buy a laptop computer would be 4,000
(compared to 3,000 before the increase in income), or at a price of €600 the number of people willing to buy a
laptop will be 3,000 (instead of 2,000 before). We can represent this change in demand in Figure 4.5 by a
rightward shift in the demand curve from D1 to D2. Similarly, if the price of a close substitute increases (such as
the price of an iPad), people will likely switch to buying laptops and thus the demand curve for laptops will shift
to the right (as shown in figure 4.5).
Figure 4.5: Shift of the Demand Curve for Laptops
Price
€800
€600
€400
3000 4000 5000 6000 Quantity Demanded
D1
D2

Of course, if on the other hand, we assume that people’s incomes fall (due perhaps to the economic recession and
the fact that there is an increase in unemployment) or the price of a close substitute product (such as the price of
the iPad) falls, while the price of a laptop remains unchanged, then the demand curve would shift to the left,
representing a smaller quantity demanded at each possible price.
Changes in Demand vs. Changes in Quantity Demanded
So far we examined two ways to show a change in the observed quantity demanded in the market: one for changes
in the price of the good and another for changes in the non-price determinants. We distinguish in this respect
between a “movement along” a demand curve from a “shift” of the demand curve to a new one.
If the cause of the change in the quantity demanded is the price, then we move along the existing demand curve to
find the corresponding value of quantity demanded.
We call this a change in quantity demanded.
If, on the other hand, there is a change in a non-price determinant (income, preferences, prices of related goods,
etc.) impacting on demand, then the entire demand curve shifts.
This is referred to as a change in demand.
Let’s see the application of these terms using an example. Consider a substitute product for laptops: say the iPad.
Suppose that currently both goods are selling for €400. At €400, the current quantity demanded for iPads is 3500
units per month and the current demand for laptops is 3,000 units. We show these separate situations for iPads and
laptops in Figure 4.6, where the left panel shows the demand for iPads (as point A on the D-curve) and the right
panel shows the demand for laptops (as point A’ on D1-curve).
Assume now that the price of an iPad rises to €600 (with no change in the price of laptops). On the left panel we
show the decrease in the quantity demanded of iPads by “moving up along” the demand curve for iPads from
point A (price=€400 and quantity=3500 units) to point B (price=€600 and quantity=2000 units). In other words,
the price increase leads to a loss of 1500 sales of iPads. But, since laptops are substitutes for iPads, some of these
customers, who are no longer buying iPads because they are more expensive, will likely buy laptops (so the sales
of laptops will increase from 3000 to 4000). But, since the price of laptops has not changed we show this increase
in the demand for laptops by 1000 units by a shift of the demand curve to the right (from demand curve D1 to
demand curve D2).
Figure 4.6: Movement along a Demand Curve vs. Shift of the Demand Curve
Demand for iPads Demand for Laptops
Quantity for Laptops Quantity for iPads
€800
€700
€600
€500
€400
€300
€200
€100
€800
€700
€600
€500
€400
€300
€200
€100
Change in the quantity demanded
of iPads Change in demand for laptops
2000 3500 3000 4000
Price Price

The Law of Supply
Let’s consider now the case of supply. The law of supply states that at higher prices, suppliers will be willing, on
average, to offer more quantities in the market, since in this way they generate more revenue, and ultimately more
profits. Thus, contrary to the law of demand, the law of supply shows that there is a positive or direct relationship
between price changes and changes in quantities supplied.
Law of Supply The law of supply says that there is a positive or direct relationship between price changes and changes in quantity
supplied. In other words:
An increase in the price of a good, all other things held constant, will cause an increase in the quantity
supplied of the good.
On the other hand, a decrease in the price of a good, all other things held constant, will cause a decrease
in the quantity supplied of the good.
Note that in our discussion of the supply in this section we will be examining only the market supply schedule and
market supply curve, keeping in mind, however, that the market supply curve is the horizontal summation of the
supply curve of the individual supplier (seller). Since the concept is similar to that in the case of demand, we will
not present here the graphical derivation of the market supply curve from individual supply curves.
The Market Supply Schedule and Market Supply Curve
Assume now that we carry out a market survey (as we did in the case of demand), by asking 5000 sellers of laptop
computers in the Nicosia area what quantity of laptops they would be willing to offer at alternative prices.
Assume that the answers we get from the sellers are the ones in Table 4.5. This is the market supply schedule.
Table 4.5: Market Supply Schedule for Laptop Computers
Price (€ per laptop computer) Quantity Supplied (Number of laptop computers)
100 500
200 1000
300 1500
400 2000
500 2500
600 3000
700 3500
800 4000
900 4500
1000 5000
When we plot the above data on a graph, we will construct the supply curve, as shown in Figure 4.7. Notice that
the supply curve slopes upward. It shows the positive relationship between price and quantity supplied, again
holding all other things constant (in other words, ceteris paribus). The reason, of course, as mentioned above, is
that at higher prices firms are encouraged to offer more quantities in the market, since in this way they make more
profits.
We can use the supply curve to show what the quantity supplied would be at different prices by moving up or
down the supply curve. From Figure 4.7 we see that if the price of laptops increases from €400 to €600, there will
be a corresponding increase in the quantity supplied from 2,000 laptops to 3,000 laptops. This is indicated in the
graph by the fact that both arrows (representing respectively changes in price and quantity supplied) point away
from the origin (the point at which the vertical and horizontal axes cross). As the arrow on the price axis moves
away from zero (as price increases), the arrow on the quantity axis also moves away from zero (quantity increases
as well).

Figure 4.7: The Supply Curve for Laptop Computers
Non-Price Determinants of Supply In the same way that we asked the consumers in the survey what factors would make them buy more laptop
computers even without lowering the price, we can ask the sellers of laptops a similar question. What factors
would make a seller supply more laptop computers without any increases in the selling price? It is likely that the
factors that would impact on the sellers’ willingness to increase supply at each price would include the following:
1. Change in production technology Better technology or improved technological know-how would allow computer firms to produce more laptops
with the same inputs (same costs of production). In such cases, therefore, businesses would seek to produce
more laptops in order to increase their total revenues. If costs remain the same, then higher revenues mean
higher profits! Improvements in technology then are represented by a rightward shift in the supply curve.
2. Changes in input prices
By inputs, of course, we refer to all the factors of production or resources (including labour, capital and raw
materials). We will discuss production inputs and input costs more fully in Chapter 8. As in the case of
improvements in technology a reduction in the costs of inputs (cheaper raw materials, lower wages, etc.)
would encourage producers to increase their output in order to increase their total revenues, and ultimately
their profits. This means that the supply curve would shift to the right.
3. Change in the number of sellers
As the number of sellers of laptop computers increases, the quantity supplied will increase. Note that at this
point we are not examining whether all the quantities supplied will be sold. In this case the supply curve will
shift to the right.
4. Changes in taxes and/or subsidies and legal restrictions in establishing businesses For example, if the Government provides a subsidy to businesses by covering part of the costs for hiring
University graduates (their wages in other words), that means that the average cost of production for the firm
would be lower and that will encourage firms to supply more goods to the market. In such cases, the supply
curve would shift to the right. On the other hand, if the government increases taxes or imposes stricter rules
about health and safety measures at the place of work (which would likely increase the costs of production)
then the supply would decrease, and the supply curve would shift to the left.
5. Future price expectations of sellers If makers or sellers of laptop computers expect that the price of their product will increase in the near future
(say in 3 or 6 months) they will likely hold back some quantities now (in other words, hold them in stock) so
they can sell them later at a higher price. In this case the supply curve will shift to the left.
6. Weather and other “exogenous” factors Obviously, if bad weather or earthquakes or a tsunami or a war occur the quantity supplied will decrease.
Think at what happen to the output of most sectors in Cyprus after the Turkish invasion in July 1974. In any
of these negative exogenous factors, the supply curve will shift to the left.
In Table 4.6, we summarize the various situations where changes in any of the non-price determinants would
change the supply of laptops (either to decrease or to increase). Recall that by change in supply we mean that the
behaviour of individual firms (sellers or suppliers) changes over the whole range of prices, not only for a specific
price. Remember that we keep prices constant in order to examine the various cases below.
0
200
400
600
800
1000
1200
0 1000 2000 3000 4000 5000 6000 Quantity
Supply Curve
Price

Table 4.6: Impact of Changes in Non-Price Determinants on Supply
The supply of laptops will increase if: The supply of laptops will decrease if:
If the price of the inputs (the factors of production,
raw materials, etc.) that are needed for the production
of laptops decreases. For example, a new chip is used
from cheaper materials, or wages fall.
If the price of the inputs increases. For
example, wages rise, the prices of the
component parts rise, oil prices rise, etc.
If technology improves, i.e., if more productive
(efficient) methods of making laptops are used.
If it is unlikely that technology worsens (?!)
If the number of sellers of laptops increases. If
existing sellers are making profits, more laptop makers
would enter the market, attracted by the profit
potential, so supply increases.
If the number of sellers decreases. There
may be a point that some laptop makers are
not making profits and leave the market.
If the government decides to support the production of
laptops by either reducing taxes or giving more
subsidies to laptop makers.
If the government raises taxes for laptop
computer sellers, or reduces subsidies.
If the government withdraws any health and
hygienic regulations, which used to require computer makers/sellers to install very modern and expensive
health and safety equipment.
If the government introduces very strict
health and safety regulations, requiring computer makers/sellers to install expensive
health and safety equipment
If makers / sellers of laptops expect that the price of
laptops will fall in the near future.
If makers of laptops expect that the price
of laptops will rise in the near future.
If favourable exogenous factors increase the
production of laptops
If a “tsunami” in Japan or Korea
decreases laptops supplied from these two
major laptop manufacturing countries.
Shifts in the Supply Curve
All of the situations in the left panel of Table 4.4 would shift the supply curve to the right, whereas all the cases in
the right side would shift it to the left. As an example, let’s assume that computer companies are able to buy
components (chips, drives, hard disks, etc.) at lower costs, which makes it possible for computer makers to make
laptop computers at lower overall costs per unit. This means that with the same selling price for laptops, computer
makers will make more profits and therefore would be encouraged to increase their production of laptops.
Graphically, this case (and all other cases in the left panel of Table 4.6) is shown in Figure 4.8, where at each
price, the supply curve shifts to the right, represented from S1 to S2.
Figure 4.8: Shift of the Supply Curve of Laptop Computers
Price
€800
2000 2500 Quantity Supplied
Here we see, for example, that at €400, initially there were 2000 sales of laptop computers (as shown in Table
4.5), whereas with lower component costs (but with the price remaining at €400) the sellers are now willing to sell
2,500 laptops. The supply curve had a parallel shift to the right.
S1
S2
€400
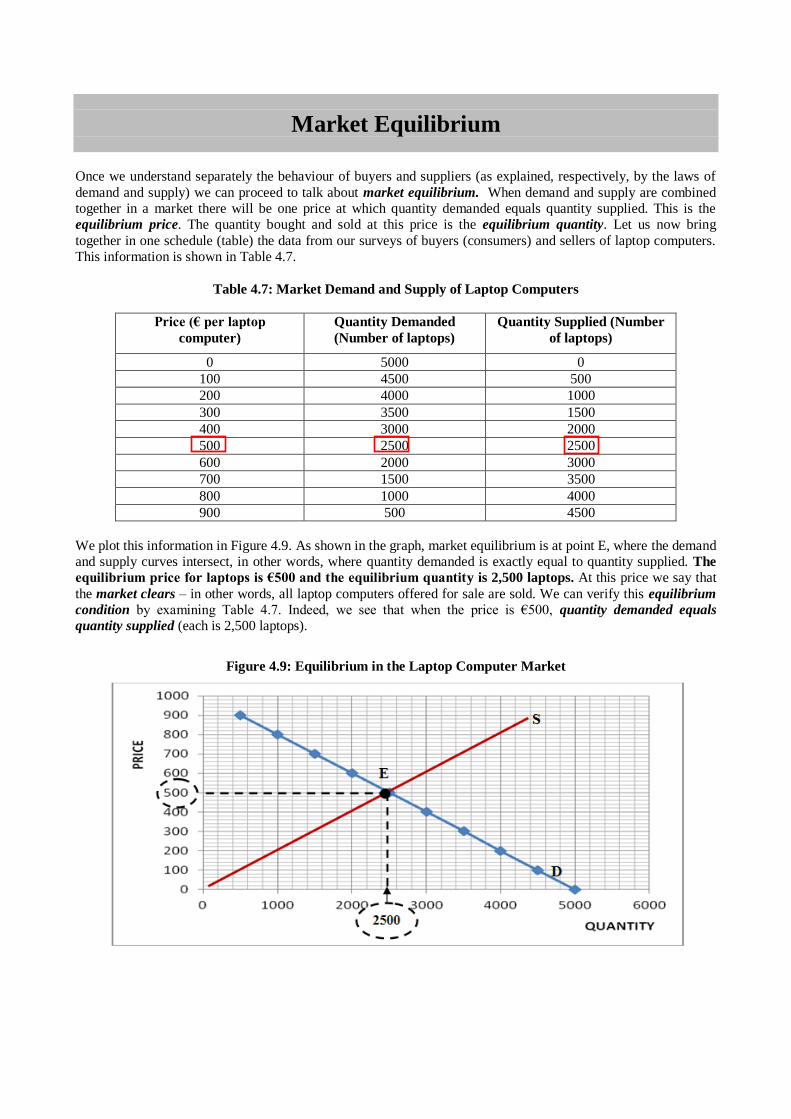
Market Equilibrium
Once we understand separately the behaviour of buyers and suppliers (as explained, respectively, by the laws of
demand and supply) we can proceed to talk about market equilibrium. When demand and supply are combined
together in a market there will be one price at which quantity demanded equals quantity supplied. This is the
equilibrium price. The quantity bought and sold at this price is the equilibrium quantity. Let us now bring
together in one schedule (table) the data from our surveys of buyers (consumers) and sellers of laptop computers.
This information is shown in Table 4.7.
Table 4.7: Market Demand and Supply of Laptop Computers
Price (€ per laptop
computer)
Quantity Demanded
(Number of laptops)
Quantity Supplied (Number
of laptops)
0 5000 0
100 4500 500
200 4000 1000
300 3500 1500
400 3000 2000
500 2500 2500
600 2000 3000
700 1500 3500
800 1000 4000
900 500 4500
We plot this information in Figure 4.9. As shown in the graph, market equilibrium is at point E, where the demand
and supply curves intersect, in other words, where quantity demanded is exactly equal to quantity supplied. The
equilibrium price for laptops is €500 and the equilibrium quantity is 2,500 laptops. At this price we say that
the market clears – in other words, all laptop computers offered for sale are sold. We can verify this equilibrium
condition by examining Table 4.7. Indeed, we see that when the price is €500, quantity demanded equals
quantity supplied (each is 2,500 laptops).
Figure 4.9: Equilibrium in the Laptop Computer Market

The Simple Math of Equilibrium Let’s use simple algebraic expressions of demand and supply equations to see if we can arrive at the same
equilibrium price and quantity as above. Based on the data in Table 4.7 for the demand and supply of laptops, the
demand and supply equations are the following:
Demand equation: Qd = 5000 – 5P
Supply equation: Qs = 5P
Since at equilibrium quantity demanded equals quantity supplied (Qd = Qs), we set the two equations equal to
each other:
5000 – 5P = 5P
10P = 5000 P = 5000 / 10 = €500
Thus, the equilibrium price, Pe = €500 (as shown in Figure 4.9)
Substituting Pe = €500 in the demand and supply equation would give us:
Qd = 5000 – 5*500 = 5000-2500 = 2,500 laptops
Qs = 5*500 = 2,500 laptops
Thus, in equilibrium, Qs = Qd (as shown in Figure 4.9).
Disequilibrium Situations
Though equilibrium is desirable, in the sense that the market clears, and everybody is happy (in the sense that both
buyers and sellers have satisfied their intentions), there is nothing in the real world that assures that a market will
be in equilibrium. In fact, in a dynamic free enterprise economy, it is more likely that markets are not in
equilibrium, rather than in equilibrium. In this section, we examine situations that cause the market to move out of
equilibrium. There are two possible disequilibrium situations: a surplus (or excess supply) and a shortage (or
excess demand). We examine these situations below.
Situations of Surplus (Excess Supply)
Let’s assume that the price in the market is €600. At this price, we verify from the results of the market survey
(shown in Table 4.7) that 2000 people would want to buy laptops, while 3000 sellers that would be willing to sell
laptops. Thus, at €600 there is a surplus (or excess supply) of 1000 laptops. Supply exceeds demand by 1,000
laptops. In other words, 1000 laptops would not be sold if the price is €600. As shown in Figure 4.10, at any price
above €500 the quantity supplied exceeds the quantity demanded. This market condition is called excess supply
(or surplus).
Figure 4.10: Dis-equilibrium in the Laptop Computer Market: SURPLUS
Of course, no seller is happy when he/she has a surplus (unsold merchandise, or excess inventories). So, how
would a seller that has excess supply react? Think of what happens twice a year in the retail market (clothing,
shoes, etc.) in Cyprus and all other countries: SALES! This occurs usually in August for summer items, and
usually in February for winter items. Retail shop owners offer discounts (they lower the prices of the goods) in an
effort to get rid of unsold merchandise. Indeed, when surpluses occur in the market, market forces will be set in
motion to reduce the price of the good. This process of price reductions will continue (initially the price
reductions may be 20%, then 40%, then 50% reductions … and so on, and so on) until the market is back in
equilibrium.
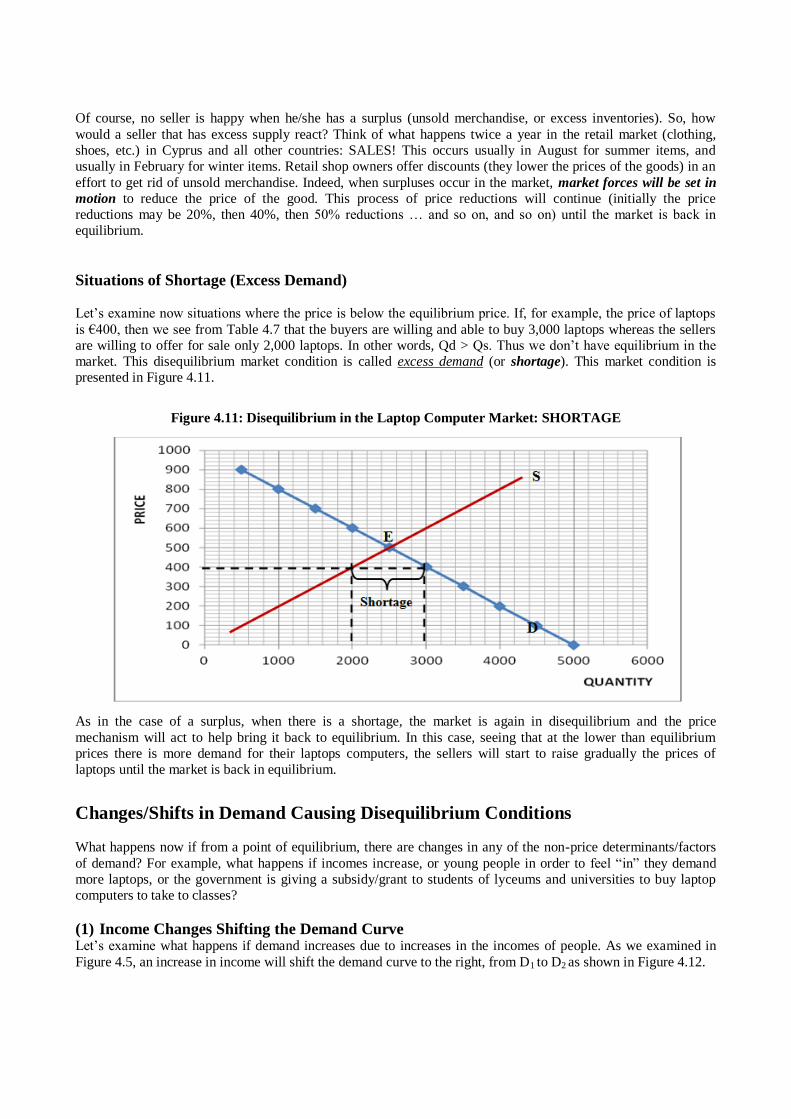
Situations of Shortage (Excess Demand)
Let’s examine now situations where the price is below the equilibrium price. If, for example, the price of laptops
is €400, then we see from Table 4.7 that the buyers are willing and able to buy 3,000 laptops whereas the sellers
are willing to offer for sale only 2,000 laptops. In other words, Qd > Qs. Thus we don’t have equilibrium in the
market. This disequilibrium market condition is called excess demand (or shortage). This market condition is
presented in Figure 4.11.
Figure 4.11: Disequilibrium in the Laptop Computer Market: SHORTAGE
As in the case of a surplus, when there is a shortage, the market is again in disequilibrium and the price
mechanism will act to help bring it back to equilibrium. In this case, seeing that at the lower than equilibrium
prices there is more demand for their laptops computers, the sellers will start to raise gradually the prices of
laptops until the market is back in equilibrium.
Changes/Shifts in Demand Causing Disequilibrium Conditions
What happens now if from a point of equilibrium, there are changes in any of the non-price determinants/factors
of demand? For example, what happens if incomes increase, or young people in order to feel “in” they demand
more laptops, or the government is giving a subsidy/grant to students of lyceums and universities to buy laptop
computers to take to classes?
(1) Income Changes Shifting the Demand Curve Let’s examine what happens if demand increases due to increases in the incomes of people. As we examined in
Figure 4.5, an increase in income will shift the demand curve to the right, from D1 to D2 as shown in Figure 4.12.
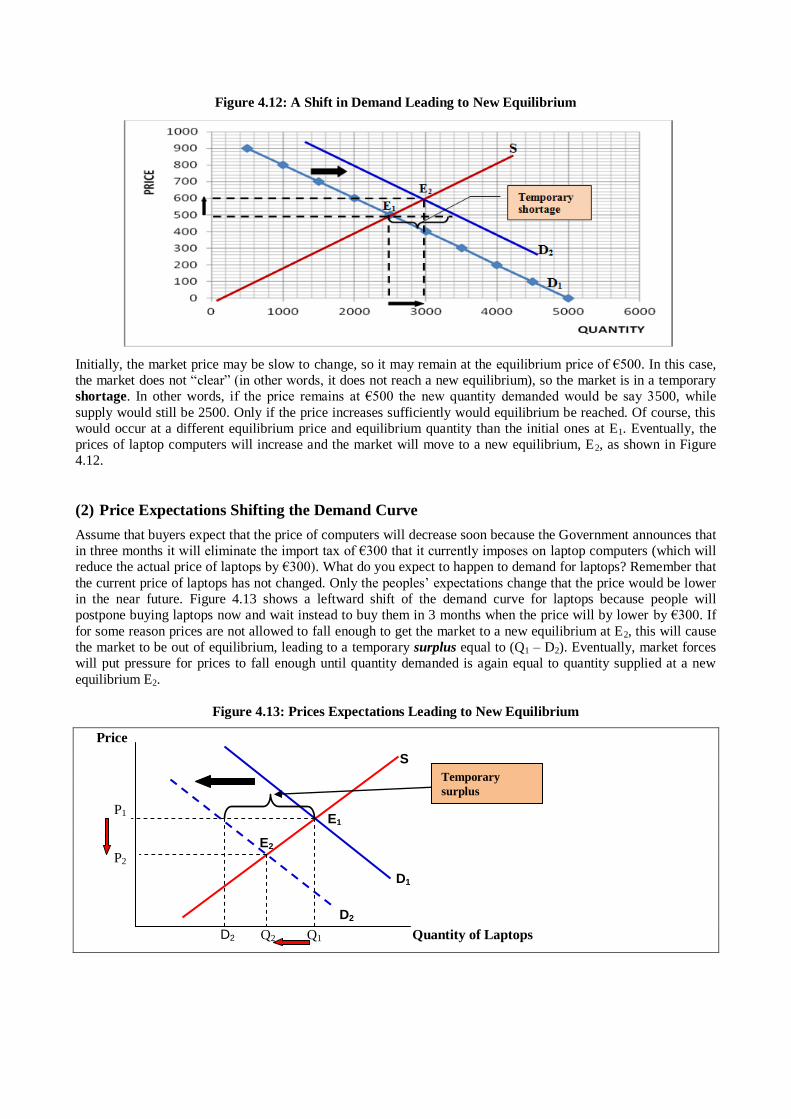
Figure 4.12: A Shift in Demand Leading to New Equilibrium
Initially, the market price may be slow to change, so it may remain at the equilibrium price of €500. In this case,
the market does not “clear” (in other words, it does not reach a new equilibrium), so the market is in a temporary
shortage. In other words, if the price remains at €500 the new quantity demanded would be say 3500, while
supply would still be 2500. Only if the price increases sufficiently would equilibrium be reached. Of course, this
would occur at a different equilibrium price and equilibrium quantity than the initial ones at E1. Eventually, the
prices of laptop computers will increase and the market will move to a new equilibrium, E2, as shown in Figure
4.12.
(2) Price Expectations Shifting the Demand Curve
Assume that buyers expect that the price of computers will decrease soon because the Government announces that
in three months it will eliminate the import tax of €300 that it currently imposes on laptop computers (which will
reduce the actual price of laptops by €300). What do you expect to happen to demand for laptops? Remember that
the current price of laptops has not changed. Only the peoples’ expectations change that the price would be lower
in the near future. Figure 4.13 shows a leftward shift of the demand curve for laptops because people will
postpone buying laptops now and wait instead to buy them in 3 months when the price will by lower by €300. If
for some reason prices are not allowed to fall enough to get the market to a new equilibrium at E2, this will cause
the market to be out of equilibrium, leading to a temporary surplus equal to (Q1 – D2). Eventually, market forces
will put pressure for prices to fall enough until quantity demanded is again equal to quantity supplied at a new
equilibrium E2.
Figure 4.13: Prices Expectations Leading to New Equilibrium
Price
P1
P2
Q2 Q1 Quantity of Laptops
S
E2
E1
D1
D2
D2
Temporary
surplus

Changes/Shifts in Supply Causing Disequilibrium
Changes in equilibrium positions may also originate from the supply side. We have already examined the various
“non-price determinants of supply” (such as technological innovations, increase or decreases in wages and
other input prices, expectations about future price changes, etc.). If we consider, for example, that technological
innovations occurred, this would shift the supply curve to the right, and the market would reach a new equilibrium
at higher quantity and lower price. This is shown in Figure 4.14. Of course, initially prices don’t respond quickly
and at the existing equilibrium price there would be a temporary surplus (as QS > QD). It is this excess supply that
puts pressure on prices to fall so the market reaches a new equilibrium.
Figure 4.14: Technological Innovations Shifting the Supply Curve
Price
Pe
P1
Qe Q1 Quantity
On the other hand, if we assume that input prices increase, this would shift the supply curve inwards to the left
and a new equilibrium would be reached at smaller quantity and higher prices. For example, if labour wages
increase (costs of production are now higher), the supply would shift to S2 and the market will eventually reach a
new equilibrium at E2. This situation is shown in Figure 4.15.
Figure 4.15: Increased Input Costs Shifting the Supply Curve
Price
P1
Pe
Q1 Qe Quantity
We examined above separately changes in demand and supply conditions (changes in non-price determinants of
demand or supply), and in each case we saw how the demand or supply curves shift due to these changes leading
to new equilibrium situations for the market.
In general, we saw that when changes in any of the non-price determinants lead to an:
Increase demand (without changes in supply), at the new equilibrium point we will definitely have higher
price and greater quantity demanded (see Figure 4.12 and Figure 4.13).
Decrease demand (without changes in supply), at the new equilibrium point we will definitely have lower
price and smaller quantity demanded.
S1
E1
E2
S2
D0
S
E1
E2
S1
D0
Temporary
surplus

Increase supply (without changes in demand), at the new equilibrium point we will definitely have lower
price and greater quantity supplied (See Figure 4.14).
Decrease supply (without changes in demand), at the new equilibrium point we will definitely have higher
price and smaller quantity supplied (See Figure 4.15).
Simultaneous Shifts in Demand & Supply and New Equilibrium
Of course, in a dynamic economy, it is possible (and perhaps more realistic) to expect that changes in factors that
impact on both demand and supply occur simultaneously. In such situations, if demand increases and supply
decreases, we can definitely conclude that the price will increase, but we cannot say for sure what will be the final
impact on quantity, since the increase in demand will tend to increase the equilibrium quantity, whereas the
decrease in supply will tend to reduce the equilibrium quantity. The final impact on Q would depend on the
relative shifts of demand and supply curves. We present in Figure 4.16 these different impacts on equilibrium
quantity when simultaneously there is an increase in demand (shift of D-curve to the right) and a decrease in
supply (shift of S-curve to the left). In the left panel, the relative decrease in supply is greater than the increase in
demand, so equilibrium Q decreases. In the right panel, the relative decrease in S is smaller than the increase in D,
so the equilibrium Q increases.
Figure 4.16: Different Impacts on Q from Similar Changes in Demand and Supply
Increase in Price – Decrease in quantity Increase in Price – Increase in Quantity
On the other hand, if demand decreases and supply increases, then we can say for sure that the price will fall, but
we cannot be sure what will be the impact on quantity, since the reduction in demand will tend to reduce the
equilibrium quantity, whereas the increase in supply will tend to increase the equilibrium quantity. In each case,
the final outcome will be determined by the relative changes in demand and supply. We present in Table 4.8 all
these cases of changes in demand and supply (what economists call “comparative statics”) and their impact on price (P) and quantity (Q) at the equilibrium.
Table 4.8: Summary of Comparative Static Situations
From an initial equilibrium situation the
following occur simultaneously:
At the new equilibrium situation the
following will likely occur:
Direction of Change
in Demand
Direction of Change
in Supply
Price will be: Quantity will be:
Increase No Change Higher Larger
Decrease No Change Higher Smaller
No Change Increase Higher Larger
No Change Decrease Higher Smaller
Increase Increase Cannot be sure Larger
Decrease Decrease Cannot be sure Smaller
Increase Decrease Higher Cannot be sure
Decrease Increase Higher Cannot be sure
D2
S1
S2
Quantity
P2
P1
Q2
D1
Q1 Q1 Q2
S1
S2
D2
D1
P2
P1
Price Price
Quantity
E2
E1
E2
E1

Market Interventions by Governments We have examined above the functioning of a free enterprise market system where the price mechanism is able to
send the right signals to buyers and sellers in order to “clear the market” (in other words, bring the market to
equilibrium). We have also seen that in the event that demand-driven or supply-driven non-price determinants
force the market out of equilibrium, again the price system would bring the market back to equilibrium. We see,
therefore, that the price system is the “invisible hand” of Adam Smith!
But what happens if prices of goods are controlled? There are such situation market economies where the
government believes that it is socially desirable to keep prices of goods and services at certain prices (irrespective
of demand and supply conditions). Examples of such “market interventions” would be the case of the farm
support programmes (such as those in the European Union), minimum wage laws, rent control laws, etc. What
impact do such policies of setting (fixing) the price of products and services (such as rent) have on the functioning
of free enterprise markets? The result, which has been observed for many consumer products in the socialist (or
controlled) economies (ex-Soviet Union, China, etc.), is that shortages are created! Why? Because sellers do not
find these artificially low prices attractive enough to supply goods to the market. We already examined such
situations in Figure 4.11.
Below we examine the impact on the market of two government interventions: (a) farm support programmes of
the EU, and (b) rent control programmes.
(a) EU Farm Support Programmes
In the European Union, in the context of the Common Agricultural Policy (CAP), governments support many
agricultural and farm products (such as milk, cheese, butter and other dairy products, grapes and wine, wheat, rice
and other grains, meat, etc.) by keeping the prices for farmers at levels above their equilibrium levels. In other
words, the governments subsidise the farmers. The prices that farmers receive are higher than the equilibrium
price as determined by the forces of supply and demand. What is the result of such government interventions in
the market? The result, as presented in Figure 4.17, is that at these prices for farm products, which are artificially
kept high (above equilibrium), surpluses of farm products are created.
Figure 4.17: Farm Support Programmes in the EU
The reason that there are surpluses is that at these prices, buyers are not willing to buy all the products that
farmers bring to the market. The EU governments intervene to absorb any unsold goods by buying and storing all
the surplus production! These farm price support programmes in the EU create what has been called “mountains
of butter and lakes of wine” an expression which metaphorically describes the phenomenon of excess supplies (or
surpluses) of agricultural and farm products. Indeed, CAP price intervention has been criticised for creating
artificially high food prices throughout the EU.

(b) Rent Control Programmes
In many countries, including Cyprus, there are rent control laws, whereby the Governments intervene in the
market by imposing a maximum price (a ceiling) on the rent for homes and apartments (and frequently also a
ceiling on the rate of increase of rents). We present in Figure 4.18 the market outcome in rent control situations.
Figure 4.18: Housing Shortages due to Rent Control
In this case, owners of houses and apartments (the “sellers” in the housing market) would not want to rent their
homes at low rents. In cases where the houses and apartments are already rented and the owners cannot evict the
tenants (as is the case in many countries) the result is that owners do not repair their homes and many simply
abandon them because frequently the rents they collect are not enough to even pay for the costs of repairs or
homeowners’ taxes, home insurance, etc. The result is the ghetto situations we observe in the old centres of many
towns: look, for example, at the ghetto of New York City, or the old centre of Nicosia in Figure 4.19!
Figure 4.19: Abandoned apartments and Shops due to Rent Control Laws
Abandoned apartments house in the Bronx, New York
Abandoned house in the old centre of Nicosia
___________ ___________

Study Questions
True-False Questions
Indicate whether each sentence below is true or false and give a brief explanation:
1) The law of demand expresses the relationship between the income of people and the quantity demanded of
a good per time period.
2) The demand for a good varies in the opposite direction to the change in the price of a substitute good
(ceteris paribus).
3) If an increase in the price of good X leads to an increase in the demand for good Y, then X and Y are
substitutes.
4) The simultaneous improvement in the technology of goods X and the price increase (P) a substitute of X,
may not change the equilibrium price (Pe).
5) According to the law of demand, there is an inverse relationship between the quantity demanded of a good
and its price.
6) The imposition of a maximum price for a commodity will result in both the reduction in the price and the
reduction of quantity supplied.
7) If the price of a good increases, on average we expect the quantity demanded of the good to fall.
8) The market demand curve is downward sloping. This is due to the law of demand, i.e., the negative
relationship between price and quantity demanded.
9) The quantity demanded of a good may be determined by changes in the prices of related goods.
10) A very severe winter will result in a shift of the demand curve for woollen clothes to the left.
11) A shift to the right of the demand is referred to as an increase in the quantity demanded of the good.
12) An increase in prices of inputs used in the production of a good will increase its supply.
13) When we sum horizontally the demand curves of individual consumers for a good, we get the market
demand curve for the good.
14) Improvements in the technology of producing a good, shifts the supply curve to the right.
15) An increase in the price of a good will shift the demand curve for that good to the right.
16) When there is a surplus, the price of a good increases, and decreases when there is a shortage.
17) According to the substitution effect, an increase in the price of a good will likely encourage consumers to
find substitutes.
18) The reduction in demand of a good, with its supply constant, decreases its price.
19) If two goods are substitutes, a price increase in one increases the quantity demanded of the other.
20) The imposition of a maximum price can create "black market".
21) The increase in the supply of a good, with its demand constant, increases its price.

22) In the name of protecting consumers, the Government may impose a price ceiling, which is always at a
higher level than the equilibrium price.
23) According to the income effect, if the price of a good increases, this is equivalent to a decrease in income.
24) Simultaneous reduction of supply and demand of a good may not change the price.
25) Simultaneous reduction of supply and demand of a good may not change the equilibrium quantity.
Multiple Choice Questions 1. Ceteris paribus, people will buy more of a good if its price decreases. This statement is:
A) the law of supply
B) the law of demand
C) the law of one price
D) (B) and (C)
2. The law of demand shows how quantity demanded changes, ceteris paribus, when
A) the incomes of the buyers increase
B) the price of the good changes
C) the prices of related goods change
D) all of the above
Use the following graph to answer Question 3
3. The graph shows that a shift of the demand curve of good X affects the demand for good Y. Which of the
following pairs of goods is likely to be good X and good Y? A) souvlaki and pitsa
B) travelling from London to Paris by plane or by Eurostar (express train) C) Alpha-Mega and Carrefour supermarkets D) souvlaki and pitta bread 4. Consider two goods, iPads and laptops (strong substitutes). If the price of iPads decreases, what will
happen to the demand and price of laptops?
A) the demand for laptops will decrease and the price will increase
B) the demand for laptops will increase and the price will decrease
C) the demand for laptops will decrease and the price will decrease
D) the demand for laptops will increase and the price will increase
5. What would be the impact of a decrease in the price of DVDs?
A) decrease the demand for DVD players
Good Χ
Price Χ S D2
D1
Quantity of Χ
Good Y
Price Υ S
D2
D1
Quantity of Υ

B) increase the demand for DVD players
C) decrease the quantity demanded of DVDs
D) (A) and (C)
6. A technological breakthrough lowers the cost of the components for making laptops. In reaching a new
equilibrium for laptops, we expect that:
A) the demand curve for laptops will shift to the right
B) there will be a movement up along the supply curve for laptops
C) the supply curve for laptops will shift to the right
D) the price of laptops will increase
7. If the prices of raw materials decrease, ceteris paribus,
A) the supply will be unaffected
B) the supply will decrease
C) the supply will increase
D) the demand will decrease
8. A demand curve shows the relationship
A) between income and quantity demanded
B) between price and income
C) between price and quantity demanded
D) between inputs and quantity demanded
9. Ceteris paribus, if the price of cars increases:
A) the demand curve for cars shifts to the right
B) we move down along the demand curve for cars
C) we move up along the demand curve for cars
D) the demand curve for cars shifts to the left
Use the following graph to answer Questions 10 through 11
Price S2
S1
D2
10. Initially the market for bread is in equilibrium at point A. If the Government imposes a ceiling on the
price of bread below the equilibrium price, which of the following represents a new equilibrium?
A) B
B) C
C) D
D) no change
11. Initially the market for iPads is in equilibrium at point D. If technology for making iPads improves but at
the same time due to economic recession people’s incomes fall, where will the new equilibrium be?
A) A
B) B
C) C
D) no change
A
B
C
D
D1
Quantity

12. From an initial equilibrium at point D the market moves to a new equilibrium at point C. This change in
market conditions may be described as:
A) a decrease in demand and no change in supply
B) an increase in supply and no change in demand
C) an increase in demand and a decrease in supply
D) a decrease in supply and a decrease in demand
13. Initially the market for airline travel from UK to Cyprus is in equilibrium at point B. The price of airline
fuel increases and at the same time the price for hotel accommodation in Cyprus falls significantly.
Which of the following would represent a new equilibrium for airline travel?
A) A
B) C
C) D
D) cannot be sure
14. According to the law of supply:
A) quantity supplied is always equal to quantity demanded
B) technology can influence the quantity produced
C) quantity supplied is positively related to price changes
D) (B) and (C)
15. The demand curve for a normal good will shift to the right if:
A) income increases
B) population increases
C) the price of a substitute good increases
D) all the above
Use the graph below for the demand and supply of iPhones to answer Questions 16 and 17
16. Given the data in the graph, if the market price of iPhone is €600, what market condition will exist?
A) a shortage of 1,000 iPhones
B) a surplus of 2,000 iPhones
C) a surplus of 1,000 iPhones
D) a shortage of 2,000 iPhones
17. If the market price of iPhone is €300, which of the following is likely to occur?
A) a shortage of iPhones, putting pressure on prices to rise
B) a shortage of iPhones, putting pressure on prices to fall
C) a surplus of iPhones, putting pressure on prices to fall
D) a surplus of iPhones, putting pressure on prices to rise
Use the data in following table to answer Questions 18 and 19

Price of CD (€) Quantity of CD demanded Quantity of CD supplied
6 3000 0
8 2500 1000
10 2000 2000
12 1500 3000
14 1000 4000
16 500 5000
18. Given the data in the above table, the equilibrium price and quantity of CDs are:
A) Pe=€12 and Qe=3000 dinners
B) Pe=€8 and Qe=2500 dinners
C) Pe=€10 and Qe=2000 dinners
D) Pe=€10 and Qe=1500 dinners
19. If the market price of CDs is €8, which of the following is likely to occur?
A) a shortage of 1500 CDs
B) a shortage of 2000 CDs
C) a surplus of 1500 CDs
D) a surplus of 2000 CDs
Use the following graph to answer Questions 20 and 21
Prices
Supply
P1*
D2
D1
Q1* Quantity
20. Ceteris paribus, if the price rises above the equilibrium price P1*:
A) the demand curve will shift to D2
B) the market will be in disequilibrium
C) there will be a shortage of the good
D) the government will intervene in the market to reduce prices
21. In the graph, if the market price is below the equilibrium price P*, then:
A) the demand curve will shift to D2
B) there will be excess demand and prices will fall
C) there will be excess supply and sellers will raise prices to get rid of the surplus
D) market forces will raise the price
22. The supply curve for a normal good will shift to the left if:
A) prices of inputs rise
B) technology improves
C) the number of producers increases
D) the government gives subsidies to the producers

23. All of the following will shift the demand curve for laptops, EXCEPT
A) a change in income of consumers
B) a change in expectations about the price of the laptop
C) a change in the price of a related good (e.g., an iPhone)
D) a change in the price of the laptop
24. Other things the same, if the price of Windows 7 increases, the likely effect on the demand for laptops
would be shown by:
A) a movement down the along the demand curve for laptops
B) a movement up along the demand curve for laptops
C) a shift of the demand curve for laptops to the right
D) a shift of the demand curve for laptops to the left
25. The equilibrium price for a used car is €5000, but currently the market price is €4000. At this price
A) a surplus will be created, and eventually market forces will raise the price
B) a shortage will be created, and eventually market forces will push the price down
C) a surplus will be created, and eventually market forces will push the price down
D) a shortage will be created, and eventually market forces will raise the price
26. Consider that the minimum wage is above the equilibrium wage. This will likely create:
A) a surplus of workers
B) a shortage of workers
C) an excess supply of workers
D) equilibrium (supply of workers will equal demand for workers)
27. George decides to buy more CDs when their price falls. We show this
A) by a shift outward of the demand curve
B) by a shift inward of the demand curve
C) by moving down along the demand curve
D) all above are possible
Use the following graph to answer Questions 28 and 29
28. The above demand curve shows:
A) that if price increases from €10 to €20, the quantity demanded increases from 80 units to 100 units
B) that if price falls from €30 to €20, the quantity demanded increases from 60 units to 80 units
C) that price and quantity are negatively related
D) (B) and (C)
29. The slope of the demand curve between points B and C is:
A) -1.00
B) -0.50
C) -2.00
D) -0.25
Price €
€30 A
€20 B
€10 C
60 80 100 Quantity

Essays, Problems and Applications
1. Define the laws of demand and supply and identify the respective non-price determinants.
2. Provide examples of factors that would shift, respectively, the supply and demand curves for souvlaki.
3. In what situations do we move up or down a demand or supply curve?
4. Draw demand and supply curves to show how the market reaches equilibrium. Explain what happens when
the market price is above the equilibrium price. What market forces are set in motion to restore equilibrium?
5. Consider the market for laptops. Use demand and supply diagrams to show the effects on equilibrium price
and quantity in the following situations:
a) The costs of the components for making laptops decrease.
b) The government eliminates the 50% import duty on laptops.
c) The government gives a grant to students to buy laptops.
d) A report shows scientific results that laptops are dangerous to health.
e) Increasingly there is preference among young people to use iPads, tablets, etc.
6. Discuss the various non-price determinants of demand for cars and provide examples for each.
7. Discuss the various non-price determinants of supply for cars and provide examples for each.
9. The following graph shows the demand and supply curves for rattan patio sets:
a) What are the equilibrium price and quantity?
b) If the price is €600, what market situation would exist (surplus or deficit)?
c) What is the amount of this surplus or shortage?
10. The following table provides the demand and supply schedules for souvlaki.
Price
(€ per pita of
souvlaki)
Quantity Demanded
(Number of pitas of
souvlaki)
Quantity Supplied
(Number of pitas of
souvlaki)
Excess Demand or
Supply
0.00 900 100
1.00 800 200
2.00 700 300
3.00 600 400
4.00 500 500
5.00 400 600

6.00 300 700
7.00 200 800
8.00 100 900
a) Complete the last column.
b) Draw the demand and supply curves.
c) What are the equilibrium price and quantity of souvlaki?
11. What would happen to equilibrium price and quantity for hotel accommodation in Cyprus in each of the
following situations? Draw curves to show how the market reaches a new equilibrium.
a) The incomes of British consumers fall due to the economic recession
b) The price of hotel accommodation in neighbouring countries (e.g. Egypt) falls.
c) There is a real possibility that the US may invade Iran.
d) Foreign tourists expect that due to the recession, the hotel accommodation in Cyprus will fall.
e) The price of accommodation actually rises.
12. Consider the demand and supply of bottled water per day in a typical summer day in Cyprus (average
temperature of 36 degrees Celsius). Assume that at the initial equilibrium (E1) the equilibrium price is €2.0 per
bottle and the equilibrium quantity is 10,000 bottles per day. Show graphically the impact on price and quantity of
an exceptional heat wave (with temperatures of 42 degrees Celsius) as the market moves to a new equilibrium
(E2). Use hypothetical values for the new price and quantity at E2.
12. Consider the demand and supply of potato production in Cyprus. Starting from an initial equilibrium (E1),
show graphically the impact on price and quantity of a winter freeze that destroys 50% of the production of
potatoes. Draw curves to show how the market moves to a new equilibrium (E2).
13. Consider again the demand and supply of potato production in Cyprus, which is initially at equilibrium at E1.
Assume that potatoes are a normal good. For each of the following situations, determine the impact on price and
quantity. Draw curves to show how the market moves to a new equilibrium (E2).
a) The incomes of consumers fall due to the economic recession and the government subsidises potato
farmers.
b) The price of potatoes increases.
c) A new improved variety of potato is planted (more output per acre) and there is a new medical report about
the benefits of eating potatoes.
d) Due to the recession in the UK, British tourists (who make up 50% of tourist arrivals in Cyprus) want to
economise so they eat only potatoes and reduce their demand for pitsa and souvlaki.
e) The prices of souvlaki and pitsa (considered as complements of potatoes) increase.
14. The following table provides the demand and supply schedules for CDs.
Price (€ per CD) Quantity Demanded (thousands) Quantity Supplied (thousands)
8.00 7,000 1,000
9.00 6,000 2,000
10.00 5,000 3,000
11.00 4,000 4,000
12.00 3,000 5,000
13.00 2,000 6,000
14.00 1,000 7,000
a) Plot these data to find the demand and supply curves.
b) What are the equilibrium price and quantity of CDs?
c) At price=€12.00, is there a surplus or a shortage and by how much?
d) In the situation in (c), what market forces do you expect to be set in motion to correct the situation?
e) If the price of polycarbonate plastic (the material used to make CDs) increases, where will the market reach a
new equilibrium? Will demand or supply change? Draw graphs to show the impact on price and quantity.

f) If the prices of CDs players increase, where will the market reach a new equilibrium? Will demand or supply
change? Draw graphs to show the impact on price and quantity.
15. What would happen to the demand for university education if the government of Cyprus subsidizes 50% of
tuition fees for all students? What would happen to the demand for university professors? What would
happen to their salaries?
16. Assume that the price of crude oil in the international markets is expected over the next 10 years to rise to
about $200 per barrel, or about €3 per litre at the petrol station! (This may not be just a scenario, by the
way!?). Over this period (long-run) what do you expect might happen to the:
a) Demand for bicycles?
b) Demand for big cars?
c) Demand for electric cars?
d) Supply of synthetic fuels?
e) Supply of renewable energy?
f) Demand for air travel?
17. Which of the following sets of goods tend to be substitutes in consumption, and which are usually
complements?
a) DVDs and DVD players
b) Salt and pepper
c) Sugar and coffee
d) Pens and paper
e) Water and orange juice
18. Ceilings on rents for apartments and housing are in effect in several countries, including Cyprus. What effect
do such controls have on the incentives of property owners to offer these building for rent or to maintain them in
good shape? Which groups may gain from rent controls? Which groups may lose?
More Advanced Algebraic Problems 1. Assume that the demand and supply equations (functions) for the economy air travel between London and
Larnaca are:
QD = 900 – 4.0P
QS = -300 + 2.0P
where QD and QS are measured in thousands of passengers per month and P is the average ticket price in Euro.
a) Determine the equilibrium price and quantity.
b) What would happen if the market price of economy air travel is €300?
c) Discuss the market forces that would be set in motion and the impact on price as a result of this
market condition?
2. Assume that the demand and supply functions for the wine market in Cyprus are:
QD = 60 – 2.0P
QS = 12 + 6.0P
where QD and QS are respectively the demand and supply of wine, measured in thousands of bottles per year and P
is the average price of wine, in Euro per bottle.
a) Calculate the equilibrium price and quantity.
b) What market condition will result if the market price of wine is €8?