CHAPTER-4 CAPITAL STRUCTURE & ITS COMPONENTS ...
37
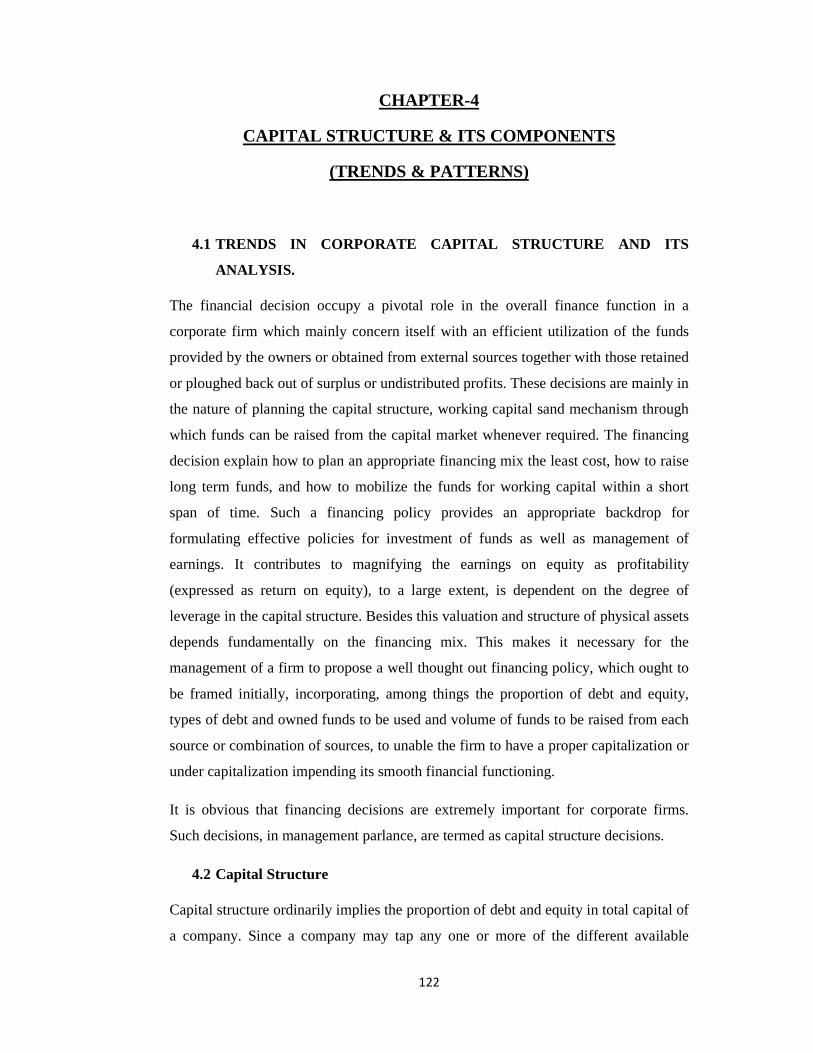
122 CHAPTER-4 CAPITAL STRUCTURE & ITS COMPONENTS (TRENDS & PATTERNS) 4.1 TRENDS IN CORPORATE CAPITAL STRUCTURE AND ITS ANALYSIS. The financial decision occupy a pivotal role in the overall finance function in a corporate firm which mainly concern itself with an efficient utilization of the funds provided by the owners or obtained from external sources together with those retained or ploughed back out of surplus or undistributed profits. These decisions are mainly in the nature of planning the capital structure, working capital sand mechanism through which funds can be raised from the capital market whenever required. The financing decision explain how to plan an appropriate financing mix the least cost, how to raise long term funds, and how to mobilize the funds for working capital within a short span of time. Such a financing policy provides an appropriate backdrop for formulating effective policies for investment of funds as well as management of earnings. It contributes to magnifying the earnings on equity as profitability (expressed as return on equity), to a large extent, is dependent on the degree of leverage in the capital structure. Besides this valuation and structure of physical assets depends fundamentally on the financing mix. This makes it necessary for the management of a firm to propose a well thought out financing policy, which ought to be framed initially, incorporating, among things the proportion of debt and equity, types of debt and owned funds to be used and volume of funds to be raised from each source or combination of sources, to unable the firm to have a proper capitalization or under capitalization impending its smooth financial functioning. It is obvious that financing decisions are extremely important for corporate firms. Such decisions, in management parlance, are termed as capital structure decisions. 4.2 Capital Structure Capital structure ordinarily implies the proportion of debt and equity in total capital of a company. Since a company may tap any one or more of the different available
Transcript of CHAPTER-4 CAPITAL STRUCTURE & ITS COMPONENTS ...
122
CHAPTER-4
CAPITAL STRUCTURE & ITS COMPONENTS
(TRENDS & PATTERNS)
4.1 TRENDS IN CORPORATE CAPITAL STRUCTURE AND ITS
ANALYSIS.
The financial decision occupy a pivotal role in the overall finance function in a
corporate firm which mainly concern itself with an efficient utilization of the funds
provided by the owners or obtained from external sources together with those retained
or ploughed back out of surplus or undistributed profits. These decisions are mainly in
the nature of planning the capital structure, working capital sand mechanism through
which funds can be raised from the capital market whenever required. The financing
decision explain how to plan an appropriate financing mix the least cost, how to raise
long term funds, and how to mobilize the funds for working capital within a short
span of time. Such a financing policy provides an appropriate backdrop for
formulating effective policies for investment of funds as well as management of
earnings. It contributes to magnifying the earnings on equity as profitability
(expressed as return on equity), to a large extent, is dependent on the degree of
leverage in the capital structure. Besides this valuation and structure of physical assets
depends fundamentally on the financing mix. This makes it necessary for the
management of a firm to propose a well thought out financing policy, which ought to
be framed initially, incorporating, among things the proportion of debt and equity,
types of debt and owned funds to be used and volume of funds to be raised from each
source or combination of sources, to unable the firm to have a proper capitalization or
under capitalization impending its smooth financial functioning.
It is obvious that financing decisions are extremely important for corporate firms.
Such decisions, in management parlance, are termed as capital structure decisions.
4.2 Capital Structure
Capital structure ordinarily implies the proportion of debt and equity in total capital of
a company. Since a company may tap any one or more of the different available
123
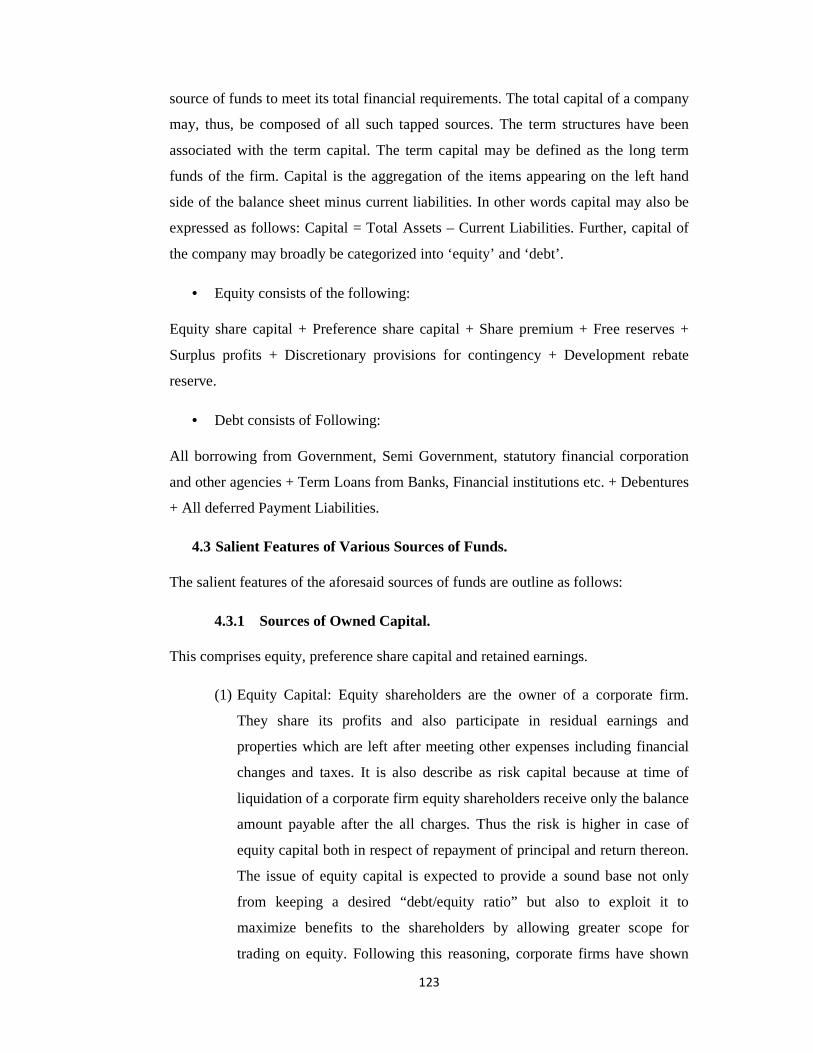
source of funds to meet its total financial requirements. The total capital of a company
may, thus, be composed of all such tapped sources. The term structures have been
associated with the term capital. The term capital may be defined as the long term
funds of the firm. Capital is the aggregation of the items appearing on the left hand
side of the balance sheet minus current liabilities. In other words capital may also be
expressed as follows: Capital = Total Assets – Current Liabilities. Further, capital of
the company may broadly be categorized into ‘equity’ and ‘debt’.
• Equity consists of the following:
Equity share capital + Preference share capital + Share premium + Free reserves +
Surplus profits + Discretionary provisions for contingency + Development rebate
reserve.
• Debt consists of Following:
All borrowing from Government, Semi Government, statutory financial corporation
and other agencies + Term Loans from Banks, Financial institutions etc. + Debentures
+ All deferred Payment Liabilities.
4.3 Salient Features of Various Sources of Funds.
The salient features of the aforesaid sources of funds are outline as follows:
4.3.1 Sources of Owned Capital.
This comprises equity, preference share capital and retained earnings.
(1) Equity Capital: Equity shareholders are the owner of a corporate firm.
They share its profits and also participate in residual earnings and
properties which are left after meeting other expenses including financial
changes and taxes. It is also describe as risk capital because at time of
liquidation of a corporate firm equity shareholders receive only the balance
amount payable after the all charges. Thus the risk is higher in case of
equity capital both in respect of repayment of principal and return thereon.
The issue of equity capital is expected to provide a sound base not only
from keeping a desired “debt/equity ratio” but also to exploit it to
maximize benefits to the shareholders by allowing greater scope for
trading on equity. Following this reasoning, corporate firms have shown
124
greater interest in this source, even though it does not confer any tax
benefits.
(2) Preference Share Capital: Preference shareholders enjoy preferential rights
as compared to equity shareholders both in respect of dividends and
repayment of capital either during the life time or on winding up of the
corporate firm. On certain attributes of this source such as fixed dividend
rate and absence of any tax benefits, it is considered to be a relatively
weak corporate security. Accordingly this source has become unpopular
amongst the corporate firms. As most of the companies have not issued
preference share capital, this is excluded from the study.
(3) Retained earnings: A corporate firm can finance its developmental
activities from internal surpluses. That means instead of allocating the
entire profits for distribution as dividends, portion of the profits is kept in
the firm for financing the future plans for growth. Being a part of profit
earned by the firm, retained earnings belong to the owners of the firm.
Therefore, this source forms a part of equity fund. The percentage of
profits to be retained in the firm depends on a variety of factors such as the
nature of industry, magnitude of profitability, tax burden, expectation of
shareholders and attitude of the management towards allocation of profits,
etc.
4.3.2 Borrowed Funds
A corporate firm could also avail itself of funds from borrowed sources for meeting
the financial requirements of long term as well as short term duration. Most of the
growing and well established corporate firms invariably favor employing borrowed
funds as they are relatively less costly sources of finance. They lead to savings in
corporate income tax and help to avoid dilution of voting power. These sources
broadly include debenture capital, term loans, differed credit and public deposits, etc.
(1) Debentures: A corporate firm may be issue convertible or non-convertible
debentures. The debentures are converted at the option of the holders in to
ordinary shares under specific terms and conditions. Ordinarily, debentures are
issued for a longer period, say seven to fifteen years, provided they are
redeemable. Theoretically, irredeemable debenture issues could also be
125
attempted. It is surprising to note that most of the companies in Andhra
Pradesh have not issued debentures. Most of the companies are depending on
the other forms of debt.
(2) Term Loan: this source represents borrowing from domestic or international
financial institutions against security of fixed assets. Term loans are generally
repayable in sixteen to eighteen equal half-yearly installments after a grace
period of two or three years. This has become an important source for rising
long term funds for newly established firms in view of the very limited scope
for raising funds from the capital market.
(3) Deferred Credit: A company can resort to credit facilities extended by the
foreign suppliers to import capital asset or technology. It has to pay in
installments spread over periods ranging from seven to fifteen years. The
suppliers obtain promissory notes signed by the buyer for each installment and
they discount it with their bankers, the buyer is required to execute promissory
notes and obtain a ban guarantee.
(4) Public Deposits: A corporate firm can accept deposits which represent
unsecured borrowings form the public at large. The maturity period for public
deposit is usually one to three days. With the help of this source, it is possible
to mobilize sufficient funds by attracting certain classes of investors due to
higher interest rates thereon than the prevailing rate of return on bank deposits
other instruments such as preference shares. This form of debt is also not
present in the sampled units.
(5) Cash Credits and Bank Overdrafts: A corporate firm can obtained short-term
credit facilities from commercial banks to meet working capital requirements.
This credit facility is obtained either in the form of cash credit bank overdraft
wherein interest is changed normally on the amount actually drawn or used. In
addition, the corporate firm can also avail itself of temporary loan facility by
discounting commercial papers with the banks. Considering the ease of access,
ready availability of funds and relative cost, all discounting has become a
customary practice for corporate firms for using necessary short-term capital
from the commercial banks.
126
(6) Total Debt: Debentures issued by the companies, bank loans, other secured
loans are included under the total debt. The average total debt of the
companies for the study of 7 years is presented in table 4.1 and 4.3 of all the
18 units of the sample of cement and Automobile industries.
4.4 Constraints on Capital Structure Decision:
In view of availability on numerous sources of funds, the planning of capital structure
involves decision making about three basic issues, namely, should be the debt/equity
ratio, which sources of borrowed and owned funds should be used, and the other
criteria to be applied to strike optimality. These decisions could be taken after giving
due thought to the following constraints.
4.5 Factors Influencing Capital Structure
1. Tax Advantage of Debt: The first factor the tax advantage of debt. Interest
paid on is deductible from income and reduces a firm’s tax liabilities,
therefore, debt has a tax advantage over equity and by increasing the amount
of debt issued, and a firm increases its earnings available to shareholders.
2. Investors’ attitude to risk and return: The second factor is related to segmented
market, with different sets of investors measuring risk differently or simply
charging different rates on the capital that they invest. By choosing the
instrument that taps the cheapest market, firms lower their cost of capital.
However the trade off in terms of availability of funds always exists.
3. Financing decision and firm’s risk exposure: The third factor is the impact of
financing decisions on the riskiness of a firm. As firms pile or more and more
debt, their ability to meet fixed interest payments out of current earnings
diminished. This affects the profitability of bankruptcy and as a result, the cost
(or risk premium) of both debt and equity. Firms that adjust their capital
structure in order to keep the riskiness of their debt and equity reasonable
should have a lower cost of capital.
4. Flexibility: It is more important consideration with the raising of debt is
flexibility. As and when the funds required, the debt may be raised and it can
be paid off and when desired. But in case of equity, once the fund rose through
issue of equity shares, it cannot ordinarily be reduces except with the
127
permission of the court and compliance with lot of legal provisions. Hence,
debt capital has to get the characteristic of greater flexibility than equity
capital, which will influence the capital structure decisions.
5. Timing: The timing at which the capital structure decision is taken will be
influenced by the boom or recession conditions of the economy. In times of
boom, it would be easier for the firm to raise equity, but in times of recession,
the equity investors will not show much of interest in investing. Then the firm
is to rely in raising debt.
6. Legal Provisions: Legal provisions in raising capital will also play a
significant role in planning capital structure. Rising of equity capital is more
complicated than raising debt.
7. Profitability of the Company: A Company with higher profitability will have
low reliance on outside debt and it will meet its additional requirement
through internal generation.
8. Growing companies: The growing companies will require more than more
funds for its. Expansion schemes, which will be met through raising debt.
4.6 Analysis of the Capital Structure.
It is essential to know how to analyze the concept of capital structure. One approach
to this is to use leverage terminology. As stated earlier, leverage presents the use of
fixed cost bearing securities such as debt and preference capital lieu of equity for
raising funds. Therefore, the degree of leverage could be employed both for
examining the proportion of debt fund in the capital structure as well as for analyzing
its impact on the benefits to the shareholders as normally it is expected that the use of
debt should be beneficial to the shareholders.
The magnitude of the debt finance in the capital structure could be combined by using
three different ratios namely debt/equity ratio, debt to capital employed ratio and
interest coverage ratio. But hare the study is affected to the debt to capital employed
ratio only.
128
4.6.1 Debt to capital employed ratio: This ratio represents the degree of relationship
between debt and capital employed and is expressed in percentage as below
���
������ ���� ��� � 100
As the debt may be considered as long term and short term either independently or
combine, debt to capital employed ratio could be classified in to three categories.
Short term debt to capital employed ratio: Wherein capital employed is comprised
of net worth and short term debt only.
Long term debt to capital employed ratio: Wherein capital employed is comprised
of net worth and long term debt only.
Total debt to capital employed ratio: Wherein capital employed is comprised of net
worth, short term and long term debt only.
Of the above three ratios, the second ration namely long term debt to capital
employed is used in macro analysis as the debt/equity norm, which is inspected to be
used as a focal point for arriving at desired debt/equity ratio, is always fixed with
respect to long term debt equity ratio only. On the other hand, the third ratio debt to
capital employed is used in micro study.
4.6.2 Equity to capital employed:
There is yet another alternative way of expressing basic relationship between debt and
equity. If one wants to know, how much funds are contributed together by the lenders
and owners for each rupee of owner’s contribution? This can be found out by
calculating the ratio of equity to capital employed or net worth to assets. Here equity
means shareholders fund or net worth calculated as follows.
Paid-up share capital + share premium + reserves and surplus – accumulated losses
and miscellaneous not written off.
In light of above information, the researcher analyses the data of sample companies of
steel and automobile industry in the following manner.

Table No: 4.1 Total debt of sampled companies of Automobile Industry
Sr. No.
Name of the company
2008
1 Ashok Leyland Ltd.
887.50
2 Bajaj Auto Ltd.
1334.34
3 Hero Motorcorp Ltd.
132.00
4 Mahindra & Mahindra Ltd.
2587.06
5 Maruti Suzuki India Ltd.
900.20
6 Tata Motors Ltd.
6280.52
7 TVS Motors 666.34
Average - Year wise 1826.85
Source: Ace Analyser Database
As we can see from the table that average debt of automobile companies is 3309.39
crores over the period of study. Further we can say that average debt of Tata Motors is
327 % more than average debt of industry. Moreover we can also see that rest of all
the companies have average debt size which is less than industry average debt.
Moreover from the above figu
borrowing debt by automobile companies over the years.
Chart no. 4.1
129
Table No: 4.1 Total debt of sampled companies of Automobile Industry (Rs. In Crores.)
2009 2010 2011 2012 2013
887.50 1961.99 2267.99 2568.26 3097.89 4355.43
1334.34 1570.00 1338.58 325.14 125.03 88.44
132.00 78.49 66.03 2164.39 1730.83 943.74
2587.06 4052.76 2883.61 2404.47 3580.76 3488.59
900.20 698.90 821.40 309.20 1236.90 1389.20
6280.52 13329.68 16594.54 15915.43 15880.57 16798.95
666.34 908.95 1003.37 767.82 831.09 628.16
1826.85 3228.68 3567.93 3493.53 3783.30 3956.07
Source: Ace Analyser Database
As we can see from the table that average debt of automobile companies is 3309.39
of study. Further we can say that average debt of Tata Motors is
327 % more than average debt of industry. Moreover we can also see that rest of all
the companies have average debt size which is less than industry average debt.
Moreover from the above figures we can also say that there is upward trend on
borrowing debt by automobile companies over the years.
Chart no. 4.1 - Total debt of automobile companies
Table No: 4.1 Total debt of sampled companies of Automobile Industry
2013 Average - Company
wise
4355.43 2523.18
88.44 796.92
943.74 852.58
3488.59 3166.21
1389.20 892.63
16798.95 14133.28
628.16 800.96
3956.07 3309.39
As we can see from the table that average debt of automobile companies is 3309.39
of study. Further we can say that average debt of Tata Motors is
327 % more than average debt of industry. Moreover we can also see that rest of all
the companies have average debt size which is less than industry average debt.
res we can also say that there is upward trend on
130
From the above chart we can see that there in continuous increase in debt size of
Ashok Leyland and Tata motors over the years. Mahindra & Mahindra, Maruti Suzuki
and TVS Motors have fluctuating debt size over the years, while Bajaj Auto and Hero
Motorcorp are reducing their debt size over the years.
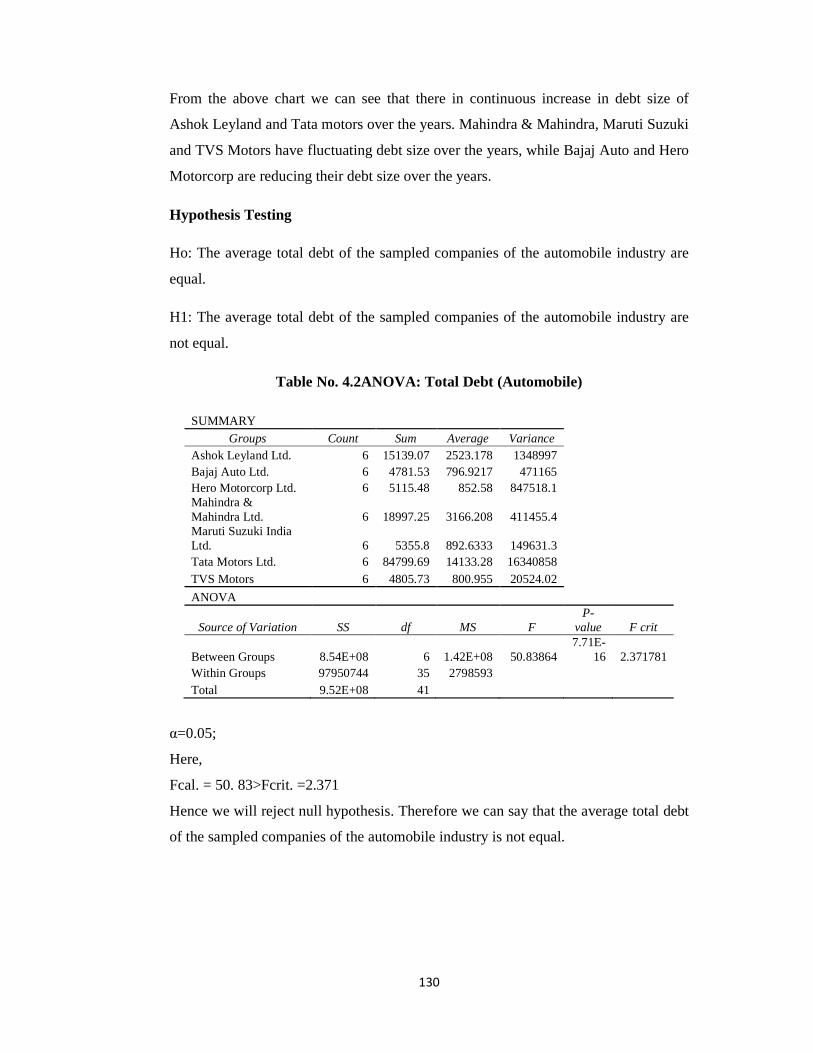
Hypothesis Testing
Ho: The average total debt of the sampled companies of the automobile industry are
equal.
H1: The average total debt of the sampled companies of the automobile industry are
not equal.
Table No. 4.2ANOVA: Total Debt (Automobile)
SUMMARY Groups Count Sum Average Variance
Ashok Leyland Ltd. 6 15139.07 2523.178 1348997 Bajaj Auto Ltd. 6 4781.53 796.9217 471165
Hero Motorcorp Ltd. 6 5115.48 852.58 847518.1 Mahindra &
Mahindra Ltd. 6 18997.25 3166.208 411455.4 Maruti Suzuki India Ltd. 6 5355.8 892.6333 149631.3
Tata Motors Ltd. 6 84799.69 14133.28 16340858 TVS Motors 6 4805.73 800.955 20524.02
ANOVA
Source of Variation SS df MS F P-
value F crit
Between Groups 8.54E+08 6 1.42E+08 50.83864 7.71E-
16 2.371781 Within Groups 97950744 35 2798593
Total 9.52E+08 41
α=0.05;
Here,
Fcal. = 50. 83>Fcrit. =2.371
Hence we will reject null hypothesis. Therefore we can say that the average total debt
of the sampled companies of the automobile industry is not equal.
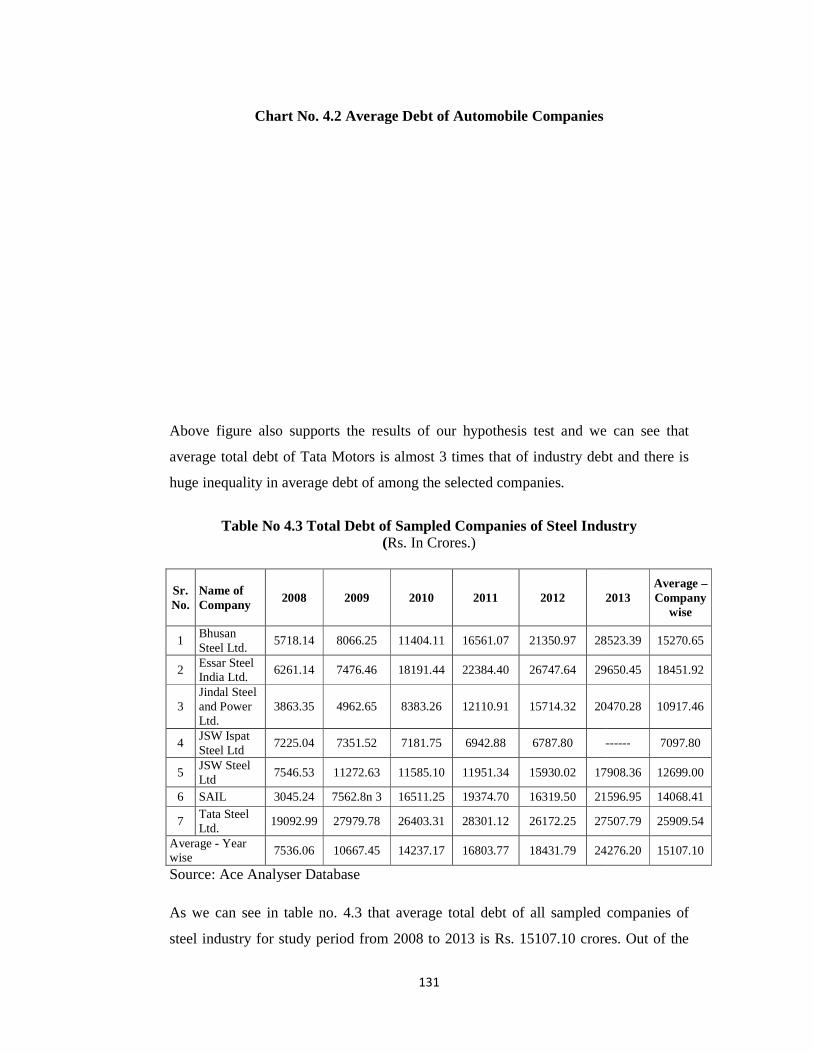
Chart No. 4.2 Average Debt of
Above figure also supports the results of our hypothesis test and we can see that
average total debt of Tata Motors is almost 3 times that of industry debt and there is
huge inequality in average debt of among the selected companies
Table No 4.3 Total Debt of Sampled Companies of Steel Industry
Sr. No.
Name of Company
2008
1 Bhusan Steel Ltd.
5718.14
2 Essar Steel India Ltd.
6261.14
3 Jindal Steel and Power Ltd.
3863.35
4 JSW Ispat Steel Ltd
7225.04
5 JSW Steel Ltd
7546.53
6 SAIL 3045.24
7 Tata Steel Ltd.
19092.99
Average - Year wise
7536.06
Source: Ace Analyser Database
As we can see in table no. 4.3 that average total debt of all sampled companies of
steel industry for study period from 2008 to 2013 is Rs. 15107.10 crores. Out of the
131
Chart No. 4.2 Average Debt of Automobile Companies
Above figure also supports the results of our hypothesis test and we can see that
average total debt of Tata Motors is almost 3 times that of industry debt and there is
huge inequality in average debt of among the selected companies.
Table No 4.3 Total Debt of Sampled Companies of Steel Industry (Rs. In Crores.)
2009 2010 2011 2012 2013
8066.25 11404.11 16561.07 21350.97 28523.39
7476.46 18191.44 22384.40 26747.64 29650.45
4962.65 8383.26 12110.91 15714.32 20470.28
7351.52 7181.75 6942.88 6787.80 ------
11272.63 11585.10 11951.34 15930.02 17908.36
7562.8n 3 16511.25 19374.70 16319.50 21596.95
27979.78 26403.31 28301.12 26172.25 27507.79
10667.45 14237.17 16803.77 18431.79 24276.20
Source: Ace Analyser Database
As we can see in table no. 4.3 that average total debt of all sampled companies of
steel industry for study period from 2008 to 2013 is Rs. 15107.10 crores. Out of the
Above figure also supports the results of our hypothesis test and we can see that
average total debt of Tata Motors is almost 3 times that of industry debt and there is
Table No 4.3 Total Debt of Sampled Companies of Steel Industry
2013 Average – Company
wise
28523.39 15270.65
29650.45 18451.92
20470.28 10917.46
------ 7097.80
17908.36 12699.00
21596.95 14068.41
27507.79 25909.54
24276.20 15107.10
As we can see in table no. 4.3 that average total debt of all sampled companies of
steel industry for study period from 2008 to 2013 is Rs. 15107.10 crores. Out of the
sampled companies the highest average debt is borrowed by Tata Steel Ltd. i.e. Rs.
25909.54 crores which is more by 10802.44 crores and approximately 171 % more by
overall average. Apart from it Bhusan steel also have average debt size more than
industry average by Rs. 163.55 crores i.e. 2% more than industry average debt. While
rest of all the companies have average debt size less than that of industry average.
Moreover from the above figures we can also say that there is upward trend on
borrowing debt by steel companies over the years.
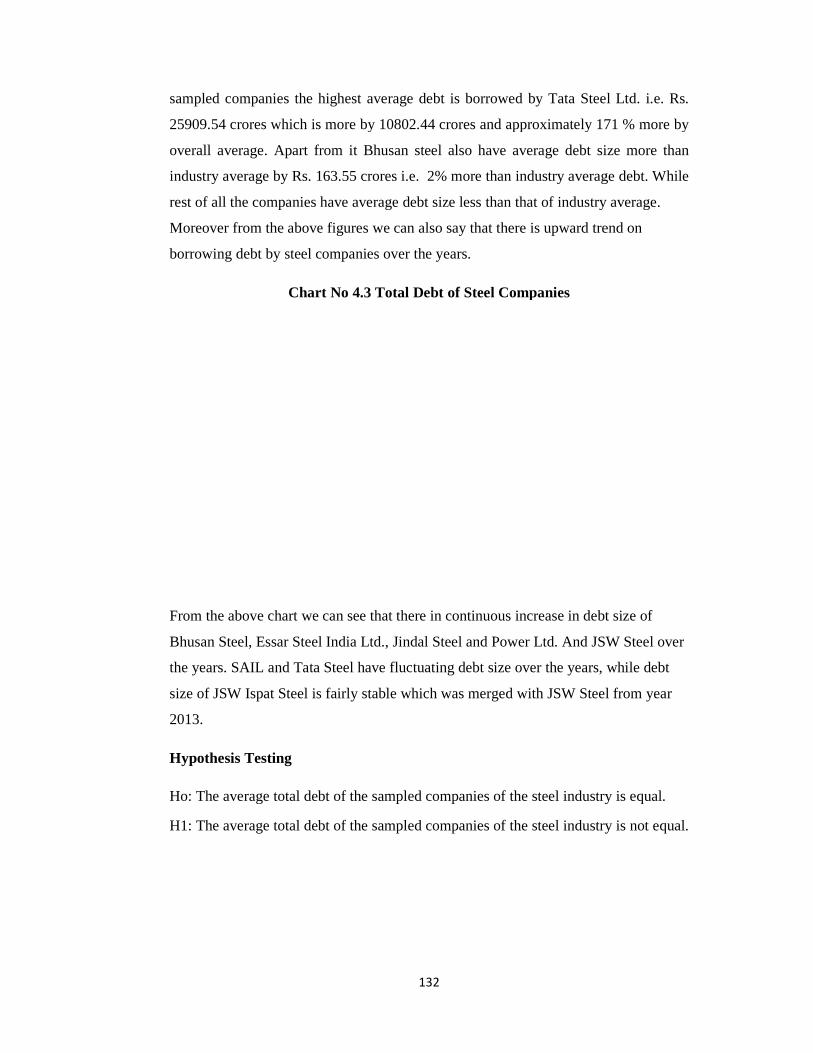
Chart No 4.3 Total Debt of Steel Companies
From the above chart we can see that there in continuous increase in debt size of
Bhusan Steel, Essar Steel India Ltd., Jindal Steel and Power Ltd. And JSW Steel over
the years. SAIL and Tata Steel have fluctuating debt size over the years, while debt
size of JSW Ispat Steel is fairly stable which was merged with JSW Steel from year
2013.
Hypothesis Testing
Ho: The average total debt of the sampled companies of the steel industry
H1: The average total debt of the sampled companies of the steel industry is not equal.
132
pled companies the highest average debt is borrowed by Tata Steel Ltd. i.e. Rs.
25909.54 crores which is more by 10802.44 crores and approximately 171 % more by
overall average. Apart from it Bhusan steel also have average debt size more than
age by Rs. 163.55 crores i.e. 2% more than industry average debt. While
rest of all the companies have average debt size less than that of industry average.
Moreover from the above figures we can also say that there is upward trend on
steel companies over the years.
Chart No 4.3 Total Debt of Steel Companies
From the above chart we can see that there in continuous increase in debt size of
Bhusan Steel, Essar Steel India Ltd., Jindal Steel and Power Ltd. And JSW Steel over
SAIL and Tata Steel have fluctuating debt size over the years, while debt
size of JSW Ispat Steel is fairly stable which was merged with JSW Steel from year
Ho: The average total debt of the sampled companies of the steel industry
H1: The average total debt of the sampled companies of the steel industry is not equal.
pled companies the highest average debt is borrowed by Tata Steel Ltd. i.e. Rs.
25909.54 crores which is more by 10802.44 crores and approximately 171 % more by
overall average. Apart from it Bhusan steel also have average debt size more than
age by Rs. 163.55 crores i.e. 2% more than industry average debt. While
rest of all the companies have average debt size less than that of industry average.
Moreover from the above figures we can also say that there is upward trend on
From the above chart we can see that there in continuous increase in debt size of
Bhusan Steel, Essar Steel India Ltd., Jindal Steel and Power Ltd. And JSW Steel over
SAIL and Tata Steel have fluctuating debt size over the years, while debt
size of JSW Ispat Steel is fairly stable which was merged with JSW Steel from year
Ho: The average total debt of the sampled companies of the steel industry is equal.
H1: The average total debt of the sampled companies of the steel industry is not equal.
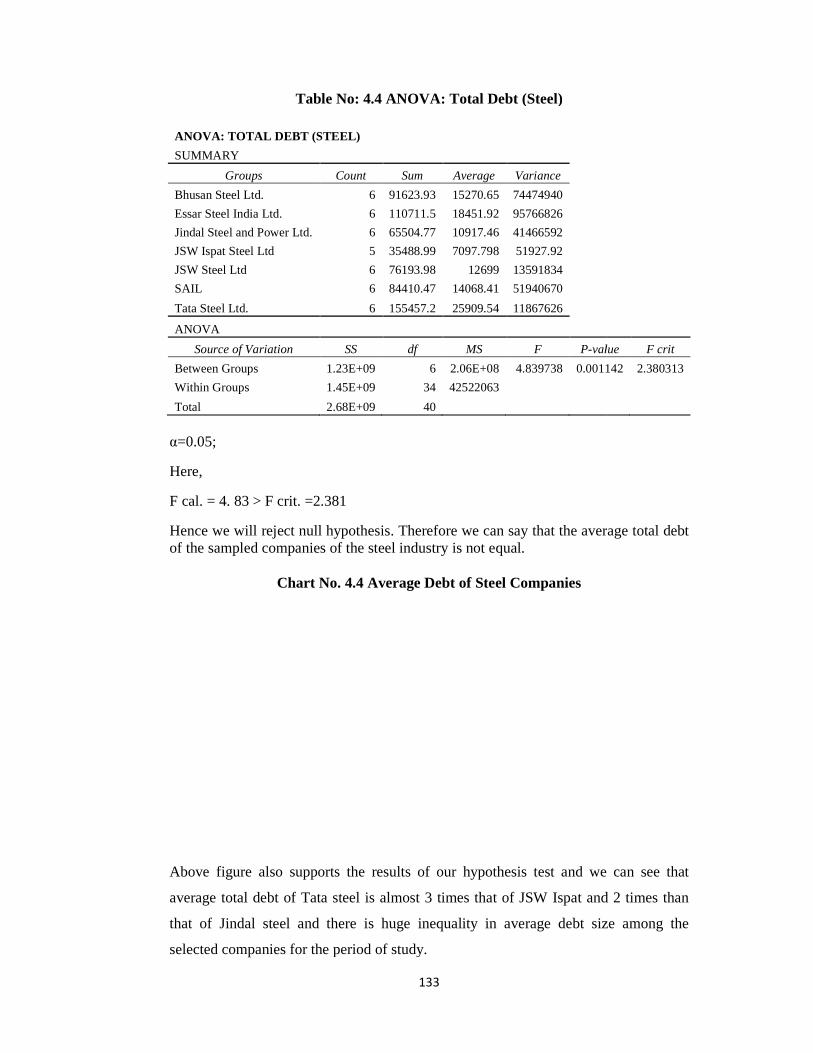
Table No: 4.4 ANOVA: Total Debt (Steel) ANOVA: TOTAL DEBT (STEEL)
SUMMARY
Groups
Bhusan Steel Ltd.
Essar Steel India Ltd.
Jindal Steel and Power Ltd.
JSW Ispat Steel Ltd
JSW Steel Ltd
SAIL
Tata Steel Ltd.
ANOVA
Source of Variation
Between Groups
Within Groups
Total
α=0.05;
Here,
F cal. = 4. 83 > F crit. =2.381
Hence we will reject null hypothesis. Therefore we can say that the average total debt of the sampled companies of the steel industry is not equal.
Chart No. 4.4 Average Debt of Steel Companies
Above figure also supports the results of our hypothesis test and we can see that
average total debt of Tata steel is almost 3 times that of JSW Ispat and 2 times than
that of Jindal steel and there is huge inequality in average debt size among the
selected companies for the period of study.
133
Table No: 4.4 ANOVA: Total Debt (Steel)
ANOVA: TOTAL DEBT (STEEL)
Count Sum Average Variance
6 91623.93 15270.65 74474940
6 110711.5 18451.92 95766826
6 65504.77 10917.46 41466592
5 35488.99 7097.798 51927.92
6 76193.98 12699 13591834
6 84410.47 14068.41 51940670
6 155457.2 25909.54 11867626
SS df MS F P-value
1.23E+09 6 2.06E+08 4.839738 0.001142
1.45E+09 34 42522063 2.68E+09 40
F cal. = 4. 83 > F crit. =2.381
Hence we will reject null hypothesis. Therefore we can say that the average total debt of the sampled companies of the steel industry is not equal.
Chart No. 4.4 Average Debt of Steel Companies
also supports the results of our hypothesis test and we can see that
average total debt of Tata steel is almost 3 times that of JSW Ispat and 2 times than
that of Jindal steel and there is huge inequality in average debt size among the
or the period of study.
value F crit
0.001142 2.380313
Hence we will reject null hypothesis. Therefore we can say that the average total debt
also supports the results of our hypothesis test and we can see that
average total debt of Tata steel is almost 3 times that of JSW Ispat and 2 times than
that of Jindal steel and there is huge inequality in average debt size among the
134
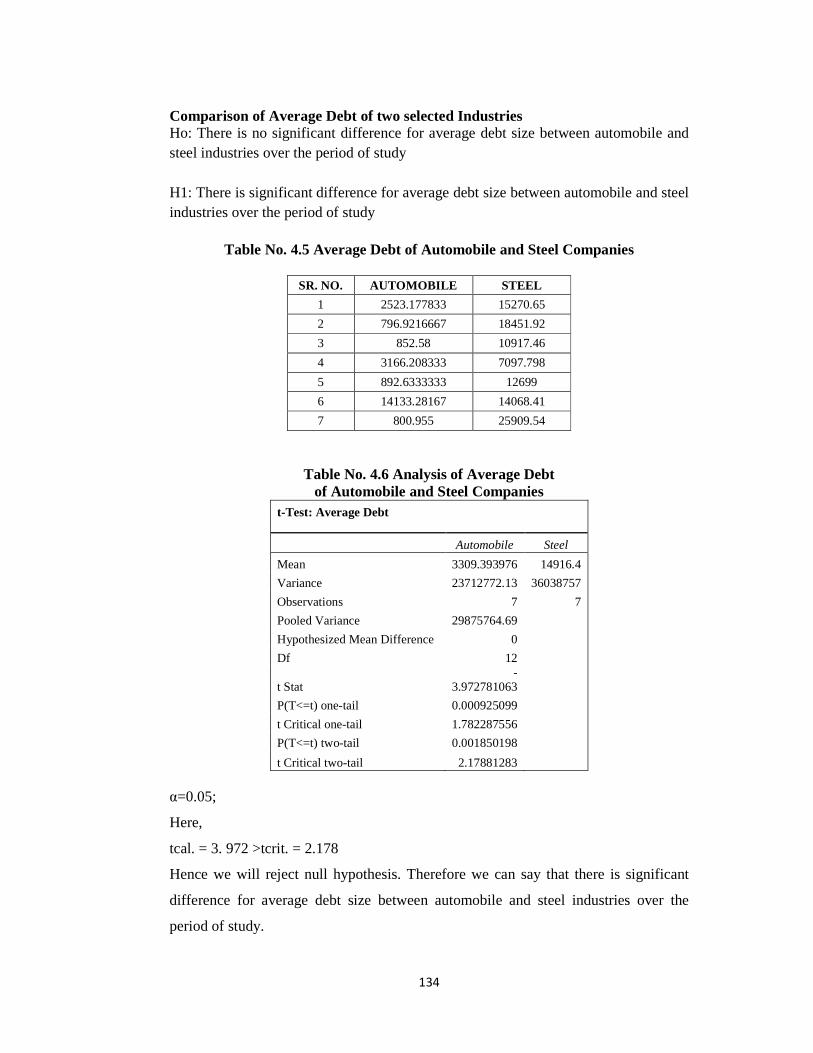
Comparison of Average Debt of two selected Industries Ho: There is no significant difference for average debt size between automobile and steel industries over the period of study H1: There is significant difference for average debt size between automobile and steel industries over the period of study
Table No. 4.5 Average Debt of Automobile and Steel Companies
SR. NO. AUTOMOBILE STEEL
1 2523.177833 15270.65
2 796.9216667 18451.92
3 852.58 10917.46
4 3166.208333 7097.798
5 892.6333333 12699
6 14133.28167 14068.41
7 800.955 25909.54
Table No. 4.6 Analysis of Average Debt of Automobile and Steel Companies
t-Test: Average Debt
Automobile Steel
Mean 3309.393976 14916.4
Variance 23712772.13 36038757
Observations 7 7
Pooled Variance 29875764.69 Hypothesized Mean Difference 0
Df 12
t Stat -
3.972781063
P(T<=t) one-tail 0.000925099 t Critical one-tail 1.782287556
P(T<=t) two-tail 0.001850198 t Critical two-tail 2.17881283
α=0.05;
Here,
tcal. = 3. 972 >tcrit. = 2.178
Hence we will reject null hypothesis. Therefore we can say that there is significant
difference for average debt size between automobile and steel industries over the
period of study.
135
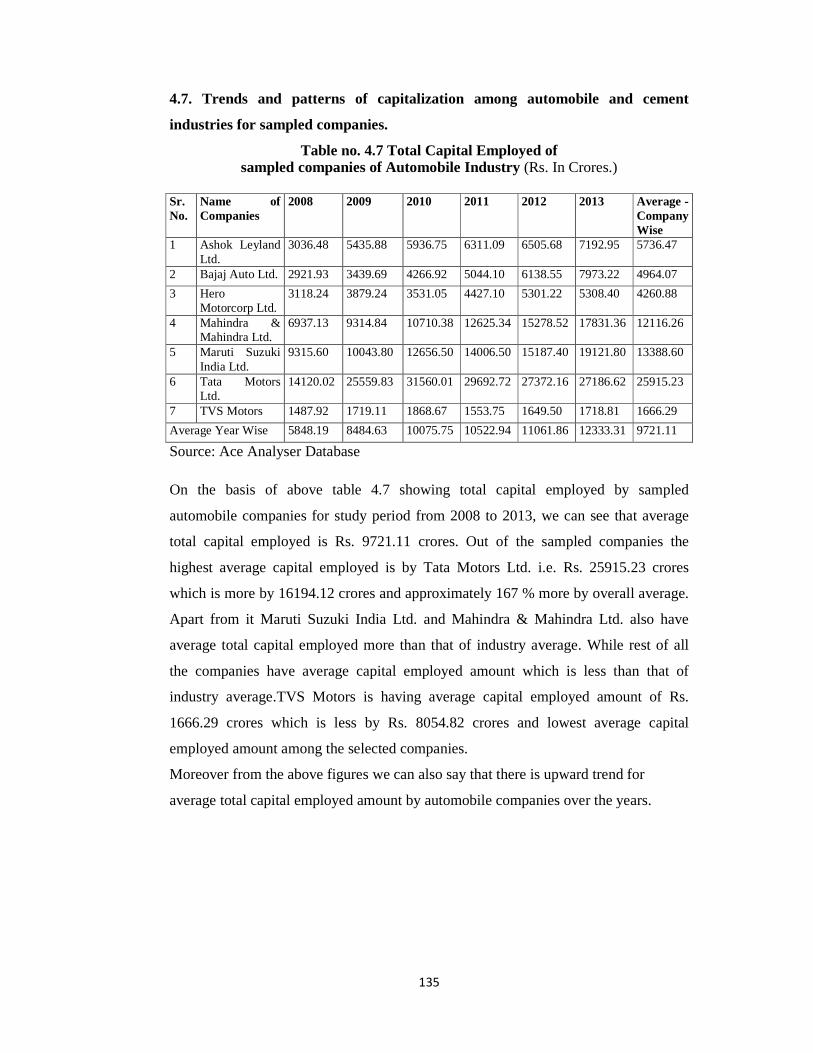
4.7. Trends and patterns of capitalization among automobile and cement
industries for sampled companies.
Table no. 4.7 Total Capital Employed of sampled companies of Automobile Industry (Rs. In Crores.)
Sr. No.
Name of Companies
2008 2009 2010 2011 2012 2013 Average - Company Wise
1 Ashok Leyland Ltd.
3036.48 5435.88 5936.75 6311.09 6505.68 7192.95 5736.47
2 Bajaj Auto Ltd. 2921.93 3439.69 4266.92 5044.10 6138.55 7973.22 4964.07
3 Hero Motorcorp Ltd.
3118.24 3879.24 3531.05 4427.10 5301.22 5308.40 4260.88
4 Mahindra & Mahindra Ltd.
6937.13 9314.84 10710.38 12625.34 15278.52 17831.36 12116.26
5 Maruti Suzuki India Ltd.
9315.60 10043.80 12656.50 14006.50 15187.40 19121.80 13388.60
6 Tata Motors Ltd.
14120.02 25559.83 31560.01 29692.72 27372.16 27186.62 25915.23
7 TVS Motors 1487.92 1719.11 1868.67 1553.75 1649.50 1718.81 1666.29
Average Year Wise 5848.19 8484.63 10075.75 10522.94 11061.86 12333.31 9721.11
Source: Ace Analyser Database
On the basis of above table 4.7 showing total capital employed by sampled
automobile companies for study period from 2008 to 2013, we can see that average
total capital employed is Rs. 9721.11 crores. Out of the sampled companies the
highest average capital employed is by Tata Motors Ltd. i.e. Rs. 25915.23 crores
which is more by 16194.12 crores and approximately 167 % more by overall average.
Apart from it Maruti Suzuki India Ltd. and Mahindra & Mahindra Ltd. also have
average total capital employed more than that of industry average. While rest of all
the companies have average capital employed amount which is less than that of
industry average.TVS Motors is having average capital employed amount of Rs.
1666.29 crores which is less by Rs. 8054.82 crores and lowest average capital
employed amount among the selected companies.
Moreover from the above figures we can also say that there is upward trend for
average total capital employed amount by automobile companies over the years.
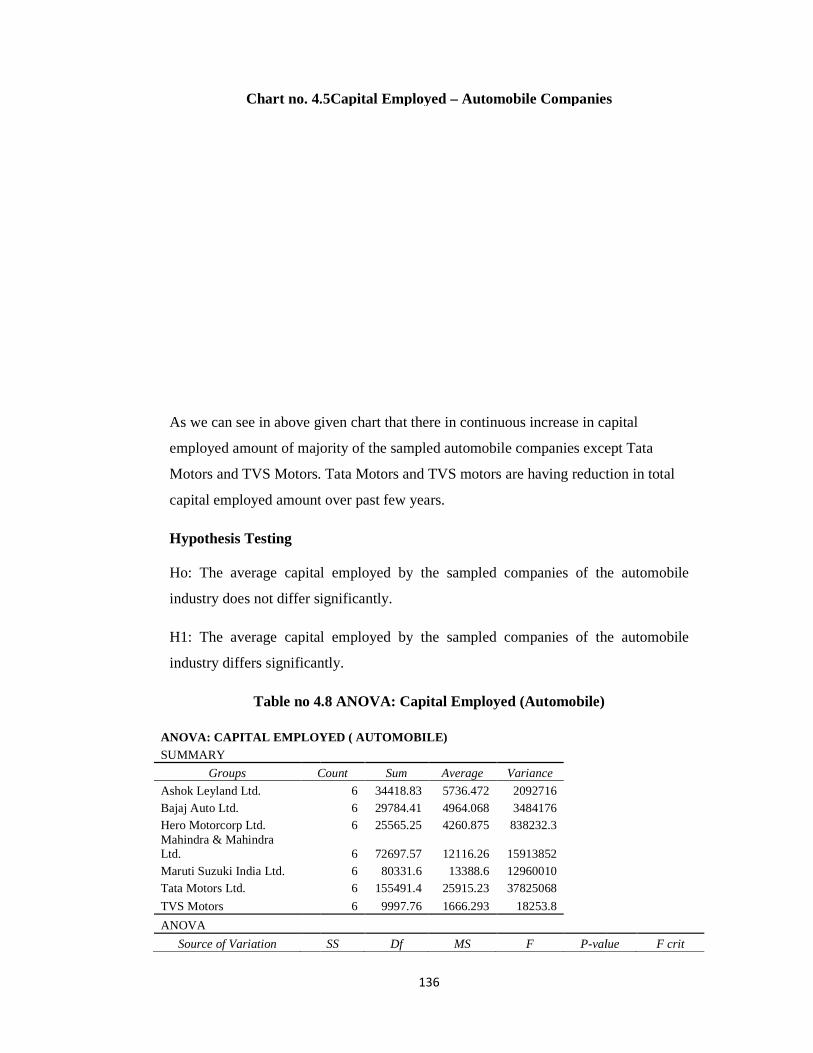
Chart no. 4.5Capital Employed
As we can see in above given chart that there in continuous increase in capital
employed amount of majority of the sampled automobile companies except Tata
Motors and TVS Motors. Tata Motors and TVS motors are having reduction in total
capital employed amount over past few years.
Hypothesis Testing Ho: The average capital employed by
industry does not differ significantly.
H1: The average capital employed by the sampled companies of the automobile
industry differs significantly.
Table no 4.8
ANOVA: CAPITAL E MPLOYED ( AUTOMOBILE)SUMMARY
Groups Count
Ashok Leyland Ltd. Bajaj Auto Ltd. Hero Motorcorp Ltd. Mahindra & Mahindra Ltd. Maruti Suzuki India Ltd. Tata Motors Ltd.
TVS Motors
ANOVA
Source of Variation
136
Chart no. 4.5Capital Employed – Automobile Companies
As we can see in above given chart that there in continuous increase in capital
employed amount of majority of the sampled automobile companies except Tata
Motors and TVS Motors. Tata Motors and TVS motors are having reduction in total
capital employed amount over past few years.
Ho: The average capital employed by the sampled companies of the automobile
industry does not differ significantly.
H1: The average capital employed by the sampled companies of the automobile
industry differs significantly.
Table no 4.8 ANOVA: Capital Employed (Automobile)
MPLOYED ( AUTOMOBILE)
Count Sum Average Variance
6 34418.83 5736.472 2092716 6 29784.41 4964.068 3484176 6 25565.25 4260.875 838232.3
6 72697.57 12116.26 15913852 6 80331.6 13388.6 12960010 6 155491.4 25915.23 37825068
6 9997.76 1666.293 18253.8
SS Df MS F P-value
Automobile Companies
As we can see in above given chart that there in continuous increase in capital
employed amount of majority of the sampled automobile companies except Tata
Motors and TVS Motors. Tata Motors and TVS motors are having reduction in total
the sampled companies of the automobile
H1: The average capital employed by the sampled companies of the automobile
value F crit
Between Groups 2.49E+09Within Groups 3.66E+08Total 2.85E+09
α=0.05;
Here,
Fcal. = 39. 68 > Fcrit. =2.371
Hence we will reject null hypothesis. Therefore we can say that the average capital
employed by the sampled companies of the automobile industry differs significantly.
Chart No. 4.6Average Capital Employed
Above chart showing average capital employed amount by different sampled
automobile company also supports the results o
that average capital employed amount of Tata motors is almost 15 times that of TVS
Motors and 2 times than that of Mahindra and Mahindra. Moreover huge difference is
visible for the average capital employed amount by di
the years.
137
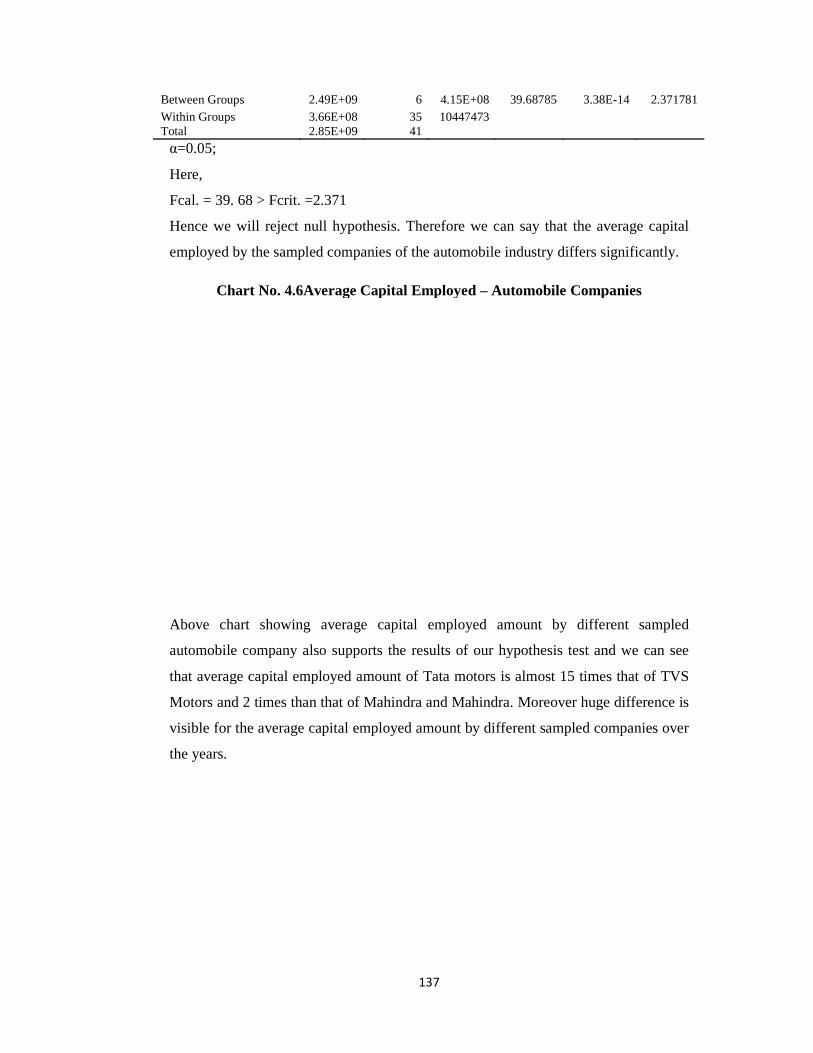
2.49E+09 6 4.15E+08 39.68785 3.38E3.66E+08 35 10447473 2.85E+09 41
Fcal. = 39. 68 > Fcrit. =2.371
Hence we will reject null hypothesis. Therefore we can say that the average capital
the sampled companies of the automobile industry differs significantly.
Chart No. 4.6Average Capital Employed – Automobile Companies
Above chart showing average capital employed amount by different sampled
automobile company also supports the results of our hypothesis test and we can see
that average capital employed amount of Tata motors is almost 15 times that of TVS
Motors and 2 times than that of Mahindra and Mahindra. Moreover huge difference is
visible for the average capital employed amount by different sampled companies over
3.38E-14 2.371781
Hence we will reject null hypothesis. Therefore we can say that the average capital
the sampled companies of the automobile industry differs significantly.
Automobile Companies
Above chart showing average capital employed amount by different sampled
f our hypothesis test and we can see
that average capital employed amount of Tata motors is almost 15 times that of TVS
Motors and 2 times than that of Mahindra and Mahindra. Moreover huge difference is
fferent sampled companies over

138
Table No. 4.9 Total Capital Employed of Sampled companies of Steel Industry (Rs. In Crores.)
Sr No
Name of Companies
2008 2009 2010 2011 2012 2013 Average - Company Wise
1 Bhusan Steel Ltd. 7343.46 10500.89 15395.78 16865.75 23308.15 30712.31 17354.39
2 Essar Steel India Ltd.
10892.47 12252.12 27316.80 25138.72 25718.00 29921.43 21873.26
3 Jindal Steel and Power Ltd.
7619.73 10377.97 15129.26 16049.05 19339.33 24208.99 15454.06
4 JSW Ispat Steel Ltd
3186.60 2237.06 1605.54 2057.68 7216.29 -------- 3260.63
5 JSW Steel Ltd 15223.78 19231.88 21291.44 26093.17 30025.58 35371.63 24539.58
6 SAIL 26108.81 35711.05 49827.95 46122.03 51397.98 54510.19 43946.34
7 Tata Steel Ltd. 81408.60 58156.04 63365.11 72943.68 76249.56 46393.72 66419.45
Average - Year Wise 21683.35 21209.57 27704.55 29324.30 33322.13 36853.05 27549.67
Source: Ace Analyser Database
As we can see in table no. 4.9 that average total capital employed of sampled steel
companies for the period of study is Rs. 27549.67 crores. Out of the sampled
companies the highest average capital employed is by Tata Steel Ltd. i.e. Rs.
66419.45 crores which is more by Rs. 38869.78 crores and approximately 141 %
more by overall average. Apart from it SAIL also have average total capital employed
of Rs. 43946.34 crores which is more than that of industry average by Rs. 16396.67
crores. While rest of all the companies have average capital employed amount which
is less than that of industry average.JSW Ispat Steel Ltd. is having average capital
employed amount of Rs. 3260.63 crores which lowest average capital employed
amount among the selected companies.
Moreover from the above figures, we can also observe that except year 2009 there is
constant increase in average capital employed by sampled companies each year. So,
we can say that there is upward trend for average total capital employed amount by
steel companies over the years.
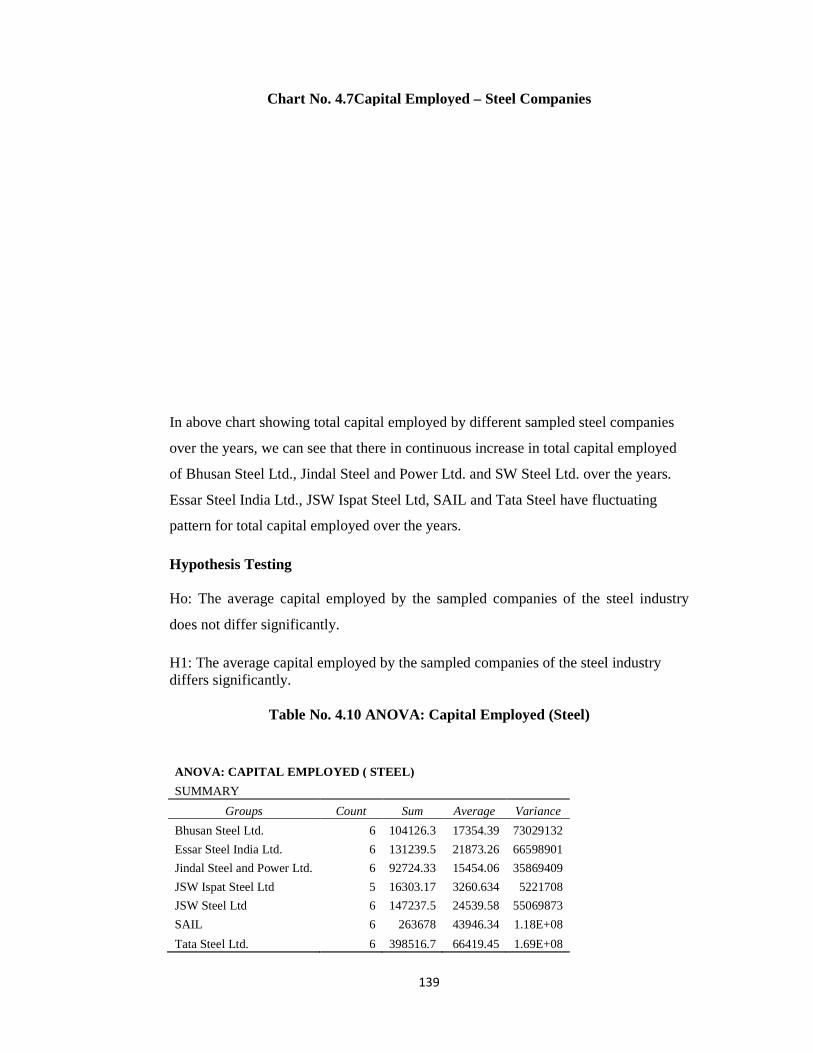
Chart No. 4.7Capital Employed
In above chart showing total capital employed by different sampled steel companies
over the years, we can see that there in continuous increase in total capital employed
of Bhusan Steel Ltd., Jindal Steel and Power Ltd. and SW Steel Ltd. over the years.
Essar Steel India Ltd., JSW Ispat Steel Ltd, SAIL and Tata Steel have fluctuating
pattern for total capital employed over the years.
Hypothesis Testing Ho: The average capital employed by the sampled companies of the steel industry
does not differ significantly.
H1: The average capital employed by the sampled companies of the steel industry differs significantly.
Table No. 4.10
ANOVA: CAPITAL EMPLOYED ( STEEL)
SUMMARY
Groups
Bhusan Steel Ltd.
Essar Steel India Ltd.
Jindal Steel and Power Ltd.
JSW Ispat Steel Ltd
JSW Steel Ltd
SAIL
Tata Steel Ltd.
139
Chart No. 4.7Capital Employed – Steel Companies
total capital employed by different sampled steel companies
over the years, we can see that there in continuous increase in total capital employed
of Bhusan Steel Ltd., Jindal Steel and Power Ltd. and SW Steel Ltd. over the years.
SW Ispat Steel Ltd, SAIL and Tata Steel have fluctuating
pattern for total capital employed over the years.
Ho: The average capital employed by the sampled companies of the steel industry
does not differ significantly.
apital employed by the sampled companies of the steel industry
Table No. 4.10 ANOVA: Capital Employed (Steel)
ANOVA: CAPITAL EMPLOYED ( STEEL)
Count Sum Average Variance 6 104126.3 17354.39 73029132
6 131239.5 21873.26 66598901
6 92724.33 15454.06 35869409
5 16303.17 3260.634 5221708
6 147237.5 24539.58 55069873
6 263678 43946.34 1.18E+08
6 398516.7 66419.45 1.69E+08
total capital employed by different sampled steel companies
over the years, we can see that there in continuous increase in total capital employed
of Bhusan Steel Ltd., Jindal Steel and Power Ltd. and SW Steel Ltd. over the years.
SW Ispat Steel Ltd, SAIL and Tata Steel have fluctuating
Ho: The average capital employed by the sampled companies of the steel industry
apital employed by the sampled companies of the steel industry
ANOVA
Source of Variation
Between Groups
Within Groups
Total
α=0.05;
Here,
Fcal. = 33.37 > Fcrit. =2.38
Hence we will reject null hypothesis. Therefore we can say that the average capital
employed by the sampled companies of the steel industry differs significantly.
Chart No 4.8Average Capital Employed
Above chart showing average capital employed amount by different sampled steel
company also supports the results of our hypothesis test and we can see that average
capital employed amount of Tata steel is almost 20 times that of JSW Ispat Steel Ltd.
and more than 2 times for rest of all the companies except SAIL. Moreover huge
difference is visible for the average capital employed amount by different sampled
companies over the years.
140
SS Df MS F P-value
1.54E+10 6 2.56E+09 33.37165 7.18E-
2.61E+09 34 76725993
1.8E+10 40
Fcal. = 33.37 > Fcrit. =2.38
Hence we will reject null hypothesis. Therefore we can say that the average capital
employed by the sampled companies of the steel industry differs significantly.
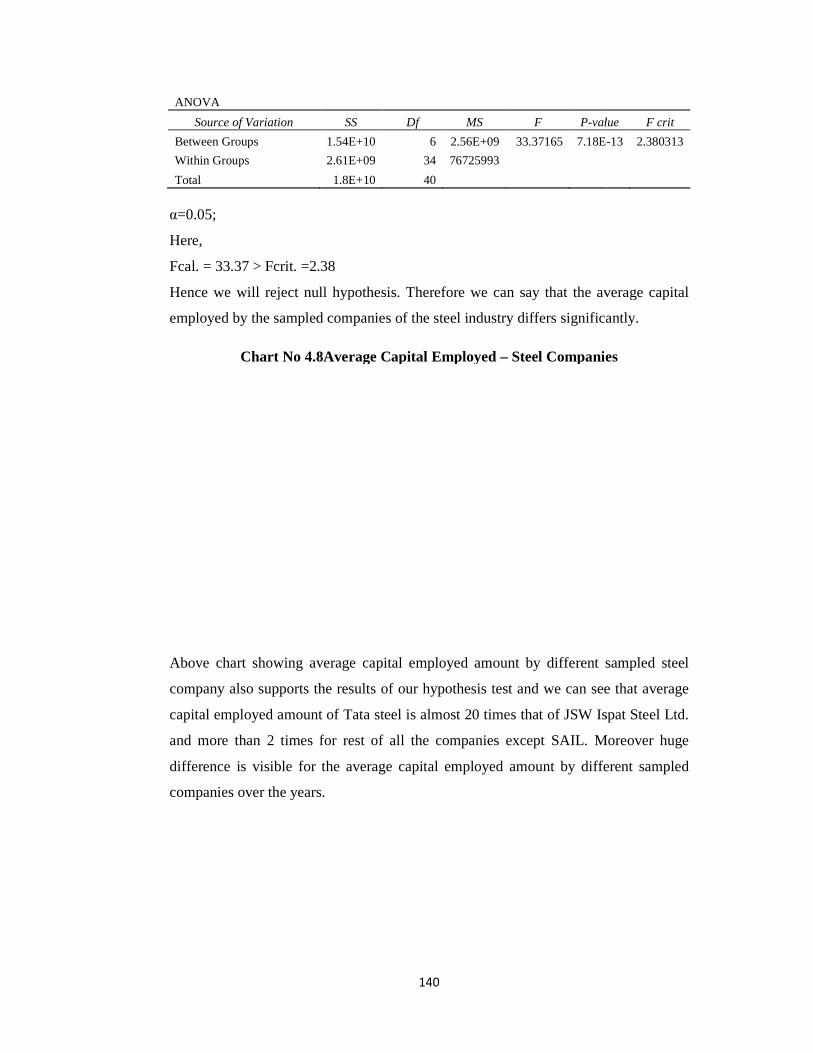
Chart No 4.8Average Capital Employed – Steel Companies
Above chart showing average capital employed amount by different sampled steel
company also supports the results of our hypothesis test and we can see that average
capital employed amount of Tata steel is almost 20 times that of JSW Ispat Steel Ltd.
ore than 2 times for rest of all the companies except SAIL. Moreover huge
difference is visible for the average capital employed amount by different sampled
companies over the years.
value F crit
-13 2.380313
Hence we will reject null hypothesis. Therefore we can say that the average capital
employed by the sampled companies of the steel industry differs significantly.
Steel Companies
Above chart showing average capital employed amount by different sampled steel
company also supports the results of our hypothesis test and we can see that average
capital employed amount of Tata steel is almost 20 times that of JSW Ispat Steel Ltd.
ore than 2 times for rest of all the companies except SAIL. Moreover huge
difference is visible for the average capital employed amount by different sampled
141
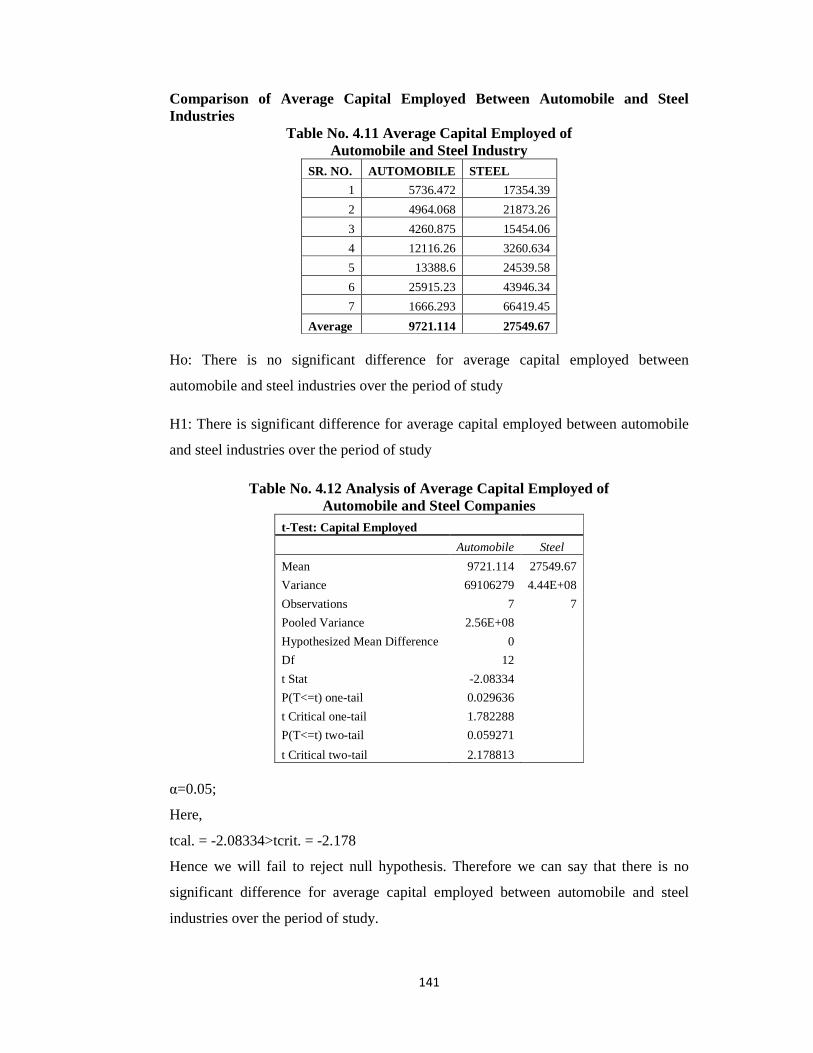
Comparison of Average Capital Employed Between Automobile and Steel Industries
Table No. 4.11 Average Capital Employed of Automobile and Steel Industry
SR. NO. AUTOMOBILE STEEL
1 5736.472 17354.39
2 4964.068 21873.26
3 4260.875 15454.06
4 12116.26 3260.634
5 13388.6 24539.58
6 25915.23 43946.34
7 1666.293 66419.45
Average 9721.114 27549.67
Ho: There is no significant difference for average capital employed between
automobile and steel industries over the period of study
H1: There is significant difference for average capital employed between automobile
and steel industries over the period of study
Table No. 4.12 Analysis of Average Capital Employed of Automobile and Steel Companies
t-Test: Capital Employed
Automobile Steel
Mean 9721.114 27549.67
Variance 69106279 4.44E+08
Observations 7 7
Pooled Variance 2.56E+08
Hypothesized Mean Difference 0
Df 12
t Stat -2.08334
P(T<=t) one-tail 0.029636
t Critical one-tail 1.782288
P(T<=t) two-tail 0.059271
t Critical two-tail 2.178813 α=0.05;
Here,
tcal. = -2.08334>tcrit. = -2.178
Hence we will fail to reject null hypothesis. Therefore we can say that there is no
significant difference for average capital employed between automobile and steel
industries over the period of study.
142
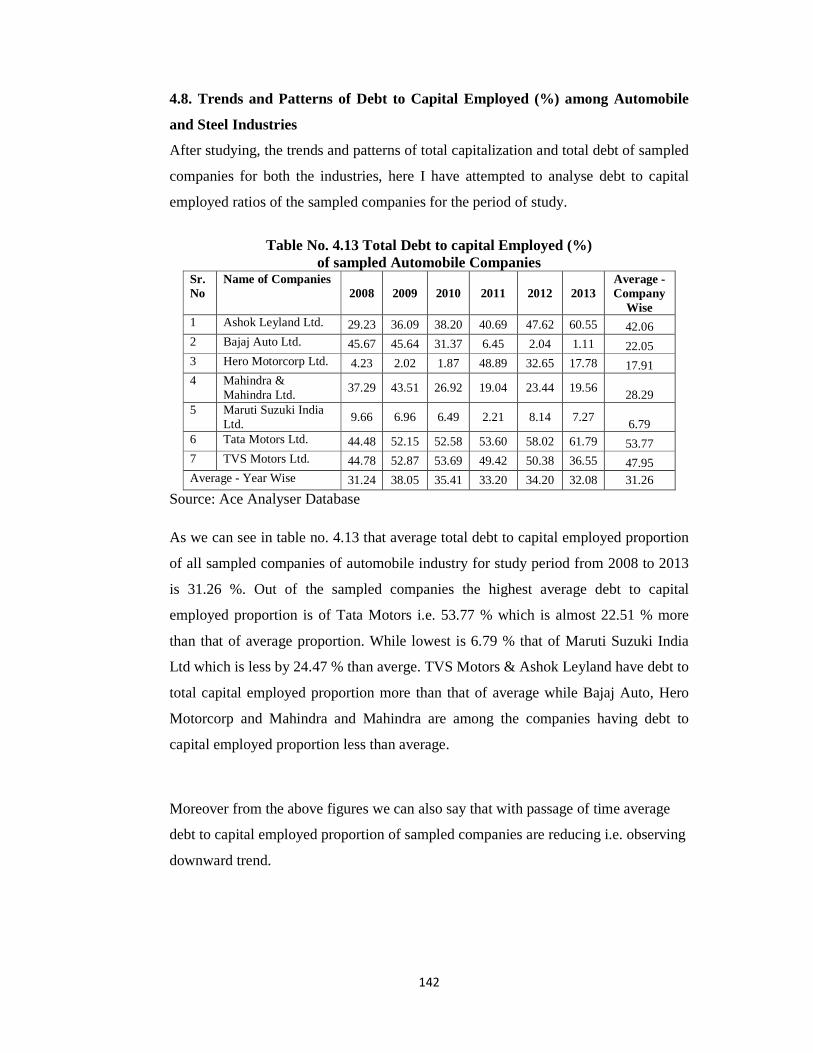
4.8. Trends and Patterns of Debt to Capital Employed (%) among Automobile
and Steel Industries
After studying, the trends and patterns of total capitalization and total debt of sampled
companies for both the industries, here I have attempted to analyse debt to capital
employed ratios of the sampled companies for the period of study.
Table No. 4.13 Total Debt to capital Employed (%)
of sampled Automobile Companies Sr. No
Name of Companies 2008 2009 2010 2011 2012 2013
Average - Company
Wise 1 Ashok Leyland Ltd. 29.23 36.09 38.20 40.69 47.62 60.55 42.06 2 Bajaj Auto Ltd. 45.67 45.64 31.37 6.45 2.04 1.11 22.05 3 Hero Motorcorp Ltd. 4.23 2.02 1.87 48.89 32.65 17.78 17.91 4 Mahindra &
Mahindra Ltd. 37.29 43.51 26.92 19.04 23.44 19.56
28.29 5 Maruti Suzuki India
Ltd. 9.66 6.96 6.49 2.21 8.14 7.27
6.79 6 Tata Motors Ltd. 44.48 52.15 52.58 53.60 58.02 61.79 53.77 7 TVS Motors Ltd. 44.78 52.87 53.69 49.42 50.38 36.55 47.95 Average - Year Wise 31.24 38.05 35.41 33.20 34.20 32.08 31.26
Source: Ace Analyser Database
As we can see in table no. 4.13 that average total debt to capital employed proportion
of all sampled companies of automobile industry for study period from 2008 to 2013
is 31.26 %. Out of the sampled companies the highest average debt to capital
employed proportion is of Tata Motors i.e. 53.77 % which is almost 22.51 % more
than that of average proportion. While lowest is 6.79 % that of Maruti Suzuki India
Ltd which is less by 24.47 % than averge. TVS Motors & Ashok Leyland have debt to
total capital employed proportion more than that of average while Bajaj Auto, Hero
Motorcorp and Mahindra and Mahindra are among the companies having debt to
capital employed proportion less than average.
Moreover from the above figures we can also say that with passage of time average
debt to capital employed proportion of sampled companies are reducing i.e. observing
downward trend.
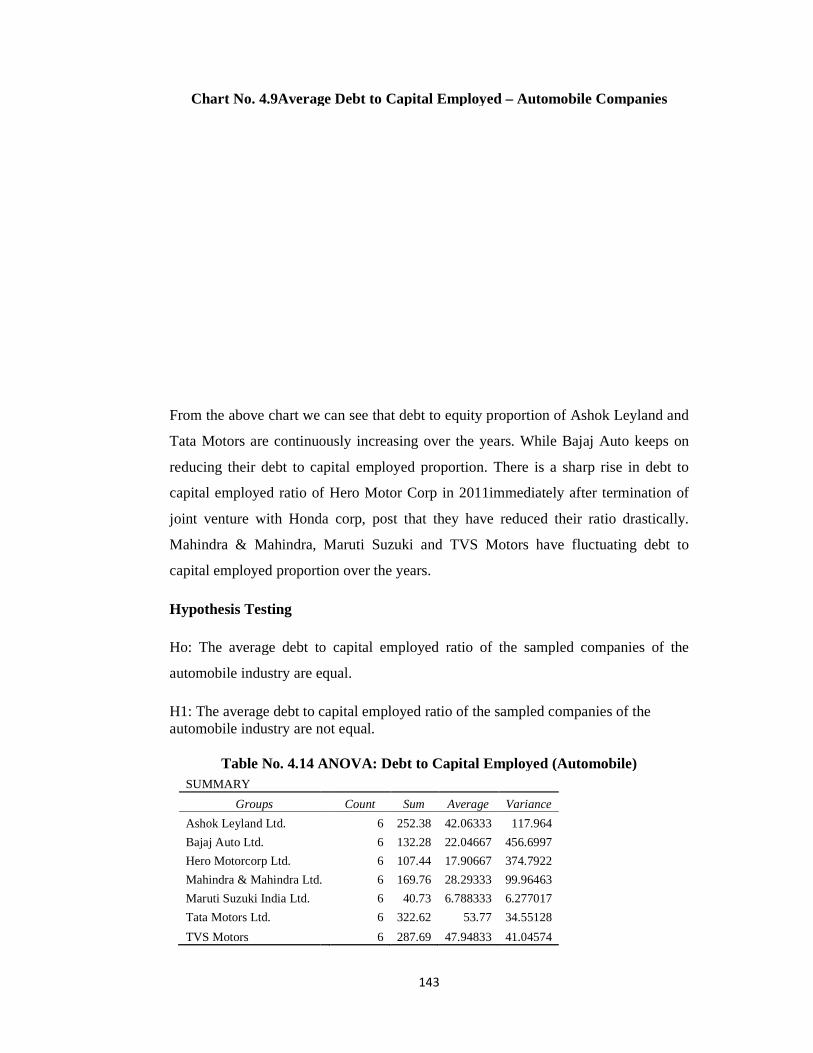
Chart No. 4.9Average Debt to Capital Employed
From the above chart we can see that debt to equity proportion of Ashok Leyland and
Tata Motors are continuously increasing
reducing their debt to capital employed proportion. There is a sharp rise in debt to
capital employed ratio of Hero Motor Corp in 2011immediately after termination of
joint venture with Honda corp, post that they h
Mahindra & Mahindra, Maruti Suzuki and TVS Motors have fluctuating debt to
capital employed proportion over the years.
Hypothesis Testing
Ho: The average debt to capital employed ratio of the sampled companies of the
automobile industry are equal.
H1: The average debt to capital employed ratio of the sampled companies of the automobile industry are not equal.
Table No. 4.14 ANOVA: Debt to Capital EmployedSUMMARY
Groups
Ashok Leyland Ltd.
Bajaj Auto Ltd.
Hero Motorcorp Ltd.
Mahindra & Mahindra Ltd.
Maruti Suzuki India Ltd.
Tata Motors Ltd.
TVS Motors
143
Chart No. 4.9Average Debt to Capital Employed – Automobile Companies
From the above chart we can see that debt to equity proportion of Ashok Leyland and
Tata Motors are continuously increasing over the years. While Bajaj Auto keeps on
reducing their debt to capital employed proportion. There is a sharp rise in debt to
capital employed ratio of Hero Motor Corp in 2011immediately after termination of
joint venture with Honda corp, post that they have reduced their ratio drastically.
Mahindra & Mahindra, Maruti Suzuki and TVS Motors have fluctuating debt to
capital employed proportion over the years.
Ho: The average debt to capital employed ratio of the sampled companies of the
tomobile industry are equal.
to capital employed ratio of the sampled companies of the automobile industry are not equal.
ANOVA: Debt to Capital Employed (Automobile)
Count Sum Average Variance 6 252.38 42.06333 117.964
6 132.28 22.04667 456.6997
6 107.44 17.90667 374.7922
Mahindra & Mahindra Ltd. 6 169.76 28.29333 99.96463
6 40.73 6.788333 6.277017
6 322.62 53.77 34.55128
6 287.69 47.94833 41.04574
Automobile Companies
From the above chart we can see that debt to equity proportion of Ashok Leyland and
over the years. While Bajaj Auto keeps on
reducing their debt to capital employed proportion. There is a sharp rise in debt to
capital employed ratio of Hero Motor Corp in 2011immediately after termination of
ave reduced their ratio drastically.
Mahindra & Mahindra, Maruti Suzuki and TVS Motors have fluctuating debt to
Ho: The average debt to capital employed ratio of the sampled companies of the
to capital employed ratio of the sampled companies of the
(Automobile)
ANOVA
Source of Variation
Between Groups
Within Groups
Total
α=0.05;
Here,
Fcal. = 10.9692 >Fcrit. =2.371
Hence we will reject null hypothesis. Therefore we can say that the average debts to
capital employed ratio of the sampled companies of the automobile industry are not
equal.
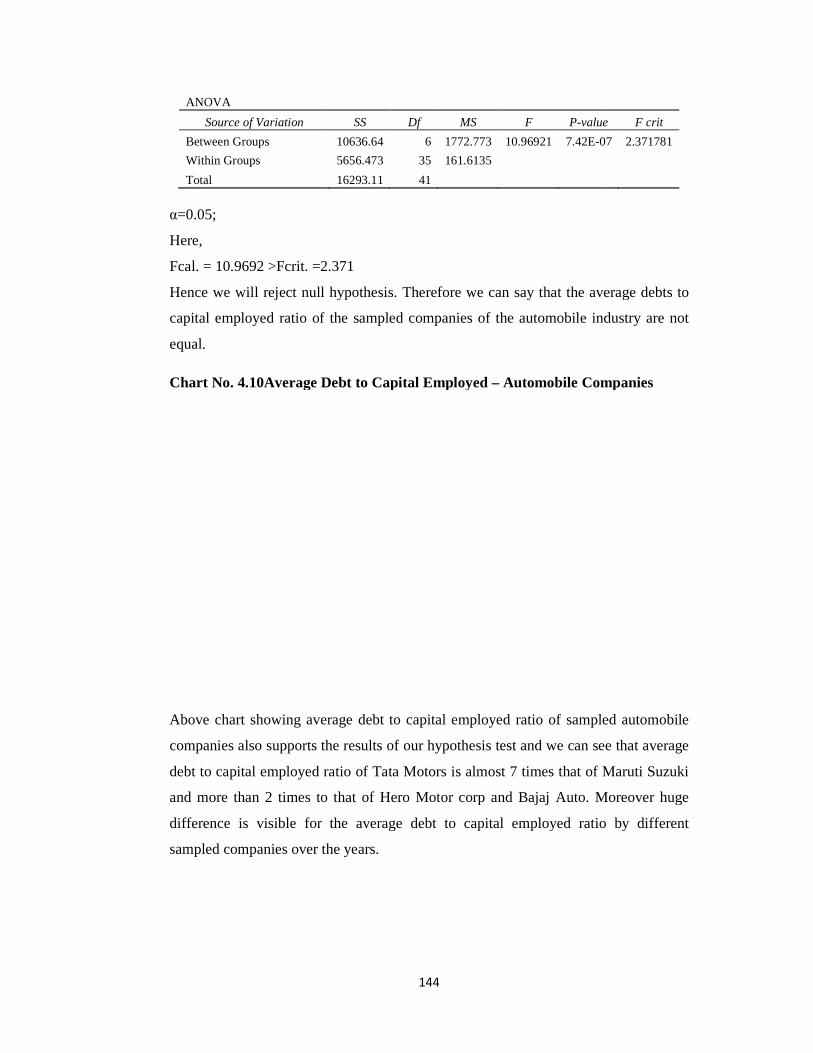
Chart No. 4.10Average Debt to Capital Employed
Above chart showing average debt to capital employed ratio of sampled automobile
companies also supports the results of our hypothesis test and we can see that average
debt to capital employed
and more than 2 times to that of Hero Motor corp and Bajaj Auto. Moreover huge
difference is visible for the average debt to capital employed ratio by different
sampled companies over the years.
144
SS Df MS F P-value
10636.64 6 1772.773 10.96921 7.42E-07
5656.473 35 161.6135
16293.11 41
Fcal. = 10.9692 >Fcrit. =2.371
Hence we will reject null hypothesis. Therefore we can say that the average debts to
capital employed ratio of the sampled companies of the automobile industry are not
4.10Average Debt to Capital Employed – Automobile Companies
Above chart showing average debt to capital employed ratio of sampled automobile
companies also supports the results of our hypothesis test and we can see that average
ratio of Tata Motors is almost 7 times that of Maruti Suzuki
and more than 2 times to that of Hero Motor corp and Bajaj Auto. Moreover huge
difference is visible for the average debt to capital employed ratio by different
sampled companies over the years.
value F crit
07 2.371781
Hence we will reject null hypothesis. Therefore we can say that the average debts to
capital employed ratio of the sampled companies of the automobile industry are not
Automobile Companies
Above chart showing average debt to capital employed ratio of sampled automobile
companies also supports the results of our hypothesis test and we can see that average
ratio of Tata Motors is almost 7 times that of Maruti Suzuki
and more than 2 times to that of Hero Motor corp and Bajaj Auto. Moreover huge
difference is visible for the average debt to capital employed ratio by different
145
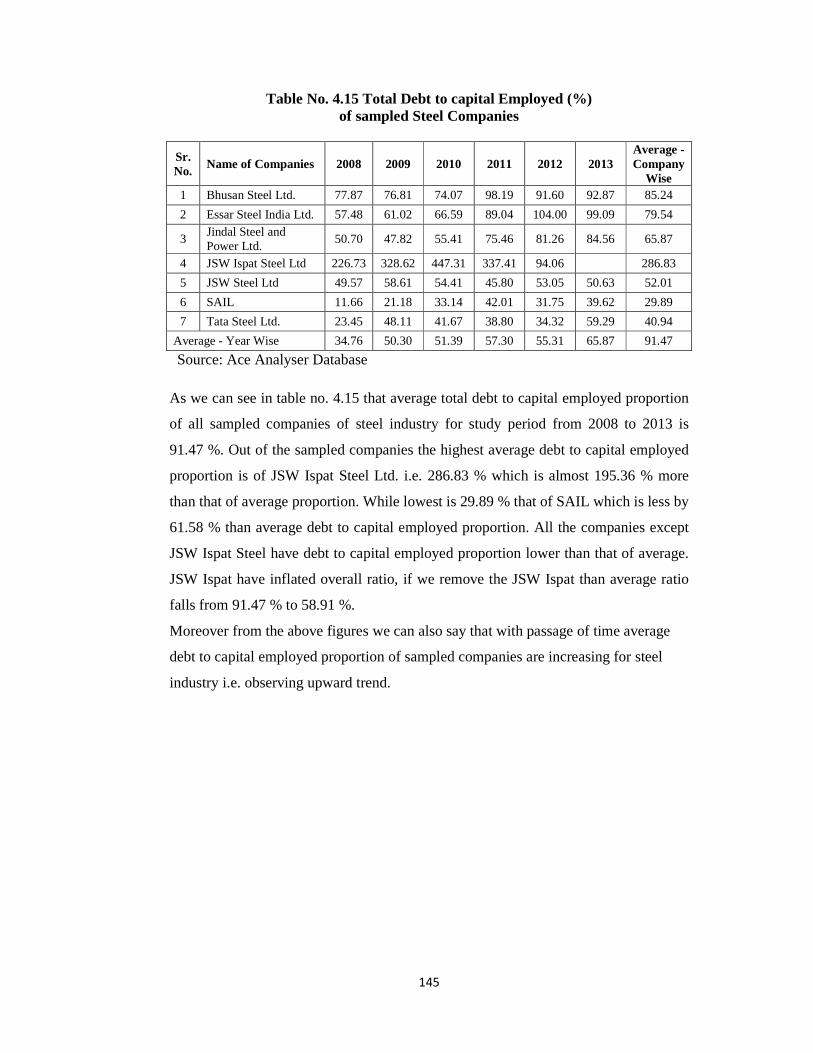
Table No. 4.15 Total Debt to capital Employed (%) of sampled Steel Companies
Sr. No.
Name of Companies 2008 2009 2010 2011 2012 2013 Average - Company
Wise 1 Bhusan Steel Ltd. 77.87 76.81 74.07 98.19 91.60 92.87 85.24
2 Essar Steel India Ltd. 57.48 61.02 66.59 89.04 104.00 99.09 79.54
3 Jindal Steel and Power Ltd.
50.70 47.82 55.41 75.46 81.26 84.56 65.87
4 JSW Ispat Steel Ltd 226.73 328.62 447.31 337.41 94.06
286.83
5 JSW Steel Ltd 49.57 58.61 54.41 45.80 53.05 50.63 52.01
6 SAIL 11.66 21.18 33.14 42.01 31.75 39.62 29.89
7 Tata Steel Ltd. 23.45 48.11 41.67 38.80 34.32 59.29 40.94
Average - Year Wise 34.76 50.30 51.39 57.30 55.31 65.87 91.47
Source: Ace Analyser Database
As we can see in table no. 4.15 that average total debt to capital employed proportion
of all sampled companies of steel industry for study period from 2008 to 2013 is
91.47 %. Out of the sampled companies the highest average debt to capital employed
proportion is of JSW Ispat Steel Ltd. i.e. 286.83 % which is almost 195.36 % more
than that of average proportion. While lowest is 29.89 % that of SAIL which is less by
61.58 % than average debt to capital employed proportion. All the companies except
JSW Ispat Steel have debt to capital employed proportion lower than that of average.
JSW Ispat have inflated overall ratio, if we remove the JSW Ispat than average ratio
falls from 91.47 % to 58.91 %.
Moreover from the above figures we can also say that with passage of time average
debt to capital employed proportion of sampled companies are increasing for steel
industry i.e. observing upward trend.
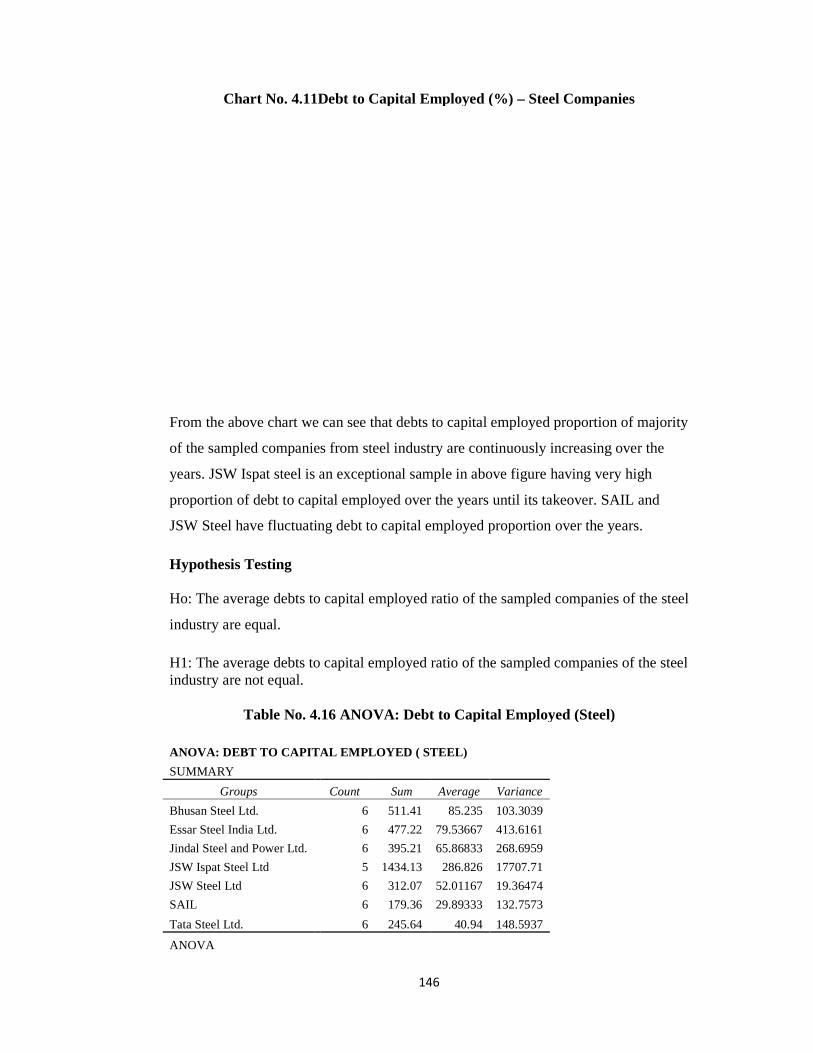
Chart No. 4.11Debt to Capital Employed (%)
From the above chart we can see that debts to capital employed proportion of majority
of the sampled companies
years. JSW Ispat steel is an exceptional sample in above figure having very high
proportion of debt to capital employed over the years until its takeover. SAIL and
JSW Steel have fluctuating debt to
Hypothesis Testing Ho: The average debts to capital employed ratio of the sampled companies of the steel
industry are equal.
H1: The average debts to capital employed ratio of the sampled companies of the steelindustry are not equal.
Table No. 4.16
ANOVA: DEBT TO CAPITAL EMPLOYED ( STEEL)
SUMMARY
Groups
Bhusan Steel Ltd.
Essar Steel India Ltd.
Jindal Steel and Power Ltd.
JSW Ispat Steel Ltd
JSW Steel Ltd
SAIL
Tata Steel Ltd.
ANOVA
146
Chart No. 4.11Debt to Capital Employed (%) – Steel Companies
From the above chart we can see that debts to capital employed proportion of majority
of the sampled companies from steel industry are continuously increasing over the
years. JSW Ispat steel is an exceptional sample in above figure having very high
proportion of debt to capital employed over the years until its takeover. SAIL and
JSW Steel have fluctuating debt to capital employed proportion over the years.
Ho: The average debts to capital employed ratio of the sampled companies of the steel
H1: The average debts to capital employed ratio of the sampled companies of the steel
Table No. 4.16 ANOVA: Debt to Capital Employed (Steel)
ANOVA: DEBT TO CAPITAL EMPLOYED ( STEEL)
Count Sum Average Variance 6 511.41 85.235 103.3039
6 477.22 79.53667 413.6161
6 395.21 65.86833 268.6959 5 1434.13 286.826 17707.71
6 312.07 52.01167 19.36474 6 179.36 29.89333 132.7573
6 245.64 40.94 148.5937
Steel Companies
From the above chart we can see that debts to capital employed proportion of majority
from steel industry are continuously increasing over the
years. JSW Ispat steel is an exceptional sample in above figure having very high
proportion of debt to capital employed over the years until its takeover. SAIL and
capital employed proportion over the years.
Ho: The average debts to capital employed ratio of the sampled companies of the steel
H1: The average debts to capital employed ratio of the sampled companies of the steel
ANOVA: Debt to Capital Employed (Steel)
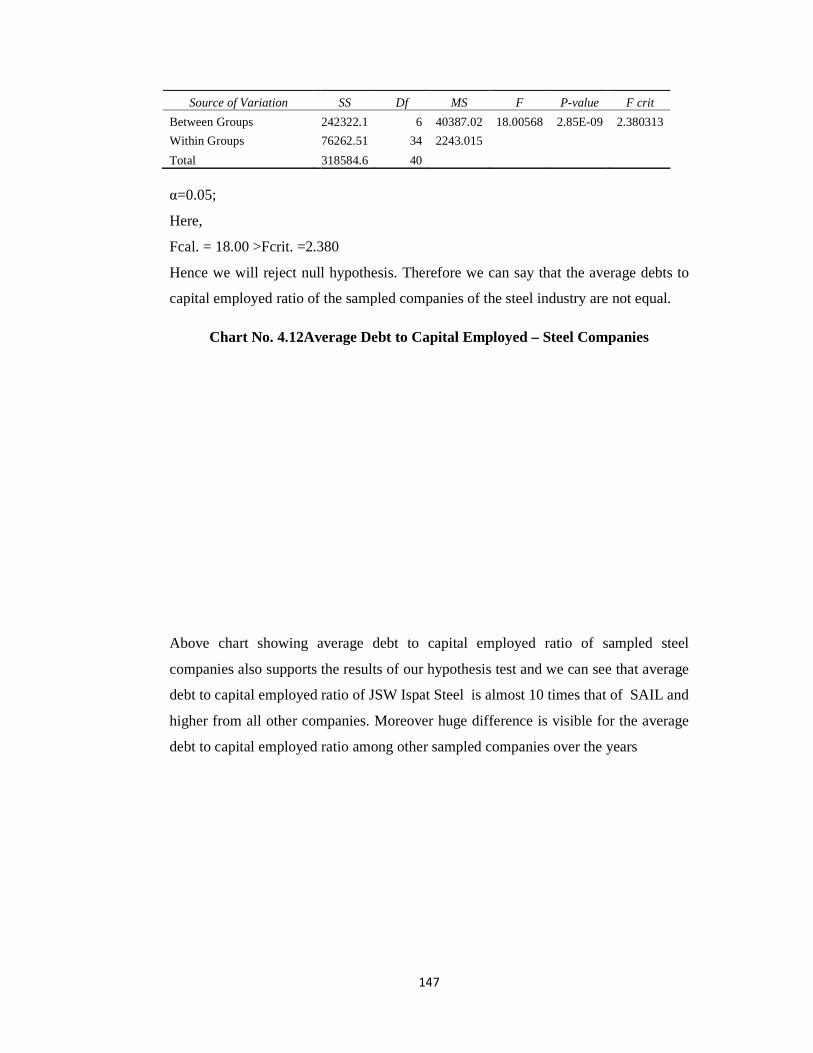
Source of Variation
Between Groups
Within Groups
Total
α=0.05;
Here,
Fcal. = 18.00 >Fcrit. =2.380
Hence we will reject null
capital employed ratio of the sampled companies of the steel industry are not equal.
Chart No. 4.12Average Debt to Capital Employed
Above chart showing average debt to capital
companies also supports the results of our hypothesis test and we can see that average
debt to capital employed ratio of JSW Ispat Steel is almost 10 times that of SAIL and
higher from all other companies. Moreover huge di
debt to capital employed ratio among other sampled companies over the years
147
SS Df MS F P-value
242322.1 6 40387.02 18.00568 2.85E-09
76262.51 34 2243.015
318584.6 40
Fcal. = 18.00 >Fcrit. =2.380
Hence we will reject null hypothesis. Therefore we can say that the average debts to
capital employed ratio of the sampled companies of the steel industry are not equal.
Chart No. 4.12Average Debt to Capital Employed – Steel Companies
Above chart showing average debt to capital employed ratio of sampled steel
companies also supports the results of our hypothesis test and we can see that average
debt to capital employed ratio of JSW Ispat Steel is almost 10 times that of SAIL and
higher from all other companies. Moreover huge difference is visible for the average
debt to capital employed ratio among other sampled companies over the years
F crit
2.380313
hypothesis. Therefore we can say that the average debts to
capital employed ratio of the sampled companies of the steel industry are not equal.
Steel Companies
employed ratio of sampled steel
companies also supports the results of our hypothesis test and we can see that average
debt to capital employed ratio of JSW Ispat Steel is almost 10 times that of SAIL and
fference is visible for the average
debt to capital employed ratio among other sampled companies over the years
148
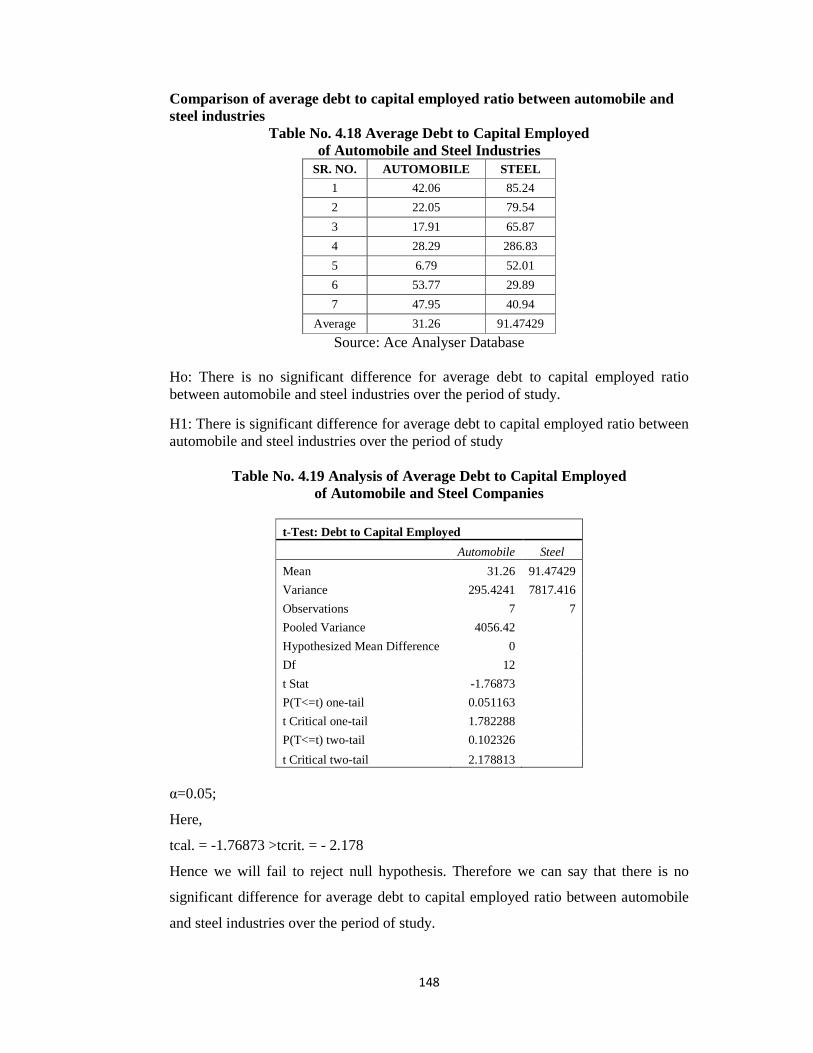
Comparison of average debt to capital employed ratio between automobile and steel industries
Table No. 4.18 Average Debt to Capital Employed of Automobile and Steel Industries
SR. NO. AUTOMOBILE STEEL
1 42.06 85.24
2 22.05 79.54
3 17.91 65.87
4 28.29 286.83
5 6.79 52.01
6 53.77 29.89
7 47.95 40.94
Average 31.26 91.47429
Source: Ace Analyser Database
Ho: There is no significant difference for average debt to capital employed ratio between automobile and steel industries over the period of study.
H1: There is significant difference for average debt to capital employed ratio between automobile and steel industries over the period of study
Table No. 4.19 Analysis of Average Debt to Capital Employed
of Automobile and Steel Companies
t-Test: Debt to Capital Employed
Automobile Steel
Mean 31.26 91.47429
Variance 295.4241 7817.416
Observations 7 7
Pooled Variance 4056.42
Hypothesized Mean Difference 0 Df 12
t Stat -1.76873 P(T<=t) one-tail 0.051163
t Critical one-tail 1.782288 P(T<=t) two-tail 0.102326
t Critical two-tail 2.178813 α=0.05;
Here,
tcal. = -1.76873 >tcrit. = - 2.178
Hence we will fail to reject null hypothesis. Therefore we can say that there is no
significant difference for average debt to capital employed ratio between automobile
and steel industries over the period of study.
149
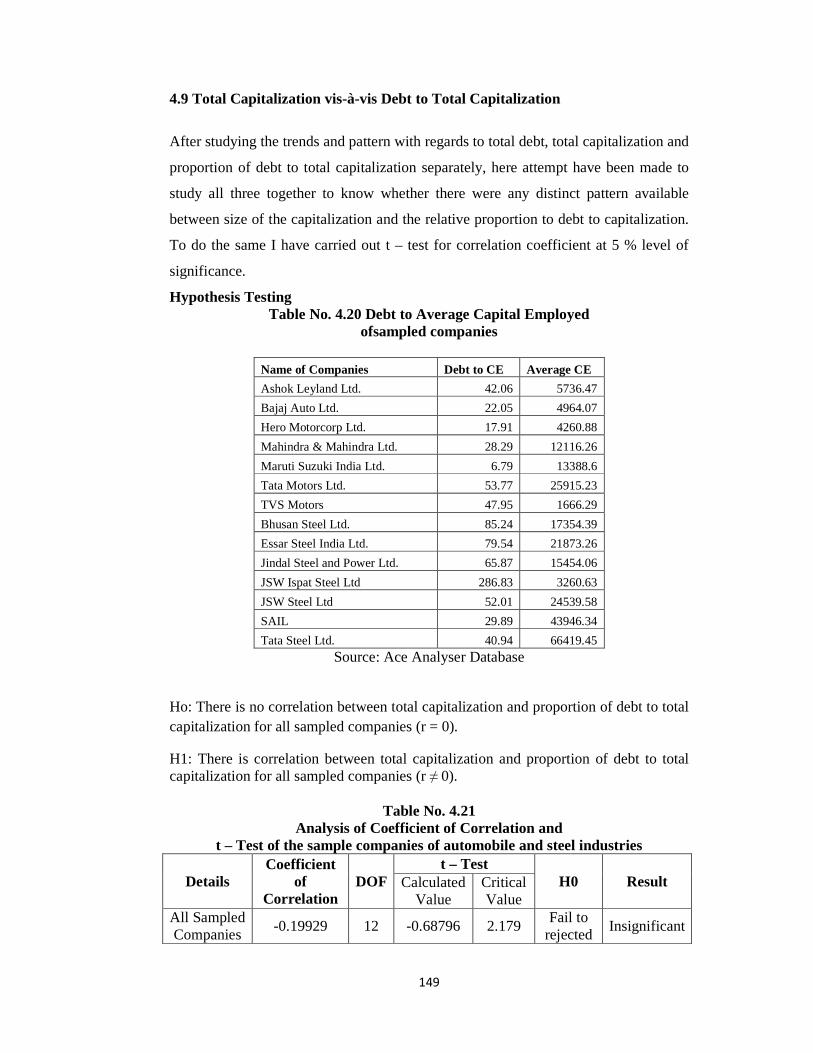
4.9 Total Capitalization vis-à-vis Debt to Total Capitalization
After studying the trends and pattern with regards to total debt, total capitalization and
proportion of debt to total capitalization separately, here attempt have been made to
study all three together to know whether there were any distinct pattern available
between size of the capitalization and the relative proportion to debt to capitalization.
To do the same I have carried out t – test for correlation coefficient at 5 % level of
significance.
Hypothesis Testing Table No. 4.20 Debt to Average Capital Employed
ofsampled companies
Name of Companies Debt to CE Average CE
Ashok Leyland Ltd. 42.06 5736.47
Bajaj Auto Ltd. 22.05 4964.07
Hero Motorcorp Ltd. 17.91 4260.88
Mahindra & Mahindra Ltd. 28.29 12116.26
Maruti Suzuki India Ltd. 6.79 13388.6
Tata Motors Ltd. 53.77 25915.23
TVS Motors 47.95 1666.29
Bhusan Steel Ltd. 85.24 17354.39
Essar Steel India Ltd. 79.54 21873.26
Jindal Steel and Power Ltd. 65.87 15454.06
JSW Ispat Steel Ltd 286.83 3260.63
JSW Steel Ltd 52.01 24539.58
SAIL 29.89 43946.34
Tata Steel Ltd. 40.94 66419.45 Source: Ace Analyser Database
Ho: There is no correlation between total capitalization and proportion of debt to total capitalization for all sampled companies (r = 0).
H1: There is correlation between total capitalization and proportion of debt to total capitalization for all sampled companies (r ≠ 0).
Table No. 4.21 Analysis of Coefficient of Correlation and
t – Test of the sample companies of automobile and steel industries
Details Coefficient
of Correlation
DOF t – Test
H0 Result Calculated Value
Critical Value
All Sampled Companies
-0.19929 12 -0.68796 2.179 Fail to
rejected Insignificant
α=0.05;
Here,
tcal. = -0.68796 > tcrit. =
Hence we will fail to reject null hypothesis.
correlation between total capitalization and proportion of debt to total capitalization
for all sampled companies (r = 0).
Chart No. 13Debt to CE vs Average Capital Employed
Above chart showing scatter plot of two
proportion of debt to capital employed also supports the result of our hypothesis test,
there is no visible pattern or relation found from above diagram.
The similar exercise has been carried out for all sampled comp
industries i.e. automobile and steel industry independently.
Table No. 4.22 Debt to CE
Name of Companies
Ashok Leyland Ltd.
Bajaj Auto Ltd.
Hero Motorcorp Ltd.
Mahindra & Mahindra Ltd.
Maruti Suzuki India Ltd.
Tata Motors Ltd.
TVS Motors
150
tcrit. = -2.179
Hence we will fail to reject null hypothesis. Therefore we can say that There is no
correlation between total capitalization and proportion of debt to total capitalization
for all sampled companies (r = 0).
Chart No. 13Debt to CE vs Average Capital Employed
Above chart showing scatter plot of two variables viz. total capitalization and
proportion of debt to capital employed also supports the result of our hypothesis test,
there is no visible pattern or relation found from above diagram.
The similar exercise has been carried out for all sampled companies of both the
industries i.e. automobile and steel industry independently.
Table No. 4.22 Debt to CE Automobile industries
Name of Companies Debt to CE Average CE
Ashok Leyland Ltd. 42.06 5736.47
Bajaj Auto Ltd. 22.05 4964.07
Hero Motorcorp Ltd. 17.91 4260.88
Mahindra & Mahindra Ltd. 28.29 12116.26
Maruti Suzuki India Ltd. 6.79 13388.6
Tata Motors Ltd. 53.77 25915.23
TVS Motors 47.95 1666.29
Source: Ace Analyser Database
Therefore we can say that There is no
correlation between total capitalization and proportion of debt to total capitalization
variables viz. total capitalization and
proportion of debt to capital employed also supports the result of our hypothesis test,
anies of both the
Hypothesis Testing Ho: There is no correlation between total capitalization for all sampled companies of automobile industry (r = 0).
H1: There is correlation between total capitalization and proportion of debt to total capitalization for all sampled companies of
Table No. 4.23 t – Test of the sample companies of Automobile industries
Details Coefficient of Correlation
All Sampled Automobile Companies
0.24135
α=0.05;
Here,
tcal. = 0.83174 < tcrit. = -
Hence we will fail to reject null hypothesis. Therefore we can say that there is no
correlation between total capitalization and
for all sampled companies of automobile industry (r = 0).
Chart No. 4.14Debt to CE vs Average CE
Above chart showing scatter plot of two variables viz. total capitalization and
proportion of debt to capital employed for sampled companies of automobile industry
also supports the result of our hypothesis test, there is no visible pattern or relation
found from above diagram.
151
Ho: There is no correlation between total capitalization and proportion of debt to total capitalization for all sampled companies of automobile industry (r = 0).
H1: There is correlation between total capitalization and proportion of debt to total capitalization for all sampled companies of automobile industry (r ≠ 0).
Table No. 4.23 Analysis of Coefficient of Correlation andTest of the sample companies of Automobile industries
Coefficient of Correlation
DOF
t - Test H0 Calculated
Value Critical Value
0.24135 5 0.83174 2.571 Fail to
rejected
-2.571
Hence we will fail to reject null hypothesis. Therefore we can say that there is no
correlation between total capitalization and proportion of debt to total capitalization
for all sampled companies of automobile industry (r = 0).
Chart No. 4.14Debt to CE vs Average CE – Auto Companies
Above chart showing scatter plot of two variables viz. total capitalization and
ebt to capital employed for sampled companies of automobile industry
also supports the result of our hypothesis test, there is no visible pattern or relation
found from above diagram.
capitalization and proportion of debt to total
H1: There is correlation between total capitalization and proportion of debt to total
Analysis of Coefficient of Correlation and Test of the sample companies of Automobile industries
Result
Insignificant
Hence we will fail to reject null hypothesis. Therefore we can say that there is no
proportion of debt to total capitalization
Auto Companies
Above chart showing scatter plot of two variables viz. total capitalization and
ebt to capital employed for sampled companies of automobile industry
also supports the result of our hypothesis test, there is no visible pattern or relation

152
Table No. 4.24 Debt to CE of Steel industries
Name of Companies Debt to CE Average CE
Bhusan Steel Ltd. 85.24 17354.39
Essar Steel India Ltd. 79.54 21873.26
Jindal Steel and Power Ltd. 65.87 15454.06
JSW Ispat Steel Ltd 286.83 3260.63
JSW Steel Ltd 52.01 24539.58
SAIL 29.89 43946.34
Tata Steel Ltd. 40.94 66419.45
Source: Ace Analyser Database Hypothesis Testing Ho: There is no correlation between total capitalization and proportion of debt to total capitalization for all sampled companies of steel industry (r = 0). H1: There is correlation between total capitalization and proportion of debt to total capitalization for all sampled companies of steel industry (r ≠ 0).
Table No. 4.25 Analysis of Coefficient of Correlation and t – Test of the sample companies of Steel industries
Details Coefficient of Correlation
DOF t - Test
H0 Result Calculated Value
Critical Value
All Sampled Steel
Companies -0.70727 5 -2.23638 2.571
Fail to rejected
Insignificant
α=0.05;
Here,
tcal. = -2.236 < tcrit. = 2.571
Hence we will fail to reject null hypothesis. Therefore we can say that there is no
correlation between total capitalization and proportion of debt to total capitalization
for all sampled companies of steel industry (r = 0).
Chart No. 4.15Debt to CE Average Capital Employed – Steel Companies
Above chart showing scatter plot of two variables viz. total capitalization and
proportion of debt to capital employed for sampled companies of steel industry also
supports the result of our hypothesis test, there is no visible pattern or relation found
from above diagram. Moreover we can see an extreme outlier (JSW Ispat Steel) in the
above diagram.
4.10 Trends and Patterns of Equity to Capital Employed ( %) among automobile and steel industries. After analyzing the proportion of debt to capital employed, we have al
attempt analyze the proportion of equity to capital employed for the sample
companies with an objective to identify the relationship between equity and total
capital employed.
Table No. 4.26 of sampled compa
Sr. No.
Name of Companies
1 Ashok Leyland Ltd.
2 Bajaj Auto Ltd.
3 Hero Motorcorp Ltd.
4 Mahindra & Mahindra Ltd.
5 Maruti Suzuki India Ltd.
6 Tata Motors Ltd.
7 TVS Motors
Average - Year Wise
Source: Ace Analyser Database
153
showing scatter plot of two variables viz. total capitalization and
proportion of debt to capital employed for sampled companies of steel industry also
supports the result of our hypothesis test, there is no visible pattern or relation found
gram. Moreover we can see an extreme outlier (JSW Ispat Steel) in the
4.10 Trends and Patterns of Equity to Capital Employed ( %) among automobile
After analyzing the proportion of debt to capital employed, we have al
attempt analyze the proportion of equity to capital employed for the sample
companies with an objective to identify the relationship between equity and total
Table No. 4.26 Total Equity to Capital Employed (%) of sampled companies of Automobile Industries
Name of Companies 2008 2009 2010 2011 2012 2013
4.38 2.45 2.24 2.11 4.09 3.70
4.95 4.21 3.39 5.74 4.71 3.63
1.28 1.03 1.13 0.90 0.75 0.75
3.45 2.93 2.64 2.33 1.93 1.66
1.55 1.44 1.14 1.03 0.95 0.79
2.73 2.01 1.81 2.14 2.32 2.35
1.60 1.38 1.27 3.06 2.88 2.76
2.71 2.14 1.90 2.15 2.22 2.00
Source: Ace Analyser Database
showing scatter plot of two variables viz. total capitalization and
proportion of debt to capital employed for sampled companies of steel industry also
supports the result of our hypothesis test, there is no visible pattern or relation found
gram. Moreover we can see an extreme outlier (JSW Ispat Steel) in the
4.10 Trends and Patterns of Equity to Capital Employed ( %) among automobile
After analyzing the proportion of debt to capital employed, we have also made and
attempt analyze the proportion of equity to capital employed for the sample
companies with an objective to identify the relationship between equity and total
2013 Average - Company
Wise 3.70 3.09
3.63 4.37
0.75 0.94
1.66 2.31
0.79 1.09
2.35 2.17
2.76 2.14
2.00 2.30
As we can see in table no. 4.25 that average equity to capital employed proportion of
all sampled companies of automobile industry for study period from 2008 to 2013 is
2.30 %. Out of the sampled companies the highest average equity to capital employed
proportion is of Bajaj Auto i.e. 4.37 % which is almost 2.07 % more than that of
average proportion. While lowest is 0.94 % that of Hero Motorcorp which is less by
1.36 % than average proportion. Ashok Leyland and Mahindra & Mahindra have
equity to total capital employed proportion more than that of average while Tata
Motors, TVS Motors and Maruti Suzuki are among the companies having equity to
capital employed proportion le
Moreover from the above figures we can also say that year on year there is fluctuating
pattern of average equity to capital employed ratio (year wise) on basis of sampled
companies of automobile industry.
Chart No. 4.16 Equity t
Above chart shows us the equity to capital employed ratio of sample companies of
automobile industry. Here we can see that for Companies like Mahindra & Mahindra,
Maruti Suzuki and Hero Motorcorp ratio is contin
companies are having fluctuation pattern for equity to capital employed ratio.
Hypothesis Testing
Ho: The average equity to capital employed ratio of the sampled companies of the
automobile industry is equal.
154
As we can see in table no. 4.25 that average equity to capital employed proportion of
all sampled companies of automobile industry for study period from 2008 to 2013 is
2.30 %. Out of the sampled companies the highest average equity to capital employed
proportion is of Bajaj Auto i.e. 4.37 % which is almost 2.07 % more than that of
average proportion. While lowest is 0.94 % that of Hero Motorcorp which is less by
han average proportion. Ashok Leyland and Mahindra & Mahindra have
equity to total capital employed proportion more than that of average while Tata
Motors, TVS Motors and Maruti Suzuki are among the companies having equity to
capital employed proportion less than average proportion.
Moreover from the above figures we can also say that year on year there is fluctuating
pattern of average equity to capital employed ratio (year wise) on basis of sampled
companies of automobile industry.
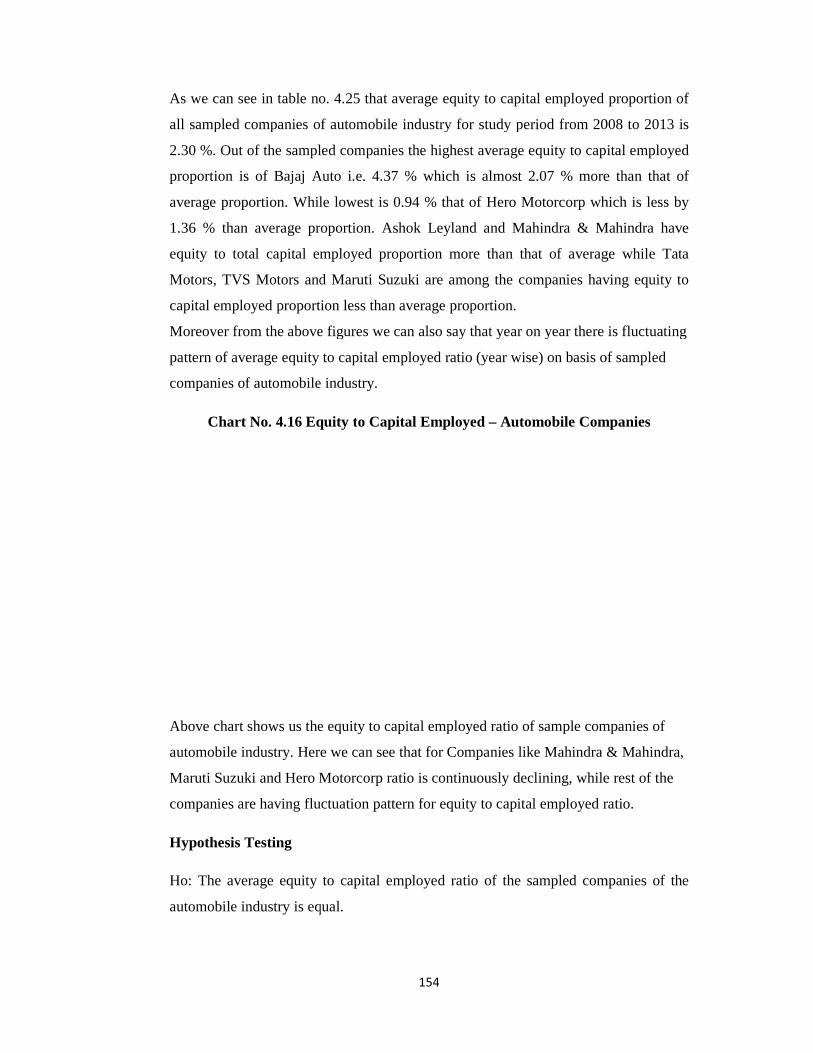
Chart No. 4.16 Equity to Capital Employed – Automobile Companies
Above chart shows us the equity to capital employed ratio of sample companies of
automobile industry. Here we can see that for Companies like Mahindra & Mahindra,
Maruti Suzuki and Hero Motorcorp ratio is continuously declining, while rest of the
companies are having fluctuation pattern for equity to capital employed ratio.
Ho: The average equity to capital employed ratio of the sampled companies of the
automobile industry is equal.
As we can see in table no. 4.25 that average equity to capital employed proportion of
all sampled companies of automobile industry for study period from 2008 to 2013 is
2.30 %. Out of the sampled companies the highest average equity to capital employed
proportion is of Bajaj Auto i.e. 4.37 % which is almost 2.07 % more than that of
average proportion. While lowest is 0.94 % that of Hero Motorcorp which is less by
han average proportion. Ashok Leyland and Mahindra & Mahindra have
equity to total capital employed proportion more than that of average while Tata
Motors, TVS Motors and Maruti Suzuki are among the companies having equity to
Moreover from the above figures we can also say that year on year there is fluctuating
pattern of average equity to capital employed ratio (year wise) on basis of sampled
Automobile Companies
Above chart shows us the equity to capital employed ratio of sample companies of
automobile industry. Here we can see that for Companies like Mahindra & Mahindra,
uously declining, while rest of the
companies are having fluctuation pattern for equity to capital employed ratio.
Ho: The average equity to capital employed ratio of the sampled companies of the
H1: The average equity to capital employed ratio of the sampled companies of the automobile industry is not equal.
Table No.ANOVA: EQUITY TO CE ( AUTOMOBILE)
SUMMARY
Groups
Ashok Leyland Ltd.
Bajaj Auto Ltd.
Hero Motorcorp Ltd.
Mahindra & Mahindra Ltd.
Maruti Suzuki India Ltd.
Tata Motors Ltd.
TVS Motors
ANOVA
Source of Variation
Between Groups
Within Groups
Total
α=0.05;
Here,
Fcal. = 18.82 >Fcrit. =2.371
Hence we will reject null hypothesis. Therefore we can say that the average equity to
capital employed ratio of the sampled companies of the automobile industry is not
equal.
.Chart No. 4.17 Average
155
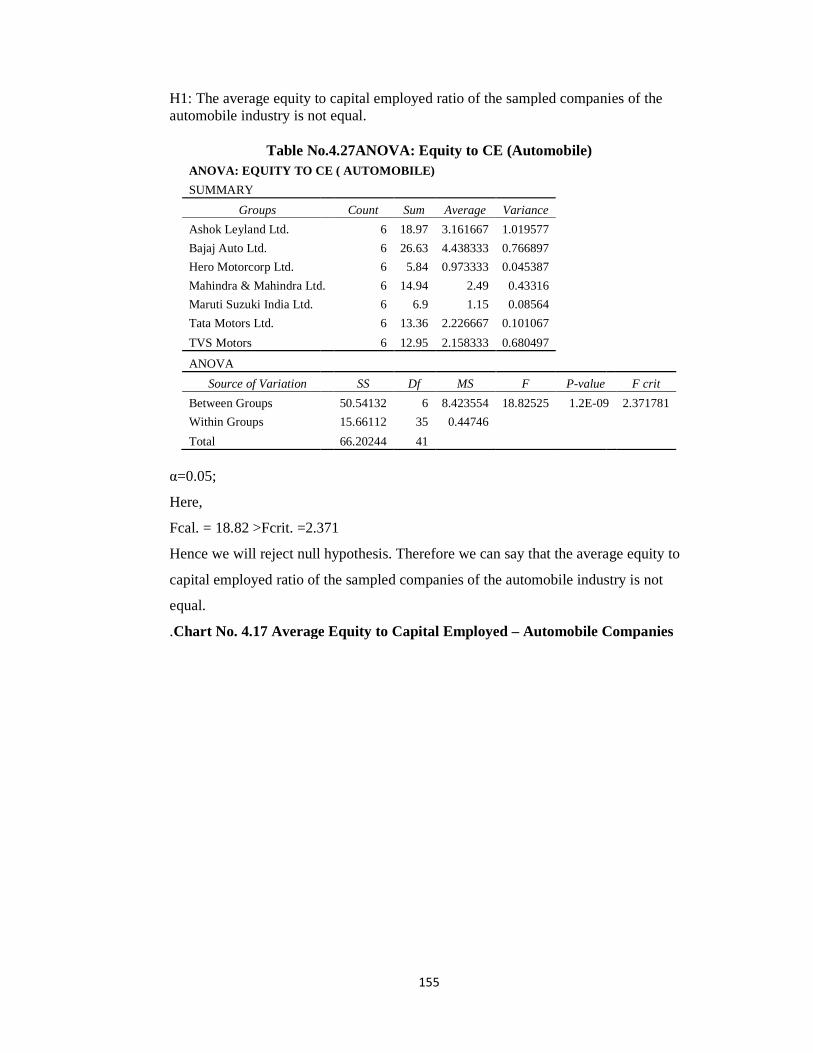
average equity to capital employed ratio of the sampled companies of the automobile industry is not equal.
Table No.4.27ANOVA: Equity to CE (Automobile) ANOVA: EQUITY TO CE ( AUTOMOBILE)
Count Sum Average Variance 6 18.97 3.161667 1.019577
6 26.63 4.438333 0.766897
6 5.84 0.973333 0.045387
Mahindra & Mahindra Ltd. 6 14.94 2.49 0.43316
6 6.9 1.15 0.08564
6 13.36 2.226667 0.101067
6 12.95 2.158333 0.680497
SS Df MS F P-value
50.54132 6 8.423554 18.82525 1.2E-09
15.66112 35 0.44746 66.20244 41
Fcal. = 18.82 >Fcrit. =2.371
Hence we will reject null hypothesis. Therefore we can say that the average equity to
capital employed ratio of the sampled companies of the automobile industry is not
Average Equity to Capital Employed – Automobile Companies
average equity to capital employed ratio of the sampled companies of the
F crit
09 2.371781
Hence we will reject null hypothesis. Therefore we can say that the average equity to
capital employed ratio of the sampled companies of the automobile industry is not
Automobile Companies
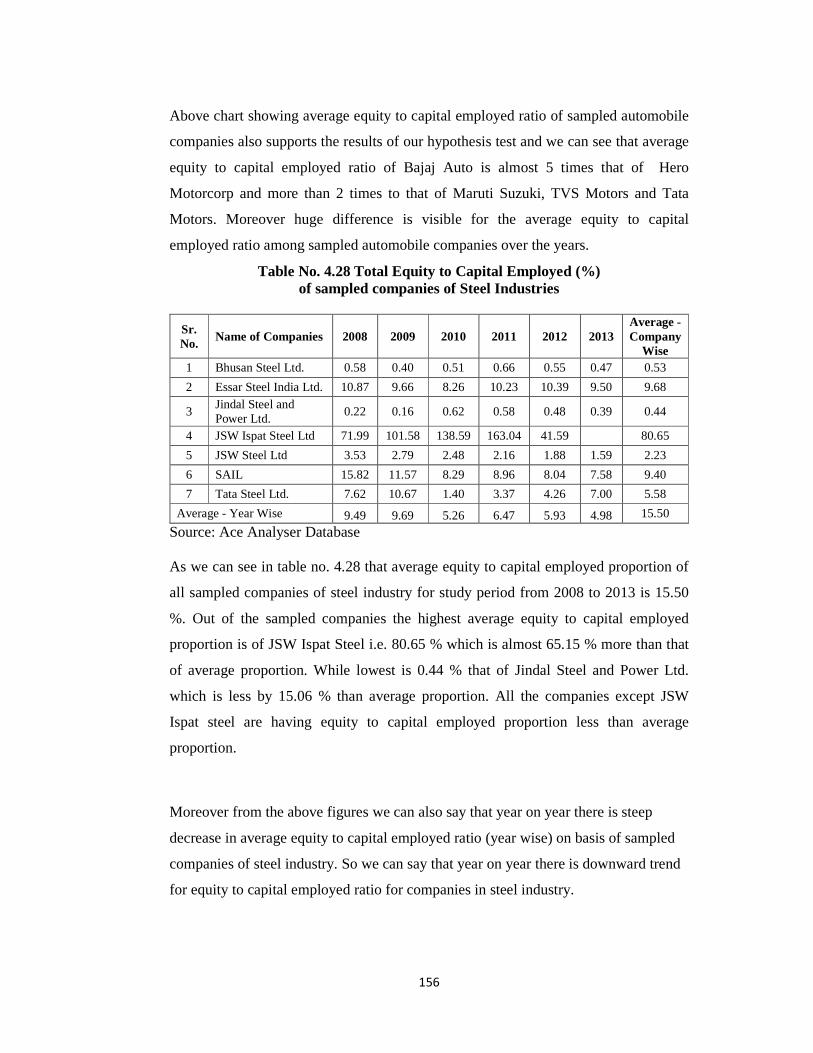
156
Above chart showing average equity to capital employed ratio of sampled automobile
companies also supports the results of our hypothesis test and we can see that average
equity to capital employed ratio of Bajaj Auto is almost 5 times that of Hero
Motorcorp and more than 2 times to that of Maruti Suzuki, TVS Motors and Tata
Motors. Moreover huge difference is visible for the average equity to capital
employed ratio among sampled automobile companies over the years.
Table No. 4.28 Total Equity to Capital Employed (%) of sampled companies of Steel Industries
Sr. No.
Name of Companies 2008 2009 2010 2011 2012 2013 Average - Company
Wise 1 Bhusan Steel Ltd. 0.58 0.40 0.51 0.66 0.55 0.47 0.53
2 Essar Steel India Ltd. 10.87 9.66 8.26 10.23 10.39 9.50 9.68
3 Jindal Steel and Power Ltd.
0.22 0.16 0.62 0.58 0.48 0.39 0.44
4 JSW Ispat Steel Ltd 71.99 101.58 138.59 163.04 41.59
80.65
5 JSW Steel Ltd 3.53 2.79 2.48 2.16 1.88 1.59 2.23
6 SAIL 15.82 11.57 8.29 8.96 8.04 7.58 9.40
7 Tata Steel Ltd. 7.62 10.67 1.40 3.37 4.26 7.00 5.58
Average - Year Wise 9.49 9.69 5.26 6.47 5.93 4.98 15.50
Source: Ace Analyser Database As we can see in table no. 4.28 that average equity to capital employed proportion of
all sampled companies of steel industry for study period from 2008 to 2013 is 15.50
%. Out of the sampled companies the highest average equity to capital employed
proportion is of JSW Ispat Steel i.e. 80.65 % which is almost 65.15 % more than that
of average proportion. While lowest is 0.44 % that of Jindal Steel and Power Ltd.
which is less by 15.06 % than average proportion. All the companies except JSW
Ispat steel are having equity to capital employed proportion less than average
proportion.
Moreover from the above figures we can also say that year on year there is steep
decrease in average equity to capital employed ratio (year wise) on basis of sampled
companies of steel industry. So we can say that year on year there is downward trend
for equity to capital employed ratio for companies in steel industry.
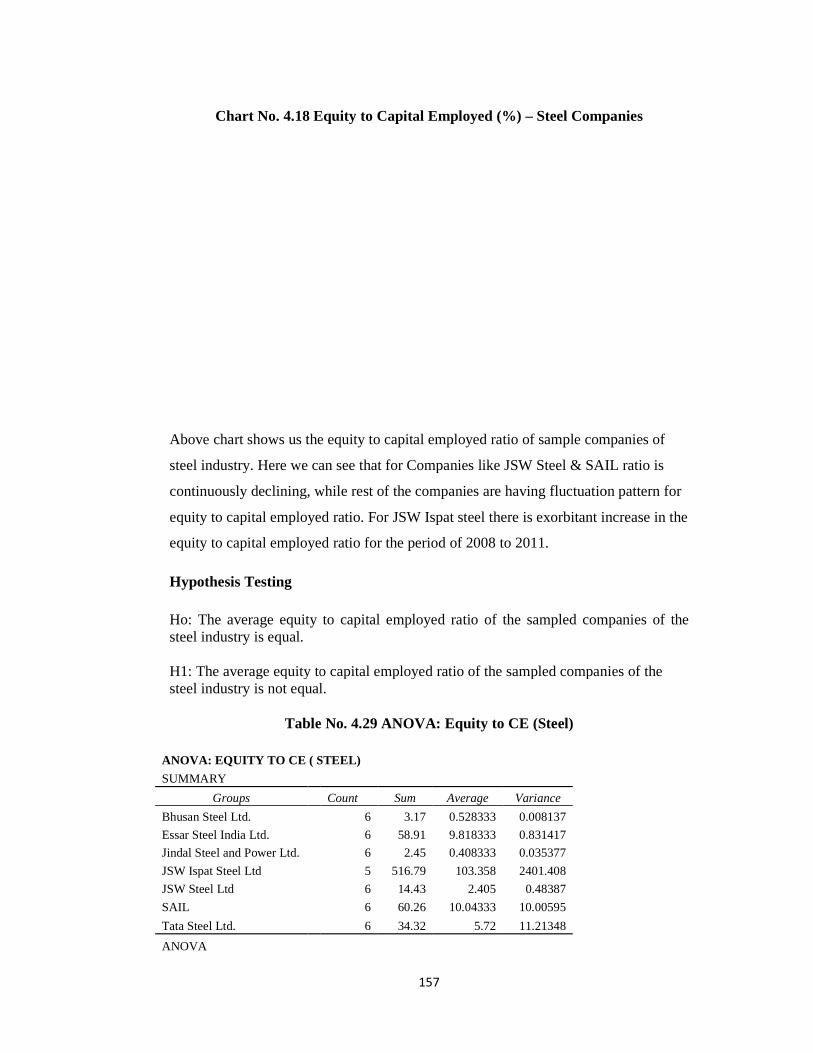
Chart No. 4.18 Equity
Above chart shows us the equity to capital employed ratio of sample
steel industry. Here we can see that for Companies like JSW Steel & SAIL ratio is
continuously declining, while rest of the companies are having fluctuation pattern for
equity to capital employed ratio. For JSW Ispat steel there is exorbitant
equity to capital employed ratio for the period of 2008 to 2011.
Hypothesis Testing
Ho: The average equity to capital employed ratio of the sampled companies of the steel industry is equal. H1: The average equity to capital employed ratio steel industry is not equal.
Table No. 4.29
ANOVA: EQUITY TO CE ( STEEL)
SUMMARY
Groups
Bhusan Steel Ltd.
Essar Steel India Ltd.
Jindal Steel and Power Ltd.
JSW Ispat Steel Ltd
JSW Steel Ltd
SAIL
Tata Steel Ltd.
ANOVA
157
Equity to Capital Employed (%) – Steel Companies
Above chart shows us the equity to capital employed ratio of sample companies of
steel industry. Here we can see that for Companies like JSW Steel & SAIL ratio is
continuously declining, while rest of the companies are having fluctuation pattern for
equity to capital employed ratio. For JSW Ispat steel there is exorbitant increase in the
equity to capital employed ratio for the period of 2008 to 2011.
Ho: The average equity to capital employed ratio of the sampled companies of the
H1: The average equity to capital employed ratio of the sampled companies of the steel industry is not equal.
Table No. 4.29 ANOVA: Equity to CE (Steel)
ANOVA: EQUITY TO CE ( STEEL)
Count Sum Average Variance
6 3.17 0.528333 0.008137
6 58.91 9.818333 0.831417
6 2.45 0.408333 0.035377
5 516.79 103.358 2401.408
6 14.43 2.405 0.48387
6 60.26 10.04333 10.00595
6 34.32 5.72 11.21348
Steel Companies
companies of
steel industry. Here we can see that for Companies like JSW Steel & SAIL ratio is
continuously declining, while rest of the companies are having fluctuation pattern for
increase in the
Ho: The average equity to capital employed ratio of the sampled companies of the
of the sampled companies of the
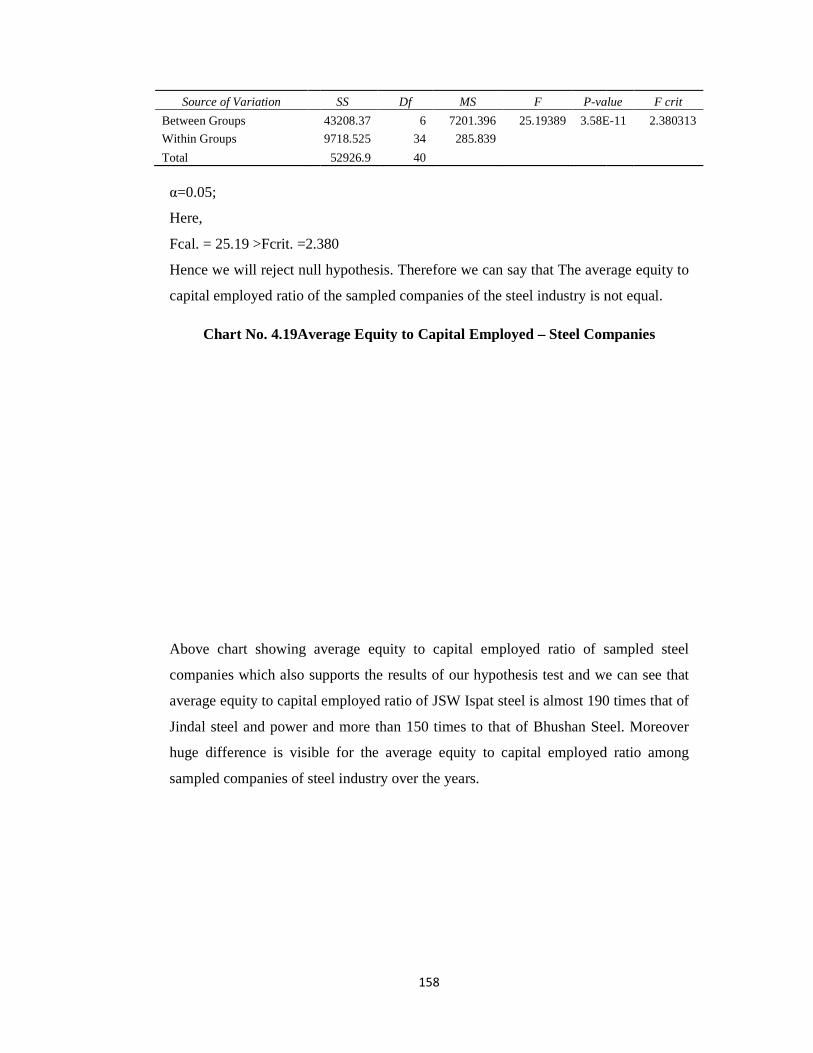
Source of Variation
Between Groups
Within Groups
Total
α=0.05;
Here,
Fcal. = 25.19 >Fcrit. =2.380
Hence we will reject null
capital employed ratio of the sampled companies of the steel industry is not equal.
Chart No. 4.19Average Equity to Capital Employed
Above chart showing average equity to cap
companies which also supports the results of our hypothesis test and we can see that
average equity to capital employed ratio of JSW Ispat steel is almost 190 times that of
Jindal steel and power and more than 150 time
huge difference is visible for the average equity to capital employed ratio among
sampled companies of steel industry over the years.
158
SS Df MS F P-value
43208.37 6 7201.396 25.19389 3.58E
9718.525 34 285.839
52926.9 40
Fcal. = 25.19 >Fcrit. =2.380
Hence we will reject null hypothesis. Therefore we can say that The average equity to
capital employed ratio of the sampled companies of the steel industry is not equal.
Chart No. 4.19Average Equity to Capital Employed – Steel Companies
Above chart showing average equity to capital employed ratio of sampled steel
companies which also supports the results of our hypothesis test and we can see that
average equity to capital employed ratio of JSW Ispat steel is almost 190 times that of
Jindal steel and power and more than 150 times to that of Bhushan Steel. Moreover
huge difference is visible for the average equity to capital employed ratio among
sampled companies of steel industry over the years.
value F crit
3.58E-11 2.380313
hypothesis. Therefore we can say that The average equity to
capital employed ratio of the sampled companies of the steel industry is not equal.
Steel Companies
ital employed ratio of sampled steel
companies which also supports the results of our hypothesis test and we can see that
average equity to capital employed ratio of JSW Ispat steel is almost 190 times that of
s to that of Bhushan Steel. Moreover
huge difference is visible for the average equity to capital employed ratio among