
Chapter 4 Analysis of Datashodhganga.inflibnet.ac.in/bitstream/10603/15088/8/09... · ·...
88
110 Chapter 4 Analysis of Data The chapter is covered as follows: 4.1 Analysis through Primary Data 4.1.1 Analysis of Questionnaire I for Regulators 4.1.2 Analysis of Questionnaire II for from professionals in banking and finance area 4.1.3 Analysis of Questionnaire III from Derivative traders 4.2 Analysis through Secondary Data 4.2.1 Comparison of NSE Nifty volatility- Pre and Post introduction of derivatives. 4.2.2 Price Discovery and volatility comparison 4.2.2.1 Data and Sample 4.2.2.2 Methodology of Analysis 4.2.2.3 Descriptive Statistics 4.2.2.4 Mates of the Index and Futures Returns 4.2.3 Comparison of impact cost at NSE This chapter is divided into analysis of information collected through Primary and Secondary Data. The first section analyzes data collected from Thomson Reuters and the National Stock Exchange. And the second section analyses information gathered through primary collection of data by administering questionnaire to various respondents in the Equity Derivative market. Derivative markets as discussed in chapter one functions for: • Risk Management • Price Discovery • Transactional Efficiency • Lower Volatility The use of financial derivatives help or aid in the price discovery process. It could facilitate reduction in transactional cost.
Transcript of Chapter 4 Analysis of Datashodhganga.inflibnet.ac.in/bitstream/10603/15088/8/09... · ·...
110
Chapter 4
Analysis of Data
The chapter is covered as follows:
4.1 Analysis through Primary Data
4.1.1 Analysis of Questionnaire I for Regulators
4.1.2 Analysis of Questionnaire II for from professionals in banking and finance area 4.1.3 Analysis of Questionnaire III from Derivative traders
4.2 Analysis through Secondary Data
4.2.1 Comparison of NSE Nifty volatility- Pre and Post introduction of
derivatives.
4.2.2 Price Discovery and volatility comparison
4.2.2.1 Data and Sample
4.2.2.2 Methodology of Analysis
4.2.2.3 Descriptive Statistics
4.2.2.4 Mates of the Index and Futures Returns
4.2.3 Comparison of impact cost at NSE
This chapter is divided into analysis of information collected through Primary and
Secondary Data. The first section analyzes data collected from Thomson Reuters and the
National Stock Exchange. And the second section analyses information gathered through
primary collection of data by administering questionnaire to various respondents in the
Equity Derivative market. Derivative markets as discussed in chapter one functions for:
• Risk Management
• Price Discovery
• Transactional Efficiency
• Lower Volatility
The use of financial derivatives help or aid in the price discovery process. It could
facilitate reduction in transactional cost.

111
4.1 Analysis through primary data.
4.1.1 Analysis of Questionnaire I for Regulators:
1. On query of whether the institutions monitor derivative trading, the institutions
replied:
SEBI: The SEBI has separate surveillance department Market Intermediaries
Regulation and Supervision Department comprising of around 30 to 40 personnel,
which monitors derivatives trading.
MCX: MCX monitors derivatives trading in Commodity Futures. NSE: NSE monitors derivative trading.
2. On query on the list of instruments allowed to trade in derivatives market,
SEBI responded:
SEBI: Stock option, stock future, index option, index future, currency future,
currency options and interest rates futures.
NSE: It has products like S&P CNX Nifty, Mini Derivative Contracts, CNXIT, Bank
Nifty, Nifty Midcap 50 and Individual securities.
3. How many audits do you perform in a year?
SEBI: All exchanges are inspected on a yearly basis.
MCX: MCX perform annual audits.
4. Do you train market participants in derivatives trading?
SEBI: No, training for the market participants in derivatives trading is carried out by
exchanges. However SEBI conducts periodic investors’ awareness programs and
programs for common people periodically.
112
MCX: Yes
NSE: Yes
5. How do you train derivative traders?
MCX: They are engaged in training market participants in derivative trading through
classroom training and literature/ pamphlet distribution.
NSE: NSE trains market participants and has large number of modules to offer. They
have classroom training methodology along with online examination system, which is
an ongoing activity.
6. How frequently? MCX: The periodicity of the training is monthly. NSE: Its an ongoing activity.
7. How do you enforce regulation compliance? SEBI: Market Intermediaries Regulation and Supervision Department enforces
compliance to regulations.
MCX: MCX enforce regulation compliance through periodic audits and collection of
compliance reports.
8. How many times do you carry out periodic audits?
MCX: MCX conduct the audit annually.
9. How many times in a year does a trader have to present a compliance report?
MCX: A trader at MCX has to submit a compliance report on an annual basis.
NSE: As an example the following Compliance Calendar has to be followed by the
members of the derivative segment.

113
Table 23: List of compliance calendar
What to Report When to Report Whom to Contact Circulars Dated
Activation / Deactivation of
Proprietary trading facility
Prior Approval required
Capital Market Trade
25th November 2008
23rd March 2010 Block Deal Execution
On the same day of trade
Capital Market Trade 25th November 2008
Bulk Deal Reporting
Single bulk deal immediately upon
the execution of the order. Cumulative
trades resulting in a bulk deal, within one
hour of closure of trading hours.
Capital Market Trade 25th November 2008
Application for providing IBT
Prior Approval required CTCL
12th May 2000 10th Nov 2006 6th Jun 2008
Submission of SSL certificate for IBT
Services By 31 July yearly CTCL 28th June 2006
System Audit Report By 31 July yearly CTCL 30th June 2009
Activation for CTCL /IBT for
ENIT
Prior Approval Required CTCL 25th Aug 2006
Advertisements (Rule (5) (h) of
Chapter IV of the Rules of the Exchange)
Advertisement to be submitted seven days in advance
before its publication. Written
permission to be obtained before
publication
Compliance 5th October 2009
Annual Returns Within 6 months from the end of accounting year
Compliance 7th Jun 2010

114
Appointment and change of
Compliance Officer
Intimation to Exchange Compliance 14th June 2002
Client wise Funding Report
Within seven days form the end
of the month Compliance
31st January 2007 19th December 2005
13th July 2005 19th December 2005
Internal Audit Report
Half yearly basis -Within 3 months from half year
ended March and September
Compliance
23rd April 2010
9th December 2009
Net worth certificate
Half yearly basis – within 3 months
from half year ending
Compliance 14th October 2009
Networth certificate in
Margin Trading for CM Segment
Within one month from the end of
half year Compliance
7th April 2004
7th April 2004
Proof of Insurance cover By July 31 yearly Compliance 10th May 2010
Client details for Margin Trading
facility
Before 9:00pm on the trade day Compliance
21st September 2006 11th March 2005 10th March 2005
9th September 2004 7th April 2004 7th April 2004 7th April 2004
Members trading through other
members
Intimation / Prior Approval required Compliance 22nd January 2004
Appointment of Authorized
personal in F&O segment
Prior Approval required. Membership 3rd December 2009

115
Change in address of member
Intimation to Exchange Membership
8th July 2004 4th October 2002
Change in designated directors
Prior Approval required Membership 13th August 2007
Change in non-designated directors
Fee Clearance from the
Exchange Membership 22nd January 2010
Change in name of member
Intimation to Exchange Membership 28th February 2008
Change in shareholding
Fee Clearance from the
Exchange Membership 22nd January 2010
Change in status and constitution
Prior Approval required Membership 25th July 2003
Increase in share capital
Fee Clearance from the
Exchange Membership 22nd January 2010
Upload of DMA IDs
Prior Approval required Membership 21st July 2008
Upload of CTCL IDs Activation / Deactivation /
Shifting of CTCL IDs
Prior Approval required Membership 25th September 2006
Pay in of Funds (CM)
On T+2 day by stipulated pay-in
time NSCCL – Funds 10th September 2009
Pay in of Funds (F&O)
On a T+1 day basis by
stipulated pay-in time
NSCCL – Funds 10th September 2009
Pay in of Funds (CDS)
Daily mark to market settlement
by 8:30 am on T+1 day
Final settlement by 8:30 am on
T+2 day
NSCCL – Funds 20th November 2008
Pay in of Funds (SLB)
On T+1 day by 9:30 am NSCCL – Funds 12th December 2008
Pay in of Funds (MFSS)
On the T+1 day by 8:30 a.m. NSCCL – Funds 24th November 2009
Client Margin Reporting
Within two days from trade date NSCCL - Risk 10th September 2009

116
Client Code Modification File
(CLD)*
Penalty Structure for Cld
modification
NSCCL - Securities 10th September 2009
On T day by 4.45 pm
NSCCL - Securities 10th September 2009
Client Direct Payout File (CPD)*
On T+2 day by 9.30 am
NSCCL - Securities 10th September 2009
Contraction of custodial Trades
file
DVP trades penalty , margins & exceptions for
same
NSCCL - Securities 10th September 2009
10. How many surprise checks do you carry out in a year?
MCX: MCX do not conduct any surprise checks/audits.
11. How many periodic meeting do you conduct with the traders and institutional
investors in a year?
SEBI: Meetings with the traders and institution investors are conducted whenever its
required and when they approach with issues which require SEBI intervention.
MCX: MCX meet traders and institutional investors once in a year.
12. What does the compliance report consist of?
SEBI: The compliance report mentions the volume of trading activity date and the
current positions.
MCX: The compliance report submitted by the trader includes compliance to
instructions and bye-laws as well as compliance to FMC circulars.
13. Does a trader have to be qualified for derivatives trading?
SEBI: A derivatives trader has to be qualified as per the exchanges compliance
exams. For example – NCFM exams being conducted by National Stock Exchange.

117
MCX: At MCX a trader need not be qualified for derivatives trading by may lose
permission to trade if his/her compliance is found not satisfactory.
14. How do you ensure compliance?
SEBI: Inputs are sort by different stake holders by way of suggestion, reviews. The
same if required to incorporated as regulation gets reviewed by the departmental head,
General Manager, Executive Director, Whole Time Member and then Chairman. Once
formulated the regulation is sent as a circular via letters and through website
information dissemination system.
15. How do you incorporate new regulations?
SEBI: Information is disseminated through the organizational official website. A
section disseminates all circulars which are to be made public
MCX: MCX incorporates new regulations through changes in the Bye-laws of the
exchange.
16. How do you ensure compliance on information dissemination?
MCX: Information dissemination is a voluntary activity by traders and is not
compelled.
17. How do you make investors aware of the risk involved in derivatives trading?
SEBI: Investors are provided with adequate literature on trading in various
instruments on the Stock Exchanges through pamphlets distribution, List of dos and
don’ts like signing on blank forms and applications and handing them to brokers
giving power of attorney to brokers etc.
MCX: MCX undertakes investor education and the KYC (Know Your Customer)
norms facilitate investors to understand the risk of investment and trading.
NSE: Professional Clearing Member (PCM)

118
The following persons are eligible to become PCMs of NSCCL for Futures & Options
and/or Capital Market Segment provided they fulfill the prescribed criteria:
• SEBI Registered Custodians; or
• Banks recognised by NSEIL/NSCCL for issuance of bank guarantees
Other Eligibility Criteria
At any point of time the applicant has to ensure that either the proprietor/one
designated director/partner or the Compliance Officer of the applicant entity should be
successfully certified either in Securities Market (Basic) Module or Compliance
Officers (Brokers) Module or the relevant module pertaining to the segments wherein
membership of the Exchange has been sought .i.e.
• Capital Market (Dealers) Module
• Derivatives Market (Dealers) Module
• National Institute of Derivatives Certification Examination
• Securities Markets (NISM) Series I – Currency
The above norm is a continued admittance norm for membership of the Exchange.
An applicant must be in a position to pay the membership and other fees, deposits etc,
as applicable at the time of admission within three months of intimation to him of
admission as a Trading Member or as per the time schedule specified by the
Exchange.
The Exchange may specify such standards for investor service and infrastructure with
regard to any category of applicants as it may deem necessary, from time to time.
18. How many companies approach SEBI for derivative trading?
SEBI: Companies approach exchanges for derivatives trading. All though final
approval is given by SEBI. Currently 202 companies are registered on NSE and 102
on BSE for trading in stock future and options.

119
19. How many listed companies (%) of the applied meet SEBI criteria in participating in
derivatives trading?
20. Do you collaborate with SEC?
SEBI: The SEBI collaborates with SEC and other international exchanges and other
security commissions through an association of regulators called as International
Organization of Securities Commissions (IOSCO).
MCX: The exchange does not collaborate with SEC or CFTC, but do track their
developments.
21. How much international exposure do you allow in derivatives trading?
SEBI: SEBI does not control international exposure of any trader in the international
markets. The same gets covered under FERA and FEMA which are governed by RBI.
There is no programmed interaction with RBI on these issues.
MCX: There is no exposure allowed in the derivative trades in the international
markets.
22. How is the red alert signaled?
MCX: The exchange ensures trading in stopped when a trader/investors approach
his/her position limit or prices start becoming volatile.
23. How do you monitor mark to market investors’ positions?
MCX: Positions of all traders are marked to market on a daily basis and accounts are
credited / debited accordingly.
24. How does SEBI monitor day to day trading pattern?
SEBI: Day to day trading patterns is monitored by the respective exchanges. SEBI
gets the report on the next day. There is a day’s lag in the same

120
MCX: The Forwards Market Commission (FMC) has the power to monitor daily
trading patterns and take preventive / penal action if unusual volatility is noted in the
prices.
25. How do you penalize non- compliance?
SEBI: If after analysis SEBI finds and non compliance and unusual pattern in trading,
it ceases the demat accounts and terminals of the default traders also results into
blocking of trading and barring the person on entering the market. Along with
imposing monitory penalties if required.
MCX: Any non-compliance by the traders is penalized by issuing warnings or
cancelling the licenses to trade.
26. Do you think a separate exchange for derivative trading should be established?
SEBI: As far as the functioning of exchanges are proving to be satisfactory, a need to
open a separate exchange may not be desired.
MCX: MCX is not of the opinion to establish a separate derivative exchange.
27. If yes, why do you think so?
SEBI: The desire to open new derivative exchange would not arise if the functioning
between the cash market and derivatives market are realistic and efforts being
coordinated for creation of an efficient market system.
28. How frequently do you introduce new products in the Derivatives Market?
SEBI: Whenever there is a mandate to introduce a new derivative product SEBI
considers it and introduces it after due diligence. SEBI follows the conservative
approach regarding introducing new products.
121
MCX: There is no fixed pattern of introduction of new products in the derivatives
market. It depends on the market demand.
29. Do you think Indian Financial System is matured enough to adapt to exotic products
in Derivatives?
SEBI: The Indian financial system is not matured enough to absorb exotic and
advance products in derivatives. The investors are not aware of the usage and
advantages of trading in these products. For example – An interest rate future product
was introduced last year but finds no takers, there is no liquidity in the market and the
market is unable to understand its complexities. Derivatives trading in stocks are not
allowed to be traded in OTC but only in exchanges. Only interest rate and currency
rate derivatives trading is allowed under OTC which is governed by RBI. The trading
in same is very small in exchanges.
MCX: Though it’s of the opinion that Indian Financial System is matured enough to
adapt to exotic products in Derivatives under the guidance and strict monitoring by
the regulator.
30. Why?
SEBI: As stated question no. 29.
31. Has any trader/broker defaulted?
SEBI: There has been no default in the equity derivative segment.
MCX: There have been default cases by traders in MCX against whom action has
been taken.
32. Have you taken any action on the defaulted trader/ broker?
NSE: Yes
33. If yes, then how many?

122
MCX: The number of defaulters is not revealed due to non-disclosure norms of the
exchange.
34. On what grounds have the traders/ brokers defaulted?
NSE: There were 1035 active members during January 2011 in the Futures and
Options (F & O) Segment. There were 1116 active members during January 2011 in
the Cash segment. Following is the complaint status against F & O trading members
as on 3rd December 2010.
• Non- Actionable: 13
• Opted for Arbitration: 67
• Resolved status: 428
• Under Process- 6
Interestingly the exchange received complaints against almost 50% of the members. The
above status does confirm the efficient grievance redress mechanism of NSE. 98 % is the
resolved rate.
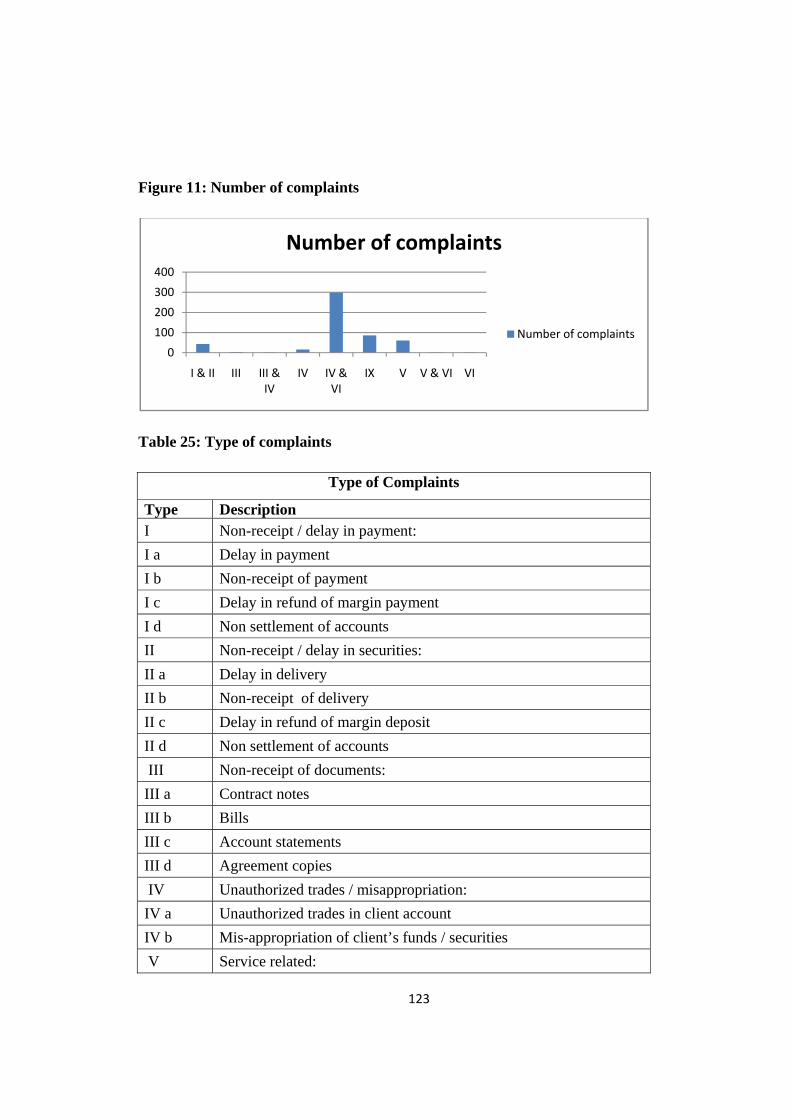
Following are the type of complaints:
Table 24: Number of complaints
Type of complaints
Number of complaints %
I & II 43 8.37
III 3 0.58
III & IV 2 0.39
IV 16 3.11
IV & VI 299 58.17
IX 86 16.73
V 61 11.87
V & VI 2 0.39
VI 2 0.39
Total 514 100.00
123
Figure 11: Number of complaints
Table 25: Type of complaints
Type of Complaints
Type Description I Non-receipt / delay in payment: I a Delay in payment I b Non-receipt of payment I c Delay in refund of margin payment I d Non settlement of accounts II Non-receipt / delay in securities: II a Delay in delivery II b Non-receipt of delivery II c Delay in refund of margin deposit II d Non settlement of accounts III Non-receipt of documents: III a Contract notes III b Bills III c Account statements III d Agreement copies IV Unauthorized trades / misappropriation: IV a Unauthorized trades in client account IV b Mis-appropriation of client’s funds / securities V Service related:
0
100
200
300
400
I & II III III & IV
IV IV & VI
IX V V & VI VI
Number of complaints
Number of complaints

124
V a Excess brokerage V b Non-execution of order V c Wrong execution of order V d Connectivity / system related problem V e Non-receipt of corporate benefits V f Other service defaults VI Closing out / squaring up: VI a Closing off / squaring up position without consent VI b Dispute in Auction value / close out value VII Non implementation of arbitration award VIII IPO related IX Others
Table 26: Status of the complaints
Status
Type Description
I Non actionable
I a Complaint incomplete
I b Outside the scope of stock exchange
II Resolved
III Under Process
IV Referred to Arbitration
58% complaints are related to unauthorized trade and service related, of which 83% are
resolved, rest 1% is in process and 15% cases opt for arbitration. Which shows that the
exchange is quite efficient is handing disputes and has a control on the defaults by the
members.
MCX: The defaults are due to Business and Market malpractices and delivery
defaults.
35. What actions do you normally take on the default by the traders/ brokers?
SEBI: As per the gravity of the default.
125
36. Do you have a mechanism to monitor high performance individuals/ traders/ brokers?
MCX: MCX has mechanism to monitor high performance individual / traders /
brokers which are monitored by positions relative to the market and open positions.
37. If yes, then how do you monitor high performance individuals/ traders / brokers?
38. Are there any regulatory concerns to be addressed in the near future?
SEBI: Yes
MCX: Yes
39. If yes, then what?
SEBI: Investors and market maturity is a prime concern for SEBI. Introducing new
products in the market and finding takers also is a concern which has to be addressed.
Separate membership for separate class of product has to be taken by the trade
members. For example – separate membership for currency, equity and interest
derivatives trading has to be sought. The policy and regulations of SEBI are framed in
such a way that it ensures proper collection of margins and conservative approach in
introducing derivative products so that they are suitable for investors across the
sections included retail investors and they are introduced only if the markets are ready
to absorb them. SEBI also tries to ensure that their policies and regulations bring in an
overall efficiency in the market. Before launching a product adequate quantitative
analysis is done and theoretical simulations are conducted to ensure adequate
collection of margins and proposing desired margins and networth by the traders /
brokers / dealers.
SEBI does not have any control over exposure of Banks in foreign markets since they
come under the purview of RBI.
MCX: According to the exchange, there are regulatory concerns to be addressed in
126
the near future which are; that the market is governed by an archaic law which need to
be amended so that the regulator gets more power and autonomy, more products are
permitted in the market, more participants, such as financial institutions, which are
currently disallowed, are permitted in the market.
4.1.2 Analysis Questionnaire II for professionals in banking and finance area:
Analysis of the responses from professionals working in the banking and finance segment
has been summarized as below:
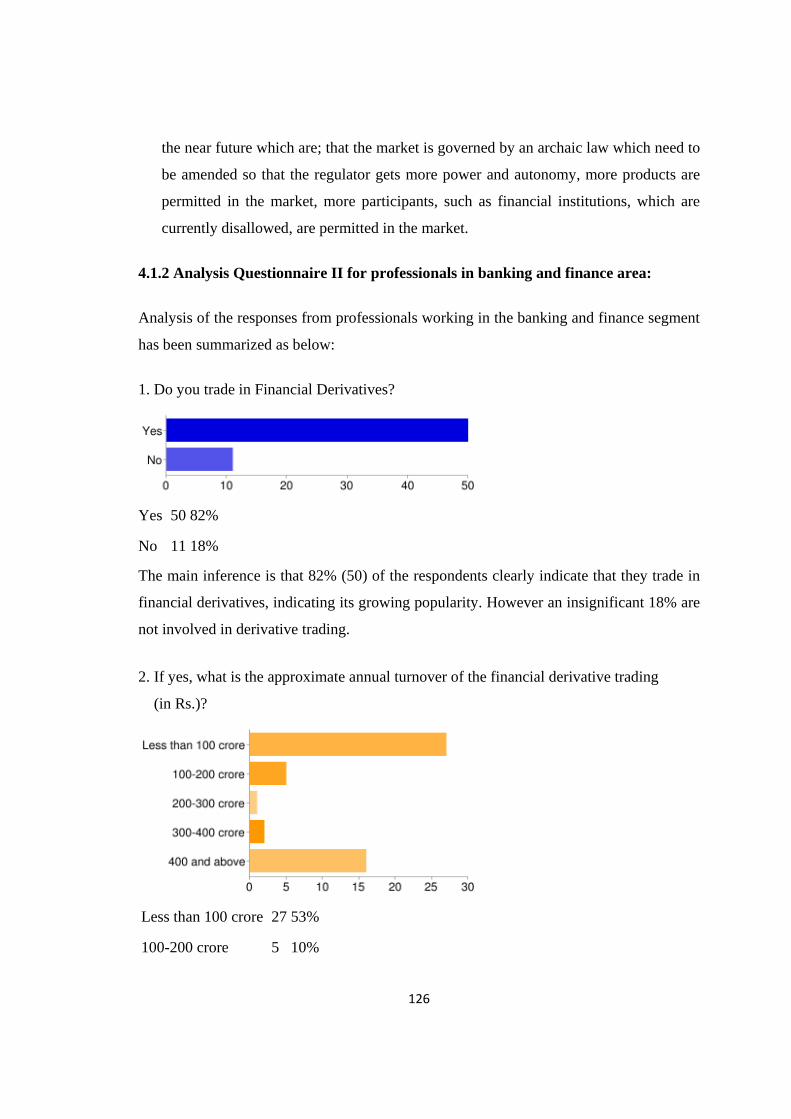
1. Do you trade in Financial Derivatives?
Yes 50 82%
No 11 18%
The main inference is that 82% (50) of the respondents clearly indicate that they trade in
financial derivatives, indicating its growing popularity. However an insignificant 18% are
not involved in derivative trading.
2. If yes, what is the approximate annual turnover of the financial derivative trading
(in Rs.)?
Less than 100 crore 27 53%
100-200 crore 5 10%
127
200-300 crore 1 2%
300-400 crore 2 4%
400 and above 16 31%
In connection with the above question, it has been noted that even though 53% (27) of the
respondents have shown an annual turnover of their financial derivative trading,
comprising less than Rs. 100 crore, it is still noteworthy to find that 31% (16) of the
respondents have indicated their annual turnover of Rs. 400 crore and more. Respondents
trading more than Rs. 400 crore comprise of large investment banks and asset
management companies. Respondents trading in less than Rs. 100 crores comprise of
traders and brokerage firms. Investment banks and other financial institutions trading in
high volumes are more likely to influence and get affected by the market movements.
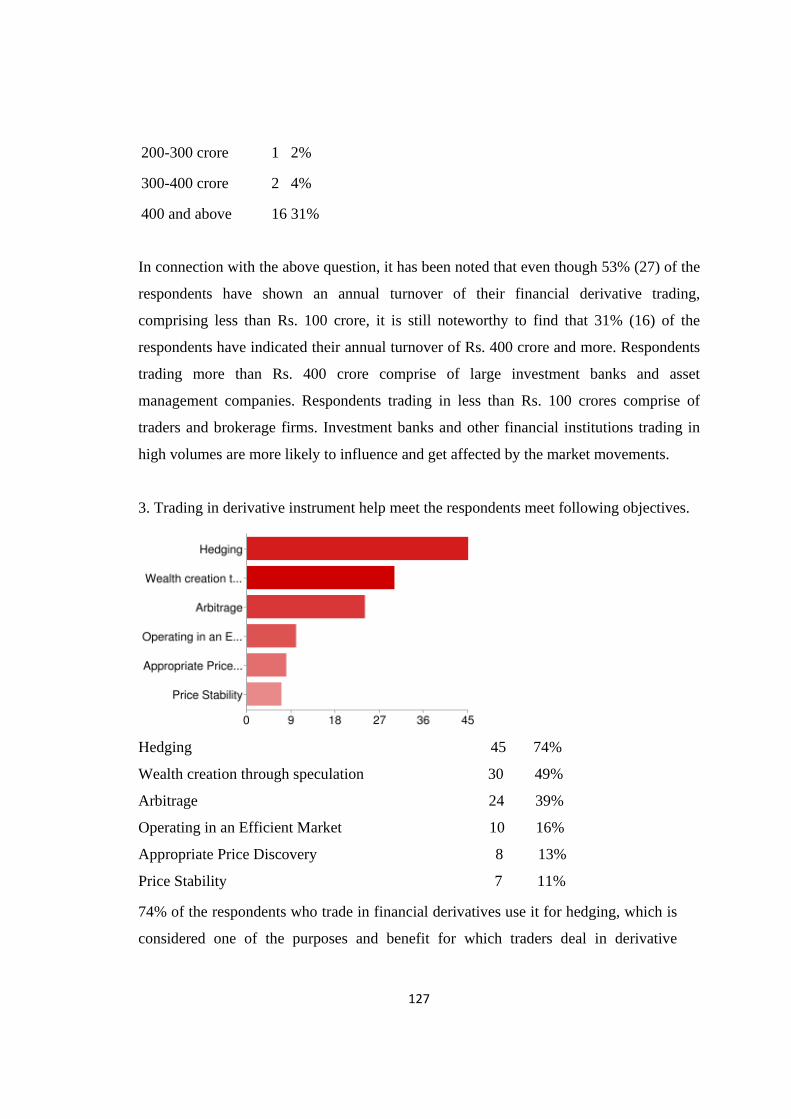
3. Trading in derivative instrument help meet the respondents meet following objectives.
Hedging 45 74%
Wealth creation through speculation 30 49%
Arbitrage 24 39%
Operating in an Efficient Market 10 16%
Appropriate Price Discovery 8 13%
Price Stability 7 11%
74% of the respondents who trade in financial derivatives use it for hedging, which is
considered one of the purposes and benefit for which traders deal in derivative

128
instrument. This also helps us in proving our hypothesis that the functioning of
derivative market is effective. The L C Gupta committee report also indicated that
majority (69.64%) of respondents prefer to enter the derivative market as hedgers.
49% of the respondents benefit in creating wealth through speculation, which also is a
positive sign since markets are made by speculators. 39% use the opportunity of
difference in the prices in the cash market and derivative market as an arbitrage
opportunity. 13% view derivative market as a price discovery opportunity. One of the
theories for an efficient derivative market is a price discovery process. Merely 11%
feel that they look up to derivative market for price stability benefits since the stock
market is a highly volatile and speculative market.
4. The Indian Financial System is efficient and robust.
1 0 0%
2 5 8%
3 22 36%
4 24 39%
5 9 15%
A substantial number of respondent (33) 54% feel that the Indian financial system is
efficient and robust. This inference is considered important since our hypothesis
states that the functioning of our derivative market is effective. Unless a country’s
financial system is efficient and effective, its financial bodies, systems, procedures
and markets may not be considered effective and efficient. This also indicates that
the stake holders have faith in the financial system of India. 36% (22) do not commit
towards commenting on the status of Indian financial system. Either they might
view full potential of Indian financial system emerging in near future or they might

129
feel that the current financial system could be over hauled to reach its full
potentiality. Only 8% (5) of the respondents do not show confidence in the Indian
financial system, which is very miniscule and could be ignored for data analysis.
5. Inefficient Derivative Markets would highly impact the Indian Financial System.
1 3 5%
2 3 5%
3 11 18%
4 19 31%
5 25 41%
72% (44) respondents feel that an inefficient derivative market would highly impact
the Indian financial system. 18% (11) took a neutral stand and would not like to
comment on its impact on the Indian financial system. This could be due to lack of
sufficient data in hand to comment. 8% (6) do not agree that an inefficient derivative
market would highly impact the Indian financial system.
A considerable number of respondents (72%) do feel and are aware of the high risk
and high impact of trading in derivatives. Hence we find that there has been a
considerable caution adopted by Indian regulators to develop and grow derivative
markets in India. Cautious tendencies while introducing a new derivative product,
high margins systems, marked to market profit and losses and a strong exchange
level ombudsman to resolve complaints and disputes with respect to derivative
trading indicate regulator’s commitment to develop the market effectively and
efficiently. All though Indian derivative markets have developed exponentially over
130
the last decade since its introduction in 2000, we have observed that it has been well
regulated without any major crises or defaults in the market. A Chi-square test was
administered to validate the finding, with the Pearson Chi-Square value of 17.733a
which is more than the table value.
A Chi-square test was administered to validate the finding. Although a good
number of respondents (72%) feel that inefficient Derivative Markets would
highly impact the Indian Financial System, the same is also statistically validated
as Pearson Chi-Square value of 31.213b is more than the table value at 95%
confidence interval. It gives us an indication that the Indian financial markets may
have a strong faith in the Indian financial system and the size of the Indian
derivative markets currently witnessed, may affect the functioning of the same.
Test Statistics
4. The Indian Financial
System is efficient and
robust.
5. Inefficient Derivative Markets would highly impact the Indian
Financial System.
17.733a 31.213b
3 4
.000 .000
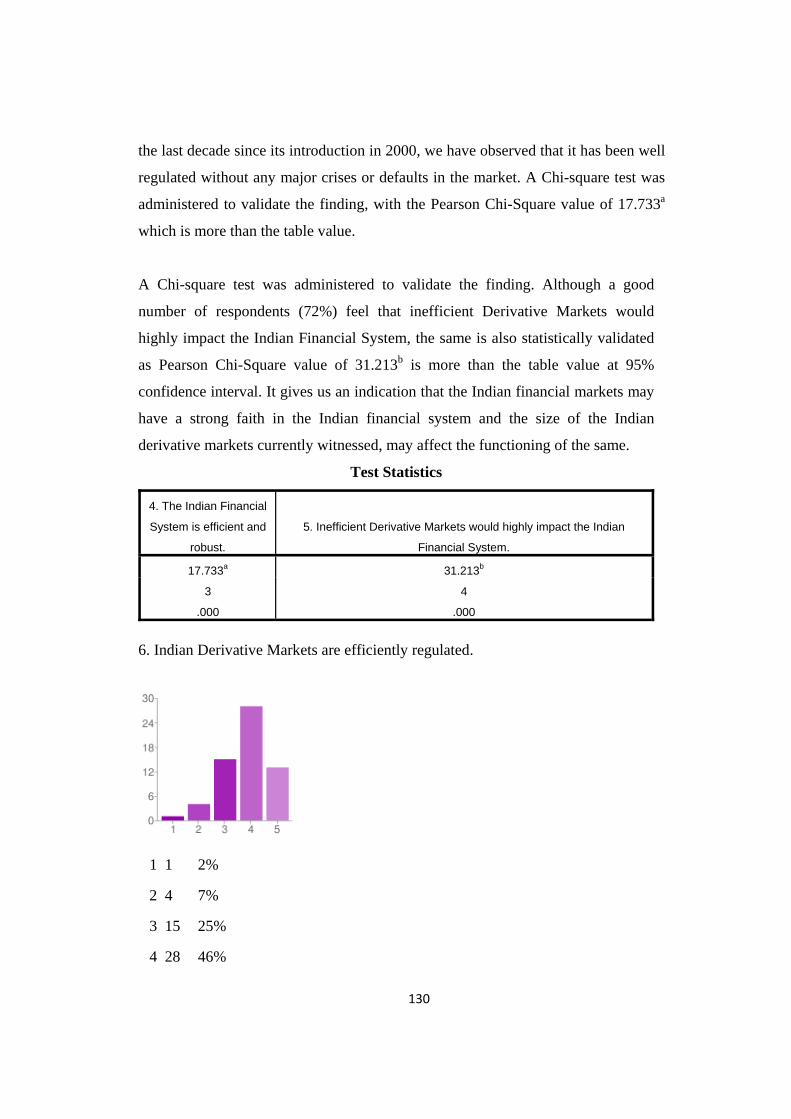
6. Indian Derivative Markets are efficiently regulated.
1 1 2%
2 4 7%
3 15 25%
4 28 46%
131
5 13 21%
67% (41) respondents feel that Indian derivative markets are efficiently regulated. 25%
(15) would not like to comment on the deficiency of the Indian regulators in regulating
our financial markets. A small percentage of 9% (5) respondents feel that Indian
derivative markets are not efficiently regulated. A comparatively high degree of non
committed respondents (25%) might have maintained their status / opinion due to few
financial crises in the Indian stock market which the Indian financial regulators might
have failed to prevent and control. But a lot of water has flown under the bridge since
then. Our financial regulators have evolved, matured and have developed some very
strong systems to curb unnatural tendencies in the market. The regulators also have been
swift in taking actions against the defaulters.
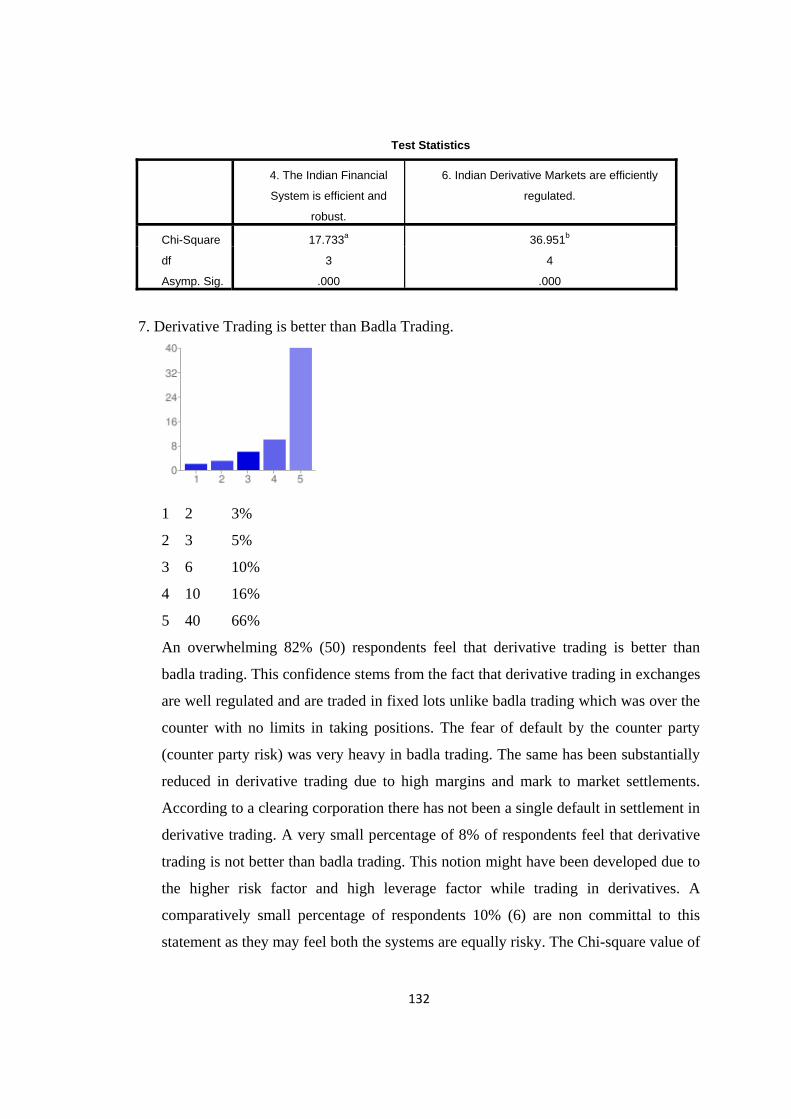
A Chi-square test was administered to validate the finding. A good number of respondents
(67%) feel that Indian Derivative Markets are efficiently regulated, the same is also
statistically validated as Pearson Chi-Square value of 36.951b which is more than the table
value at 95% confidence interval. Although the Chi- square value is high, an effort to
increase confidence and positive feedback by bringing in more efficiency in the market
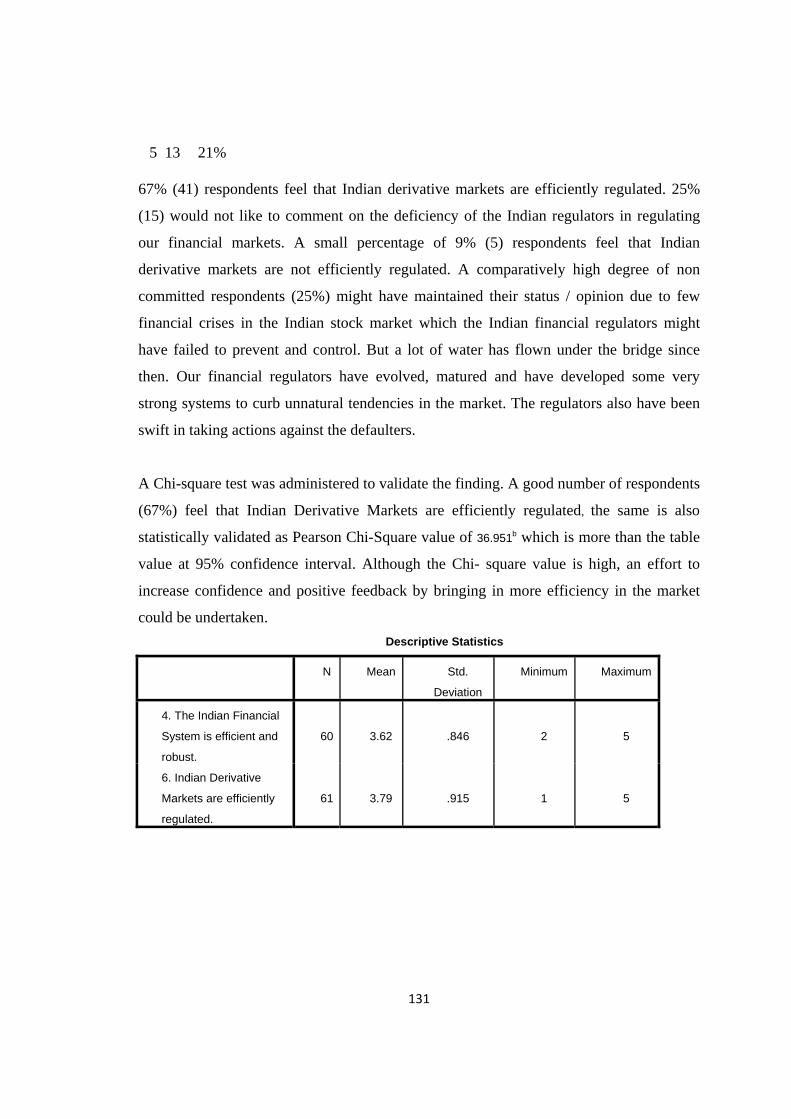
could be undertaken. Descriptive Statistics
N Mean Std.
Deviation
Minimum Maximum
4. The Indian Financial
System is efficient and
robust.
60 3.62 .846 2 5
6. Indian Derivative
Markets are efficiently
regulated.
61 3.79 .915 1 5
132
Test Statistics
4. The Indian Financial
System is efficient and
robust.
6. Indian Derivative Markets are efficiently
regulated.
Chi-Square 17.733a 36.951b
df 3 4
Asymp. Sig. .000 .000
7. Derivative Trading is better than Badla Trading.
1 2 3%
2 3 5%
3 6 10%
4 10 16%
5 40 66%
An overwhelming 82% (50) respondents feel that derivative trading is better than
badla trading. This confidence stems from the fact that derivative trading in exchanges
are well regulated and are traded in fixed lots unlike badla trading which was over the
counter with no limits in taking positions. The fear of default by the counter party
(counter party risk) was very heavy in badla trading. The same has been substantially
reduced in derivative trading due to high margins and mark to market settlements.
According to a clearing corporation there has not been a single default in settlement in
derivative trading. A very small percentage of 8% of respondents feel that derivative
trading is not better than badla trading. This notion might have been developed due to
the higher risk factor and high leverage factor while trading in derivatives. A
comparatively small percentage of respondents 10% (6) are non committal to this
statement as they may feel both the systems are equally risky. The Chi-square value of

133
82.361b is considerably high than the table value, which shows that the Indian stock
markets has taken to derivative trading over badla trading positively.
Descriptive Statistics
N Mean Std.
Deviation
Minimum Maximum
4. The Indian Financial
System is efficient and
robust.
60 3.62 .846 2 5
7. Derivative Trading is
better than Badla
Trading.
61 4.36 1.065 1 5
7. Derivative Trading is better than Badla Trading.
Observed N Expected N Residual
1 2 12.2 -10.2
2 3 12.2 -9.2
3 6 12.2 -6.2
4 10 12.2 -2.2
5 40 12.2 27.8
Total 61
Test Statistics
4. The Indian Financial System is
efficient and robust.
7. Derivative Trading is better than
Badla Trading.
Chi-Square 17.733a 82.361b
df 3 4
Asymp. Sig. .000 .000
8. Derivative Trading has resulted in exposure to high risk.
134
1 2 3%
2 10 16%
3 16 26%
4 18 30%
5 15 25%
55% (33) respondents feel that trading in derivatives is a very risky proposition. This may
be due to volatility and booking of mark to market profit and losses. A downward market
forces a trader or an investor to deposit the deficit in cash or near cash instruments with
the clearing corporation on the same day. This requires a substantial financial holding
capacity in the futures market. Also derivative trading is a high leveraged form of trading
with no exchange or settlement in the shares in which the trader or the investor has
invested his money. The settlement is purely done in cash. Unlike the cash market where
the settlement takes place with an exchange of money with the underlying assets (shares).
19% (12) do not feel that derivative trading results into exposure to high risk. This could
be applicable to exchange regulated derivative trading as they are highly regulated with
strict entry and exist barriers. 26% (16) would not like to comment on its riskiness and
may would rather wait and watch the performance of derivative markets in the near future
to form an opinion whether they are risky or not.
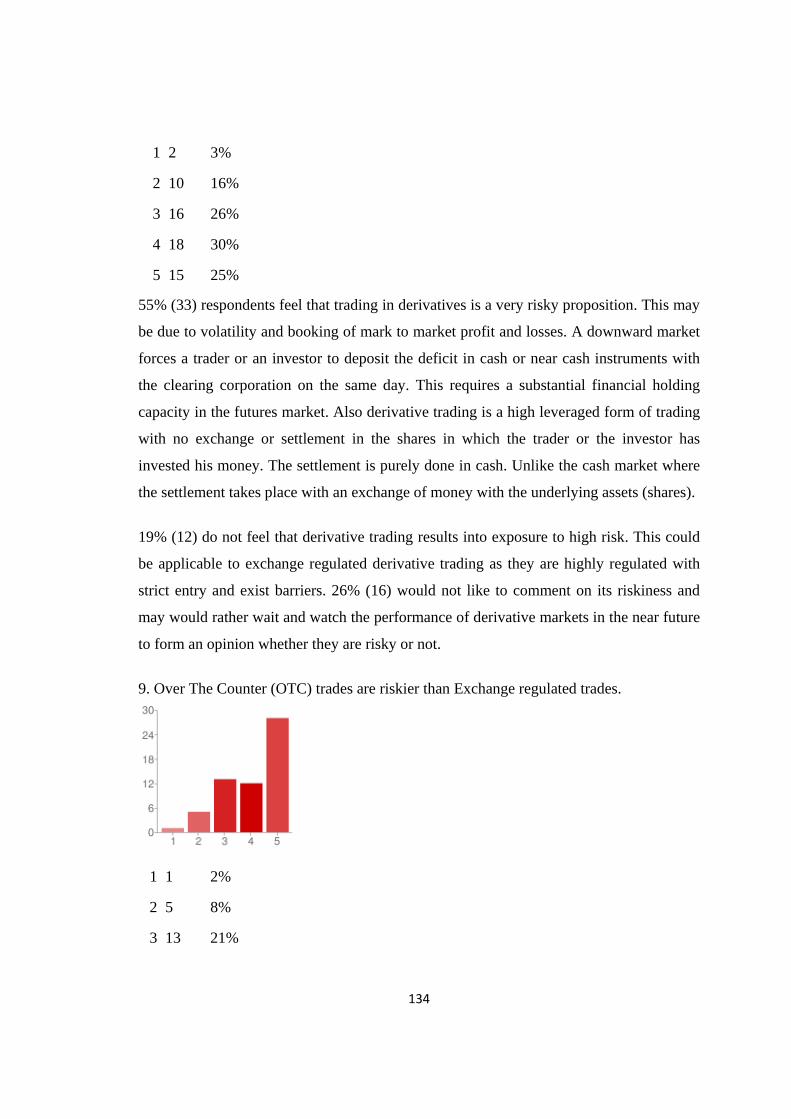
9. Over The Counter (OTC) trades are riskier than Exchange regulated trades.
1 1 2%
2 5 8%
3 13 21%
135
4 12 20%
5 28 46%
66% (40) respondents feel that over the counter trades are riskier than exchange regulated
trades. Hence we observe that in India the equity financial derivative products are quite
basic and are exchange regulated for e.g. index futures, stock futures, index options, stock
options etc. The Indian banking system is no hurry in introducing highly complicated and
complex products like the CDOs and the CDS which are primarily over the counter
derivative products. The Indian financial system / regulators are quite aware of the risk
and complexity involved in trading in such products. The recent sub-prime crises in US in
2007 have made financial regulators over the world more cautious in experimenting with
introduction of highly exotic derivatives products. There is a high degree of counter party
risk in over the counter trading unlike an exchange trading where the counter party risk is
considerably lower due to various measures adopted by the exchange and clearing
corporations to honor the commitments. However a small percentage of respondents
(10%), (6) do not feel that trading in OTC is riskier than exchanges. These respondents
are highly optimistic and may believe in a highly liberalized open market system. 21%
respondents do not wish to comment as they might not have experienced risk in OTC
trades, which is not allowed in India. Hence they may want to reserve their comments till
they experience any crises either in the OTC market or in the exchange regulatory market.
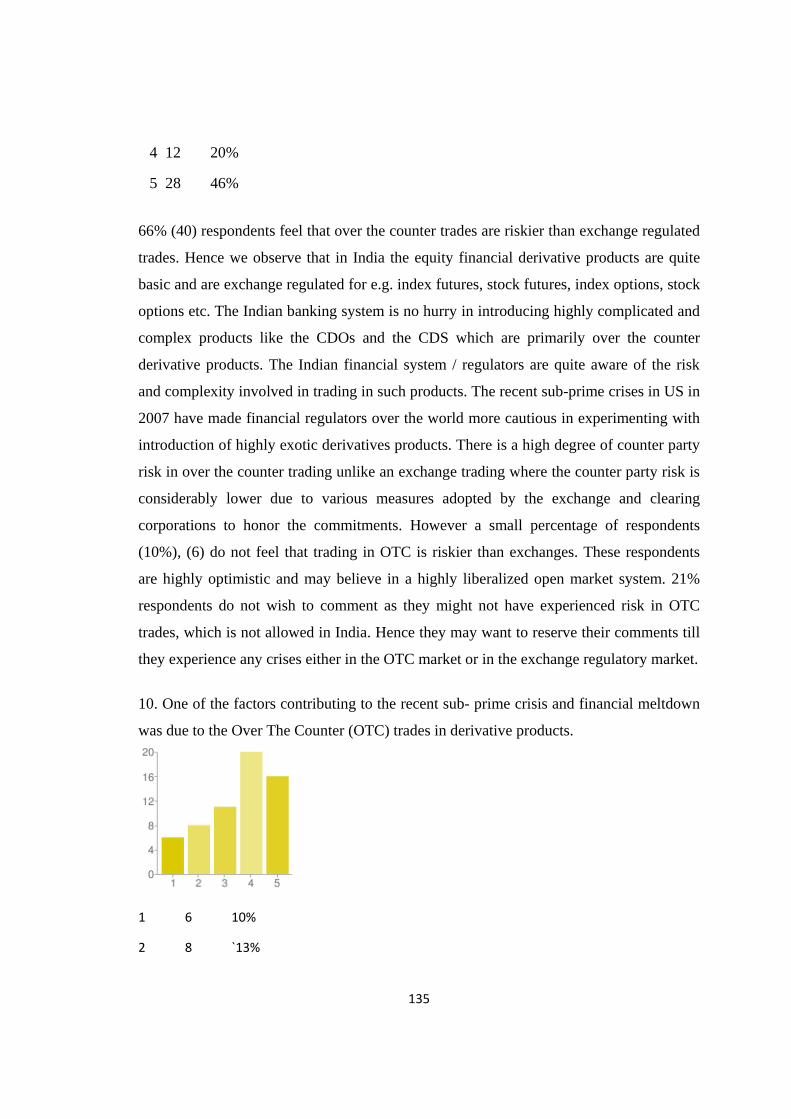
10. One of the factors contributing to the recent sub- prime crisis and financial meltdown
was due to the Over The Counter (OTC) trades in derivative products.
1 6 10%
2 8 `13%

136
3 11 18%
4 20 33%
5 16 26%
69% (36) of the respondents feel that one of the factors contributing to the recent sub-
prime crisis and financial meltdown was due to the Over The Counter (OTC) trades in
derivative products. CDOs and CDS which were highly unregulated over the counter
products triggered the crises due to default by counter parties to the contracts. 23% (14)
do not feel that the subprime crises were a result of the use of OTC derivative product. In
fact their observation is that the crises was due to the erosion of faith and trust in the
whole banking system of the United States of America. The normal practice of interbank
lending and borrowing collapsed due to lack of faith and trust amongst the big bankers.
About 18% (11) respondents are non committal due to the multiple factors which really
created the crises in 2007. Fall of real estate prices worsening, condition of US state
economy and factors like use of uncontrolled plastic money and subsequent defaults, high
trade deficits etc. had already bled the US banking / financial system.
11. What could be the factors from the following which may lead to financial crisis?
137
Introduction of Exotic and complex derivatives products 25 41%
Lack of regulation in Derivative Markets. 37 61%
Lack of regulation in Cash Market 20 33%
Greed 31 51%
Improper use of derivative instruments 36 59%
Inadequate understanding on the use of derivative instruments 37 61%
Human Nature 19 31%
Lack of regulation in OTC derivatives market 29 48%
All of the above 6 10%
Other 6 10%
The respondents were asked about the factors which might lead to financial crises in
the financial system. They were given parameters which have often led to the crises in
the financial system in the past. 40% of the respondents felt that introducing and
experimenting with exotic and complicated derivative products might lead to
transactions which are highly complicated and the implications of which are least
understood.
It really takes efforts to understand the dynamics of trading in basic derivative
products. Introducing exotic products even in a matured market if abused could trigger
financial crises, hence introducing them to an immature market without the basic
understanding of the functioning of the basic derivative product which normally is a
characteristic of a developing market may lead to chaos and confusion.
61% (37) respondents feel that lack of regulation in derivative markets might lead to
financial crises. This percentage is heavier than the respondents who feel that
introduction of exotic products lead to financial crises. One can infer that even exotic
products which are well regulated and managed may add value to growth of a market.
Hence adequate regulation becomes the prime concern in any financial system.
33% (20) respondents feel that even regulation in cash market is equally important to

138
avoid any financial crises in the system. Few crises in the cash market which occurred
with Indian stock market could be a setting example for us to be highly vigilant in the
cash market as well.
50% of the respondents feel that human greed has a capacity to discount and debunk
even an adequately regulated market. Individual greed has played a considerable part in
demolishing the mightiest and wealthiest of the financial institutions around the world.
Many examples have been discussed in chapter no. 2 where human greed has managed
to beat the systems which have been functioning for decades in the past.
12. What could be the factors from the following which may have lead the financial crisis
due to derivatives trading in the past?
Introduction of Exotic and complex derivatives products 25 41%
Lack of regulation in Derivative Markets. 37 61%
Lack of regulation in Cash Market 16 26%
Greed 28 46%
Improper use of derivative instruments 39 64%
Inadequate understanding on the use of derivative instruments 39 64%
Human Nature 14 23%

139
Lack of regulation in OTC Derivatives Market 25 41%
All of the above 6 10%
64% (39) respondents strongly feel that financial crises in the past have been lead by
improper use of derivative instruments. Equal number of respondent feel that inadequate
understanding of derivative instruments have lead to financial crises.
A very recent example in India (news on CNBC TV18 on 26th April 2011,
http://www.moneycontrol.com/video/cnbc-tv18-comments/rbi-penalises-19-banks-for-
violating rulesderivatives_538495.html?utm_source=Article_Vid) has reported fining of
19 national and multinational banks from Rs. 5 lakhs to Rs. 15 lakhs for selling derivative
products to companies which they could not understand and suffered huge losses in 2007
financial crises. The products were banned by RBI hence.
61% (37) feel that lack of regulation in derivative markets have lead to financial crises in
the past. My study of the regulatory structure of Indian derivative (equity) market is based
on this apprehension. 46% (28) feel that greed too played a role in creating crises in the
past.
41% (25) respondents feel that introduction of exotic and complex products failed to be
understood by the markets and market participants lead to financial crises. Equal number
of respondents feel that lack of regulation in over the counter markets have lead to
financial crises. Since these transactions are not standardized, the signs of financial crises
approaching could be missed or misjudged. Hence we find that Indian regulator has taken
considerable lessons from the western countries and have always shown restraint while
introducing a new derivative product. Although over the counter transactions are allowed
in currency markets there has been an attempt by the regulator (RBI) to make them
exchange traded. The recent opening of currency exchange known as the United Stock
Exchange is a step towards this direction. Although only 5% of (Rs. 6000 crores) worth of
trades are conducted on the exchange, it might slowly grow as one of the well developed
currency exchange in the future. MCX and NSE also trade in currency futures. Human
nature (23% - 14) and lack of regulation in cash market (26%-16) comprise of the
140
remaining respondent choices which might have lead to financial crises in the past.
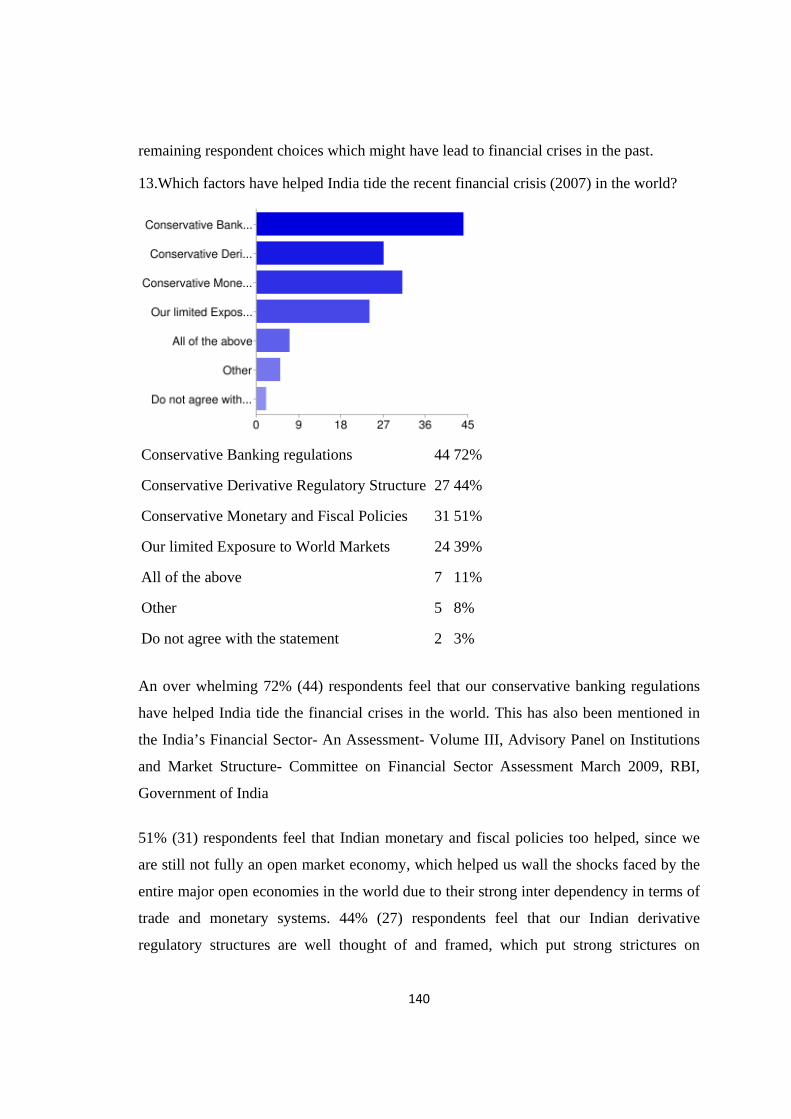
13.Which factors have helped India tide the recent financial crisis (2007) in the world?
Conservative Banking regulations 44 72%
Conservative Derivative Regulatory Structure 27 44%
Conservative Monetary and Fiscal Policies 31 51%
Our limited Exposure to World Markets 24 39%
All of the above 7 11%
Other 5 8%
Do not agree with the statement 2 3%
An over whelming 72% (44) respondents feel that our conservative banking regulations
have helped India tide the financial crises in the world. This has also been mentioned in
the India’s Financial Sector- An Assessment- Volume III, Advisory Panel on Institutions
and Market Structure- Committee on Financial Sector Assessment March 2009, RBI,
Government of India
51% (31) respondents feel that Indian monetary and fiscal policies too helped, since we
are still not fully an open market economy, which helped us wall the shocks faced by the
entire major open economies in the world due to their strong inter dependency in terms of
trade and monetary systems. 44% (27) respondents feel that our Indian derivative
regulatory structures are well thought of and framed, which put strong strictures on
141
market participants and products. Our derivative markets were comparatively less
exposed to crises in the world financial systems. 39% (24) respondents feel that we are
relatively less exposed to world financial markets to be impacted in any major way due to
the financial crises. This also raises a point on how much regulated or opened an economy
should be to protect its own interests. 11% (7) respondents feel that all the above
parameters played role in averting 2007 financial crises in India. 8% (5) respondents feel
that there are other factors which helped avert the crises. And 3% (2) respondents do not
agree with the statement at all. Either they feel that India was faced with the challenge of
financial crises in 2007 or that we failed to control and regulate our financial system as a
result of the crises.
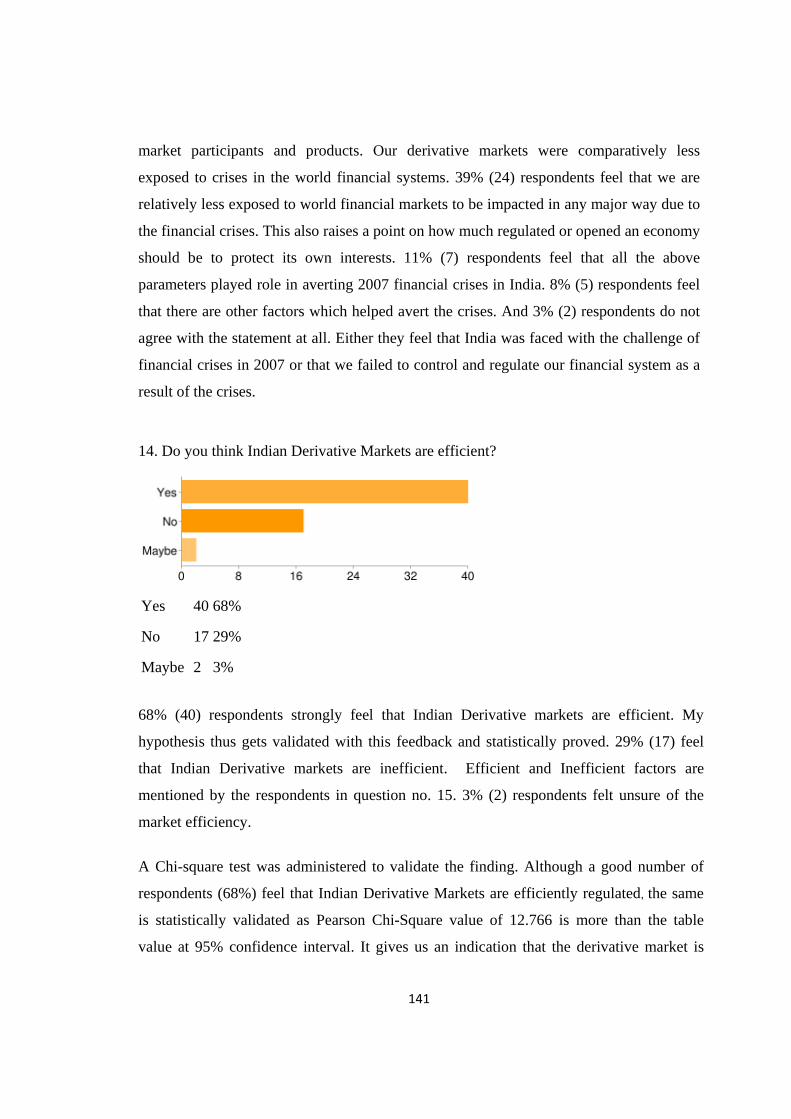
14. Do you think Indian Derivative Markets are efficient?
Yes 40 68%
No 17 29%
Maybe 2 3%
68% (40) respondents strongly feel that Indian Derivative markets are efficient. My
hypothesis thus gets validated with this feedback and statistically proved. 29% (17) feel
that Indian Derivative markets are inefficient. Efficient and Inefficient factors are
mentioned by the respondents in question no. 15. 3% (2) respondents felt unsure of the
market efficiency.
A Chi-square test was administered to validate the finding. Although a good number of
respondents (68%) feel that Indian Derivative Markets are efficiently regulated, the same
is statistically validated as Pearson Chi-Square value of 12.766 is more than the table
value at 95% confidence interval. It gives us an indication that the derivative market is
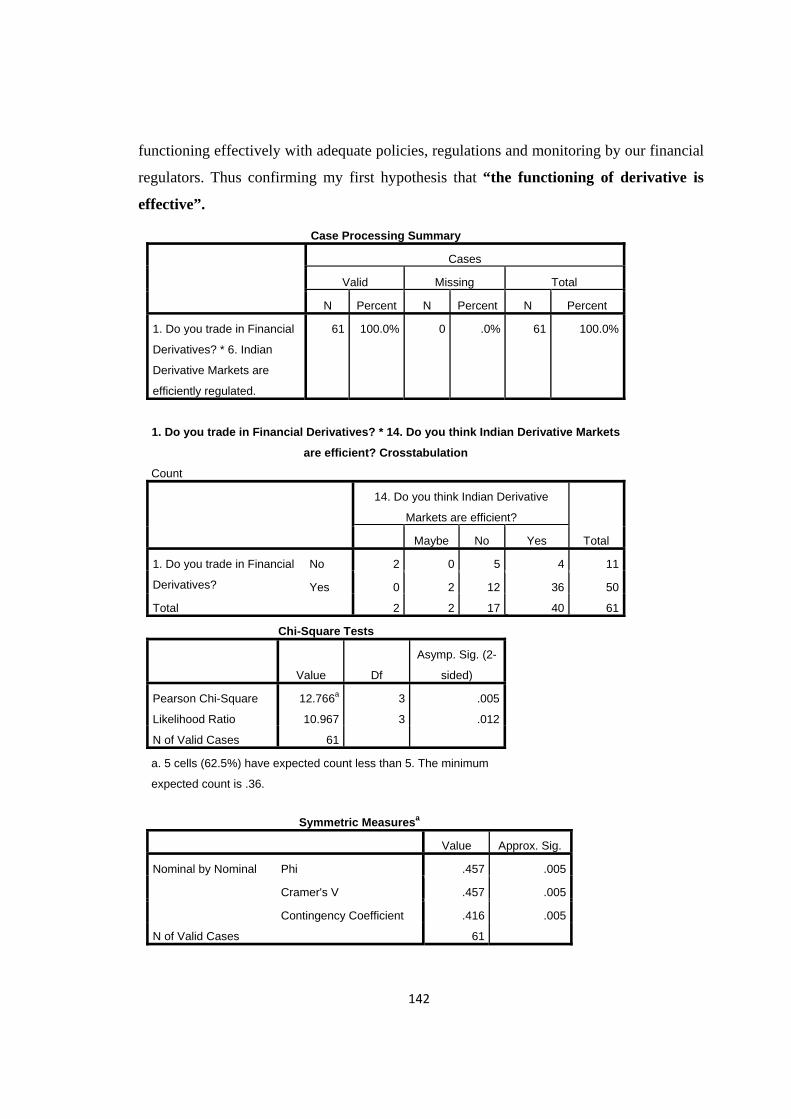
142
functioning effectively with adequate policies, regulations and monitoring by our financial
regulators. Thus confirming my first hypothesis that “the functioning of derivative is
effective”.
Case Processing Summary
Cases
Valid Missing Total
N Percent N Percent N Percent
1. Do you trade in Financial
Derivatives? * 6. Indian
Derivative Markets are
efficiently regulated.
61 100.0% 0 .0% 61 100.0%
1. Do you trade in Financial Derivatives? * 14. Do you think Indian Derivative Markets
are efficient? Crosstabulation
Count
14. Do you think Indian Derivative
Markets are efficient?
Total Maybe No Yes
1. Do you trade in Financial
Derivatives?
No 2 0 5 4 11
Yes 0 2 12 36 50
Total 2 2 17 40 61
Chi-Square Tests
Value Df
Asymp. Sig. (2-
sided)
Pearson Chi-Square 12.766a 3 .005
Likelihood Ratio 10.967 3 .012
N of Valid Cases 61
a. 5 cells (62.5%) have expected count less than 5. The minimum
expected count is .36.
Symmetric Measuresa
Value Approx. Sig.
Nominal by Nominal Phi .457 .005
Cramer's V .457 .005
Contingency Coefficient .416 .005
N of Valid Cases 61
143
15. Please state the factors in either case. Respondents gave the following qualitative
feedback.
The respondents gave two adverse views on the functioning of the derivative markets.
They are summarized as below:
Derivative Markets are efficient:
• Derivative Markets are not overtly aggressive and are progressing conservatively.
• Counter party risk and settlement mechanism is very strong.
• Strong interference and regulatory controls by SEBI.
• Healthy participation from foreign institutional investors (FII).
• Protection of investors by regulating exotic options and privately structured OTC
options by SEBI.
• RBI controlling Banks from designing complex options, which investors may not
fully understand.
• Derivative Markets witness very high volumes except in interest rate derivatives in
equity index, currency, and commodities derivatives which greatly reduces impact
costs and promotes high volumes of trading.
• Due to NIFTY futures trading in Singapore Stock Exchange and Chicago Mercantile
Exchange, where positions are taken in dollars, is greatly attracting foreign investors
to invest in NIFTY Futures.
• Liquidity is extremely good. Good derivative market regulation.
• Efficient risk management by exchanges. The transactions are faster, safer and
properly priced. Equity derivatives are efficient. Proper Margins are there. The
regulators keep revising it.
• The regulators are alert for the client's protection while trading in the derivative
market.
• So far the market has not heard of any fiasco.
• The derivative market functions quite smoothly.
• Price discovery for Options for every change in underlying is swift and promptly
reflected in price of options on screen.

144
• We have market participants playing different roles like arbitrageurs while some
acting as speculators and hedgers. Each of them indirectly serves the purpose of
others. Also margin money and MTM is required to be collected as per exchange
regulations. Compared to volume they are fairly regulated.
• The Indian Markets are online, transparent and relatively well-regulated to the extent
of being a bit over-regulated. The price-discovery is quite realistic given that the
Rupee is still not fully convertible.
Derivative Markets are inefficient:
• There are limited market participants, understanding and volumes are also quite weak,
and this needs to improve for efficient (liquid & deep) derivatives market.
• Need to focus on options for larger participation. Number of players are less, more
players needed.
• No appetite and no tools for pricing and managing derivative instruments.
• Derivatives are important to leverage capital and manage capital risks, in absence of
virtually zero exposure by Indian banks, funding the infrastructure would be a
challenge.
• Indian Markets are not efficient so derivative markets cannot be efficient. Still we
don't have t+ 1 settlement. Now its t+2. Real time gross settlement for bigger ticket
size is there; its not for the smaller ticket size.
• We need to create products which can be easily sold and marketed to the investors- we
only have maximum 3 months contracts in futures which is a pity....stock options are
mostly illiquid and the quantity of stocks in futures are very high and not all of them
are liquid and some of them are really pure speculative stocks.
• Extreme regulation.
• Very little exotic instruments.
• Still a developing market. Still not sufficient liquidity in the market.
• Lack of awareness of derivative products.
• Lack of sufficient strength in the home currency. Limited gold back up.
• Lack of awareness of derivative products, lack of sufficient strength in home currency
due to limited gold backup.

145
• Lack of understanding of the product and market mob flocking mentality.
• Derivatives trading is not broad based and penetration is limited.
• Derivatives are more used for speculation purpose rather than hedging and efficient
price discovery system.
• As an instrument of hedging, it has limited penetration in rural farmers etc.
• Use of vanilla products only.
• Restrictions/ Regulatory oversight.
• The markets do not have depth.
• Multiple regulators, multiple and different objectives among policy makers.
• Turnover velocity of shares in Indian Market is much lower than the other markets.
• Lack of depth was a major issue in Indian Market. However, we are witnessing great
improvements in liquidity in the recent years. Participation of larger number of
Institutional Investors would improve the overall liquidity.
16. Following factors help regulate the derivatives market efficiently.
High Margins 21 35%
Maintenance of High Net worth by brokers/ traders 21 35%
Periodic Audits and Reporting 39 65%

146
Adequate awareness generation of dynamics of derivative trading 38 63%
Monitoring of high volume/ value trades 38 63%
Monitoring Speculative tendencies 21 35%
Ensuring basic compliance for competent Market Participants 36 60%
Periodic Training to Market Participants 23 38%
All of the above 8 13%
Other 1 2%
65% (39) respondents feel that periodic audits and reporting are essential to control and
regulate the activities of traders in the derivative market. It can help the regulators to
detect and regulate any non compliance and omissions. The audits could be facilitated by
SEBI or a third party. Specialized trained audit teams could be built for the purpose. 63%
(38) respondents feel that an adequate awareness has to be generated amongst traders and
investors to understand the dynamics of derivative trading. It is very essential since a
derivative product is structured differently than any other investment options, which are
understood by a layman. Investing in a fixed deposit / postal deposit requires relatively
lesser education than may be investing in a derivative product to a person who is aware of
the dynamics of managing money.
63% (38) respondents feel that a very close scrutiny on abnormal trades in terms of high
value and volume has to be carried out since these are the indicators of either cornering
the market or taking a position which is against the dynamics of the market.
60% (36) respondents feel that ensuring basic compliance for competent Market
Participants. The regulator should ensure that the market participants’ like traders, brokers
etc. should fulfill some basic criteria to enable to trade in the derivative markets. This
might include ensuring high net worth, minimum education on the dynamics on the
derivative trading, background check and credibility etc.
38% (23) respondents feel that the players in the derivative markets need to be given
periodic training for better compliance. Education and awareness generation should be a
147
continual exercise which would motivate and guide market participants towards an
efficient process and system.
Not a very high degree of 35% (21) respondents feel that high margins and high net worth
may be effective measures for efficient markets. The percentage of respondents who feel
the same is not very high since they believe that efficiency can be brought by periodic
compliance and awareness generation.
13% (2) respondents feel that all the factors mentioned are important for a market to run
efficiently and 2% (1) feel that there could be other factors which may contribute towards
an efficient market.
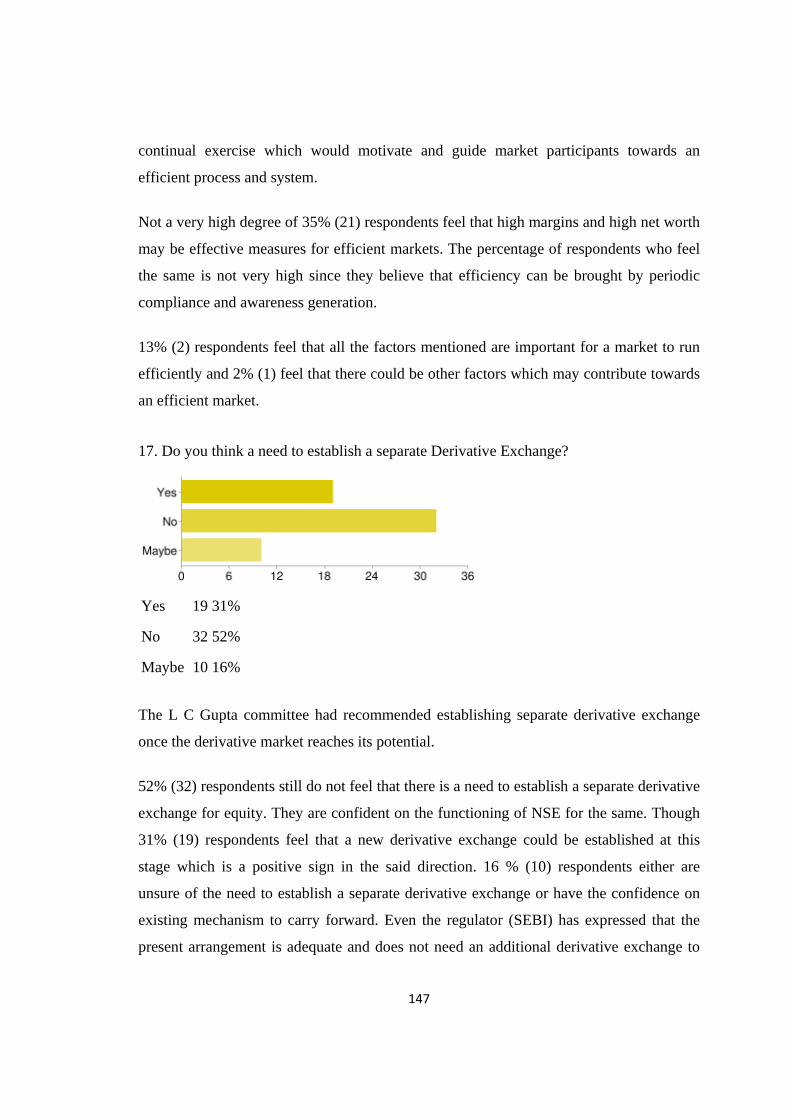
17. Do you think a need to establish a separate Derivative Exchange?
Yes 19 31%
No 32 52%
Maybe 10 16%
The L C Gupta committee had recommended establishing separate derivative exchange
once the derivative market reaches its potential.
52% (32) respondents still do not feel that there is a need to establish a separate derivative
exchange for equity. They are confident on the functioning of NSE for the same. Though
31% (19) respondents feel that a new derivative exchange could be established at this
stage which is a positive sign in the said direction. 16 % (10) respondents either are
unsure of the need to establish a separate derivative exchange or have the confidence on
existing mechanism to carry forward. Even the regulator (SEBI) has expressed that the
present arrangement is adequate and does not need an additional derivative exchange to
148
facilitate derivative trades.
A good number of respondents (52%) feel that there is no need to establish a separate
derivative exchange. It gives us an indication that the financial markets find the present
arrangement of the derivative exchange as adequate to meet the current requirement.
Hence as per the L C Gupta’s recommendation committee report for a separate derivative
exchange as and when the markets are ready, the feedback indicates that the market is not
ready for a separate derivative exchange.
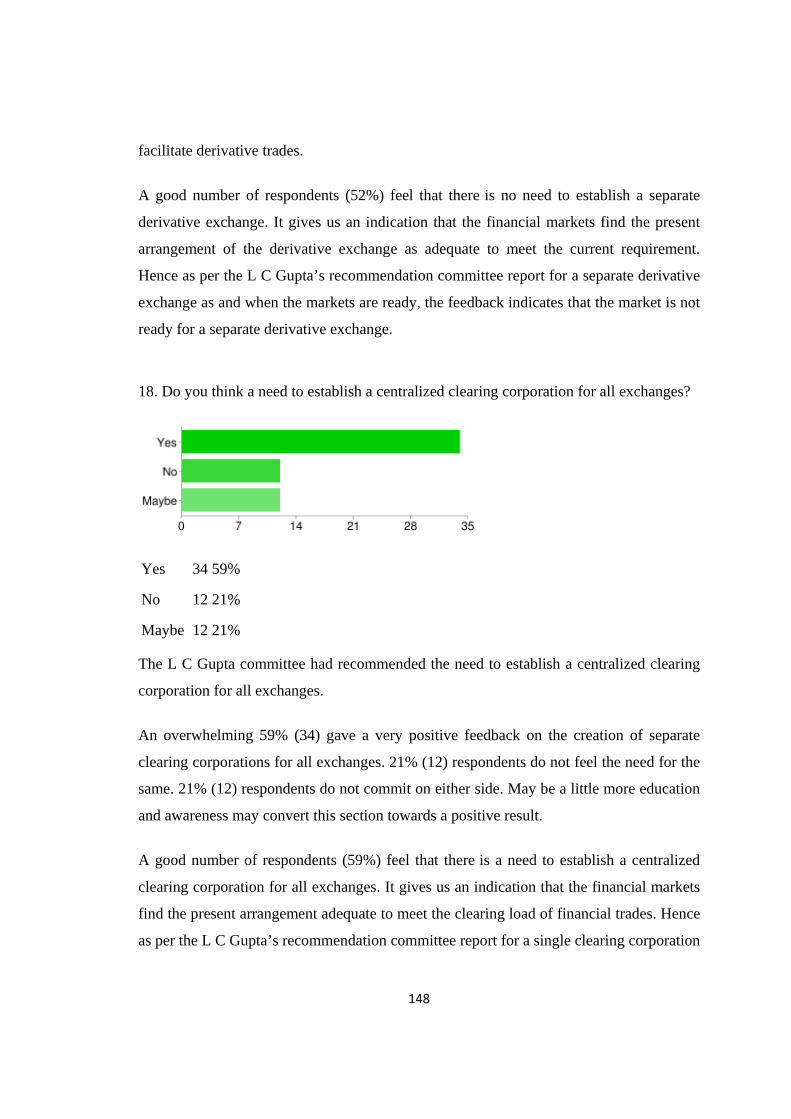
18. Do you think a need to establish a centralized clearing corporation for all exchanges?
Yes 34 59%
No 12 21%
Maybe 12 21%
The L C Gupta committee had recommended the need to establish a centralized clearing
corporation for all exchanges.
An overwhelming 59% (34) gave a very positive feedback on the creation of separate
clearing corporations for all exchanges. 21% (12) respondents do not feel the need for the
same. 21% (12) respondents do not commit on either side. May be a little more education
and awareness may convert this section towards a positive result.
A good number of respondents (59%) feel that there is a need to establish a centralized
clearing corporation for all exchanges. It gives us an indication that the financial markets
find the present arrangement adequate to meet the clearing load of financial trades. Hence
as per the L C Gupta’s recommendation committee report for a single clearing corporation

149
when the markets are ready, the feedback indicates that the market is still not ready / feel
the need for a single clearing corporation. It may also be due to the apprehension that it
could be a risky proposition to bring all financial trades under one roof. A small deviation
in the running of the corporation may risk the trades of the whole financial system.
19. Derivative Trades under exchanges are well regulated.
1 0 0 %
2 1 2%
3 16 26%
4 27 44%
5 16 26%
An overwhelming 70% (43) agree that derivatives trade under exchanges are better
regulated which is supporting my hypothesis that derivative markets are effective. 26%
(16) do not wish to commit on the effectiveness of the regulation under exchanges, only
2% (1) do not agree that derivative traders under exchange are well regulated. This
observation could be ignored in view of a very positive outlook of the respondents toward
exchange regulated trades.
A Chi-square test was administered to validate the finding. A good number of respondents
(70%) feel that Derivative Trades under exchanges are well regulated, the same is also
statistically validated as Pearson Chi-Square value of 22.800a which is more than the
table value at 95% confidence interval. It gives us a positive indication that the
functioning of the derivative markets are realistic thus confirming my first hypothesis that
“the functioning of derivative is effective”.
150
Descriptive Statistics
N Mean Std. Deviation Minimum Maximum
4. The Indian Financial
System is efficient and
robust.
60 3.62 .846 2 5
19. Derivative Trades under
exchanges are well
regulated.
60 3.97 .780 2 5
Test Statistics
4. The Indian
Financial
System is
efficient and
robust.
19. Derivative
Trades under
exchanges are
well regulated.
Chi-Square 17.733a 22.800a
df 3 3
Asymp. Sig. .000 .000
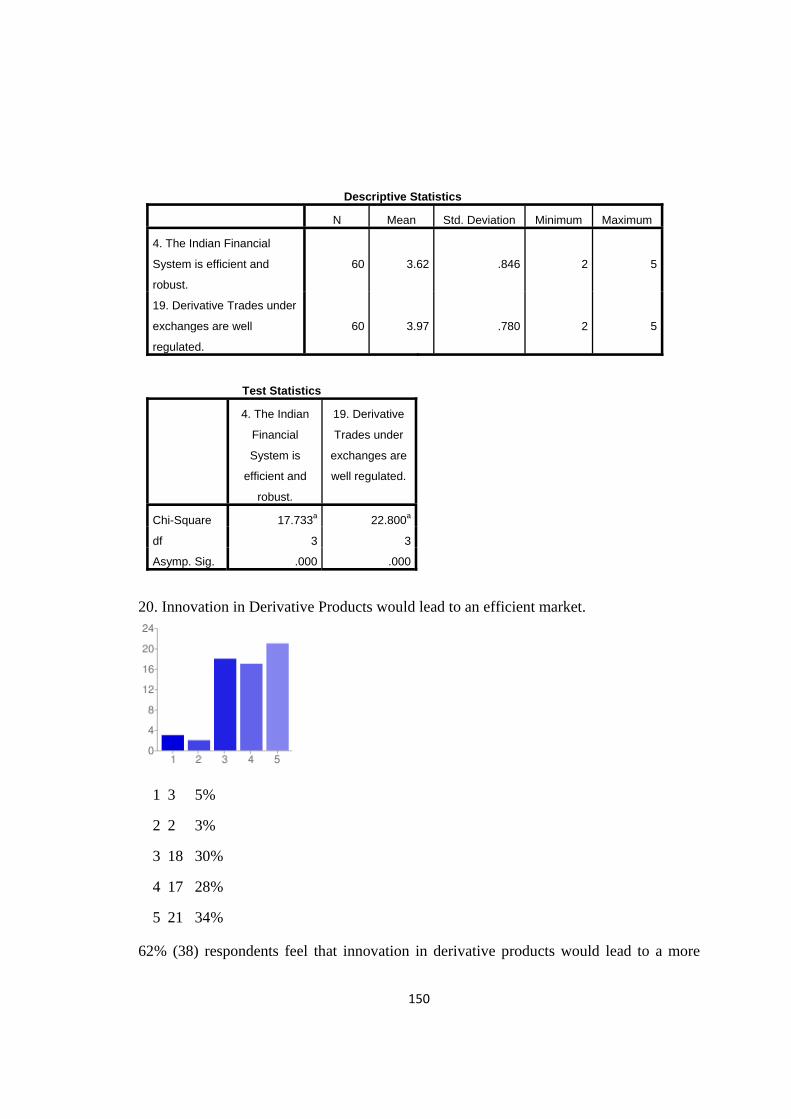
20. Innovation in Derivative Products would lead to an efficient market.
1 3 5%
2 2 3%
3 18 30%
4 17 28%
5 21 34%
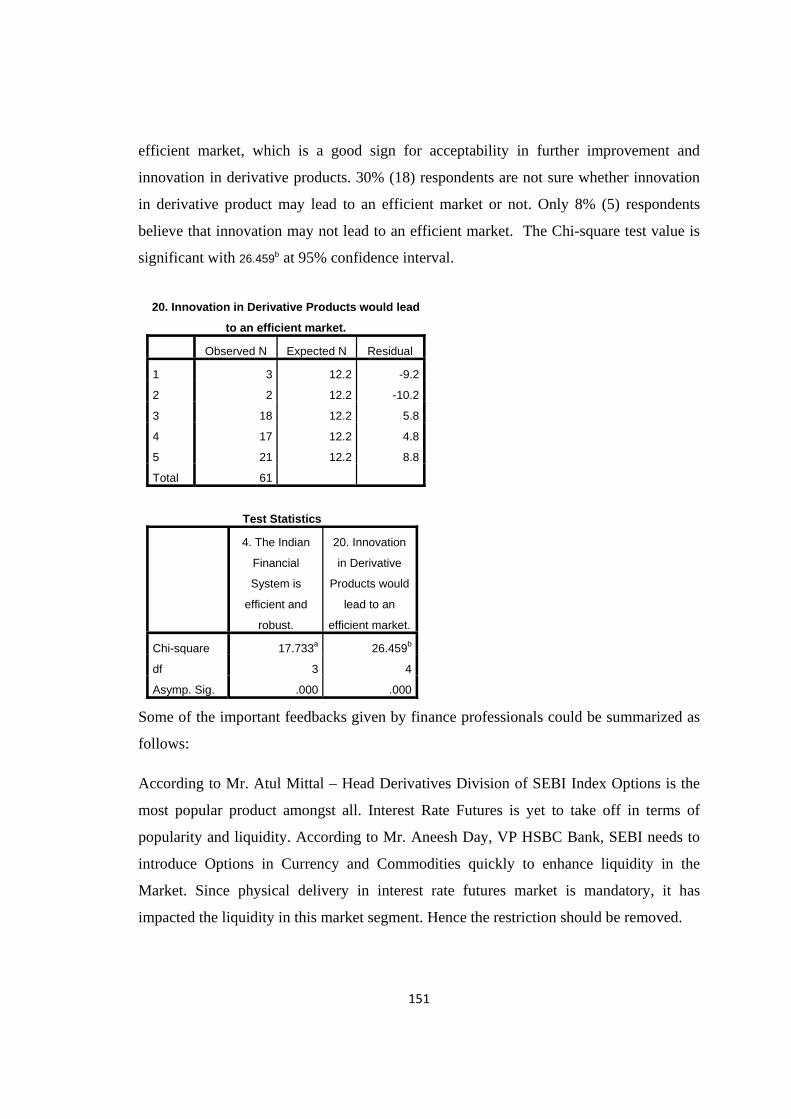
62% (38) respondents feel that innovation in derivative products would lead to a more
151
efficient market, which is a good sign for acceptability in further improvement and
innovation in derivative products. 30% (18) respondents are not sure whether innovation
in derivative product may lead to an efficient market or not. Only 8% (5) respondents
believe that innovation may not lead to an efficient market. The Chi-square test value is
significant with 26.459b at 95% confidence interval.
20. Innovation in Derivative Products would lead
to an efficient market.
Observed N Expected N Residual
1 3 12.2 -9.2
2 2 12.2 -10.2
3 18 12.2 5.8
4 17 12.2 4.8
5 21 12.2 8.8
Total 61
Test Statistics
4. The Indian
Financial
System is
efficient and
robust.
20. Innovation
in Derivative
Products would
lead to an
efficient market.
Chi-square 17.733a 26.459b
df 3 4
Asymp. Sig. .000 .000
Some of the important feedbacks given by finance professionals could be summarized as
follows:
According to Mr. Atul Mittal – Head Derivatives Division of SEBI Index Options is the
most popular product amongst all. Interest Rate Futures is yet to take off in terms of
popularity and liquidity. According to Mr. Aneesh Day, VP HSBC Bank, SEBI needs to
introduce Options in Currency and Commodities quickly to enhance liquidity in the
Market. Since physical delivery in interest rate futures market is mandatory, it has
impacted the liquidity in this market segment. Hence the restriction should be removed.
152
Other feedbacks include that the Indian derivatives market is relatively small compared to
global markets. It is primarily exchange driven (OTC portions is smaller) and therefore
may be considered efficient on a standalone basis (i.e. without comparison with other
global markets). Derivative market is more speculative and is used more for speculative
gains rather than hedging. RBI persuades bankers and participants to go cautiously in
derivatives in view of bad experiences of many corporate losing money without proper
understanding of product and market.
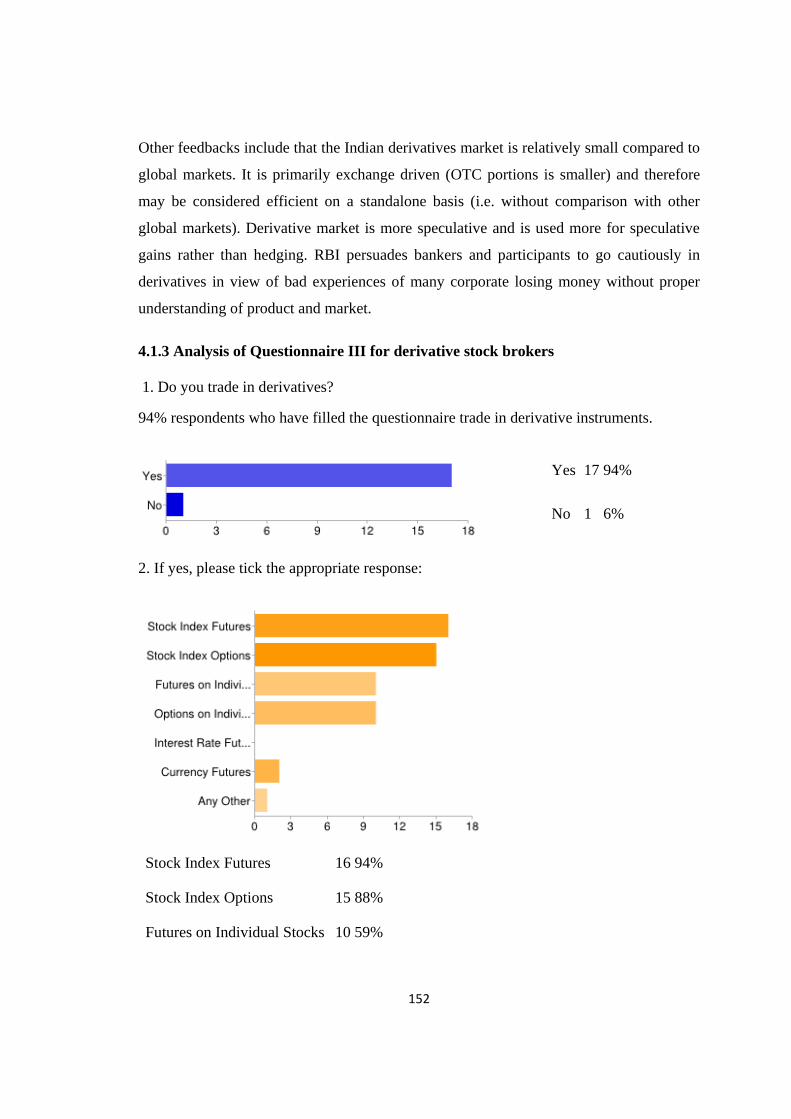
4.1.3 Analysis of Questionnaire III for derivative stock brokers
1. Do you trade in derivatives?
94% respondents who have filled the questionnaire trade in derivative instruments.
Yes 17 94%
No 1 6%
2. If yes, please tick the appropriate response:
Stock Index Futures 16 94%
Stock Index Options 15 88%
Futures on Individual Stocks 10 59%
153
Options on Individual Stocks 10 59%
Interest Rate Futures 0 0%
Currency Futures 2 12%
Any Other 1 6%
94% respondents trade in Stock index Futures and 88% respondents trade in Stock Index
Options. The least popular instrument is Interest Rate Futures (0%).
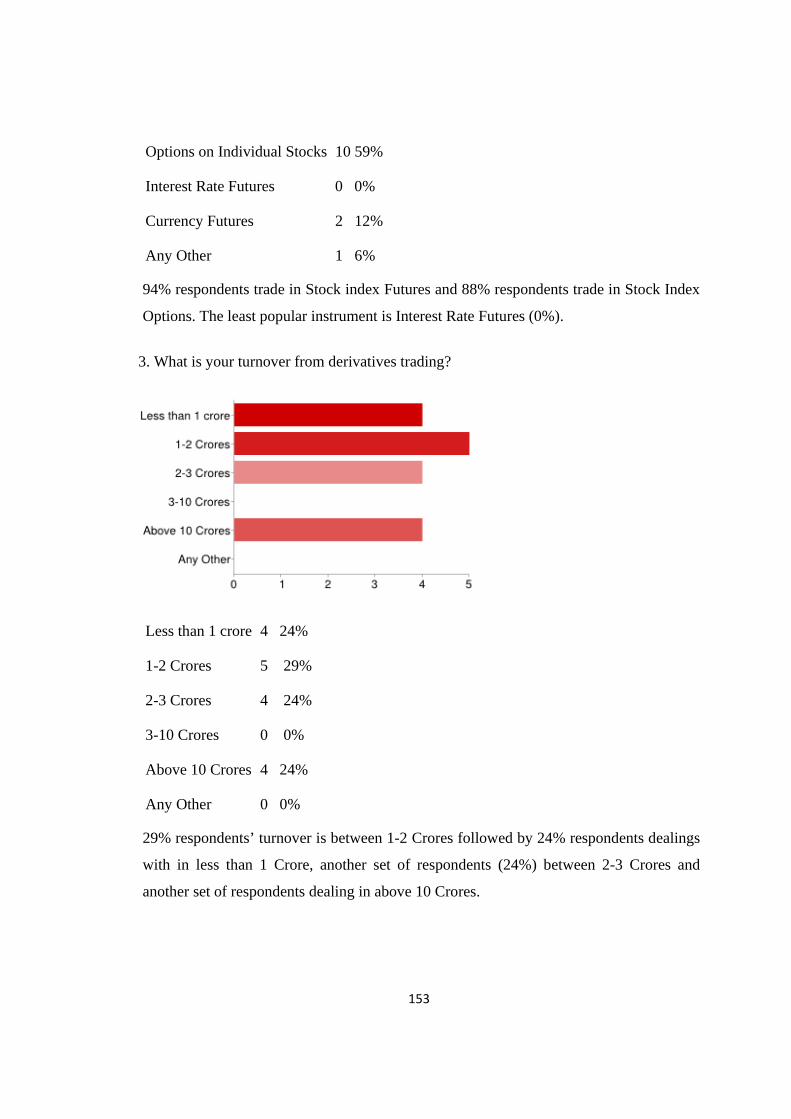
3. What is your turnover from derivatives trading?
Less than 1 crore 4 24%
1-2 Crores 5 29%
2-3 Crores 4 24%
3-10 Crores 0 0%
Above 10 Crores 4 24%
Any Other 0 0%
29% respondents’ turnover is between 1-2 Crores followed by 24% respondents dealings
with in less than 1 Crore, another set of respondents (24%) between 2-3 Crores and
another set of respondents dealing in above 10 Crores.
154
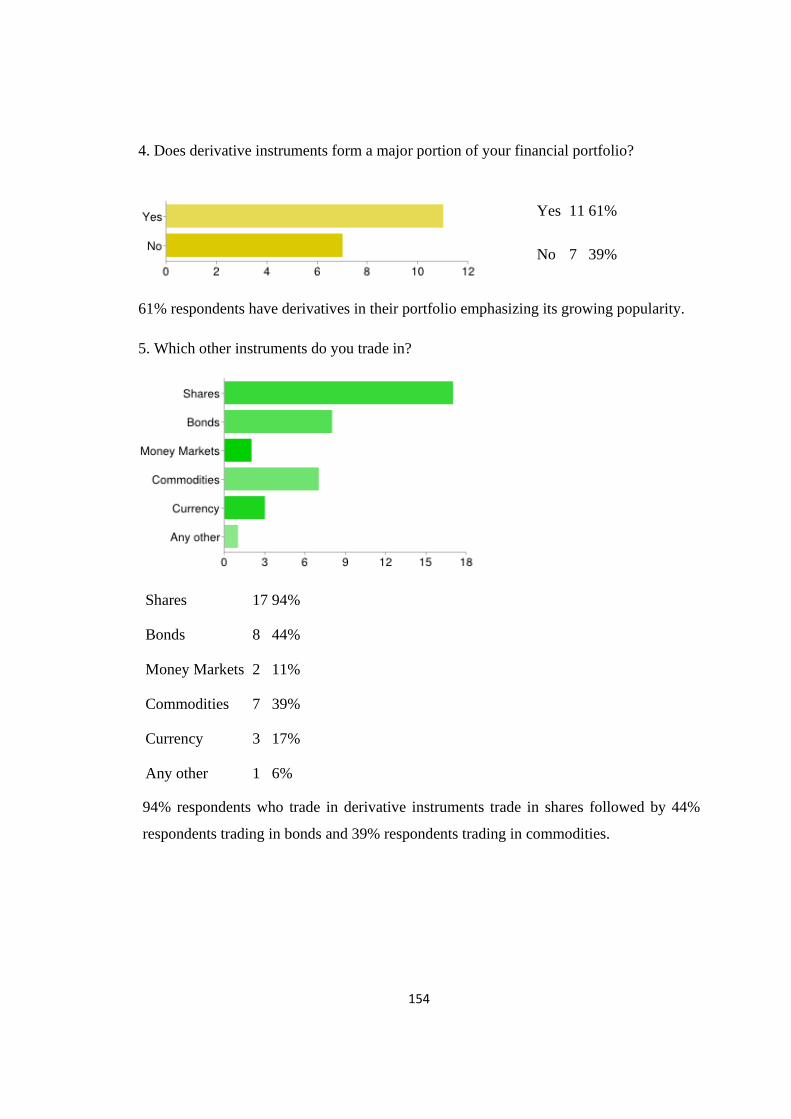
4. Does derivative instruments form a major portion of your financial portfolio?
Yes 11 61%
No 7 39%
61% respondents have derivatives in their portfolio emphasizing its growing popularity.
5. Which other instruments do you trade in?
Shares 17 94%
Bonds 8 44%
Money Markets 2 11%
Commodities 7 39%
Currency 3 17%
Any other 1 6%
94% respondents who trade in derivative instruments trade in shares followed by 44%
respondents trading in bonds and 39% respondents trading in commodities.
155
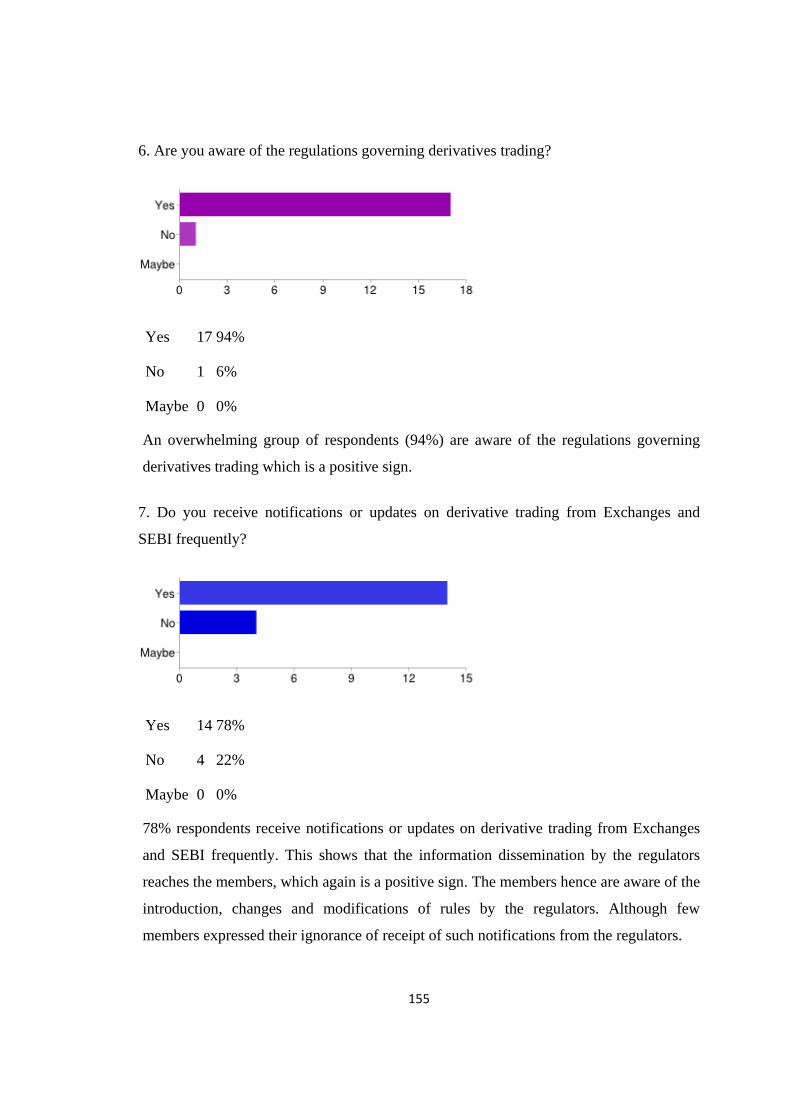
6. Are you aware of the regulations governing derivatives trading?
Yes 17 94%
No 1 6%
Maybe 0 0%
An overwhelming group of respondents (94%) are aware of the regulations governing
derivatives trading which is a positive sign.
7. Do you receive notifications or updates on derivative trading from Exchanges and
SEBI frequently?
Yes 14 78%
No 4 22%
Maybe 0 0%
78% respondents receive notifications or updates on derivative trading from Exchanges
and SEBI frequently. This shows that the information dissemination by the regulators
reaches the members, which again is a positive sign. The members hence are aware of the
introduction, changes and modifications of rules by the regulators. Although few
members expressed their ignorance of receipt of such notifications from the regulators.

156
8. Do you have to be qualified in trading in derivative instruments?
Yes 11 61%
No 7 39%
Maybe 0 0%
Although it’s mandatory to be a qualified derivatives trader, there are around 39%
respondents who are not aware of this requirement, which is a factor to look into and
amend. More awareness may need to be generated of this requirement and a strict
compliance needs to be imposed.
9. Were you trained in trading of derivative instruments?
Yes 11 61%
No 7 39%
Maybe 0 0%
Although it’s mandatory to be a qualified derivatives trader, there are around 39%
respondents who are not trained derivatives traders, which is a factor to look into and
amend. More awareness and training programmes may need to be conducted to capture
such audience.

157
10. Do you undergo training in derivatives trading from time to time?
Yes 9 50%
No 8 44%
Maybe 1 6%
Only 50% respondents undergo training periodically. 44% respondents do not undergo
training in derivatives trading periodically. A training schedule with training needs
should be published annually to benefit members of the same.
11. If yes, how frequently?
Quarterly 4 36%
Semi Annually 1 9%
Annually 4 36%
More than a year 2 18%
Two groups (36% respondents each) of respondents undergo training quarterly and
annually respectively. The periodicity of training should be increased and have a
continuous flow throughout the year.
158
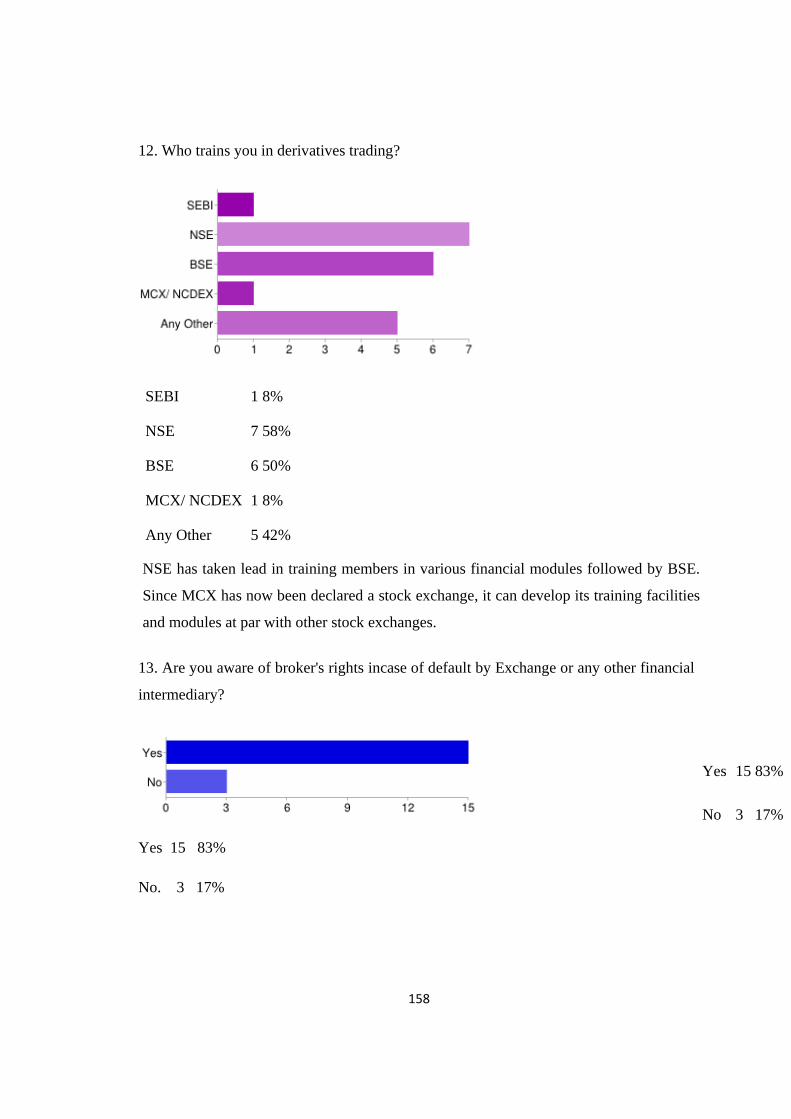
12. Who trains you in derivatives trading?
SEBI 1 8%
NSE 7 58%
BSE 6 50%
MCX/ NCDEX 1 8%
Any Other 5 42%
NSE has taken lead in training members in various financial modules followed by BSE.
Since MCX has now been declared a stock exchange, it can develop its training facilities
and modules at par with other stock exchanges.
13. Are you aware of broker's rights incase of default by Exchange or any other financial
intermediary?
Yes 15 83%
No. 3 17%
Yes 15 83%
No 3 17%

159
An overwhelming 83% respondents are aware of their legal rights in case of disputes
with financial intermediaries. This is a positive sign. But we also should not ignore the
17% population with less or no awareness. We should make an effort to convert them
into legally literate members.
14. Do you sensitize your investors on the risk of derivatives trading?
Yes 11 61%
No 7 39%
This factor is very important. Only 61% respondents follow sensitizing investors on the
risk of derivatives trading. The same should be 100% compliance from the members. An
initiative in the form an audit or inspection from the exchanges should be undertaken
exclusively to find out on the compliance of this regulation.
15. If yes, then how?
The respondents’ responses are summarized as below:
• Personalized approach to risk return profile analysis for all clients.
• Explaining the risks involved orally and through the risk document attached as
Know Your Customer (KYC) norm. Explaining the clients that their entire
principal amount could be whitewashed, if the trades are not done diligently.
• Risk Disclosure document is given to the client for reference. The Risk Disclosure
Document (RDD) is given to the client along with the account opening form.
16. Which are the statutory regulatory clauses are you concerned with closely and need to
comply with without exception?
• Margin Compliance to be complied without exception.
• Regular confirmation to clients about the trades undertaken.

160
• Account opening formalities and KYC (Know Your Client) Norms;
• Networth requirements; Maintenance of books and records; and Issue of Contract
Notes
17. What percentage of your customers/ clients of yours, trade in derivative instruments?
Less than 10% 5 28%
10%-20% 7 39%
20%-30% 3 17%
30%-40% 1 6%
Above 40% 2 11%
We find that around 10- 20% clients’ trade in derivative instruments followed by less
than 10% clients who wish to trade in derivative instruments. The percentages do not
seem to be very high may be due to lack of awareness of the dynamics of derivative
trading unlike share trading.
18. How would you categorize them in terms of investment capacities?
High Net Worth 11 61%
Medium 9 50%
Small 0 0%

161
Around 61% investors are high net worth individuals who deal in derivative instruments.
There are hardly any small investors who invest in these instruments. This may be due to
many reasons like investing in lots, awareness, risk, ignorance, complexity etc.
19. How much do you charge your investors?
Less than 10% 13 76%
10%-20% 4 24%
20%-30% 0 0%
30%-40% 2 12%
76% investors are charged less than 10% of the trade profit. Around 24% respondents
charged between 10-20%. And around 12% respondents charged between 30-40% which
could be for additional financial consultancy and advise.
20. How much margin do you extend to your investors?
Less than 1 Crore 8 53%
1-2 Crore 5 33%
More than 2 Crore 2 13%
The majority of investors (53%) are extended less than 1 crore as margin money
followed by 33% investors being extended 1 -2 crores as margin money. We find that the
majority of investors trade in moderation with less than 1 crore margin payment. We find
162
that they play safe with their investment.
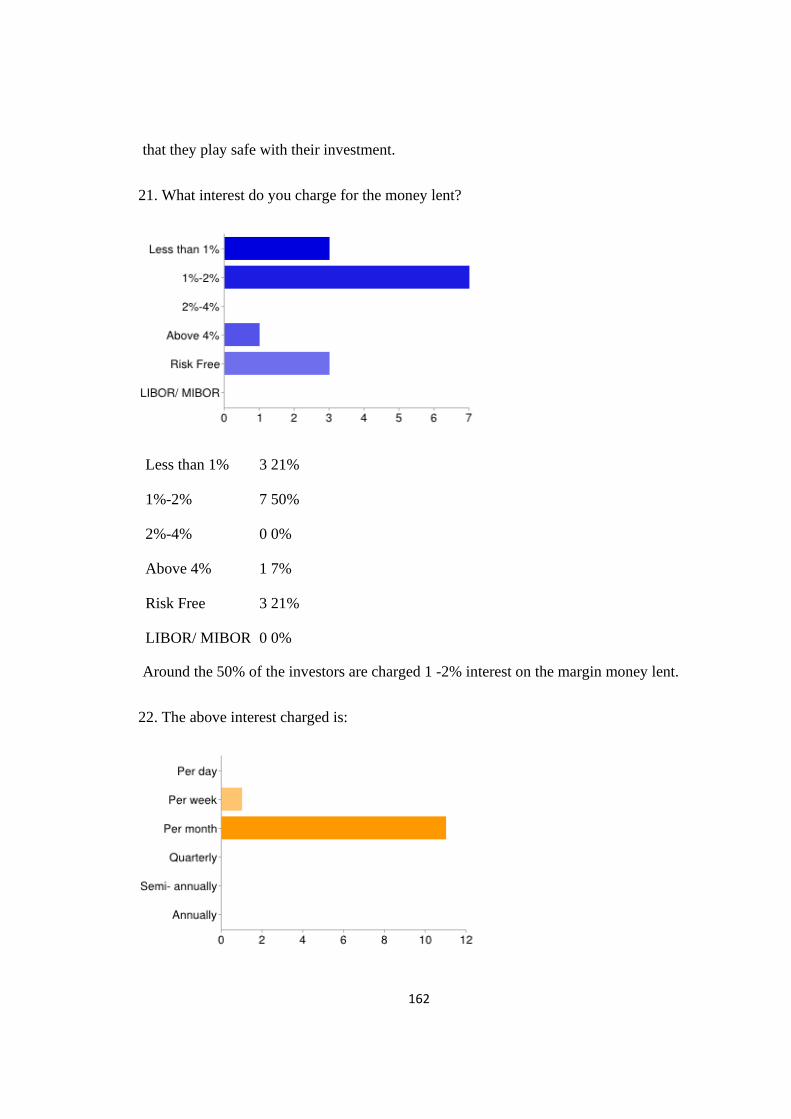
21. What interest do you charge for the money lent?
Less than 1% 3 21%
1%-2% 7 50%
2%-4% 0 0%
Above 4% 1 7%
Risk Free 3 21%
LIBOR/ MIBOR 0 0%
Around the 50% of the investors are charged 1 -2% interest on the margin money lent.
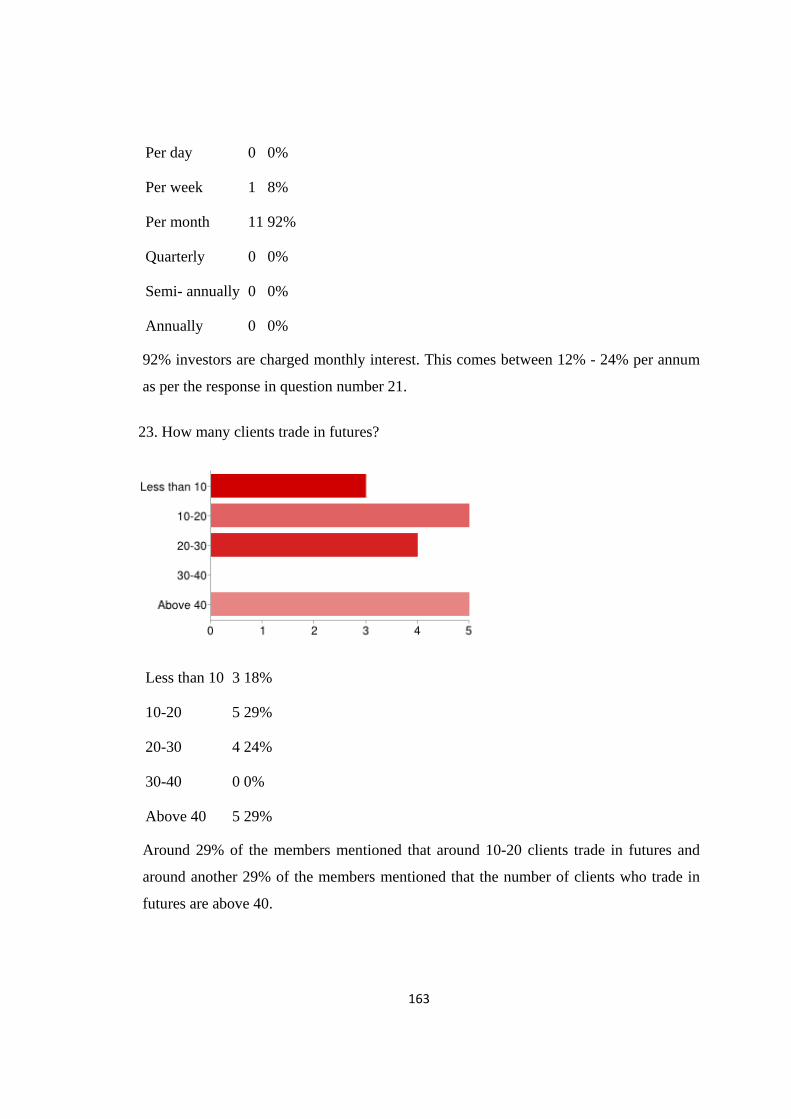
22. The above interest charged is:
163
Per day 0 0%
Per week 1 8%
Per month 11 92%
Quarterly 0 0%
Semi- annually 0 0%
Annually 0 0%
92% investors are charged monthly interest. This comes between 12% - 24% per annum
as per the response in question number 21.
23. How many clients trade in futures?
Less than 10 3 18%
10-20 5 29%
20-30 4 24%
30-40 0 0%
Above 40 5 29%
Around 29% of the members mentioned that around 10-20 clients trade in futures and
around another 29% of the members mentioned that the number of clients who trade in
futures are above 40.

164
24. How many clients trade in options?
Less than 10 3 18%
10-20 3 18%
20-30 3 18%
30-40 3 18%
Above 40 5 29%
Around 18% of the members mentioned that around 10-20 clients trade in options and
around another 29% of the members mentioned that the number of clients who trade in
options are above 40
25. Derivative instruments are fully useful to hedge risks.
1 0 0%
2 3 15%
3 5 25%
4 3 15%
5 7 35%
35% of respondents feel that derivative instruments are useful to hedge risk. This
validates our hypothesis that derivative markets are realistic since one of the major

165
functions of a derivative market is to hedge risk. Its note worthy to find that no
respondents feel that derivative trading do not aid in hedging risk.
26. How are Derivative instruments useful/ not useful to hedge risks? Suggest changes, if
required.
Following is the summary of the responses:
Neutral view can always use derivatives to hedge our core portfolio risk. If we have a
portfolio, one could hedge the risk by index future and reduce the risk. By taking a
position in the futures market that is opposite to a position in Cash market, the risks
associated with price changes are limited or reduced. Derivatives help leverage and
arbitrage in the underlying equities. It can hedge the position to the fullest.
27. Derivative Instruments help in earning wealth.
1 1 5%
2 2 10%
3 10 50%
4 2 10%
5 1 5%
50% of respondents neither agree nor disagree to the statement that derivative instruments
help in wealth creation. Only 15% respondents feel that it helps in wealth creation. This
factor is important since it conveys that derivative instruments are helpful in hedging and
transferring risk rather than earning unlimited wealth.
28. How are Derivative Instruments useful/ not useful in earning wealth.
The responses are summarized as follows:
• Neutral view if used effectively and very useful otherwise could be disastrous.
• They help remove the systematic risk.

166
29. Do you have an international exposure in trading in derivative instruments?
Yes 1 6%
No 16 94%
An over whelming majority (94%) stated that they do not have an international exposure
in derivative trading. This reflects that our derivative markets are less integrated and
exposed to international derivative markets. In a way it helps us insulate from the
fluctuations and volatility in the international markets. But it also disadvantages our
markets to gain from the benefits, which exists (in terms of price, volume, technology etc)
in international markets.
30. If yes, please tick the appropriate choice:
Stock Index Futures 0 0%
Stock Index Options 1 100%
Futures on Individual Stocks 0 0%
Options on Individual Stocks 0 0%
Interest rate Futures 0 0%
Currency Futures 0 0%
167
Any other 0 0%
100% respondent (1) has an international exposure in stock index option which reflects
that Indian derivative trades are not internationally exposed.
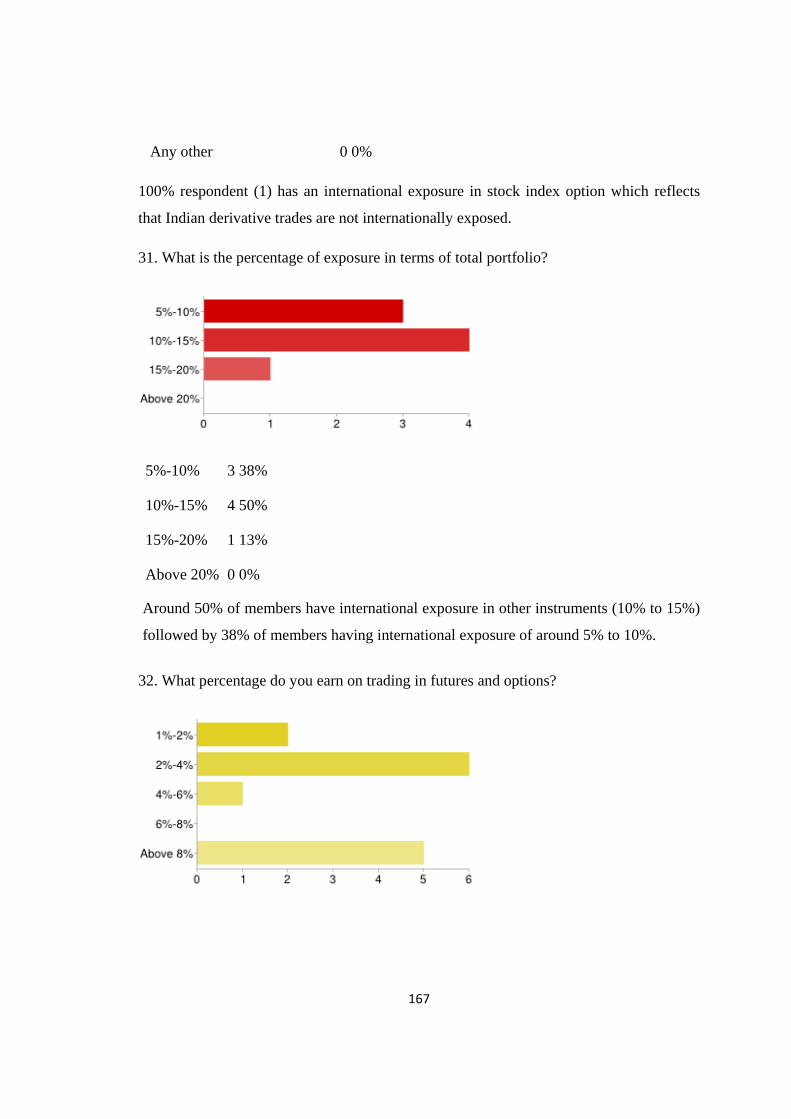
31. What is the percentage of exposure in terms of total portfolio?
5%-10% 3 38%
10%-15% 4 50%
15%-20% 1 13%
Above 20% 0 0%
Around 50% of members have international exposure in other instruments (10% to 15%)
followed by 38% of members having international exposure of around 5% to 10%.
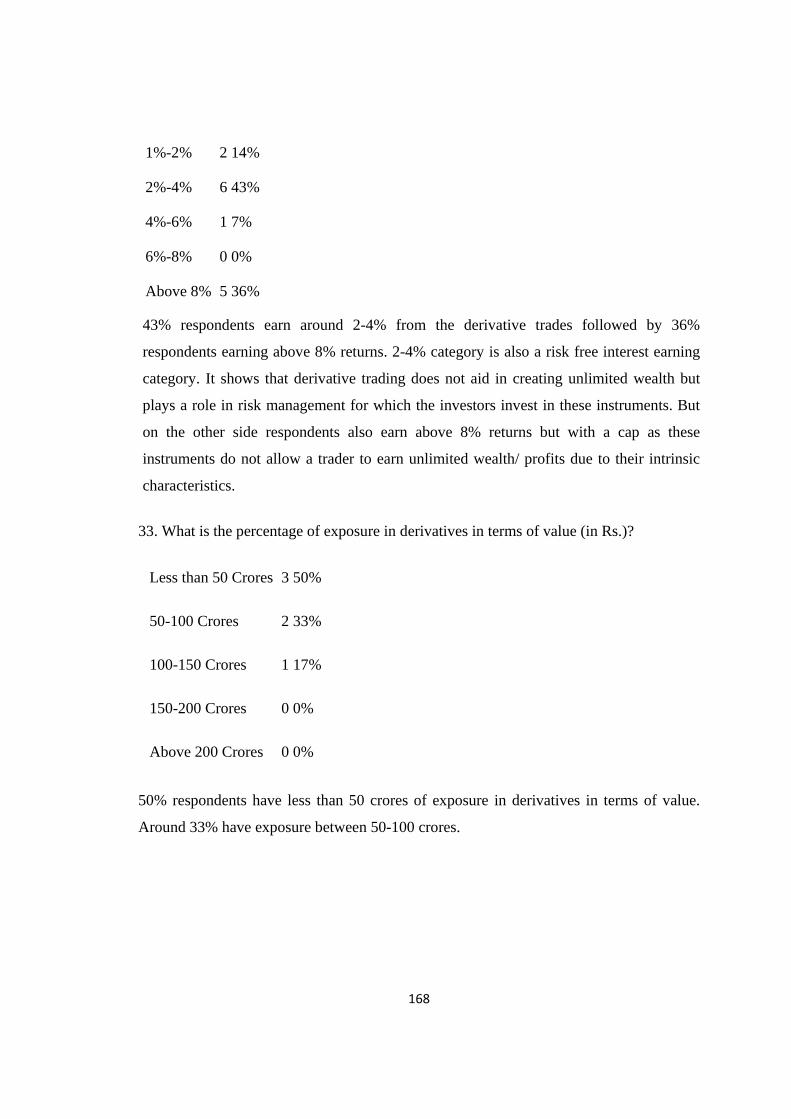
32. What percentage do you earn on trading in futures and options?
168
1%-2% 2 14%
2%-4% 6 43%
4%-6% 1 7%
6%-8% 0 0%
Above 8% 5 36%
43% respondents earn around 2-4% from the derivative trades followed by 36%
respondents earning above 8% returns. 2-4% category is also a risk free interest earning
category. It shows that derivative trading does not aid in creating unlimited wealth but
plays a role in risk management for which the investors invest in these instruments. But
on the other side respondents also earn above 8% returns but with a cap as these
instruments do not allow a trader to earn unlimited wealth/ profits due to their intrinsic
characteristics.
33. What is the percentage of exposure in derivatives in terms of value (in Rs.)?
Less than 50 Crores 3 50%
50-100 Crores 2 33%
100-150 Crores 1 17%
150-200 Crores 0 0%
Above 200 Crores 0 0%
50% respondents have less than 50 crores of exposure in derivatives in terms of value.
Around 33% have exposure between 50-100 crores.

169
34. Do you finance your requirement from Banks and other Financial Institutions?
Yes 7 41%
No 10 59%
Around 59% of respondents do not finance their requirements from banks or other
financial institutions. This may be because banks are not allowed to extend money for
stock trading activities. Although 41% do finance their requirements from the financial
institutions. This may be in the form of pledge or loan against their securities.
35. If yes, what is the percentage of your borrowing vis-a vis your own contribution?
Less than 10% 3 30%
10%-20% 6 60%
20%-30% 1 10%
30%-40% 0 0%
Above 40% 0 0%
60% of respondent borrow only 10-20% of their financial requirements and contribute
around 80-90% personal wealth, which shows their personal commitment towards
trading in derivatives. This acts as a confidence measure for the investors and the
exchange alike.

170
36. Investors usually trade in derivatives for:
Hedging 10 59%
Speculating 16 94%
Arbitrage 6 35%
Loss covering 3 18%
94% investors trade in derivatives for speculation along with hedging purposes. A broker
usually brings this sentiment into the market which activates trade volume.
37. Indian Banks and Financial Institutions are efficient.
1 2 10%
2 3 15%
3 6 30%
4 5 25%
5 1 5%
40% respondents feel that Indian Banks and Financial Institutions are efficient. 30% do
not commit. And around 25% do not agree. As per the recent news report in Indian
Express dated Wednesday September 26 2012 Indian Banks are robust and are insulated
from international turbulences due to limited exposure and control on products which are
risky. They follow conservative operational practices but are efficient in handling huge

171
customer base of India.
38. Indian Banks and Financial Institutions operational functions need overhauling.
1 0 0%
2 3 15%
3 8 40%
4 2 10%
5 4 20%
30% respondents feel that Indian Banks and Financial Institutions operational functions
need overhauling. 40% neither agree nor disagree with the statement. Only 15% feel that
there is a need for overhauling. This may be due to their personal experiences which may
not be satisfactory and hence the notion.
39. Do you interact with international brokers?
Yes 1 6%
No 16 94%
94% respondents do not interact with international brokers, which reflect that our Indian
brokers have limited exposure of international markets and equity derivative segments. It
reflects that our markets are insulated from the financial movements and turbulences
directly. Although it may follow the trends and patterns as reflected in the international
markets.

172
40. Do you face any operational difficulties while executing derivative transactions?
Yes 1 6%
No 15 94%
An overwhelming 94% respondent feels that they do not face any operational difficulties
while executing derivative transactions. This is a very positive sign which reflects the
operational efficiency of the exchanges. The aspect of operational efficiency is important
since it facilitates volume of trade and participation by large number of players in the
market.
41. Please mention difficulties, if any.
The respondents summarized that-Margin requirements are more stringent. They should
be simplified.
42. Indian derivative markets are transparent and investor friendly.
1 0 0%
2 6 30%
3 4 20%
4 7 35%
5 0 0%
35% respondents agree that Indian derivative markets are transparent and investor
friendly. 30% do not agree with the statement and 20% do not commit. The above data
reflects that efforts should be made towards making the derivative market transparent and
investor friendly. A detailed study could be made to understand the steps required for
creating a transparent and investor friendly environment.

173
43. Indian derivative markets are operated differently from international derivative
markets.
1 1 5%
2 5 25%
3 8 40%
4 3 15%
5 0 0%
Only 15% respondents feel that Indian derivative markets are operated differently from
international derivative markets. No respondent highly agrees to the statement. 40%
respondents neither agree nor disagree to the statement. This may be due to lack of
international exposure of our derivative markets. Our derivatives markets yet to fully get
integrated in terms of technology and trade with the international in the equity derivative
segment. Since there are limited scripts being traded in the domestic derivative segment
with less exposure to international environment.
44. Indian derivative markets are influenced by international players.
1 1 5%
2 2 10%
3 5 25%
4 4 20%
5 5 25%
45% agree that Indian derivative markets are influenced by international players. This
may be due to the participation of institutional investors and now mutual funds in the
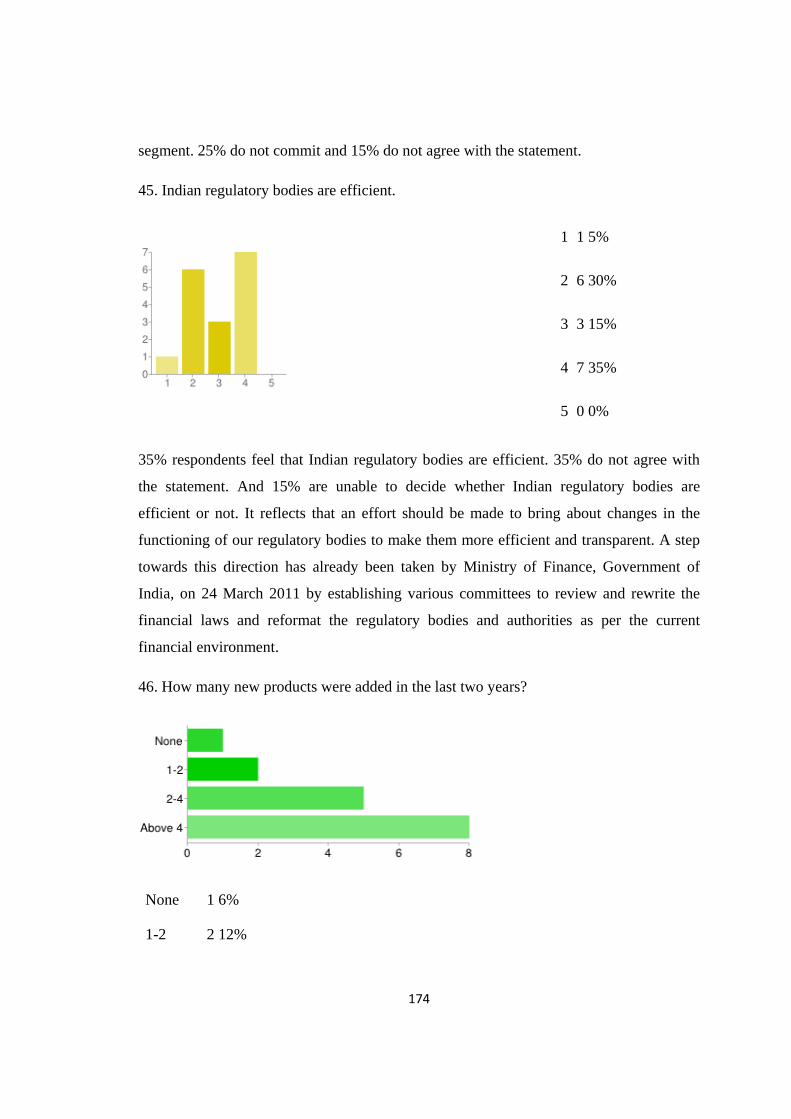
174
segment. 25% do not commit and 15% do not agree with the statement.
45. Indian regulatory bodies are efficient.
1 1 5%
2 6 30%
3 3 15%
4 7 35%
5 0 0%
35% respondents feel that Indian regulatory bodies are efficient. 35% do not agree with
the statement. And 15% are unable to decide whether Indian regulatory bodies are
efficient or not. It reflects that an effort should be made to bring about changes in the
functioning of our regulatory bodies to make them more efficient and transparent. A step
towards this direction has already been taken by Ministry of Finance, Government of
India, on 24 March 2011 by establishing various committees to review and rewrite the
financial laws and reformat the regulatory bodies and authorities as per the current
financial environment.
46. How many new products were added in the last two years?
None 1 6%
1-2 2 12%

175
2-4 5 29%
Above 4 8 47%
More than 4 new products were added according to 47% respondents. 2-4 products were
added according to 29% respondents. And 1-2 products were added according to 12%
respondents. This shows an asymmetric information flow in the market regarding the
products offered for trade. This also reflects that the members are comfortable trading in
the present successful products than investing in new products offered by the market. An
awareness has
47. How many products were innovated to their present structure?
None 1 6%
1-2 4 24%
2-4 4 24%
Above 4 7 41%
41% respondents feel that innovation has taken place in more than 4 products over the
years. Innovation is considered to be important for market development and growth.
Hence a continuous effort should be made to bring in additional features as per the
requirement of the market. This reflects a progressive attitude towards strengthening and
creating opportunities for wealth creation in the market by the regulators.

176
48. Technology in derivative markets is efficient and robust.
1 0 0%
2 3 15%
3 7 35%
4 5 25%
5 2 10%
35% respondents agree that technology in derivative market is efficient and robust.
Another 35% respondents do not commit for or against the statement. This reflects that
our technology needs more built-up compared to international markets in terms of
efficiency and robustness. Although the present technological setup seems to be adequate
it might require more investments and attention in the future.
49. The periodicity of turnover reporting to exchange is:
Daily 8 73%
Weekly 0 0%
Fortnightly 1 9%
Monthly 2 18%
The above data reflects that daily turnover reporting to exchange is done with 73%
respondents following the procedure. This is a good sign however the 27% category of
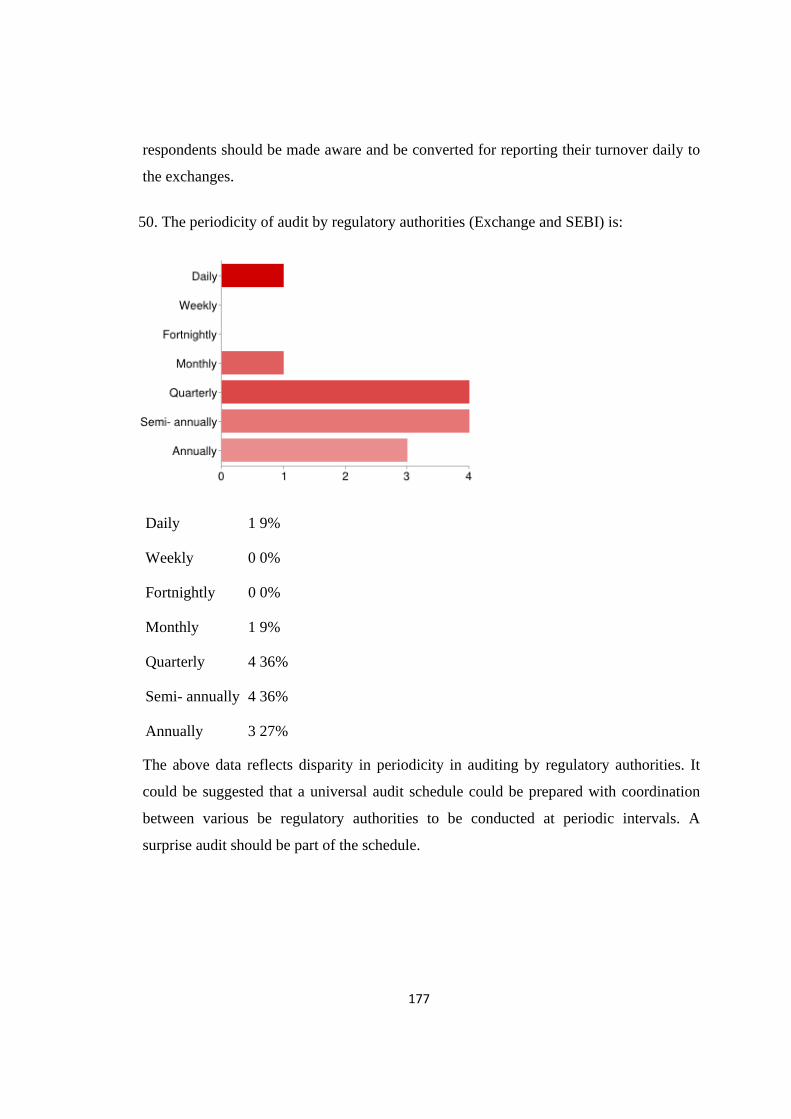
177
respondents should be made aware and be converted for reporting their turnover daily to
the exchanges.
50. The periodicity of audit by regulatory authorities (Exchange and SEBI) is:
Daily 1 9%
Weekly 0 0%
Fortnightly 0 0%
Monthly 1 9%
Quarterly 4 36%
Semi- annually 4 36%
Annually 3 27%
The above data reflects disparity in periodicity in auditing by regulatory authorities. It
could be suggested that a universal audit schedule could be prepared with coordination
between various be regulatory authorities to be conducted at periodic intervals. A
surprise audit should be part of the schedule.

178
51. The periodicity of submission of compliance reports to regulatory authorities
(Exchange and SEBI) is:
Daily 4 31%
Weekly 0 0%
Fortnightly 0 0%
Monthly 0 0%
Quarterly 4 31%
Semi- annually 2 15%
Annually 4 31%
The above data reflects disparity in periodicity in submission of compliance reports to
regulatory authorities. It could be suggested that a universal report be sent to various
regulators with periodicity as decided.
52. Do you have a mechanism to monitor an efficient/ high achiever trader?
Yes 15 94%
No 1 6%

179
94% respondents have a mechanism to monitor an efficient high achiever trader. This
again is a very positive sign since we have observed that financial mishaps have occurred
due to unprecedented financial decision making powers which are given to high
achievers.
53. Do you have position limits?
Yes 16 100%
No 0 0%
100% respondents have position limits which again are a good sign for controlling losses
and maximising gains.
54. Do you benchmark your actual gains and losses against strategic planned reports?
Yes 11 69%
No 5 31%
Around 69% respondents plan their financial strategy and benchmark it against actual
gains and losses. This is a positive sign since it controls unnecessary risk taking
tendencies amongst the investors. This also shows that a comprehensive study of potential
profits and losses is done by the investor before investing huge amount of finance.
55. Do you speculate?
Yes 6 35%
No 11 65%
65% respondents do not speculate. Thus emphasising the finding that derivative trades are
primarily used for hedging rather than speculating. This also aids in supporting our
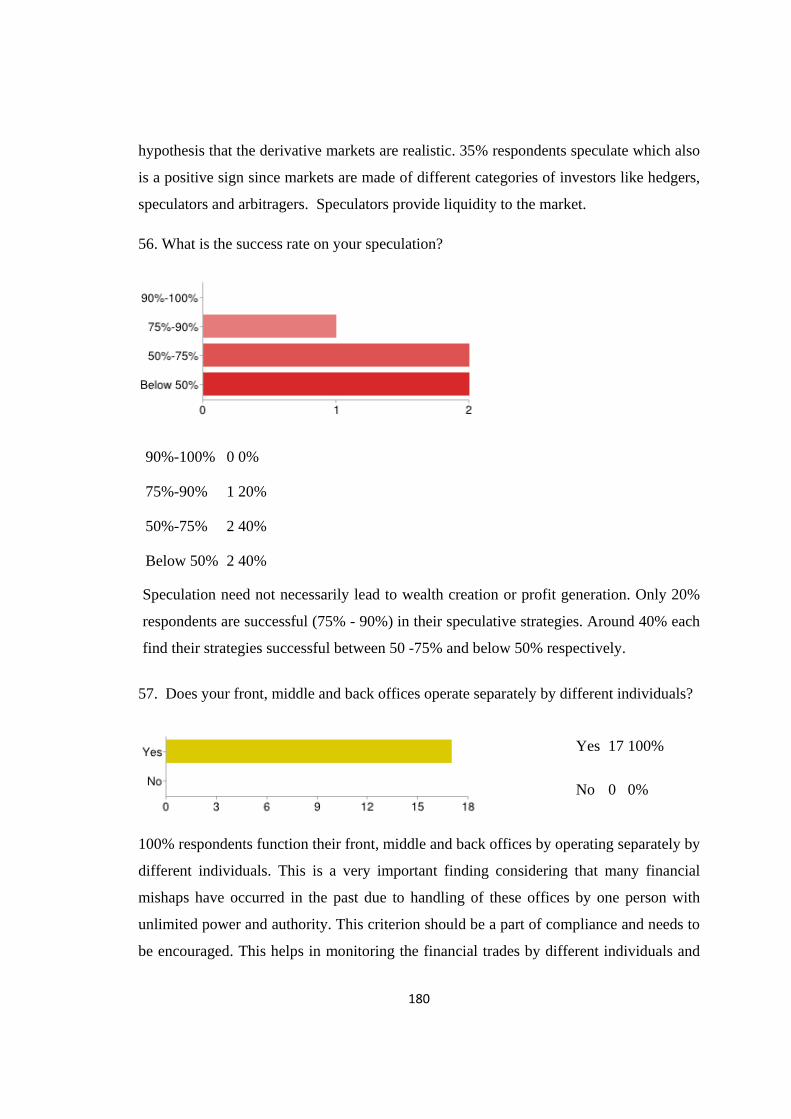
180
hypothesis that the derivative markets are realistic. 35% respondents speculate which also
is a positive sign since markets are made of different categories of investors like hedgers,
speculators and arbitragers. Speculators provide liquidity to the market.
56. What is the success rate on your speculation?
90%-100% 0 0%
75%-90% 1 20%
50%-75% 2 40%
Below 50% 2 40%
Speculation need not necessarily lead to wealth creation or profit generation. Only 20%
respondents are successful (75% - 90%) in their speculative strategies. Around 40% each
find their strategies successful between 50 -75% and below 50% respectively.
57. Does your front, middle and back offices operate separately by different individuals?
Yes 17 100%
No 0 0%
100% respondents function their front, middle and back offices by operating separately by
different individuals. This is a very important finding considering that many financial
mishaps have occurred in the past due to handling of these offices by one person with
unlimited power and authority. This criterion should be a part of compliance and needs to
be encouraged. This helps in monitoring the financial trades by different individuals and

181
departments leading to scrutiny and a close supervision.
58. When do you recognize 'inception profits'?
Immediately on occurrence 2 15%
During the life of the deal 10 77%
After the deal 1 8%
77% respondents recognize inception profits during the life of the deal. Whereas 15%
respondents recognize immediately on occurrence. And 8% recognize it after the deal.
59. Do you interact with your clients for 'risk awareness' before selling your products to
them?
Yes 15 88%
No 2 12%
An overwhelming 88% respondent interacts with their clients for ‘risk awareness’ before
selling their products. This is a very important criterion of a regulatory structure.
Derivative products are very complex in nature to understand by layman. Its advantages/
uses and disadvantages have to be informed to the investors before they lock-in their
money in the derivative trades. A formal document needs to be signed and approved from
the investor where in the risk factors are mentioned and conveyed.

182
60. There is a need to establish a separate derivative exchange.
1 3 15%
2 2 10%
3 4 20%
4 3 15%
5 5 25%
40% respondents agree that a separate derivative exchange could be established. However
25% do not agree and 20% are not sure on the need. However as per the L C Gupta
committee report recommendation a separate derivative exchange may be established as
and when the markets are ready. Currently it seems the stock exchanges are proving to be
adequate in meeting the burden of derivative trades, technologically and regulatory.
61. There is a need to establish a centralized clearing corporation for all exchanges.
1 0 0%
2 0 0%
3 2 10%
4 5 25%
5 9 45%
65% respondents feel that a centralized clearing corporation could be established. 10%
respondents are not sure and may be converted to agree for a need to establish a
centralized clearing corporation. A centralized clearing corporation could help monitor all
financial trades and settlement procedures and issues. This would help control default and
bad deliveries and payment issues.

183
62. Government role in derivative exchange could be enhanced.
1 0 0%
2 0 0%
3 6 30%
4 4 20%
5 6 30%
50% respondents agree that the government could play a more pro-active role in
developing and regulating the derivative markets. 30% are not sure whether government
has any role to play in the markets.
63. Please suggest any measures to strengthen Indian Derivatives Market, if needed.
To remove non nifty stocks from stock futures
Qualitative feedback collated from the derivative traders is as follows:
• On the question of training the traders, the response collated was that there is not
an obligation to be a trained professional to trade in derivatives. Individuals, any
investor can trade in derivatives as long as he has a demat account to do so. Yes,
there are training programs and certifications which are made available by the
stock exchange to the investors at a particular fee for improving their knowledge
to trade in derivatives.
• Brokers sensitize investors depending upon the capital size, the brokers advise the
clients to which instruments to go for. Finally it is the choice of the client to
decide the portfolio.
• Indian Capital market is not fully opened to derivatives. SEBI also lays rules from
time to time in order to maintain the cap on derivative trading.
• The client/ customer categorization is done in terms of the individual’s investment
capability. Usually there is a limit that is fixed by the broker/trading house to
184
categorize their clients. These limits are different for different brokerages. The
usual limit varies over and above Rs. 5 crore, for HNI investors in case of big
trading houses. In case of small trading houses it is usually above Rs. 1 crore. The
other category is the Retail Investors-investments ranging over and above
Rs. One Lakh. Margin money is charged depending upon the reputation of the
broker, usually between 10-15 % of the gains. Interest on the money lent is
charged depending upon the rapport and the credentials of the client. It is usually
higher in case of HNIs. The rate charged is market competitive. Also depends on
the tenure of the loan, usually 4-6%. The interest is charged on quarterly, semi-
annually or on annual basis. Most of the clients ask for instruments providing
Capital Protection and simultaneously making decent profits.
• Investors don’t play in derivatives on their entire margin. Derivatives form a small
part of their portfolio in order to make short gains from the volatile market and
thus to improve the overall return.
• According to the respondents derivative instruments are not fully useful to hedge
risks. It depends upon the ability of the investor to analyze the market scenario
and to take the position accordingly. Derivatives are used for risk minimization
and not for risk avoidance.
• Hedging is the best option that is available for the retail investors who are
conservative in taking risks.
• Market conditions, today, are very unpredictable and it takes the best of the
knowledge, experience and intuition to make profits from such volatile markets.
Derivatives are instruments where you can make huge profits or huge losses.
Opportunities to earn wealth from derivatives are normally looked out by
Speculators and Arbitragers. Hedgers go for limiting their downside. Arbitrage
opportunities are rare and persist for a very small duration of time. So in order to
make huge gains, an individual needs to invest a large amount which retail
investors usually don’t opt out for.
• Requirements of investors for derivative trading are different. It usually depends
on their capital size. Retail Investors usually go for hedging. Arbitragers and
Speculators go for profit making from the market volatility.

185
• SEBI marks the guide lines in terms of Derivative trading unless for Forward
market which is an over the counter exchange. So transparency is maintained as
far as Futures and options are concerned.
• The recent global crisis is an example of the difference between the regulatory and
the working framework of the Indian and the International Capital Markets. RBI
and SEBI ensure it from time to time that Indian Financial Institutions are less
exposed to complex derivative instruments which are difficult to understand and
to administer. Instruments such as CDO’s and CDS’s are not allowed in the Indian
market which makes us less vulnerable to the impact of global crisis. Also an
Indian Investor is conservative in terms of trading in derivatives and a large part of
their saved income goes for conventional methods of saving.
• As many new MNC’s are entering into the Indian Insurance and Lending sector,
our exposure to international markets is increased in the last 5-7 yrs. SEBI ensures
that the participation of such MNC’s in these sectors is kept in a limit under the
FDI policy. Indian governing/ regulatory bodies are more efficient than
international bodies. In terms of maintaining strict regulatory framework and had
revised and implemented new rules and guidelines in order to avoid and cover up
any loop holes in the systems that pave a way to the scams that have happened in
the past. Technology helps in terms of ease in the placement of orders, a
considerable reduction in operational time, ease and less time in terms of trade
settlements.
4.1 The following analysis is done through the secondary data to validate whether the
functioning of equity derivative market is realistic. The validation has been done
broadly to review and to support the primary research.
4.2.1 Comparison of NSE Nifty volatility- Pre and Post introduction of derivatives.
The daily closing prices of NSE Nifty was taken from 1st January 1994 to11th July 2012
to analyze the volatility in the market before and after the introduction of derivatives
trading in June 2000. There were 4594 observations.
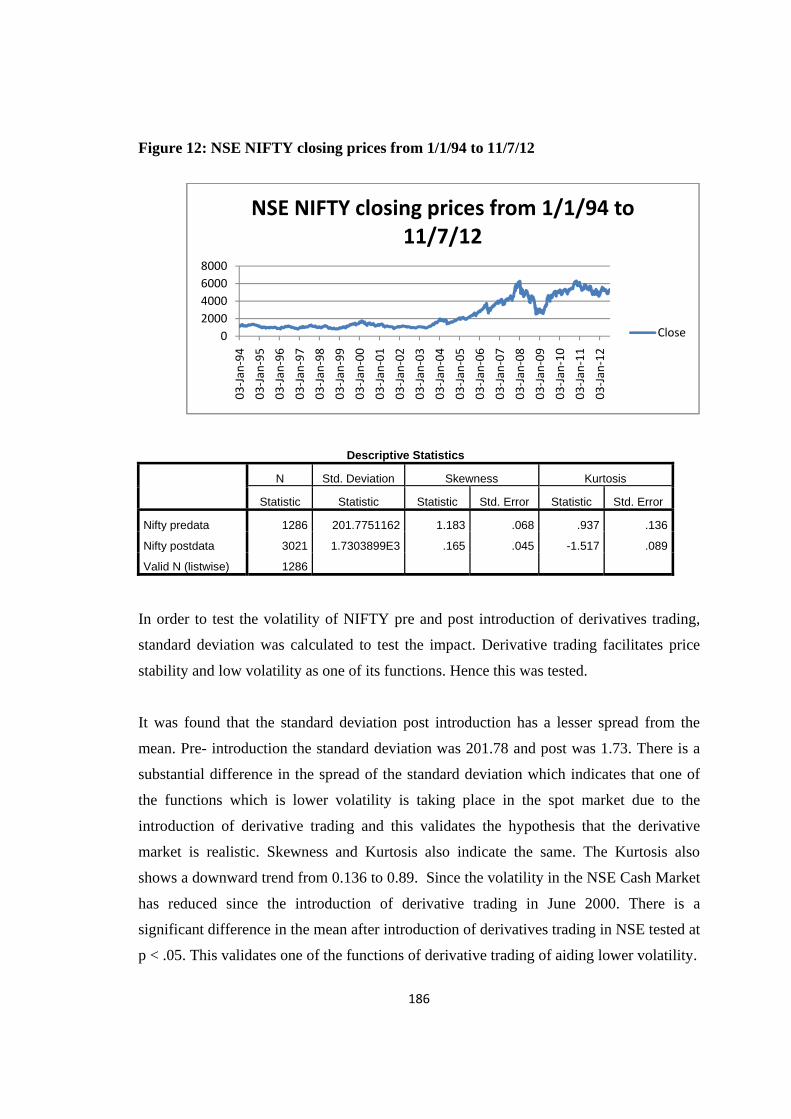
186
Figure 12: NSE NIFTY closing prices from 1/1/94 to 11/7/12
Descriptive Statistics
N Std. Deviation Skewness Kurtosis
Statistic Statistic Statistic Std. Error Statistic Std. Error
Nifty predata 1286 201.7751162 1.183 .068 .937 .136
Nifty postdata 3021 1.7303899E3 .165 .045 -1.517 .089
Valid N (listwise) 1286
In order to test the volatility of NIFTY pre and post introduction of derivatives trading,
standard deviation was calculated to test the impact. Derivative trading facilitates price
stability and low volatility as one of its functions. Hence this was tested.
It was found that the standard deviation post introduction has a lesser spread from the
mean. Pre- introduction the standard deviation was 201.78 and post was 1.73. There is a
substantial difference in the spread of the standard deviation which indicates that one of
the functions which is lower volatility is taking place in the spot market due to the
introduction of derivative trading and this validates the hypothesis that the derivative
market is realistic. Skewness and Kurtosis also indicate the same. The Kurtosis also
shows a downward trend from 0.136 to 0.89. Since the volatility in the NSE Cash Market
has reduced since the introduction of derivative trading in June 2000. There is a
significant difference in the mean after introduction of derivatives trading in NSE tested at
p < .05. This validates one of the functions of derivative trading of aiding lower volatility.
02000400060008000
03‐Jan
‐94
03‐Jan
‐95
03‐Jan
‐96
03‐Jan
‐97
03‐Jan
‐98
03‐Jan
‐99
03‐Jan
‐00
03‐Jan
‐01
03‐Jan
‐02
03‐Jan
‐03
03‐Jan
‐04
03‐Jan
‐05
03‐Jan
‐06
03‐Jan
‐07
03‐Jan
‐08
03‐Jan
‐09
03‐Jan
‐10
03‐Jan
‐11
03‐Jan
‐12
NSE NIFTY closing prices from 1/1/94 to 11/7/12
Close

187
Paired Samples Statistics
Mean N Std. Deviation Std. Error Mean
Pair 1 Close 1 (Pre) 1110.742212 1573 192.8402593 4.8622059
Close2 (Post) 1661.608932 1573 704.7902656 17.7703318
Paired Samples Correlations
N Correlation Sig.
Pair 1 Close 1 (Pre) & Close2
(Post) 1573 .604 .000
4.2.2 Price Discovery and volatility comparison
The purpose of the analysis is to investigate the empirical relationship between the NSE
50 futures and the NSE 50 Index. Relationship will help determine if there is any change
in the volatility of the underlying index and whether movements in the futures price
provide predictive information regarding subsequent movements in the index. Hence, the
objectives of the study are:
1. To examine the volatility of spot market with stock index futures.
2. To examine the lead-lag relationship between stock index futures and spot index.
4.2.2.1 Data and Sample
The data for the study has been collected from Thomson Reuters and the National Stock
Exchange (NSE) website. The main data for the study is the returns of the S&P CNX
Nifty index futures and spot Nifty index.
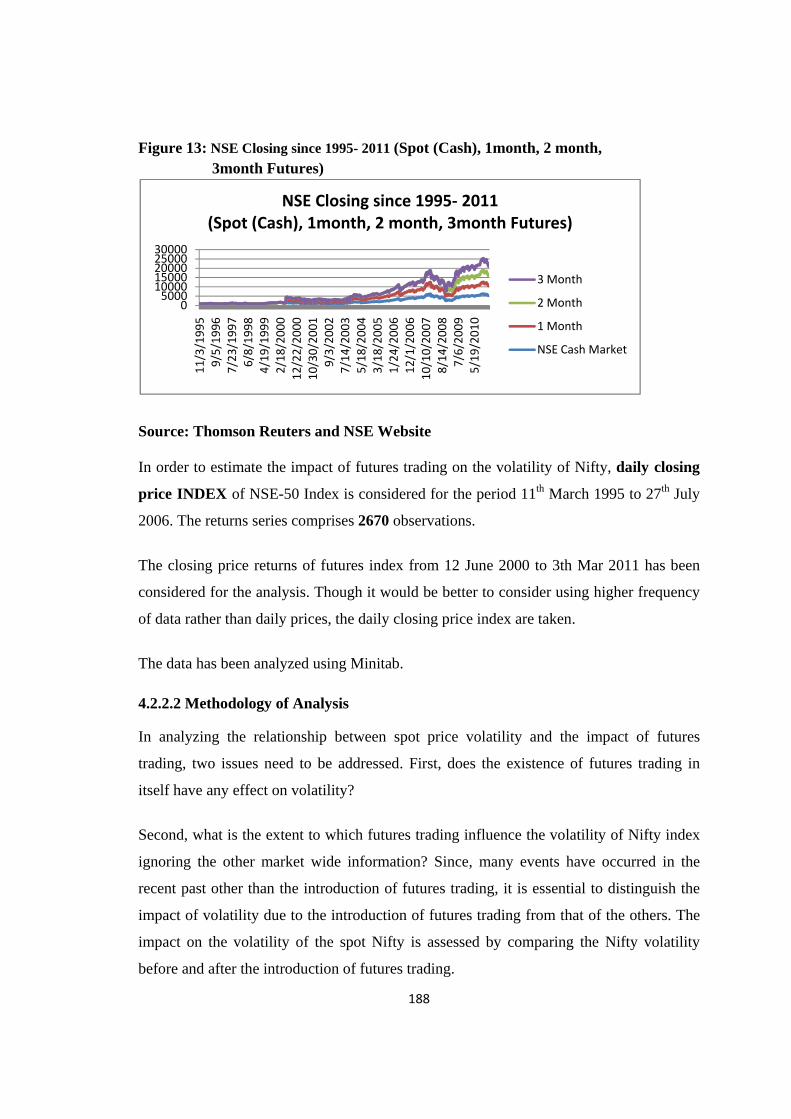
188
Figure 13: NSE Closing since 1995- 2011 (Spot (Cash), 1month, 2 month, 3month Futures)
Source: Thomson Reuters and NSE Website
In order to estimate the impact of futures trading on the volatility of Nifty, daily closing
price INDEX of NSE-50 Index is considered for the period 11th March 1995 to 27th July
2006. The returns series comprises 2670 observations.
The closing price returns of futures index from 12 June 2000 to 3th Mar 2011 has been
considered for the analysis. Though it would be better to consider using higher frequency
of data rather than daily prices, the daily closing price index are taken.
The data has been analyzed using Minitab.
4.2.2.2 Methodology of Analysis
In analyzing the relationship between spot price volatility and the impact of futures
trading, two issues need to be addressed. First, does the existence of futures trading in
itself have any effect on volatility?
Second, what is the extent to which futures trading influence the volatility of Nifty index
ignoring the other market wide information? Since, many events have occurred in the
recent past other than the introduction of futures trading, it is essential to distinguish the
impact of volatility due to the introduction of futures trading from that of the others. The
impact on the volatility of the spot Nifty is assessed by comparing the Nifty volatility
before and after the introduction of futures trading.
05000
1000015000200002500030000
11/3/199
59/5/19
967/23
/199
76/8/19
984/19
/199
92/18
/200
012
/22/20
0010
/30/20
019/3/20
027/14
/200
35/18
/200
43/18
/200
51/24
/200
612
/1/200
610
/10/20
078/14
/200
87/6/20
095/19
/201
0
NSE Closing since 1995‐ 2011(Spot (Cash), 1month, 2 month, 3month Futures)
3 Month
2 Month
1 Month
NSE Cash Market

189
Volatility has been measured by computing the standard deviation of the daily returns. In
order to determine whether the onset of futures trading has had any impact on underlying
spot market volatility it is necessary to separate the volatility arising from market wide
factors from the volatility which is specific to futures trading
For the purpose of this study, the spot market volatility is regressed with the Nifty1st
Month Index returns (which essentially capture the market wide volatility) and a dummy
variable. The dummy assumes the value of 1 for the post futures period and 0 before the
introduction of the futures trading. If the dummy variable is significantly different from
zero it is considered to have influenced the spot market volatility. The sign of the dummy
signifies a fall or rise in the volatility with the inception of futures trading. The data has
been analyzed using ordinary least squares multiple regression technique. F-test is
performed on the sample returns to examine the equality of variance before and after the
introduction of futures trading. The normality of the data is tested using the standard error
of kurtosis and skewness measures.
The lead-lag relationship has been examined by using the following steps:
First, univariate time series properties of the stock index and futures returns series are
observed to account for the infrequent trading and bid-ask price effects. The effect of
infrequent trading and bid-ask bounce is examined by running the serial correlation tests
on the daily price returns series of the index and futures markets to determine if past price
has an effect on the futures price.
A further examination of the influence of the past closing prices on the current returns is
estimated using AR (2) model to determine the bid-ask spread. Auto Regression of the
order 2 has been used as the higher order correlation coefficients are close to zero. This
model explains the extent by which the stale prices or poor trading frequency affects the
current market returns which in turn might be a cause for the possible lead/lag between
the index and futures markets.

190
In the next step, cross-correlation tests are run between the index and futures return series.
This test helps in determining the extent to which the two markets are correlated to each
other and the length of the lead/lag is also determined from the cross-correlation
coefficients of the spot index and futures markets.
4.2.2.3 Descriptive Statistics
The descriptive statistics as given in Table 1 indicate that the Nifty and Nifty Future
return series follow a normal distribution as given by the measures of skewness and
kurtosis. It is seen that the measures of standard error of skewness and kurtosis are well
within the range of -2 to +2 complying with the normal distribution pattern. A comparison
of the population variance of the Nifty is estimated both before and after the introduction
of Nifty futures. A casual observation of Nifty volatility as measured by standard
deviation shows that the volatility in the post futures (11.9) period is less than the
volatility before the introduction of futures (7.64) volatility. ANOVA results comparing
the pre and post futures Nifty returns shows that there is a statistically significant
difference in the volatility before and after the introduction of futures at 0.05 level of
significance. Thus, there is a clear indication that the volatility of the spot market is
subject to change as measured by standard deviation with the introduction of futures
trading and the volatility has reduced in the post-futures period.
Futures_Launch 0=Before Launch of Futures, 1=After launch Launch date March 01,
2001
NSE95 – Spot Prices; NSE1F – futures prices
Total
Variable Futures_launch Count Mean SE Mean StDev Variance CoefVar
NSE95_Line 0 183 1003.9 7.64 103.4 10695.4 10.30
1 2487 1431.8 11.9 595.2 354265.6 41.57
NSE1F_Last 0 183 1338.3 6.94 93.9 8821.6 7.02
1 2487 3001.8 33.4 1660.5 2757282.9 55.32
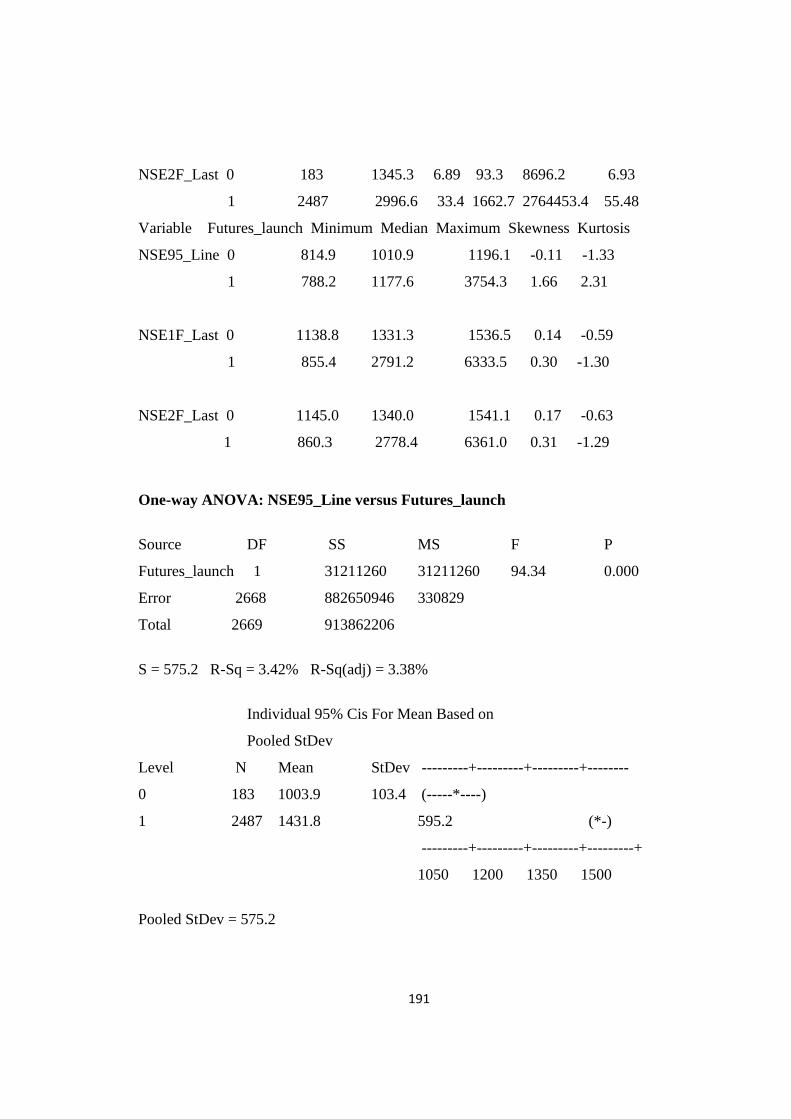
191
NSE2F_Last 0 183 1345.3 6.89 93.3 8696.2 6.93
1 2487 2996.6 33.4 1662.7 2764453.4 55.48
Variable Futures_launch Minimum Median Maximum Skewness Kurtosis
NSE95_Line 0 814.9 1010.9 1196.1 -0.11 -1.33
1 788.2 1177.6 3754.3 1.66 2.31
NSE1F_Last 0 1138.8 1331.3 1536.5 0.14 -0.59
1 855.4 2791.2 6333.5 0.30 -1.30
NSE2F_Last 0 1145.0 1340.0 1541.1 0.17 -0.63
1 860.3 2778.4 6361.0 0.31 -1.29
One-way ANOVA: NSE95_Line versus Futures_launch
Source DF SS MS F P
Futures_launch 1 31211260 31211260 94.34 0.000
Error 2668 882650946 330829
Total 2669 913862206
S = 575.2 R-Sq = 3.42% R-Sq(adj) = 3.38%
Individual 95% Cis For Mean Based on
Pooled StDev
Level N Mean StDev ---------+---------+---------+--------
0 183 1003.9 103.4 (-----*----)
1 2487 1431.8 595.2 (*-)
---------+---------+---------+---------+
1050 1200 1350 1500
Pooled StDev = 575.2

192
In order to empirically measure the impact of futures trading on the volatility of the spot
market, volatility before and after the introduction of the index futures is compared. The
following model is used for examining the impact:
NSE95_Linet is a is the spot market index under investigation in period t;
NSE1F_Lastt is a futures index under investigation;
Dt is a dummy variable, which takes a value of 1 if t is a post futures time period, 0 for
pre futures; b0, b1 and b2 are regression parameters and Et is the error term.
NSE95_Linet = b0 + b1 NSE1F_Lastt + b2 Dt + Et
The parameters of the above equation are estimated and if b2, coefficient of the dummy
variable turns out to be significantly different from zero it is taken as an evidence for
different prices in the two sub-periods, before and after futures.
Regression Analysis: NSE95_Line versus NSE1F_Last, Futures_launch
The regression equation is
NSE95_Line = 699 + 0.228 NSE1F_Last + 52.3 Futures_launch
2654 cases used, 16 cases contain missing values
Predictor Coef SE Coef T P VIF
Constant 699.41 33.74 20.73 0.000
NSE1F_Last 0.227506 0.005401 42.12 0.000 1.1
Futures_launch 52.30 35.31 1.48 0.139 1.1
S = 445.796 R-Sq = 42.2% R-Sq(adj) = 42.1%
Analysis of Variance
Source DF SS MS F P
Regression 2 384199483 192099741 966.62 0.000
Residual Error 2651 526844145 198734
Total 2653 911043627

193
Future prices did influence spot prices as shown by significance values (T values=42.12)
4.2.2.4 Mates of the Index and Futures Returns
In order to estimate the lead/lag relation between the Nifty and futures return series, it is
necessary to determine the length of the lead/lag coefficients. The choice of lead-lag is
based on the cross correlation coefficients between index and futures returns for 4
lead/lags as indicated in following table. Positive value of the coefficients at lags at k =
1,2,3 would indicate that returns in the futures market tend to lead those in the stock
market, and positive values for the coefficients at leads k = -1, -2, -3 would indicate that
the stock market tends to lead the futures market. Hence, the coefficients with negative
subscripts are the lead coefficients and the positive subscripts are the lag coefficients. If
the lead coefficients are significant then the cash leads the futures and, if the lag
coefficients are significant, the cash index lags the futures. Apart from giving a
preliminary look at the lead-lag relation between the two markets, it suggests the number
of leads, and lags which could be used in the regression analysis, which could be tested
and studied further. The same has not been administered here due to the limited scope of
my study.
Table 27: Co-relation coefficient between NSE closing and NSE one month futures
NSE 1st MONTH FUTURE
Lag 0 Lag 1 Lag 2 Lag 3 NSE CLOSING SINCE 95 Lag 0 0.999974 0.999373 0.998694 0.998018 Lag 1 0.999322 Lag 2 0.998649 Lag 3 0.997964
Correlation between the spot & futures market were calculated by considering 7 day lag
period. The above table shows the correlation between both the markets, when either of
the markets is leading or lagging. At (k=0) strong correlation (0.999974) exists between
the spot and derivative market without considering either the lead or the lag duration.
At k=1, the correlation of NIFTY one month futures is higher (0.999373) than the spot
market (0.999322) when the NIFTY one month futures is lagging spot and spot is lagging

194
NIFTY one month futures respectively. This indicates that the NIFTY one month futures
is leading the market and spot is following.
At k=2, the correlation of NIFTY one month futures is higher (0.998694) than the spot
market (0.998649) when the NIFTY one month futures is lagging spot and spot is lagging
NIFTY one month futures respectively. This indicates that the NIFTY one month futures
is leading the market and spot is following.
At k=3, the correlation of NIFTY one month futures is higher (0.998018) than the spot
market (0.997964) when the NIFTY one month futures is lagging spot and spot is lagging
NIFTY one month futures respectively. This indicates that the NIFTY one month futures
is leading the market and spot is following.
The above calculations were done in EXCEL.
In all the above cases we find that the NIFTY one month futures is leading the NIFTY
spot market with a stronger correlation thus validating our hypotheses that the function of
the derivative markets is realistic.
4.3 Comparison of impact cost at NSE
In order to test the market efficiency and liquidity which leads to a lower impact cost, data
of NSE Nifty monthly impact cost was taken from January 2001 to December 2011.
There were 132 observations. Annual Average impact cost was calculated and compared
with the Volume traded in F& O segment (No. of contracts), Index Futures, Stock
Futures, Index Options, Stock Options.

195
Figure 14: Nifty Impact Cost (2001-2011)
Source : NSE website
The annual average impact cost over the years is as follows:
Table 28: Average impact cost over the years, and cash and derivative volume traded at NSE
Year
Annual Average Impact
Cost
Volume traded in
CM
Volume traded in F& O segment (No. of contracts), Index Futures, Stock
Futures, Index Options, Stock Options
2001 0.268333 278,408 4196873 2002 0.115833 364,065 16768909 2003 0.100833 713,301 56886776 2004 0.094167 797,684 77017185 2005 0.076667 844,486 157619271 2006 0.081667 855,456 216883573 2007 0.081667 1,498,469 425013200 2008 0.104167 1,426,354 657390497 2009 0.090833 2,215,530 679293922 2010 0.065833 18,24,515 1034212062 2011 0.070833 16,16,978 1205045464
Source: NSE website:
0
0.2
0.4
0.6
0.8
1
1.2
Jan Feb Mar Apr May Jun Jul Aug Sep Oct Nov Dec
Nifty Impact Cost (2001-2011)
2001
2002
2003
2004
2005
2006
2007
2008
2009
2010

196
Figure 15: NSE Nifty Annual Average Impact Cost 2001-2011
Figure 16 : Volume traded in F& O segment (No. of contracts), Index Futures, Stock Futures, Index Options, Stock Options
0
0.05
0.1
0.15
0.2
0.25
0.3
2001 2002 2003 2004 2005 2006 2007 2008 2009 2010 2011
NSE Nifty Annual Average Impact Cost 2001‐2011
Annual Average Impact Cost
020000000400000006000000080000000
1E+091.2E+091.4E+09
2001
2002
2003
2004
2005
2006
2007
2008
2009
2010
2011
Volume traded in F& O segment (No. of contracts), Index Futures, Stock
Futures, Index Options, Stock Options
Volume traded in F& O segment (No. of contracts), Index Futures, Stock Futures, Index Options, Stock Options
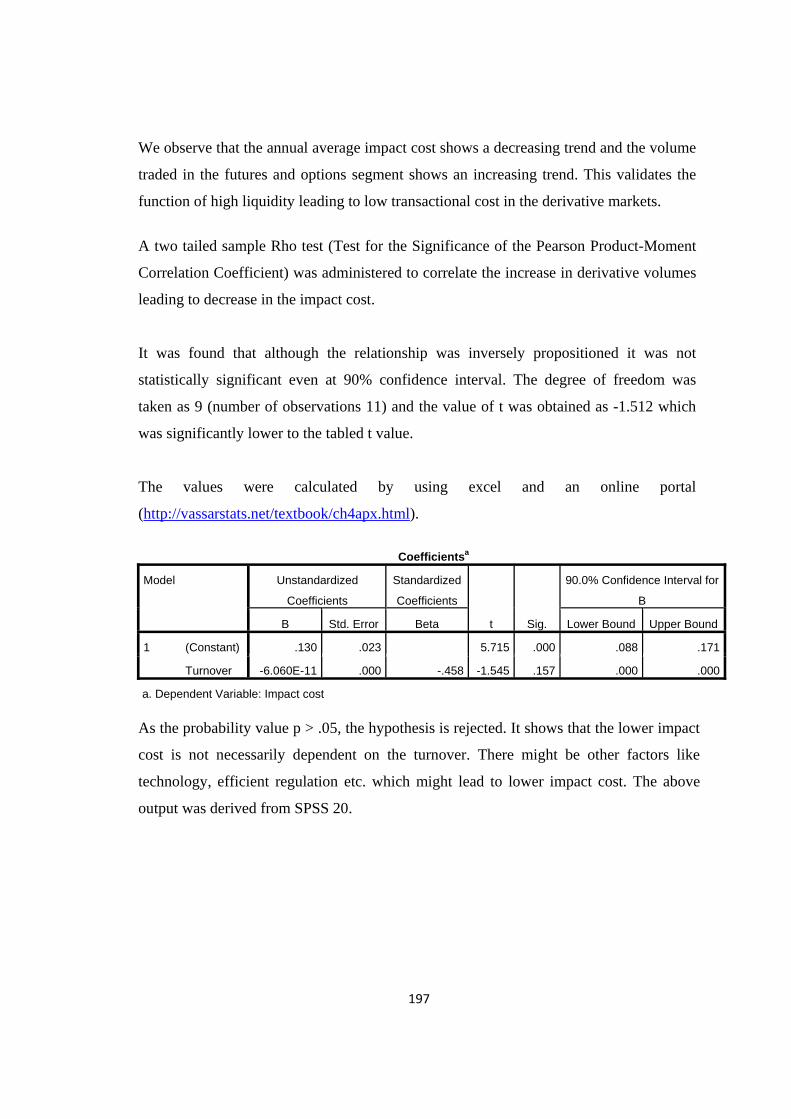
197
We observe that the annual average impact cost shows a decreasing trend and the volume
traded in the futures and options segment shows an increasing trend. This validates the
function of high liquidity leading to low transactional cost in the derivative markets.
A two tailed sample Rho test (Test for the Significance of the Pearson Product-Moment
Correlation Coefficient) was administered to correlate the increase in derivative volumes
leading to decrease in the impact cost.
It was found that although the relationship was inversely propositioned it was not
statistically significant even at 90% confidence interval. The degree of freedom was
taken as 9 (number of observations 11) and the value of t was obtained as -1.512 which
was significantly lower to the tabled t value.
The values were calculated by using excel and an online portal
(http://vassarstats.net/textbook/ch4apx.html).
Coefficientsa
Model Unstandardized
Coefficients
Standardized
Coefficients
t Sig.
90.0% Confidence Interval for
B
B Std. Error Beta Lower Bound Upper Bound
1 (Constant) .130 .023 5.715 .000 .088 .171
Turnover -6.060E-11 .000 -.458 -1.545 .157 .000 .000
a. Dependent Variable: Impact cost
As the probability value p > .05, the hypothesis is rejected. It shows that the lower impact
cost is not necessarily dependent on the turnover. There might be other factors like
technology, efficient regulation etc. which might lead to lower impact cost. The above
output was derived from SPSS 20.


