Chapter 3—VOCs in Ground Water - USGS · Chapter 3 8. Urban Land ... Nation. Many factors, ......
12
16 Chapter 3—VOCs in Ground Water Occurrence of One or More VOCs in Aquifers 7. Occurrence Information Helps in Managing Ground-Water Resources The occurrence of VOCs in aquifers provides important information to those responsible for managing ground-water resources. Contami- nation of aquifers by one or more VOCs also is a national issue of potential concern because of the widespread and long-term use of many of these compounds. Detecting one or more VOCs in aquifer samples provides evidence that conditions favor VOCs reaching the sampled wells. Con- taminant occurrence depends on aquifer prop- erties, the associated sources of water to the aquifer, and stresses on the aquifer such as pumping. Contamination also depends on the locations and types of VOC sources, the rela- tive locations of wells, and the transport and fate of VOCs. (27) Knowledge that VOC contami- nation is present in an aquifer provides the rationale for assessment of the human-health significance of the contamination, as well as the possible need for more in-depth studies to determine the source(s) of contamination and remedial action if concentrations are of potential concern. The occurrence of low- level contamination of one or more VOCs in an aquifer also can provide managers with an early indication of the presence of VOCs that eventually might adversely affect the quality of water from domestic and public wells. Figure 1. Total VOC concentrations were less than 1 microgram per liter (µg/L) in about 90 percent of the 867 aquifer samples with VOC detections analyzed using the low- level method. Detection of VOCs in aquifer samples demonstrates the vulnerability of many of the Nation’s aquifers to VOC contamination. A bout 19 percent of the ground-water samples from 3,498 wells in aquifer studies (hereafter referred to as aquifer samples) contained one or more VOCs at an assessment level of 0.2 µg/L. A larger percent occurrence of 51 percent was evident for a subset of samples from 1,687 wells that were analyzed using the low-level analytical method, for which an order-of-magnitude lower assessment level (0.02 µg/L) was applied. Possible reasons why no VOCs were detected in some aquifer samples include (1) no VOC sources were present near the sampled wells, (2) the water sampled was recharged before VOCs were in use, (3) the water sampled was old enough that VOCs had time to undergo degradation, (4) the ground water sampled was a mix of water not containing VOCs with water containing VOCs, which resulted in any VOCs present being diluted to con- centrations below detection levels, (5) VOCs were present in the aquifer but had not reached the wells yet, or (6) some combination of these and other reasons. VOC occurrence or non-occurrence could vary within different parts of an aquifer as well as among aquifers. At the local scale, additional studies are needed to help explain reasons for VOC occurrence or non- occurrence. The finding that one or more VOCs were detected in about one-half of the samples analyzed using the low-level method demonstrates the vulner- ability of many of the Nation’s aquifers to low-level VOC contamination
Transcript of Chapter 3—VOCs in Ground Water - USGS · Chapter 3 8. Urban Land ... Nation. Many factors, ......
16
Chapter 3—VOCs in Ground Water
Occurrence of One or More VOCs in Aquifers
7. Occurrence Information Helps in Managing Ground-Water Resources
The occurrence of VOCs in aquifers provides important information to those responsible for managing ground-water resources. Contami-nation of aquifers by one or more VOCs also is a national issue of potential concern because of the widespread and long-term use of many of these compounds.
Detecting one or more VOCs in aquifer samples provides evidence that conditions favor VOCs reaching the sampled wells. Con-taminant occurrence depends on aquifer prop-erties, the associated sources of water to the aquifer, and stresses on the aquifer such as pumping. Contamination also depends on the locations and types of VOC sources, the rela-tive locations of wells, and the transport and fate of VOCs.(27) Knowledge that VOC contami-nation is present in an aquifer provides the rationale for assessment of the human-health significance of the contamination, as well as the possible need for more in-depth studies to determine the source(s) of contamination and remedial action if concentrations are of potential concern. The occurrence of low-level contamination of one or more VOCs in an aquifer also can provide managers with an early indication of the presence of VOCs that eventually might adversely affect the quality of water from domestic and public wells.
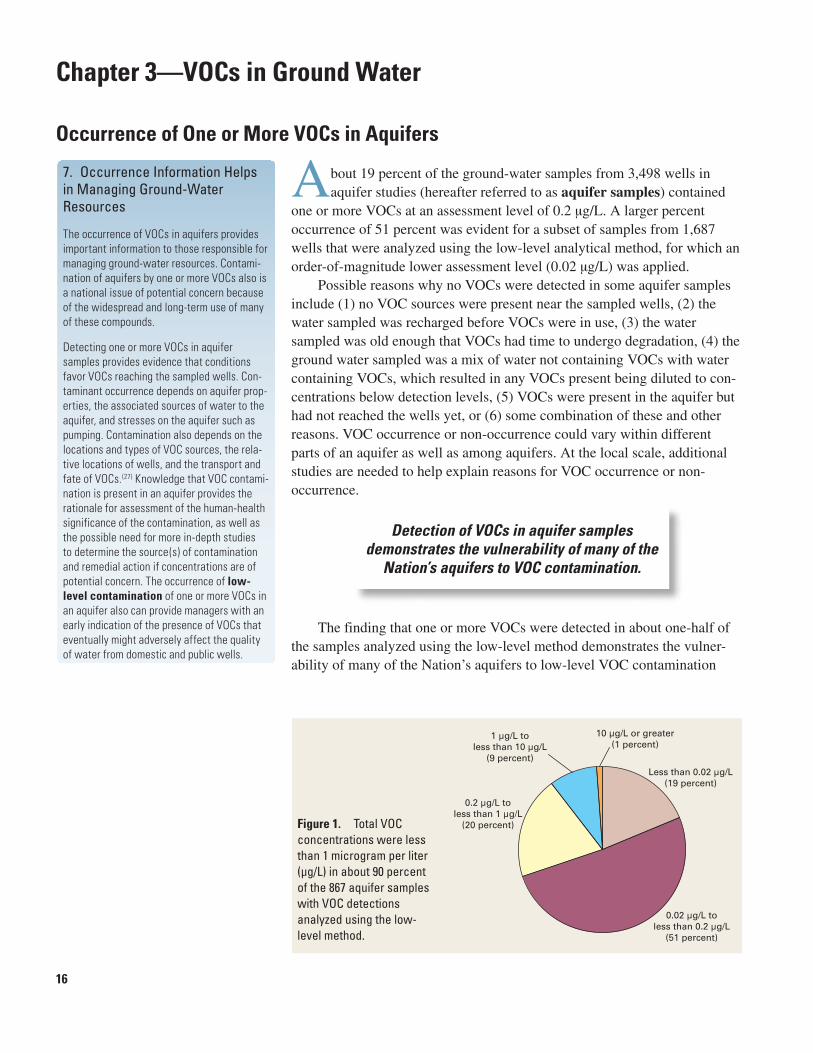
Figure 1. Total VOC concentrations were less than 1 microgram per liter (µg/L) in about 90 percent of the 867 aquifer samples with VOC detections analyzed using the low-level method.
Detection of VOCs in aquifer samples demonstrates the vulnerability of many of the
Nation’s aquifers to VOC contamination.
About 19 percent of the ground-water samples from 3,498 wells in aquifer studies (hereafter referred to as aquifer samples) contained
one or more VOCs at an assessment level of 0.2 µg/L. A larger percent occurrence of 51 percent was evident for a subset of samples from 1,687 wells that were analyzed using the low-level analytical method, for which an order-of-magnitude lower assessment level (0.02 µg/L) was applied.
Possible reasons why no VOCs were detected in some aquifer samples include (1) no VOC sources were present near the sampled wells, (2) the water sampled was recharged before VOCs were in use, (3) the water sampled was old enough that VOCs had time to undergo degradation, (4) the ground water sampled was a mix of water not containing VOCs with water containing VOCs, which resulted in any VOCs present being diluted to con-centrations below detection levels, (5) VOCs were present in the aquifer but had not reached the wells yet, or (6) some combination of these and other reasons. VOC occurrence or non-occurrence could vary within different parts of an aquifer as well as among aquifers. At the local scale, additional studies are needed to help explain reasons for VOC occurrence or non-occurrence.
The finding that one or more VOCs were detected in about one-half of the samples analyzed using the low-level method demonstrates the vulner-ability of many of the Nation’s aquifers to low-level VOC contamination
17
Chap
ter 3
8. Urban Land Use Contributes More VOCs to Ground Water than Do Other Land Uses
Detection frequencies of 1 or more of the 55 VOCs differ in shallow ground water partly depending on the overlying land use—38 per-cent in residential/commercial urban settings and 11 percent in agricultural settings at an assessment level of 0.2 µg/L. The residential/commercial findings may be attributable to one or more of several factors related to VOC sources in the urban environment compared to other settings. For example, the urban setting may have more sources and releases of VOCs than other settings. Also, recharge of VOCs to ground water may be enhanced in urban areas by structures such as recharge basins and shallow injection wells. In addition, differences in detection frequencies could be attributable to distance traveled by VOCs and to the transport and fate properties of the VOCs associated with the land-use setting.
The finding that urban settings contribute more VOCs to underlying ground water indicates that these waters generally are more vulnerable to VOC contamination than ground water underlying other settings. However, this is not always the case locally. In Oahu, Hawaii, for example, the largest VOC contamination occurs in the agricultural areas of central Oahu, where fumigants have been intensively applied but the aquifers are unconfined, as compared to the minimal contamination underlying urban Honolulu, where the aquifers are somewhat protected by a confining unit.(28)
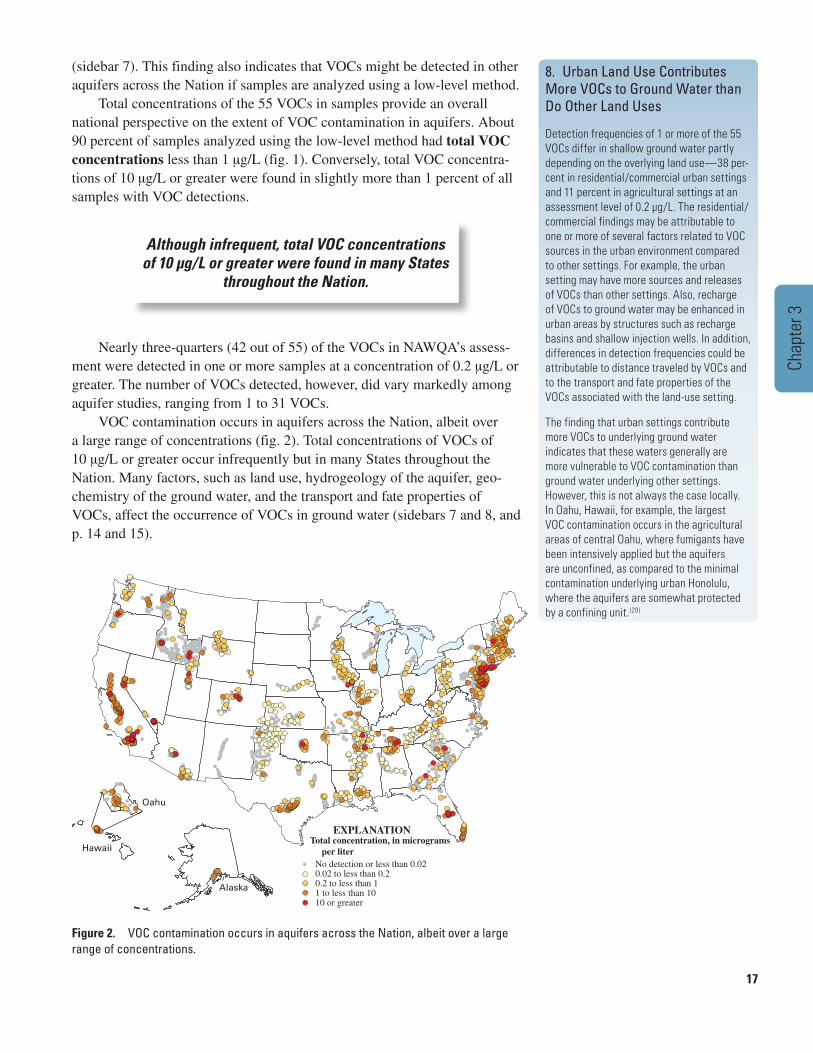
Figure 2. VOC contamination occurs in aquifers across the Nation, albeit over a large range of concentrations.
Although infrequent, total VOC concentrations of 10 µg/L or greater were found in many States
throughout the Nation.
(sidebar 7). This finding also indicates that VOCs might be detected in other aquifers across the Nation if samples are analyzed using a low-level method.
Total concentrations of the 55 VOCs in samples provide an overall national perspective on the extent of VOC contamination in aquifers. About 90 percent of samples analyzed using the low-level method had total VOC concentrations less than 1 µg/L (fig. 1). Conversely, total VOC concentra-tions of 10 µg/L or greater were found in slightly more than 1 percent of all samples with VOC detections.
Nearly three-quarters (42 out of 55) of the VOCs in NAWQA’s assess-ment were detected in one or more samples at a concentration of 0.2 µg/L or greater. The number of VOCs detected, however, did vary markedly among aquifer studies, ranging from 1 to 31 VOCs.
VOC contamination occurs in aquifers across the Nation, albeit over a large range of concentrations (fig. 2). Total concentrations of VOCs of 10 µg/L or greater occur infrequently but in many States throughout the Nation. Many factors, such as land use, hydrogeology of the aquifer, geo-chemistry of the ground water, and the transport and fate properties of VOCs, affect the occurrence of VOCs in ground water (sidebars 7 and 8, and p. 14 and 15).
18
Occurrence of One or More VOCs by Aquifer Study, Principal Aquifer, and Aquifer Lithology
9. Hydrogeologic Conditions Can Partly Control the Occurrence of VOCs in an Aquifer
The Edwards aquifer is a sole-source carbonate aquifer used for drinking-water supply in south-central Texas. This aquifer demonstrates the control that hydrogeologic conditions can have on VOC occurrence in an aquifer.(29) VOC detection frequencies in the Edwards aquifer for the unconfined recharge area (61 percent) differed from the confined area (38 percent). The aquifer’s recharge area is a faulted and fractured limestone that allows unrestricted downward movement of water and contaminants into the aquifer. The confined part of the Edwards aquifer, however, is overlain by a unit composed of several hundred feet of low-permeability rocks (the Navarro-Del Rio confining unit). This unit restricts the downward movement of water and contaminants to the underlying confined part of the Edwards aquifer, resulting in a smaller VOC occurrence in the confined area than in the unconfined recharge area.
Cross section of the Edwards aquifer near San Antonio, Texas, showing the recharge zone and the confined zone of the Edwards aquifer.(29)
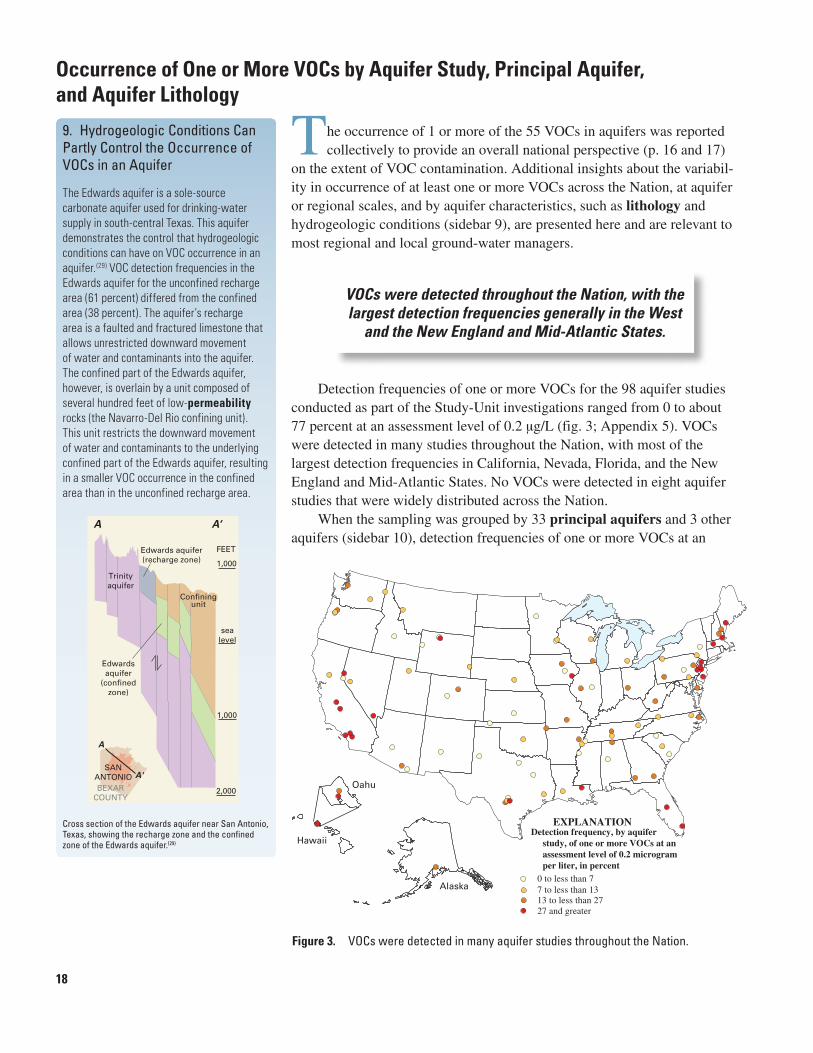
Figure 3. VOCs were detected in many aquifer studies throughout the Nation.
VOCs were detected throughout the Nation, with the largest detection frequencies generally in the West
and the New England and Mid-Atlantic States.
The occurrence of 1 or more of the 55 VOCs in aquifers was reported collectively to provide an overall national perspective (p. 16 and 17)
on the extent of VOC contamination. Additional insights about the variabil-ity in occurrence of at least one or more VOCs across the Nation, at aquifer or regional scales, and by aquifer characteristics, such as lithology and hydrogeologic conditions (sidebar 9), are presented here and are relevant to most regional and local ground-water managers.
Detection frequencies of one or more VOCs for the 98 aquifer studies conducted as part of the Study-Unit investigations ranged from 0 to about 77 percent at an assessment level of 0.2 µg/L (fig. 3; Appendix 5). VOCs were detected in many studies throughout the Nation, with most of the largest detection frequencies in California, Nevada, Florida, and the New England and Mid-Atlantic States. No VOCs were detected in eight aquifer studies that were widely distributed across the Nation.
When the sampling was grouped by 33 principal aquifers and 3 other aquifers (sidebar 10), detection frequencies of one or more VOCs at an
19
Chap
ter 3
Detection of VOCs differed markedly between and within principal aquifers.
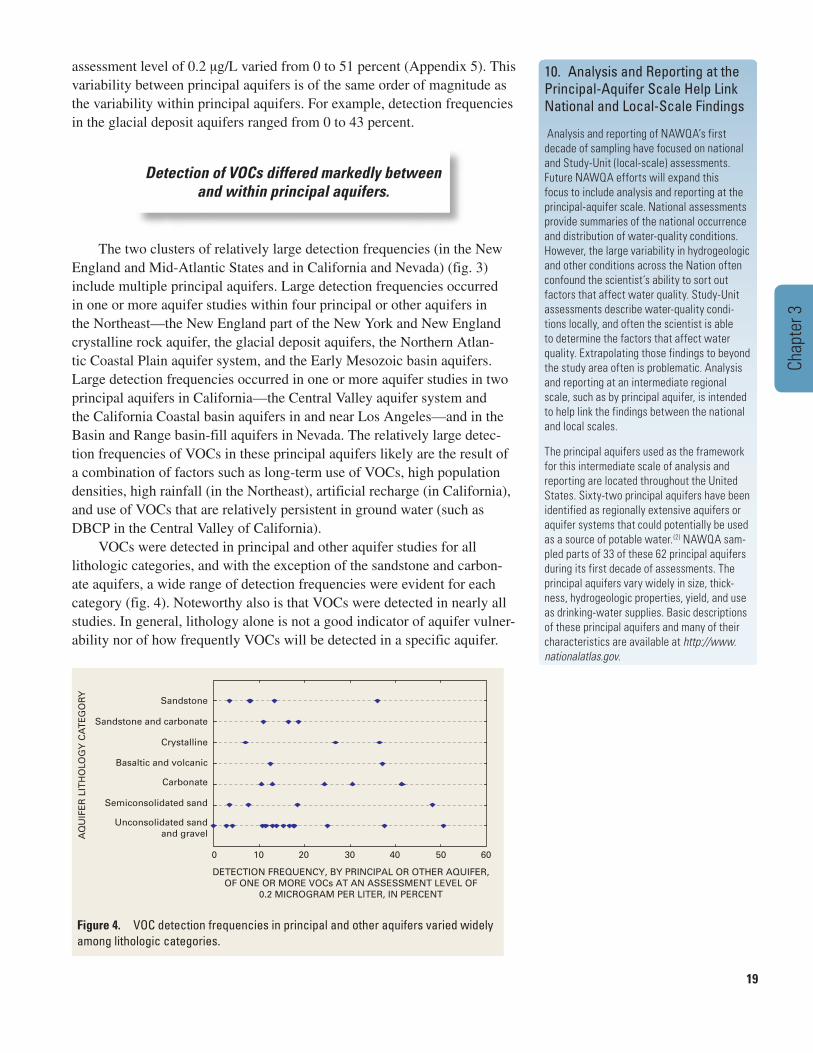
Figure 4. VOC detection frequencies in principal and other aquifers varied widely among lithologic categories.
10. Analysis and Reporting at the Principal-Aquifer Scale Help Link National and Local-Scale Findings
Analysis and reporting of NAWQA’s first decade of sampling have focused on national and Study-Unit (local-scale) assessments. Future NAWQA efforts will expand this focus to include analysis and reporting at the principal-aquifer scale. National assessments provide summaries of the national occurrence and distribution of water-quality conditions. However, the large variability in hydrogeologic and other conditions across the Nation often confound the scientist’s ability to sort out factors that affect water quality. Study-Unit assessments describe water-quality condi-tions locally, and often the scientist is able to determine the factors that affect water quality. Extrapolating those findings to beyond the study area often is problematic. Analysis and reporting at an intermediate regional scale, such as by principal aquifer, is intended to help link the findings between the national and local scales.
The principal aquifers used as the framework for this intermediate scale of analysis and reporting are located throughout the United States. Sixty-two principal aquifers have been identified as regionally extensive aquifers or aquifer systems that could potentially be used as a source of potable water.(2) NAWQA sam-pled parts of 33 of these 62 principal aquifers during its first decade of assessments. The principal aquifers vary widely in size, thick-ness, hydrogeologic properties, yield, and use as drinking-water supplies. Basic descriptions of these principal aquifers and many of their characteristics are available at http://www.nationalatlas.gov.
assessment level of 0.2 µg/L varied from 0 to 51 percent (Appendix 5). This variability between principal aquifers is of the same order of magnitude as the variability within principal aquifers. For example, detection frequencies in the glacial deposit aquifers ranged from 0 to 43 percent.
The two clusters of relatively large detection frequencies (in the New England and Mid-Atlantic States and in California and Nevada) (fig. 3) include multiple principal aquifers. Large detection frequencies occurred in one or more aquifer studies within four principal or other aquifers in the Northeast—the New England part of the New York and New England crystalline rock aquifer, the glacial deposit aquifers, the Northern Atlan-tic Coastal Plain aquifer system, and the Early Mesozoic basin aquifers. Large detection frequencies occurred in one or more aquifer studies in two principal aquifers in California—the Central Valley aquifer system and the California Coastal basin aquifers in and near Los Angeles—and in the Basin and Range basin-fill aquifers in Nevada. The relatively large detec-tion frequencies of VOCs in these principal aquifers likely are the result of a combination of factors such as long-term use of VOCs, high population densities, high rainfall (in the Northeast), artificial recharge (in California), and use of VOCs that are relatively persistent in ground water (such as DBCP in the Central Valley of California).
VOCs were detected in principal and other aquifer studies for all lithologic categories, and with the exception of the sandstone and carbon-ate aquifers, a wide range of detection frequencies were evident for each category (fig. 4). Noteworthy also is that VOCs were detected in nearly all studies. In general, lithology alone is not a good indicator of aquifer vulner-ability nor of how frequently VOCs will be detected in a specific aquifer.

20
Figure 5. Detection frequencies in aquifers vary between VOC groups.
THMs and solvents were the most frequently detected groups of VOCs in aquifers.
11. Production Rates Do Not Fully Explain VOC Group Detection Frequencies
If estimated production rates of VOCs (shown below) alone were the primary governing factor explaining detection frequencies, the gasoline hydrocarbons would be detected in aquifers much more frequently than the other six VOC groups. Likewise, the fumigants, refrigerants, and THMs would have smaller detection frequencies than the other four VOC groups. Comparison of production rates with detection frequencies of VOCs by group (fig. 5) shows that this generally is not the case.
There are many possible reasons for this lack of correspondence between VOC production rates and detection frequency in aquifers. For example, production data (see Circular’s Web site) are not available for all VOCs in each group, so actual production could be considerably more than the estimates shown above. In addition, even if the production data were complete, pro-duction is not necessarily an exact measure of a VOC source that is contributing a VOC to ground water. Although preferable in this analysis, national data sets of releases for all VOC groups are not available. Additionally, factors such as the hydrogeologic setting, geochemistry of the ground water, and transport and fate properties of VOCs can control the occurrence of VOCs in aquifers (p. 14 and 15).
Occurrence of VOC Groups in Aquifers
The most frequently detected VOC groups in aquifers were THMs and solvents (fig. 5). Both groups were detected in about 8 percent of
aquifer samples at an assessment level of 0.2 µg/L. One or more compounds in each of the remaining five VOC groups also were detected, but at frequen-cies less than 4 percent. At an assessment level of 0.02 µg/L, a detection of one or more THMs, solvents, and gasoline hydrocarbons occurred in about 1 out of every 5 wells. Production of the VOC groups alone does not fully explain VOC group occurrence (sidebar 11).
Most total concentrations for each VOC group were less than 1 µg/L, and more than one-half of the samples with detections had concentrations less than 0.2 µg/L for all groups. THMs, solvents, and gasoline hydrocarbons had the largest numbers of detections at concentrations less than 0.2 µg/L.
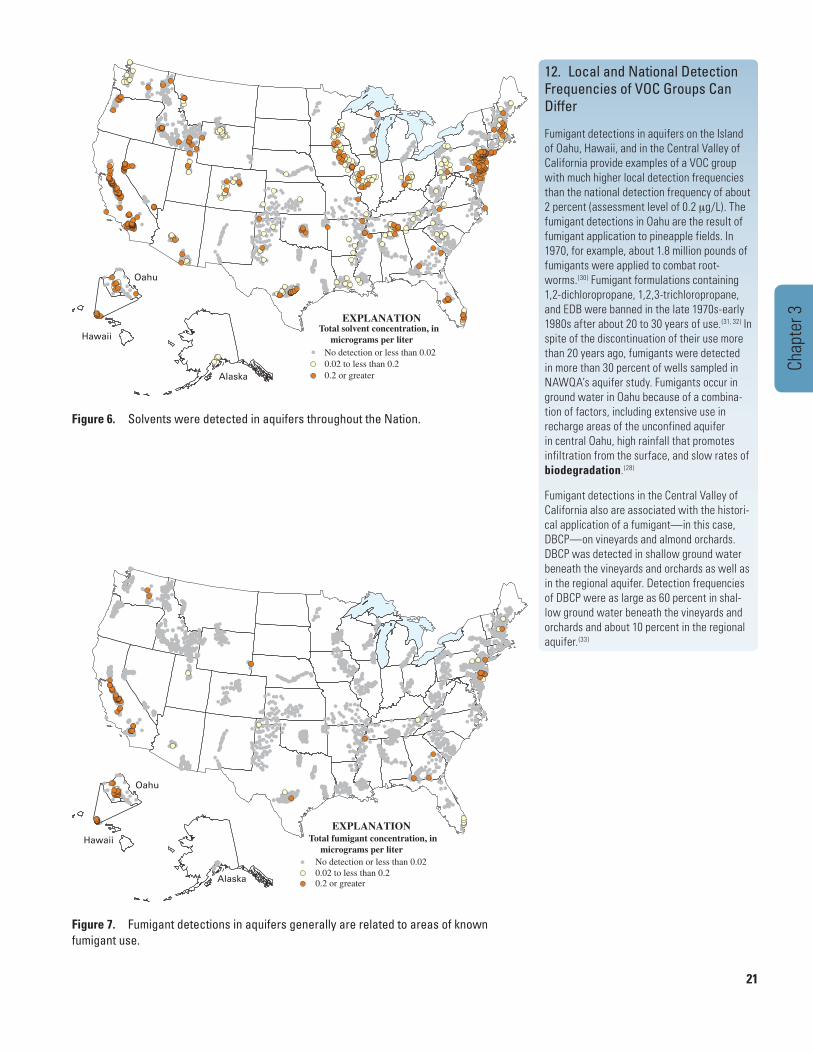
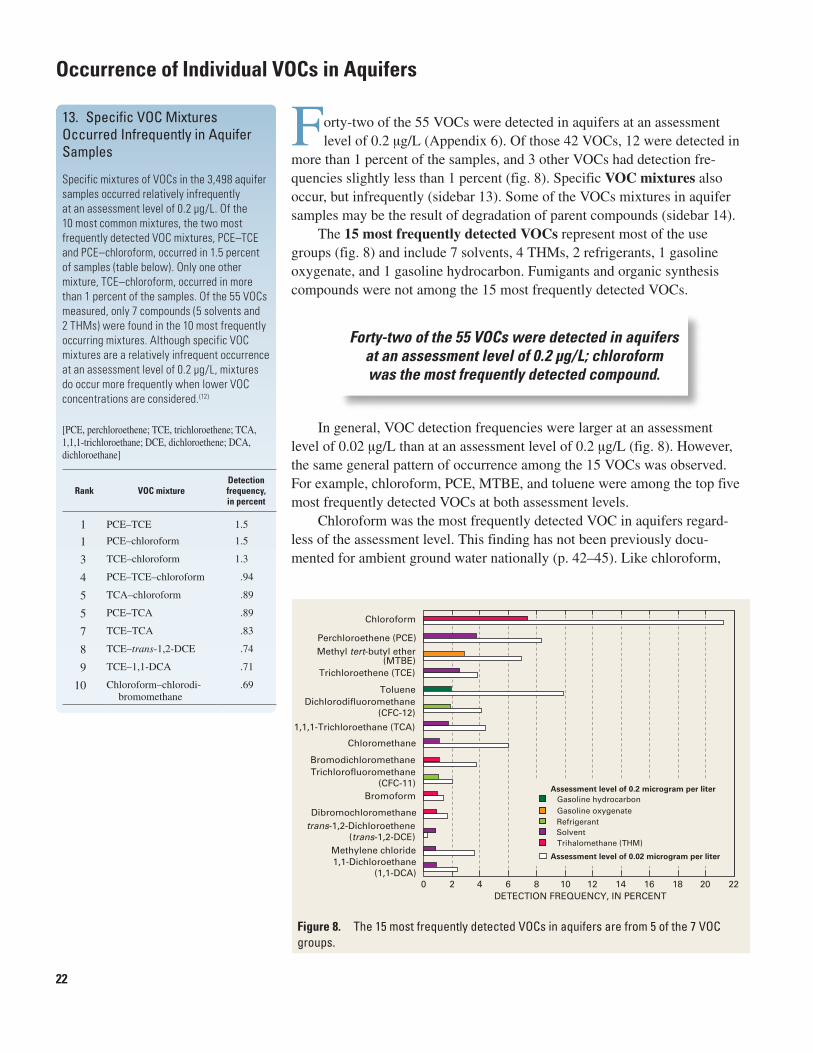
Solvents (fig. 6), THMs, gasoline hydrocarbons, and, less frequently, refrigerants had a widespread distribution throughout the Nation. Fumigants, gasoline oxygenates, and organic synthesis compounds were not detected in many aquifers. Presumably, the spatial patterns of detections/non-detections may reflect, in part, the more spatially focused historical or continued use of particular VOC groups. For example, the association between fumigant use and occurrence in aquifers in Oahu, Hawaii, and the Central Valley of California illustrates effects from historical use and provides an example of how local and national detection frequencies of VOC groups can differ (sidebar 12; fig. 7). The gasoline oxygenates, specifically MTBE, also show spatial patterns of occurrence that are related to use (p. 52 and 53). Addi-tional maps of the national occurrence patterns of VOC groups are available (see Circular’s Web site).
21
Chap
ter 3
12. Local and National Detection Frequencies of VOC Groups Can Differ
Fumigant detections in aquifers on the Island of Oahu, Hawaii, and in the Central Valley of California provide examples of a VOC group with much higher local detection frequencies than the national detection frequency of about 2 percent (assessment level of 0.2 µg/L). The fumigant detections in Oahu are the result of fumigant application to pineapple fields. In 1970, for example, about 1.8 million pounds of fumigants were applied to combat root-worms.(30) Fumigant formulations containing 1,2-dichloropropane, 1,2,3-trichloropropane, and EDB were banned in the late 1970s-early 1980s after about 20 to 30 years of use.(31, 32) In spite of the discontinuation of their use more than 20 years ago, fumigants were detected in more than 30 percent of wells sampled in NAWQA’s aquifer study. Fumigants occur in ground water in Oahu because of a combina-tion of factors, including extensive use in recharge areas of the unconfined aquifer in central Oahu, high rainfall that promotes infiltration from the surface, and slow rates of biodegradation.(28)
Fumigant detections in the Central Valley of California also are associated with the histori-cal application of a fumigant—in this case, DBCP—on vineyards and almond orchards. DBCP was detected in shallow ground water beneath the vineyards and orchards as well as in the regional aquifer. Detection frequencies of DBCP were as large as 60 percent in shal-low ground water beneath the vineyards and orchards and about 10 percent in the regional aquifer.(33)
Figure 6. Solvents were detected in aquifers throughout the Nation.
Figure 7. Fumigant detections in aquifers generally are related to areas of known fumigant use.
22
13. Specific VOC Mixtures Occurred Infrequently in Aquifer Samples
Specific mixtures of VOCs in the 3,498 aquifer samples occurred relatively infrequently at an assessment level of 0.2 µg/L. Of the 10 most common mixtures, the two most frequently detected VOC mixtures, PCE–TCE and PCE–chloroform, occurred in 1.5 percent of samples (table below). Only one other mixture, TCE–chloroform, occurred in more than 1 percent of the samples. Of the 55 VOCs measured, only 7 compounds (5 solvents and 2 THMs) were found in the 10 most frequently occurring mixtures. Although specific VOC mixtures are a relatively infrequent occurrence at an assessment level of 0.2 µg/L, mixtures do occur more frequently when lower VOC concentrations are considered.(12)
[PCE, perchloroethene; TCE, trichloroethene; TCA, 1,1,1-trichloroethane; DCE, dichloroethene; DCA, dichloroethane]
Rank VOC mixtureDetection frequency, in percent
1 PCE–TCE 1.5
1 PCE–chloroform 1.5
3 TCE–chloroform 1.3
4 PCE–TCE–chloroform .94
5 TCA–chloroform .89
5 PCE–TCA .89
7 TCE–TCA .83
8 TCE–trans-1,2-DCE .74
9 TCE–1,1-DCA .71
10 Chloroform–chlorodi- bromomethane
.69
Occurrence of Individual VOCs in Aquifers
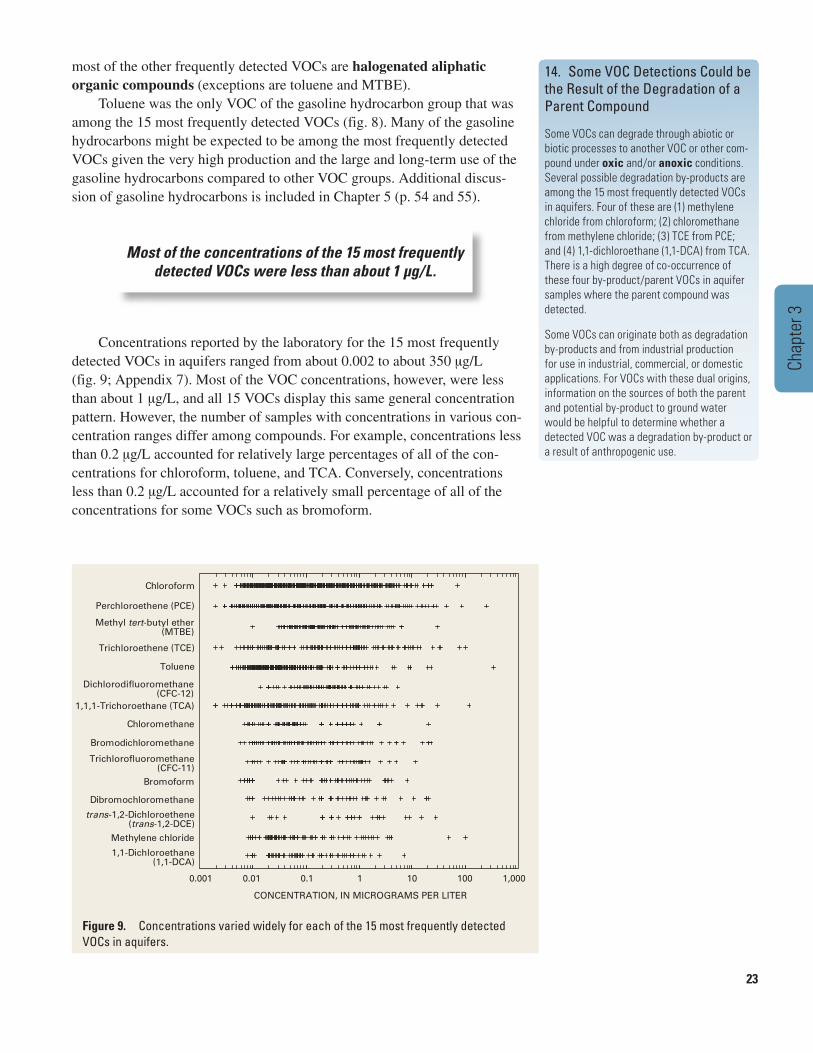
Forty-two of the 55 VOCs were detected in aquifers at an assessment level of 0.2 µg/L; chloroform was the most frequently detected compound.
Figure 8. The 15 most frequently detected VOCs in aquifers are from 5 of the 7 VOC groups.
Forty-two of the 55 VOCs were detected in aquifers at an assessment level of 0.2 µg/L (Appendix 6). Of those 42 VOCs, 12 were detected in
more than 1 percent of the samples, and 3 other VOCs had detection fre-quencies slightly less than 1 percent (fig. 8). Specific VOC mixtures also occur, but infrequently (sidebar 13). Some of the VOCs mixtures in aquifer samples may be the result of degradation of parent compounds (sidebar 14).
The 15 most frequently detected VOCs represent most of the use groups (fig. 8) and include 7 solvents, 4 THMs, 2 refrigerants, 1 gasoline oxygenate, and 1 gasoline hydrocarbon. Fumigants and organic synthesis compounds were not among the 15 most frequently detected VOCs.
In general, VOC detection frequencies were larger at an assessment level of 0.02 µg/L than at an assessment level of 0.2 µg/L (fig. 8). However, the same general pattern of occurrence among the 15 VOCs was observed. For example, chloroform, PCE, MTBE, and toluene were among the top five most frequently detected VOCs at both assessment levels.
Chloroform was the most frequently detected VOC in aquifers regard-less of the assessment level. This finding has not been previously docu-mented for ambient ground water nationally (p. 42–45). Like chloroform,
0 2 4 6 8 10 12 14 16 18 20 22
trans-1,2-Dichloroethene(trans-1,2-DCE)
Methylene chloride
Dibromochloromethane
Bromoform
1,1-Dichloroethane (1,1-DCA)
Trichlorofluoromethane (CFC-11)
Bromodichloromethane
Chloromethane
1,1,1-Trichloroethane (TCA)
Dichlorodifluoromethane(CFC-12)
Toluene
Trichloroethene (TCE)
Methyl tert-butyl ether(MTBE)
Perchloroethene (PCE)
Chloroform
DETECTION FREQUENCY, IN PERCENT
Trihalomethane (THM)
Gasoline hydrocarbonGasoline oxygenateRefrigerantSolvent
Assessment level of 0.02 microgram per liter
Assessment level of 0.2 microgram per liter
23
Chap
ter 3
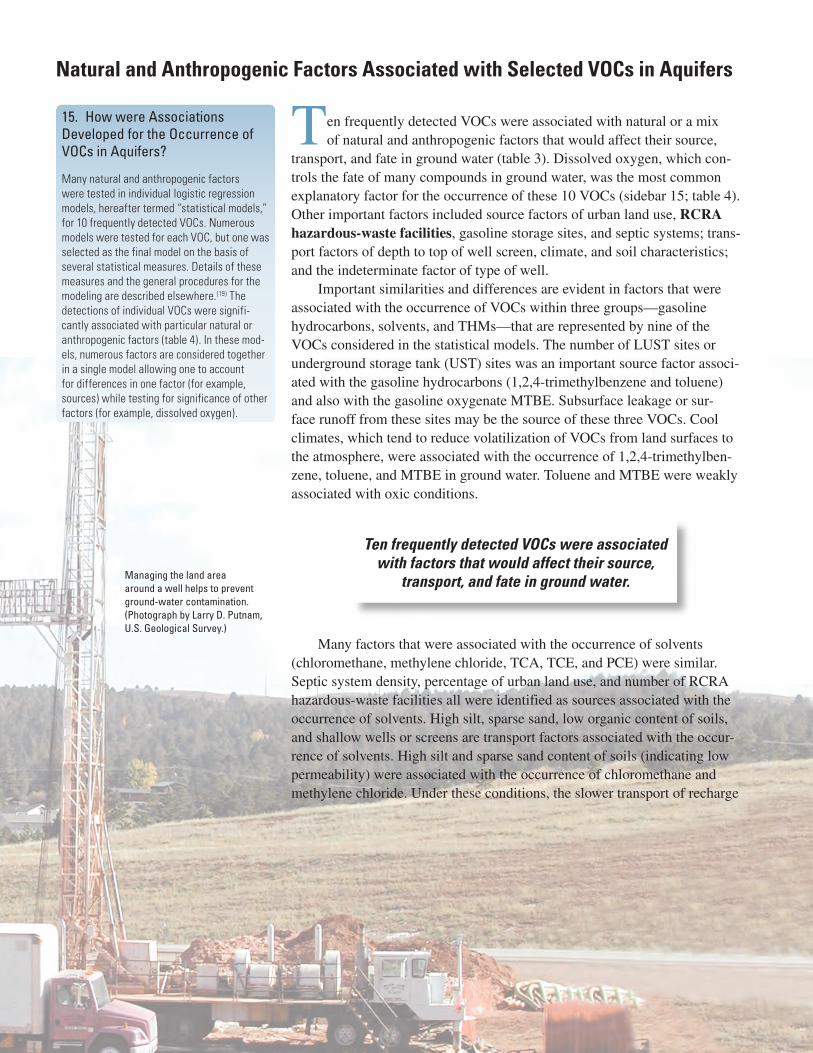
Most of the concentrations of the 15 most frequently detected VOCs were less than about 1 µg/L.
Figure 9. Concentrations varied widely for each of the 15 most frequently detected VOCs in aquifers.
14. Some VOC Detections Could be the Result of the Degradation of a Parent Compound
Some VOCs can degrade through abiotic or biotic processes to another VOC or other com-pound under oxic and/or anoxic conditions. Several possible degradation by-products are among the 15 most frequently detected VOCs in aquifers. Four of these are (1) methylene chloride from chloroform; (2) chloromethane from methylene chloride; (3) TCE from PCE; and (4) 1,1-dichloroethane (1,1-DCA) from TCA. There is a high degree of co-occurrence of these four by-product/parent VOCs in aquifer samples where the parent compound was detected.
Some VOCs can originate both as degradation by-products and from industrial production for use in industrial, commercial, or domestic applications. For VOCs with these dual origins, information on the sources of both the parent and potential by-product to ground water would be helpful to determine whether a detected VOC was a degradation by-product or a result of anthropogenic use.
most of the other frequently detected VOCs are halogenated aliphatic organic compounds (exceptions are toluene and MTBE).
Toluene was the only VOC of the gasoline hydrocarbon group that was among the 15 most frequently detected VOCs (fig. 8). Many of the gasoline hydrocarbons might be expected to be among the most frequently detected VOCs given the very high production and the large and long-term use of the gasoline hydrocarbons compared to other VOC groups. Additional discus-sion of gasoline hydrocarbons is included in Chapter 5 (p. 54 and 55).
Concentrations reported by the laboratory for the 15 most frequently detected VOCs in aquifers ranged from about 0.002 to about 350 µg/L (fig. 9; Appendix 7). Most of the VOC concentrations, however, were less than about 1 µg/L, and all 15 VOCs display this same general concentration pattern. However, the number of samples with concentrations in various con-centration ranges differ among compounds. For example, concentrations less than 0.2 µg/L accounted for relatively large percentages of all of the con-centrations for chloroform, toluene, and TCA. Conversely, concentrations less than 0.2 µg/L accounted for a relatively small percentage of all of the concentrations for some VOCs such as bromoform.
24
15. How were Associations Developed for the Occurrence of VOCs in Aquifers?
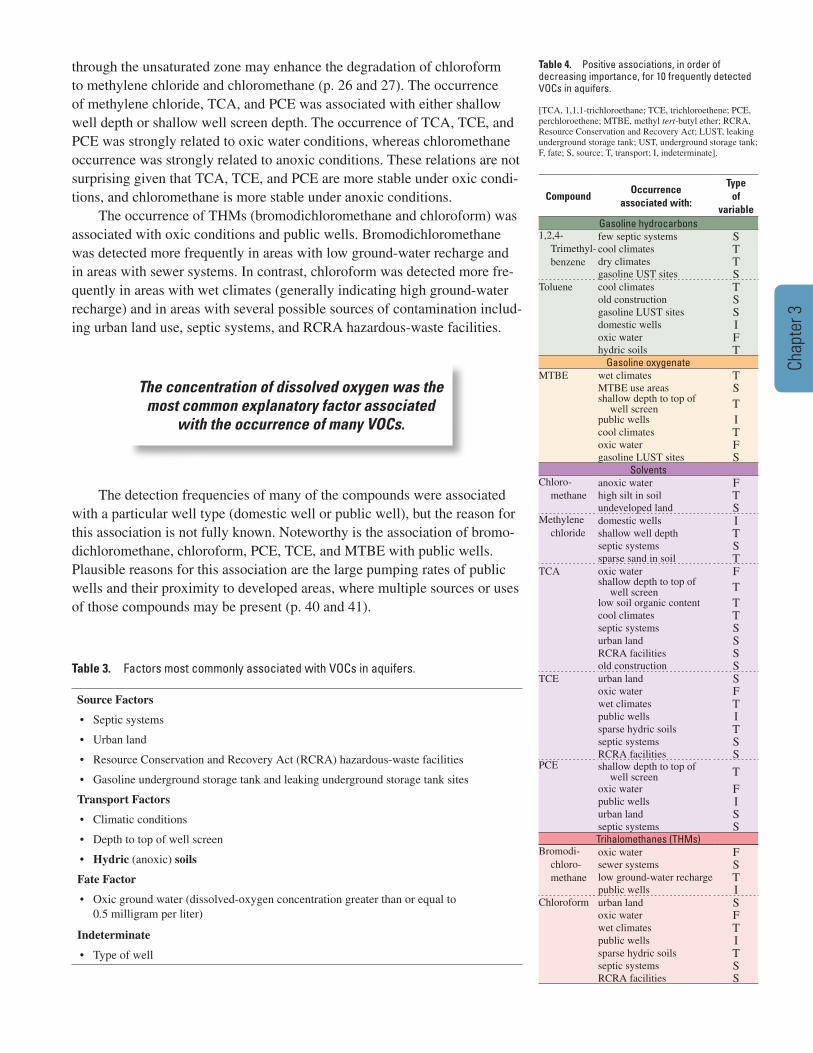
Many natural and anthropogenic factors were tested in individual logistic regression models, hereafter termed “statistical models,” for 10 frequently detected VOCs. Numerous models were tested for each VOC, but one was selected as the final model on the basis of several statistical measures. Details of these measures and the general procedures for the modeling are described elsewhere.(19) The detections of individual VOCs were signifi-cantly associated with particular natural or anthropogenic factors (table 4). In these mod-els, numerous factors are considered together in a single model allowing one to account for differences in one factor (for example, sources) while testing for significance of other factors (for example, dissolved oxygen).
Ten frequently detected VOCs were associated with factors that would affect their source,
transport, and fate in ground water.
Natural and Anthropogenic Factors Associated with Selected VOCs in Aquifers
Managing the land area around a well helps to prevent ground-water contamination. (Photograph by Larry D. Putnam, U.S. Geological Survey.)
Ten frequently detected VOCs were associated with natural or a mix of natural and anthropogenic factors that would affect their source,
transport, and fate in ground water (table 3). Dissolved oxygen, which con-trols the fate of many compounds in ground water, was the most common explanatory factor for the occurrence of these 10 VOCs (sidebar 15; table 4). Other important factors included source factors of urban land use, RCRA hazardous-waste facilities, gasoline storage sites, and septic systems; trans-port factors of depth to top of well screen, climate, and soil characteristics; and the indeterminate factor of type of well.
Important similarities and differences are evident in factors that were associated with the occurrence of VOCs within three groups—gasoline hydrocarbons, solvents, and THMs—that are represented by nine of the VOCs considered in the statistical models. The number of LUST sites or underground storage tank (UST) sites was an important source factor associ-ated with the gasoline hydrocarbons (1,2,4-trimethylbenzene and toluene) and also with the gasoline oxygenate MTBE. Subsurface leakage or sur-face runoff from these sites may be the source of these three VOCs. Cool climates, which tend to reduce volatilization of VOCs from land surfaces to the atmosphere, were associated with the occurrence of 1,2,4-trimethylben-zene, toluene, and MTBE in ground water. Toluene and MTBE were weakly associated with oxic conditions.
Many factors that were associated with the occurrence of solvents (chloromethane, methylene chloride, TCA, TCE, and PCE) were similar. Septic system density, percentage of urban land use, and number of RCRA hazardous-waste facilities all were identified as sources associated with the occurrence of solvents. High silt, sparse sand, low organic content of soils, and shallow wells or screens are transport factors associated with the occur-rence of solvents. High silt and sparse sand content of soils (indicating low permeability) were associated with the occurrence of chloromethane and methylene chloride. Under these conditions, the slower transport of recharge
25
Chap
ter 3
Table 4. Positive associations, in order of decreasing importance, for 10 frequently detected VOCs in aquifers.
[TCA, 1,1,1-trichloroethane; TCE, trichloroethene; PCE, perchloroethene; MTBE, methyl tert-butyl ether; RCRA, Resource Conservation and Recovery Act; LUST, leaking underground storage tank; UST, underground storage tank; F, fate; S, source; T, transport; I, indeterminate].
CompoundOccurrence
associated with:
Type of
variableGasoline hydrocarbons
1,2,4- Trimethyl- benzene
few septic systems Scool climates Tdry climates Tgasoline UST sites S
Toluene cool climates T old construction S gasoline LUST sites S domestic wells I oxic water F hydric soils T
Gasoline oxygenateMTBE wet climates T MTBE use areas S shallow depth to top of
well screen T public wells I cool climates T oxic water F gasoline LUST sites S
SolventsChloro-
methaneanoxic water Fhigh silt in soil Tundeveloped land S
Methylene chloride
domestic wells Ishallow well depth Tseptic systems Ssparse sand in soil T
TCA oxic water Fshallow depth to top of
well screen Tlow soil organic content Tcool climates Tseptic systems Surban land SRCRA facilities Sold construction S
TCE urban land S oxic water F wet climates T public wells I sparse hydric soils T septic systems S RCRA facilities SPCE shallow depth to top of
well screen Toxic water Fpublic wells Iurban land Sseptic systems STrihalomethanes (THMs)
Bromodi-chloro- methane
oxic water Fsewer systems Slow ground-water recharge Tpublic wells I
Chloroform
urban land Soxic water F
wet climates T public wells I sparse hydric soils T septic systems S RCRA facilities S
The concentration of dissolved oxygen was the most common explanatory factor associated
with the occurrence of many VOCs.
through the unsaturated zone may enhance the degradation of chloroform to methylene chloride and chloromethane (p. 26 and 27). The occurrence of methylene chloride, TCA, and PCE was associated with either shallow well depth or shallow well screen depth. The occurrence of TCA, TCE, and PCE was strongly related to oxic water conditions, whereas chloromethane occurrence was strongly related to anoxic conditions. These relations are not surprising given that TCA, TCE, and PCE are more stable under oxic condi-tions, and chloromethane is more stable under anoxic conditions.
The occurrence of THMs (bromodichloromethane and chloroform) was associated with oxic conditions and public wells. Bromodichloromethane was detected more frequently in areas with low ground-water recharge and in areas with sewer systems. In contrast, chloroform was detected more fre-quently in areas with wet climates (generally indicating high ground-water recharge) and in areas with several possible sources of contamination includ-ing urban land use, septic systems, and RCRA hazardous-waste facilities.
The detection frequencies of many of the compounds were associated with a particular well type (domestic well or public well), but the reason for this association is not fully known. Noteworthy is the association of bromo- dichloromethane, chloroform, PCE, TCE, and MTBE with public wells. Plausible reasons for this association are the large pumping rates of public wells and their proximity to developed areas, where multiple sources or uses of those compounds may be present (p. 40 and 41).
Table 3. Factors most commonly associated with VOCs in aquifers.
Source Factors
Septic systems•
Urban land•
Resource Conservation and Recovery Act (RCRA) hazardous-waste facilities•
Gasoline underground storage tank and leaking underground storage tank sites•
Transport Factors
Climatic conditions•
Depth to top of well screen•
Hydric (anoxic) soils•
Fate Factor
Oxic ground water (dissolved-oxygen concentration greater than or equal to 0.5 milligram per liter)
•
Indeterminate
Type of well•

26
Dissolved Oxygen and VOC Occurrence in Aquifers
The detection frequencies of most VOCs were dependent on the dissolved-oxygen conditions
of ground water and the type of VOC.
16. Dissolved Oxygen Varies Along a Ground-Water Flowpath
Dissolved-oxygen concentrations in ground water can vary by location in an aquifer and with the age of the ground water. Young ground water usually has a larger dissolved- oxygen concentration compared to old ground water. This is because dissolved oxygen can become depleted along a flowpath through various abiotic and biotic processes.
Samples collected by NAWQA with age-date information indicate that water recharged after 1955 (referred to here as young ground water) had higher dissolved-oxygen concentrations compared to ground water recharged prior to 1955 (referred to here as old ground water). Because ground water in recharge areas of aquifers is younger than ground water farther along a flowpath, a comparison of detection frequencies of VOCs between young, oxic ground water and old, anoxic ground water should be similar to a comparison of ground water at points along a hypothetical flowpath (fig. 11).
Dissolved oxygen in ground water was the factor most commonly associated with the occurrence of VOCs (p. 24 and 25). Oxygen is the
electron acceptor preferred by many microorganisms in their respiration of organic compounds.(34) Although the biodegradation of many VOCs can occur in either oxic or anoxic ground-water conditions, the rates of biodegra-dation usually are not equal.(35) Because the rates of biodegradation of VOCs in oxic and anoxic conditions differ, the detection frequencies of VOCs also can be expected to vary with differences in the dissolved-oxygen condition of ground water.
The type of VOC (major chemical class) also is important in deter-mining the rate of biodegradation in various dissolved-oxygen conditions. This is evident from the observation that, with the exception of MTBE and toluene, all of the other frequently detected VOCs in aquifers are haloge-nated aliphatic compounds (fig. 8). In general, halogenated aliphatic VOCs biodegrade more rapidly in anoxic conditions than in oxic conditions (see Circular’s Web site). Because about three-quarters of the samples from aquifer studies were oxic, compounds that biodegrade more slowly in oxic ground water, like halogenated aliphatic VOCs, should be more persistent and more frequently detected than compounds that degrade quickly in oxic ground water, like many petroleum hydrocarbons.
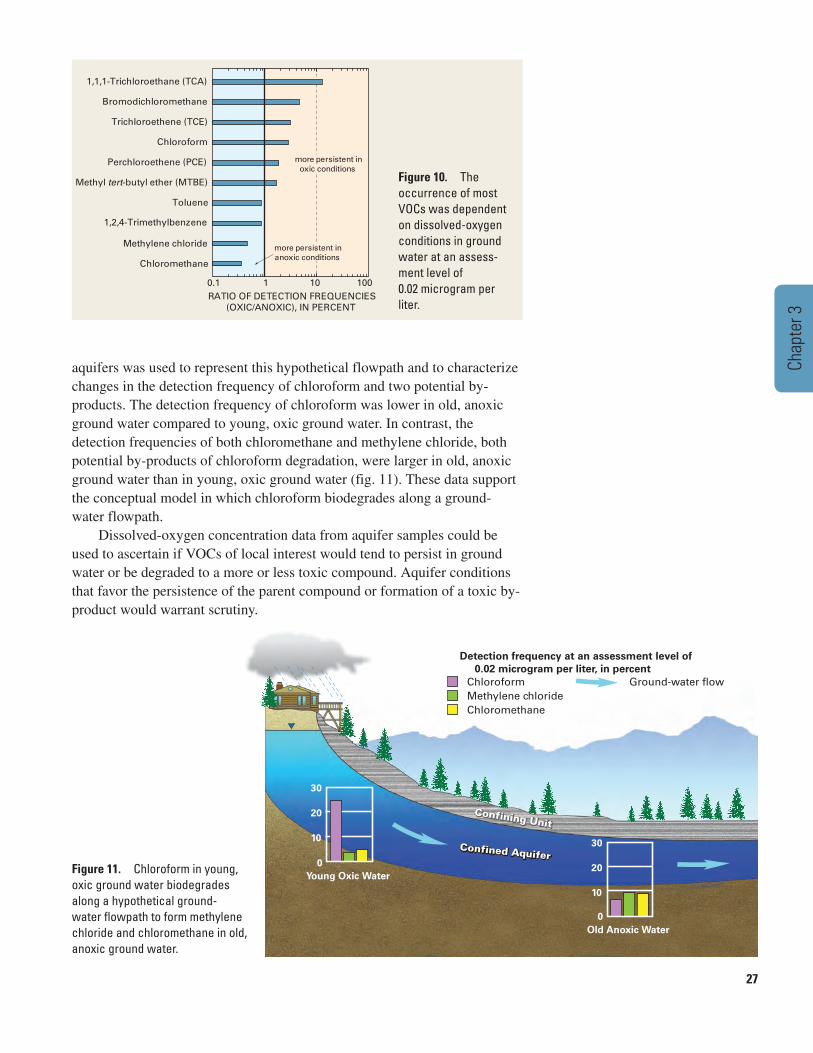
The ratios of the detection frequencies of 10 frequently occurring VOCs in oxic ground water compared to their detection frequencies in anoxic ground water differ markedly (fig. 10). Some VOCs, such as TCA, chloro-form, and PCE, were detected more frequently in oxic ground water than in anoxic ground water. Other VOCs, such as methylene chloride and chloro-methane, were detected more frequently in anoxic ground water. The differ-ences in detection frequencies for some of these VOCs are consistent with published rates of biodegradation for these VOCs under different dissolved-oxygen conditions.(35) For example, TCA has an aerobic half-life that is nearly twice as long as its anaerobic half-life (see Circular’s Web site). This indicates that TCA should be more persistent in oxic ground water than in anoxic ground water, which was confirmed by the relatively large detection frequency ratio of TCA.
A conceptual model illustrates how chloroform may undergo biodeg-radation along a hypothetical flowpath in an aquifer, along which dissolved oxygen becomes depleted (sidebar 16; fig. 11). A subset of samples from
27
Chap
ter 3
Figure 10. The occurrence of most VOCs was dependent on dissolved-oxygen conditions in ground water at an assess- ment level of 0.02 microgram per liter.
Figure 11. Chloroform in young, oxic ground water biodegrades along a hypothetical ground-water flowpath to form methylene chloride and chloromethane in old, anoxic ground water.
aquifers was used to represent this hypothetical flowpath and to characterize changes in the detection frequency of chloroform and two potential by- products. The detection frequency of chloroform was lower in old, anoxic ground water compared to young, oxic ground water. In contrast, the detection frequencies of both chloromethane and methylene chloride, both potential by-products of chloroform degradation, were larger in old, anoxic ground water than in young, oxic ground water (fig. 11). These data support the conceptual model in which chloroform biodegrades along a ground-water flowpath.
Dissolved-oxygen concentration data from aquifer samples could be used to ascertain if VOCs of local interest would tend to persist in ground water or be degraded to a more or less toxic compound. Aquifer conditions that favor the persistence of the parent compound or formation of a toxic by-product would warrant scrutiny.