Chapter 3 The statistics of disk and bulge parameters
21
Chapter 3 The statistics of disk and bulge parameters Abstract. The statistics of the fundamental bulge and disk parameters of galaxies and their relation to the Hubble sequence were investigated by an analysis of optical and near-infrared observations of 86 face-on spiral galaxies. The availability of near-infrared passband data made it possible for the first time to trace fundamental parameters related to the luminous mass while hardly being hampered by the effects of dust and stellar populations. The observed number frequency of galaxies was corrected for selection effects to calculate volume number densities of galaxies with respect to their fundamental parameters. The main conclusions of this investigation are: 1) Freeman’s law has to be redefined. There is no single preferred value for the central surface brightnesses of disks in galaxies. There is only an upper limit to the central surface brightnesses of disks, while for lower central surface brightnesses the number of galaxies per volume element decreases only slowly as function of the central surface brightness. 2) The Hubble sequence type index correlates strongly with the effective surface brightness of the bulge, much better than with the bulge-to-disk ratio. 3) The disk and bulge scalelengths are correlated. 4) These scalelengths are not correlated with Hubble type. Hubble type is a lengthscale-free parameter and each type therefore comes in a range of magnitudes (and presumably a range of total masses). 5) Low surface brightness spiral galaxies are not a separate class of galaxies. In a number of aspects they are a continuation of a trend defined by the high surface brightness galaxies. Low surface brightness galaxies are in general of late Hubble type. 1 Introduction The light of a spiral galaxy is dominated by two components, the disk and the bulge. The basic difference between these components lies in their support against gravitational collapse. The disk is almost completely rotationally supported, while the bulge is for some fraction also pressure supported. At least two parameters are needed to describe the light distribution of each of these components: a surface brightness term and a spatial scaling factor. The fundamental parameters of the disk are usually expressed in central surface brightness ( 0 ) and scalelength ( ), while the bulge parameters are expressed in effective surface brightness ( e ) and effective radius ( e ). These fundamental parameters were determined for a large statistically complete sample of galaxies by de Jong (1995a, Paper II). The distributions of the fundamental parameters are still poorly known and their statistics are investigated in this paper with some emphasis on three relationships: 1) “Free- man’s law”, the empirical relation found by Freeman (1970) indicating the constancy of disk central surface brightness among galaxies, 2) the number density of galaxies as a function of their fundamental parameters and 3) the relation between the fundamental parameters and Hubble classification. 1.1 Freeman’s law One of the most remarkable results presented in the classical paper of Freeman (1970) was the apparent constancy of the passband 0 of spiral galaxies. For a subsample of 28 (out of 36) galaxies he found 0 21 65 03 -mag arcsec 2 . If the central is approximately constant among galaxies, this translates directly into a constant central surface density of matter associated with the luminous material. Several authors have tried to explain this result. It has been argued that ignoring the contribution of the bulge to the light profile could produce the effect (Kormendy 1977; Phillipps & Disney 1983; Davies 1990). Freeman (1970) did not decompose the luminosity profiles in a bulge and disk, but fitted a line to the linear part of the luminosity profile plotted on a magnitude scale. This linear part of the profile could be con- taminated by bulge light. With their models Kormendy (1977) and Davies (1990) show that the central surface brightness of low surface brightness disks will be overestimated by this procedure because of the extra bulge light near the center. The central surface brightnesses of high surface brightness disks with a short scalelength are underestimated; because of the small disk scalelength the bulge light dominates the luminosity profile again in the outer region, but with a longer scale- length and a lower surface brightness than the disk. Several arguments can be raised against this interpretation (see also Freeman 1978): 1) even with bulge light included the result is still important, 2) many later type galaxies hardly have a bulge, but the effect is still present (van der Kruit 1987), 3) in samples where proper decomposition techniques are used the effect is still found, although with a larger dispersion (Boroson 1981), 4) a limited range in bulge parameter space was explored in the models mentioned above, which might not be representative of the bulges in spiral galaxies.
Transcript of Chapter 3 The statistics of disk and bulge parameters

Chapter 3
The statistics of disk and bulge parameters
Abstract. The statistics of the fundamental bulge and disk parameters of galaxies and their relationto the Hubble sequence were investigated by an analysis of optical and near-infrared observations of86 face-on spiral galaxies. The availability of near-infrared K passband data made it possible for thefirst time to trace fundamental parameters related to the luminous mass while hardly being hamperedby the effects of dust and stellar populations. The observed number frequency of galaxies was correctedfor selection effects to calculate volume number densities of galaxies with respect to their fundamentalparameters. The main conclusions of this investigation are:1) Freeman’s law has to be redefined. There is no single preferred value for the central surfacebrightnesses of disks in galaxies. There is only an upper limit to the central surface brightnesses of disks,while for lower central surface brightnesses the number of galaxies per volume element decreases onlyslowly as function of the central surface brightness.2) The Hubble sequence type index correlates strongly with the effective surface brightness of the bulge,much better than with the bulge-to-disk ratio.3) The disk and bulge scalelengths are correlated.4) These scalelengths are not correlated with Hubble type. Hubble type is a lengthscale-free parameterand each type therefore comes in a range of magnitudes (and presumably a range of total masses).5) Low surface brightness spiral galaxies are not a separate class of galaxies. In a number of aspectsthey are a continuation of a trend defined by the high surface brightness galaxies. Low surface brightnessgalaxies are in general of late Hubble type.
1 Introduction
The light of a spiral galaxy is dominated by two components,the disk and the bulge. The basic difference between thesecomponents lies in their support against gravitational collapse.The disk is almost completely rotationally supported, whilethe bulge is for some fraction also pressure supported. At leasttwo parameters are needed to describe the light distributionof each of these components: a surface brightness term anda spatial scaling factor. The fundamental parameters of thedisk are usually expressed in central surface brightness (�0)and scalelength (h), while the bulge parameters are expressedin effective surface brightness (�e) and effective radius (re).These fundamental parameters were determined for a largestatistically complete sample of galaxies by de Jong (1995a,Paper II). The distributions of the fundamental parameters arestill poorly known and their statistics are investigated in thispaper with some emphasis on three relationships: 1) “Free-man’s law”, the empirical relation found by Freeman (1970)indicating the constancy of disk central surface brightnessamong galaxies, 2) the number density of galaxies as a functionof their fundamental parameters and 3) the relation between thefundamental parameters and Hubble classification.
1.1 Freeman’s law
One of the most remarkable results presented in the classicalpaper of Freeman (1970) was the apparent constancy of theB passband �0 of spiral galaxies. For a subsample of 28 (out
of 36) galaxies he found h�0i=21:65� 0:3 B-mag arcsec�2 .If the central M=L is approximately constant among galaxies,this translates directly into a constant central surface densityof matter associated with the luminous material.
Several authors have tried to explain this result. It hasbeen argued that ignoring the contribution of the bulge tothe light profile could produce the effect (Kormendy 1977;Phillipps & Disney 1983; Davies 1990). Freeman (1970) didnot decompose the luminosity profiles in a bulge and disk, butfitted a line to the linear part of the luminosityprofile plotted ona magnitude scale. This linear part of the profile could be con-taminated by bulge light. With their models Kormendy (1977)and Davies (1990) show that the central surface brightnessof low surface brightness disks will be overestimated by thisprocedure because of the extra bulge light near the center. Thecentral surface brightnesses of high surface brightness diskswith a short scalelength are underestimated; because of thesmall disk scalelength the bulge light dominates the luminosityprofile again in the outer region, but with a longer scale-length and a lower surface brightness than the disk. Severalarguments can be raised against this interpretation (see alsoFreeman 1978): 1) even with bulge light included the result isstill important, 2) many later type galaxies hardly have a bulge,but the effect is still present (van der Kruit 1987), 3) in sampleswhere proper decomposition techniques are used the effect isstill found, although with a larger dispersion (Boroson 1981),4) a limited range in bulge parameter space was explored in themodels mentioned above, which might not be representative ofthe bulges in spiral galaxies.

78 j CHAPTER 3 j THE STATISTICS OF DISK AND BULGE PARAMETERS
Dust extinction has also been proposed as an explanationfor the constancy of�0 (Jura 1980; Valentijn 1990). If galaxiesare optically thick in the B passband, one is only looking oneoptical depth into the galaxies and always observes the sameouter layer. This removes the inclination dependence from theFreeman relation, but leaves the unsolved problem of why allgalaxies should have the same surface brightness at opticaldepth equal to one.
Freeman established his relation in the B passband wherethe light of galaxies is dominated by a very young populationof stars, which make up only a few percent of the stellar mass.Of all commonly used passbands the light of the massive oldstellar population is relatively the most important in the near-infrared (near-IR) K passband used here. TheK passband hasthe additional advantage that the extinction by dust is stronglyreduced. The K passband is therefore best suited to trace thefundamental parameters of the luminous mass. However, otherpassbands have been used as well in this study to investigatethe wavelength dependence of the bulge and disk parametersdue to dust and population effects.
De Vaucouleurs (1974) was one of the first to suggestthat the constancy of �0 might result from a selection effect.This was later quantified by Disney (1976) and Allen & Shu(1979). Catalogs of galaxies have usually been selected by eyefrom photographic plates using some kind of diameter limit.One might therefore select against very compact galaxies witha high central surface brightness, because these have smallisophotal diameters. Likewise, galaxies with a very low surfacebrightness might have been missed due to the lack of contrastwith the sky background. Disney & Phillipps (1983; see alsoDavies 1990) define a visibility for a galaxy, which enablesone to correct a sample for these selection effects if one hasmade a careful initial sample selection.
1.2 Bivariate distributions
Correcting for selection effects is in fact trying to determinefrom the observed statistics how many galaxies there are perunit volume with a certain property. More than one propertycan be used in determining such a distribution per volume.One needs at least two parameters to characterize the expo-nential light profile of a disk dominated galaxy and a bivariatedistribution function of both disk parameters is a more generalstatistical descriptionof galaxy properties than a one parameterfunction. The diameter, the central surface brightness and theluminosity distribution functions of galaxies are integrations ofthis bivariate distribution in a certain direction. In this processinformation is lost and the bivariate distribution function istherefore more useful in studies of deep galaxy counts andprovides more constraints on theories of galaxy formation andevolution than its one dimensional counterparts.
Bivariate distribution functions of galaxies have been deter-mined only a few times before (Choloniewski 1985; Phillips &Disney 1986; van der Kruit 1987, 1989; Saunders et al. 1990;Sodre & Lahav 1993). Even though different fundamentalparameters are used, almost all (except Saunders et al.) of thesedistributions describe fundamentally the same thing in different
ways. These studies were performed in the B or comparablepassbands, which is, as mentioned before, not the wavelengthmost suited to study global fundamental properties of galaxies.
1.3 Morphological classification
For classification of spiral galaxies on the Hubble sequencethree principal discriminators are used: 1) the pitch-angle ofthe spiral arms, 2) the degree of resolutionof the arms (into H II
regions, dust lanes and resolved stars) and 3) the bulge-to-disk(B/D) ratio. In his detailed description of the Hubble sequence,Sandage (1961) indicates that the B/D ratio is the weakestdiscriminator unless galaxies are seen edge-on. He finds clearmismatches in type between classifications using items 1) and2) and classifications using item 3). Another factor hampersthe use of B/D ratio for classification of early spirals. On thephotographs used for classification the central region of anearly spiral galaxy is normally overexposed in order to showclearly the faint spiral structure.
Still, the B/D ratio is often assumed to be the principleunderlying the Hubble sequence, even though a tight correla-tion between classification and measured B/D ratios was neverfound. The measurements indicate at best a trend (e.g. Simien& de Vaucouleurs 1986; Andredakis & Sanders 1994) and thediscrepancies between B/D ratio and Hubble type have beenattributed to two sources of error. First there is the uncertainty inclassification. Comparisons of Hubble types given by differentclassifiers show an rms uncertainty in type index of order 2T-units (Lahav et al. 1995). The second source of error is theuncertainty in the bulge/disk decomposition, due to, amongother things, the mathematical peculiarities of the widely usedr1=4 bulge law (de Vaucouleurs 1948).
1.4 Outline
The main goal of this investigation is to determine the nature ofthe Freeman law. In order to address the problems concerningthe Freeman law, a large sample of face-on spiral galaxieswas carefully selected and surface photometry was obtainedin the K passband as well as in several other passbands. Alarge number of other global and structural parameters of thegalaxies were determined in this investigation and their natureis also explored in this paper.
The remainder of this article is organized as follows. Thedata set and the extraction of the observed bulge and diskparameters are briefly described in Section 2. The correctionsto the observations in order to calculate number distributionsare described in Section 3 and these distributionsare presentedfor the B and the K passband in Section 4. The relationsfound are discussed within the context of the three main pointsof interest (Freeman’s law, bivariate distributions and Hubblesequence) in Section 5. The conclusions are summarized inSection 6.
2 The data
In order to examine the parameters describing the globalstructure of spiral galaxies, 86 systems were observed in the

CORRECTIONS j 79B; V;R; I;H andK passbands. A full description of the selec-tion, observations and data extraction can be found in de Jong &van der Kruit (1994, Paper I). The galaxies in this statisticallycomplete sample of undisturbed spirals were selected fromthe UGC (Nilson 1973) to have red diameters of at least twoarcmin and minor over major axis ratios larger than 0.625.The survey was limited to 12.5% of the sky globe. Standardreduction techniques were used to produce calibrated images.
In Paper II the extraction of the bulge and disk parametersfrom the calibrated images is described. An extensive erroranalysis was performed using different fit techniques. The bestresults were obtained with a model galaxy with an exponentialradial light profile for both bulge and disk, that was two-dimensionally (2D) fitted to the full calibrated image. This 2Dfit technique made it also possible to fit an additional Freemanbar (Freeman 1966) component, which improved the fit for23 of the 86 galaxies. The error analysis revealed the twodominant sources of error in the derived component parametersto be: 1) the assumed luminosity profile of the bulge and 2) theuncertainty in the sky background subtraction.
Assuming that the exponential profile is a reasonable de-scription of the bulge light distribution, the dominant source oferror in the parameters is caused by the uncertainty in the skybackground level. This uncertainty was not taken into accountusing the 2D fit technique, but the 1D errors can be used,because the 2D fit results are generally comparable to thedouble exponential 1D fit results (see Paper II, Fig.6). The 1Derrors do include the uncertainty of sky background subtractionand are always larger than the formal 2D fit errors. The 1Derrors are only shown in the graphs presented here if they aresignificantly larger than the symbol size.
In this paper the RC3 (de Vaucouleurs et al. 1991) mor-phological type index T is used (see also Paper I). Be-cause a few galaxies had no RC3 classification, I classifiedthem as UGC 1551–(8), UGC 1577–(4), UGC 9024–(8) andUGC 10437–(7). The mean error in type index in the RC3 isstated to be 0.89. This number seems to be very low. Lahav etal. (1995) showed that the dispersion between the RC3 T-indexand the T-values of six expert classifiers was on average 2.2T-units for a sample of 831 galaxies. The dispersion betweenany two classifiers ranged between 1.3 and 2.3 T-units, with 1.8on average. It is safe to say that the uncertainty in classificationin the RC3 is at least 1.5 T-units.
The data set comprises 86 galaxies in six passbands. Tokeep a clear view on the obtained results I will concentrate onthe two most extreme cases, the B and the K passband data.The results for the other passbands are available in electronicform. TheB andK passband results are displayed in the graphswith the same dynamic range (but often with different zero-points) and therefore they can be compared directly.
3 Corrections
The observed bulge and disk parameters determined in Paper IIhave to be corrected for all kinds of systematic effects. Thesecorrections are often uncertain but necessary. One can onlyexpect that they are at least in a statistical sense correct.
3.1 Galactic foreground extinction
The measurements of brightness and surface brightness werecorrected (unless stated otherwise) for Galactic foreground ex-tinction according to the precepts of Burstein & Heiles (1984)and the actualB passband extinction values were adopted fromthe RC3. The Galactic extinction curve of Rieke & Lebofsky(1985) was used to convert theseB passband extinction valuesto other passbands. The sample galaxies were selected to havea Galactic latitude larger than 25�; the extinction correction isin general small and gets smaller for the longer wavelengthpassbands. The average correction is 0.14 B-mag and thelargest correction is 0.68 B-mag, which translates into 0.06K-mag.
3.2 Inclination corrections
Since Valentijn (1990) reopened the debate of optically thinversus optically thick spiral galaxies, inclination correctionsfor surface brightness have become less trivial. A simple equa-tion for correcting surface brightnesses for inclination effects,taking internal extinction into account, has the form�i = � � 2:5C log(a=b); (1)
where a=b is the major over minor axis ratio of the galaxyand C the internal extinction parameter, which takes values0�C� 1. Fully transparent galaxies are described by C= 1,while the case C=0 describes the optically thick ones.
It is unlikely that the inclination correction indeed takessuch a form in the optical passbands, as extinction in theoptical passbands is for a considerable fraction caused by scat-tering and not just by absorption alone. Light will be scatteredpreferably from edge-on directions to face-on directions, whichmeans that extinctions will seem to be higher for edge-on thanfor face-on galaxies. On top of that, certain configurationsof dust and stars can behave optically thin in an inclinationtest, while they may in fact be completely opaque. A clearexample of this is a very thin layer of optically thick dustbetween a thicker slab of stars. It is not trivial to producea better description as there are too many unknowns and Citself may be a function of galactic radius (see e.g. Giovanelliet al. 1994; Byun et al. 1994). Therefore Eq. (1) is used as aworking hypothesis. However, for a face-on selected samplesuch corrections are small. The average correction for thesample examined here is 0.26 mag arcsec�2 when C = 1,with a maximum of 0.60 mag arcsec�2 if b=a=0:58.
3.3 Distances
The distances to the observed galaxies were calculated usinga Hubble flow with an H0 of 100 km s�1 Mpc�1, correctedfor infall into the Virgo cluster using the 220 model of Kraan-Korteweg (1986). This model assumes that the Local Grouphas an infall velocity of 220 km/s towards the Virgo clusterand describes the motions of the galaxies around the clusterby a non-linear flow model. The Vhel velocities needed for thismodel were calculated from the VGSR velocities listed in the

80 j CHAPTER 3 j THE STATISTICS OF DISK AND BULGE PARAMETERS
Fig. 1. The distance distribution of the sample galaxies. For thedashed line the VGSR velocities from the RC3 were used, the full lineindicates the distance distribution when the velocities are correctedfor Virgocentric infall.
RC3, which are also tabulated in Paper I. The nearest galaxyis at 6.2 Mpc, the most distant galaxy is at 82.5 Mpc. Thepeculiar velocities of galaxies were assumed to be on average200 km/s in the line of sight, which introduces an error (�d) of2 Mpc in the distance estimates. The distribution of distancesis displayed in Fig. 1, which shows a small excess of galaxiesat �45 Mpc because of an extension of the Pisces-Perseussupercluster. The relationships presented in this study are verylittle affected when other infall and flow models are used tocalculate distances.
3.4 Selection correction
The physically relevant quantities are not the observed numbersof galaxies with a certain property, but the frequency of galaxieswith a certain property in a volume. Therefore, the fact that agalaxy is included in the sample has to be linked to the statisticalprobability of finding such a galaxy in a certain volume. Thegalaxies in the sample were selected to have UGC red majoraxis diameter (Dlim
maj) of at least 2 arcmin. This creates a selec-tion bias against galaxies with low surface brightness and/orsmall scalelengths, as they appear smaller on photographicplates. The distances (d) to the observed galaxies and theirangular diameters (Dmaj) are known and the maximum distanceat which galaxy can be placed, while still obeying the selectioncriteria, can be calculated (dmax=dDmaj=Dlim
maj). A galaxy canonly enter the sample if it lies in a spherical volume whichhas this maximum observable distance as radius. Turning thisargument around, one can expect on statistical grounds that aselected galaxy samples a spherical volume with a radius equalto its maximum observable distance (a more formal discussioncan be found in Felten 1976). The volume sampled by a galaxyin a diameter limited sample is thusVmax = 4�
3(dmax)3 = 4�
3(dDmaj=Dlim
maj)3: (2)
Following the previous line of reasoning, an estimate for theaverage number of galaxies in a unit volume obeying a certainspecification (S) for a complete sample of N galaxies is
Φ(S) = NXi Si=V imax; (3)
where i is summed over allN galaxies in the sample andSi=1if the specification is true for galaxy i and Si=0 if false. Theerror in Φ(S), assuming Poison statistics in a homogeneousuniverse and considering the uncertainties in the distances, canbe calculated by�2
Φ(S) = NXi (Si=V imax)2 + �2d NXi (3Si=dV i
max)2: (4)
There is always a chance that a member of a peculiarclass of galaxy happens to be nearby and gets a lot weightin Eq.(3) and this volume correction can therefore only beapplied to large samples. One must ensure that a large enoughvolume of space is sampled so that galaxies are randomlydistributed in space. Figure 1 shows that the sample mainlytraces the local density enhancement, as large scale structuresin the universe have scales of order 50 Mpc. Equation 3 shouldtherefore be used with care, because the number of galaxieswith small intrinsic diameters will be overestimated relativeto the larger ones due to the local density enhancement. Theaverage number of galaxies per Mpc3 calculated with Eq. (3)might be more representative of the local environment than ofthe mean cosmological values. Still it is a useful equation toobserve general trends in bivariate distributionsand to compareresults obtained from different passbands.
Other methods to correct distributions for selection effectshave been advocated, because they take spatial density fluctua-tions into account (for an overview see Efstathiou et al. 1988).These methods assume that the intrinsic distribution functionis independent of position (x) in space, so that we can writeΦ(S) = �(S)�(x), thereby losing the absolute calibration ofthe number density. These methods all assume a clear relationbetween the distribution parameter(s) and the limiting selectionparameter(s). This is not the case for the current investigation.A diameter limit is not trivially linked to the central surfacebrightness distribution,certainly not when a different passbandis used for the selection and the distribution.
The correction of Eq. (3) is only valid if a particular galaxywould have been measured at the same intrinsic (as opposed toangular) diameter, had it been at a different distance. In Paper Iit was shown that this is probably the case for the UGC galaxieswith type index T�6. For later types the situation is less clear,there is a too short a range in diameters to check and it must beassumed that for late-type systems the same type of galaxy ismeasured at the same intrinsic diameter at different distances.Under this assumption it is not important that the UGC eyeestimated diameters of late-type galaxies correspond to loweraverage surface brightness than that of early types (see Paper I,Fig. 11). This effect just means that there are more late-typegalaxies in the sample than expected based on their isophotal
THE DISTRIBUTION OF DISK, BULGE AND BAR PARAMETERS j 81
diameter, but their average distance will be larger so that thenumber of galaxies per sampled volume stays the same.
The volume correction of Eq. (3) can be used to calculatenumber density distributions for all passbands, as long asthe red UGC diameters are used to calculate the Vmax. Thedistribution of any galaxy parameter Si can be determined inany passband; the use of the red UGC diameters in Eq. (3)ensures the correction for the intrinsic selection effects of thewhole sample.
Next to the diameter limit, there are two more selectioncriteria defining the sample. The selection was limited to 12.5%of the sky and only galaxies with b=a>0:625were used, whichis only 37.5% of all possible random orientations. Equation 3was corrected for these selection criteria. A correction was alsoapplied for the fraction of galaxies for which no (photometric)data was available in a certain passband. All these correctionswere made under the assumption that the incompleteness hadno correlation with the investigated parameters.
Equation (3) can only be applied when the sample is com-plete. The statistical completeness of the sample can be testedwith the V=Vmax-test (Paper I). The V=Vmax of a galaxy isthe spherical volume associated with the distance of a galaxydivided by Vmax as defined in Eq.(3), thus for a galaxy in thisdiameter limited sample V=Vmax =(Dlim
maj=Dmaj)3. For objectsdistributed randomly in space the average value of V=Vmax
should be 0:5�1=p12�N , whereN is the number of objectsin the test. For the current sample hV=Vmaxi=0:57� 0:03 andtherefore there are slightly too many galaxies with a smallangular diameter in the sample. The original sample of 368galaxies from which the current subsample was selected hada hV=Vmaxi = 0:496� 0:015 (Paper I). Subsequent selectiondepended only on the position on the sky and therefore theexcess of small diameter galaxies is probably caused by thedensity enhancement of the Pisces-Perseus supercluster, whichgives some extra galaxies at the diameter selection limit. Thismight give some extra high surface brightness and/or largescalelength galaxies in the sample above the cosmologicalmean, because galaxies have to be intrinsically large to beincluded in the sample being at the distance of the Pisces-Perseus supercluster.
In a recent paper Davies et al. (1994) argued that the sampleused by van der Kruit (1987) was incomplete in a magnitudeV=Vmax-test. They argued that a hidden magnitude limit hadinfluenced the selection, so that an extra selection correctionshould be applied. I will follow up on this argument as thesample used here has been selected using similar criteria asvan der Kruit used for his sample. 1
There is nothing hidden about a magnitude selection ef-fect for a diameter limited sample. On the contrary, it isexpected. For galaxies with a certain absolute magnitude M1 Davies et al. (1994) also indicate that van der Kruit’s samplebecomes incomplete for low surface brightnesses at �0 > 22:3 ashV=Vmaxi = 0:35 � 0:08. I would like to note that this might justbe a statistical fluctuation of low number statistics, as hV=Vmaxi =0:41� 0:10 for �0>22:5 and hV=Vmaxi=0:46� 0:13 for �0>22:7,and thus for even lower surface brightnesses the sample is in thestatistically complete range of hV=Vmaxi=0:5.
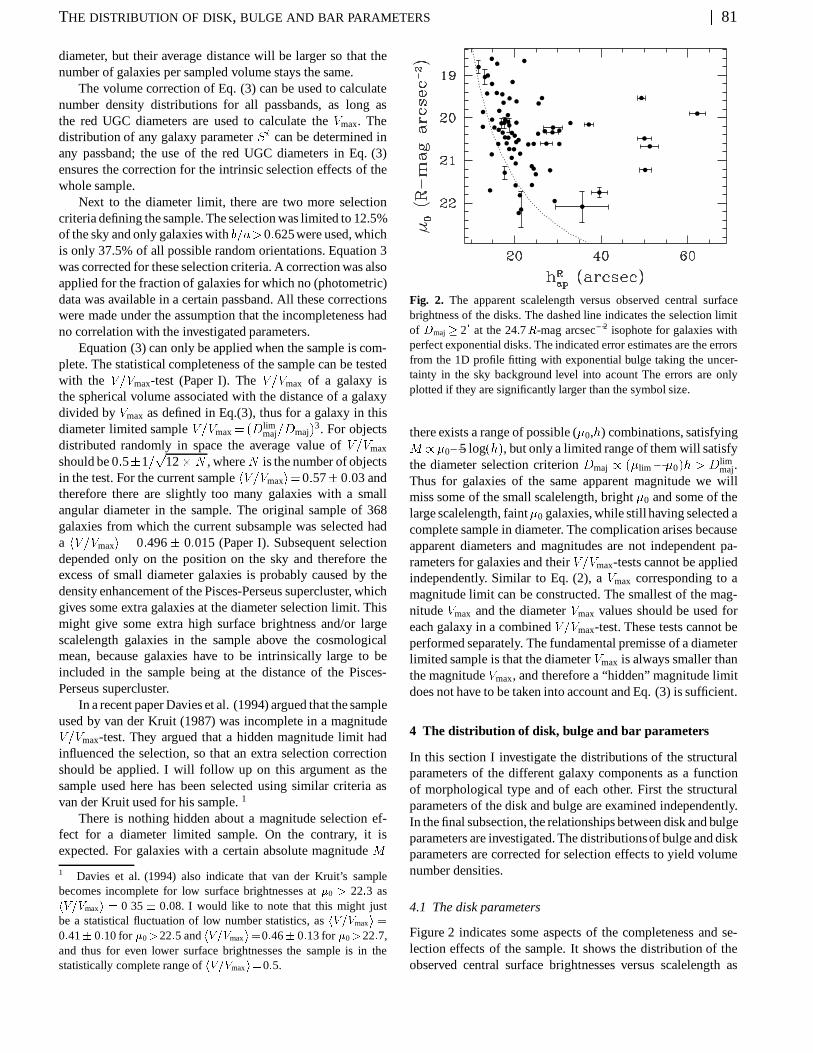
Fig. 2. The apparent scalelength versus observed central surfacebrightness of the disks. The dashed line indicates the selection limitof Dmaj � 20 at the 24.7R-mag arcsec�2 isophote for galaxies withperfect exponential disks. The indicated error estimates are the errorsfrom the 1D profile fitting with exponential bulge taking the uncer-tainty in the sky background level into acount The errors are onlyplotted if they are significantly larger than the symbol size.
there exists a range of possible (�0,h) combinations, satisfyingM/�0�5 log(h), but only a limited range of them will satisfythe diameter selection criterion Dmaj / (�lim��0)h > Dlim
maj.Thus for galaxies of the same apparent magnitude we willmiss some of the small scalelength, bright �0 and some of thelarge scalelength, faint�0 galaxies, while still having selected acomplete sample in diameter. The complication arises becauseapparent diameters and magnitudes are not independent pa-rameters for galaxies and their V=Vmax-tests cannot be appliedindependently. Similar to Eq. (2), a Vmax corresponding to amagnitude limit can be constructed. The smallest of the mag-nitude Vmax and the diameter Vmax values should be used foreach galaxy in a combined V=Vmax-test. These tests cannot beperformed separately. The fundamental premisse of a diameterlimited sample is that the diameter Vmax is always smaller thanthe magnitude Vmax, and therefore a “hidden” magnitude limitdoes not have to be taken into account and Eq. (3) is sufficient.
4 The distribution of disk, bulge and bar parameters
In this section I investigate the distributions of the structuralparameters of the different galaxy components as a functionof morphological type and of each other. First the structuralparameters of the disk and bulge are examined independently.In the final subsection, the relationships between disk and bulgeparameters are investigated. The distributionsof bulge and diskparameters are corrected for selection effects to yield volumenumber densities.
4.1 The disk parameters
Figure 2 indicates some aspects of the completeness and se-lection effects of the sample. It shows the distribution of theobserved central surface brightnesses versus scalelength as

82 j CHAPTER 3 j THE STATISTICS OF DISK AND BULGE PARAMETERS
obtained from the 2D fits of Paper II. The R passband valuesare plotted, because these values are most closely related tothe (red UGC diameter) selection criteria. The dotted lineindicates the selection limit for a diameter cutoff at 2 arcmin ata surface brightness of 24.7R-mag arcsec�2 for a perfect expo-nential disk. The 24.7 R-mag arcsec�2 is the average surfacebrightness at which the UGC red diameters were determined(see Paper I). As mentioned in Paper I, not all UGC galaxieshad their diameters estimated at the same isophote level. Thisexplains why there are some galaxies to the left of the selectionline in Fig. 2. If all galaxies have the same scalelength, thenumber of galaxies expected in the sample will decrease ash3
ap and therefore it is not surprising that there are hardly anygalaxies in the sample below 22 R-mag arcsec�2 . Obviouslyno galaxies can enter the sample with �0 fainter than �24.7R-mag arcsec�2 .
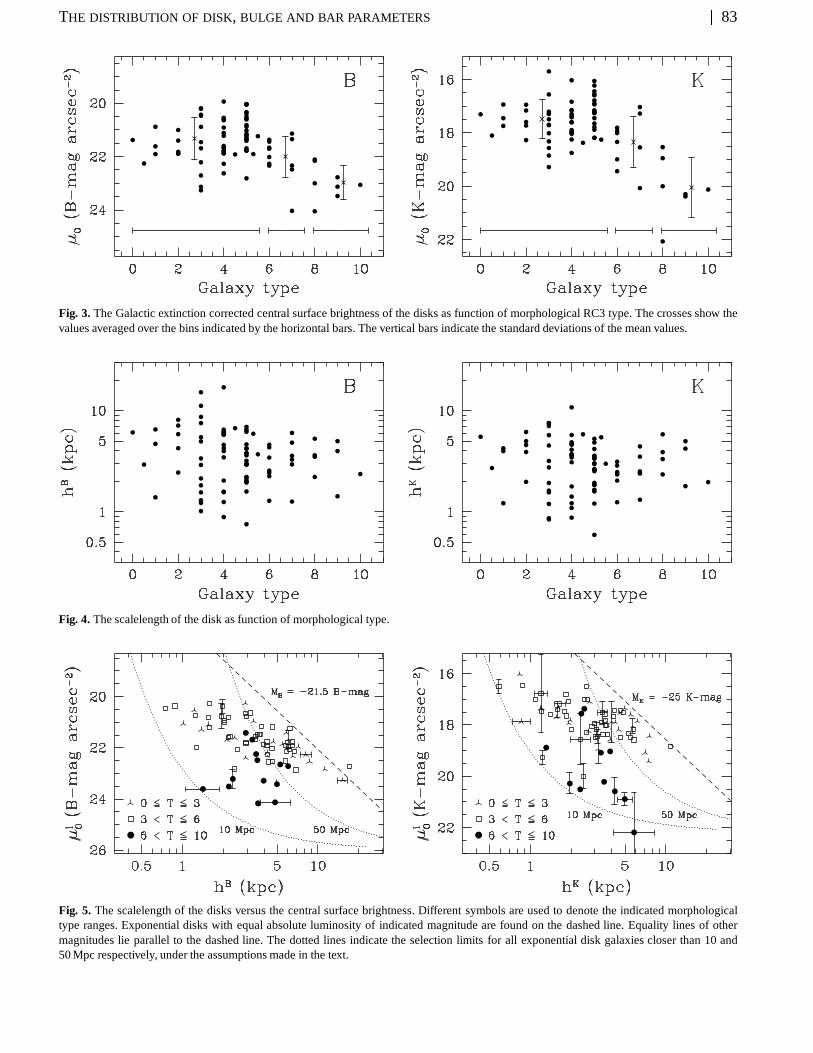
Let us now look at the central surface brightness as functionof morphological type (Fig. 3). Apparently the galaxies fromtype T=1 to 6 have on average the same �0, but with a largescatter. The later types have on average a significantly lowercentral surface brightnesses and they might be classified aslate types just because they are low surface brightness (LSB)systems. It can be readily seen that this difference between earlyand late-type galaxies increases when going from the B to theK passband. This indicates that disks of the later type spiralsare bluer than the disks of the early ones, but the discussionon the colors of these galaxies is postponed to Paper IV in thisseries (de Jong 1995b). The average �0 values were calculatedfor three morphological type bins indicated by the horizontalbars in Fig. 3 as well as for the total sample. The values withtheir standard deviations are tabulated in Table 1.
The average �0 values were also calculated with an incli-nation correction according to Eq. (1) with values for C=0:5and C = 1 (semi transparent and completely transparent be-havior). The results can also be found in Table 1. The standarddeviations on the average �0 values are slightly smaller forC = 1, and even though it is a small effect, it is persistent forall subgroups and all passbands. The main result is of coursea shift in the mean central surface brightness of the disks. Forall remaining plots an inclination correction withC=1 will beused.
The distributionof the other disk parameter, the scalelength(h), as function of type is shown in Fig. 4. There is no trend ofhwith type and there is a large range in scalelengths. There mightbe a lack of late-type galaxies with small scalelengths, but thiscan probably be attributed to a selection effect: the selectioncriteria are heavily biased against LSB galaxies with smallscalelengths. The scalelengths are smaller in the B passbandthan in the K passband (discussion in Paper IV).
The information of Figs 3 and 4 are combined in Fig. 5.This figure shows that there is an upper limit in the (�0,h)-plane, as there are no galaxies with large scalelengths and highcentral surface brightnesses. This cannot be caused by selectioneffects, large bright galaxies just cannot be missed in a diameterselected sample. This upper limit has been noted before byGrosbøl (1985). The upper limit partly follows the line of
constant total disk luminosity, as indicated by the dashed linein Fig. 5. Note that the Tully-Fisher relation (1977, hereafterTF-relation) implies that this is also a line of constant maximumrotation speed of the disk. There is also an upper limit to thecentral surface brightness at about 20 B-mag arcsec�2 (16 K-mag arcsec�2). Again galaxies brighter than these limits arehard to miss because of selection effects.
Late-type galaxies have lower central surface brightnessesin Fig. 5, but the early and intermediate types show no segre-gation. The scalelengths also gives no segregation according totype. Very few late-type galaxies with very short scalelengthswere selected, but as shown before, late-type galaxies havelower surface brightnesses and the selection biases againstgalaxies with low surface brightness and short scalelengths arelarge. These biases are indicated by the dotted lines in Fig. 5.To the right of these lines the sample should be completeto the indicated distance. The lines are calculated under theassumption that all galaxies have perfect exponential diskswith the same color at the selection radius (B–R = 1:3, R –K = 2:5) and that the selection limit is at 20 diameter at the24.7 R-mag arcsec�2 isophote (as in Fig. 2). Although theseassumptions are not valid for an individual galaxy, the dottedlines help to estimate the selection effects; the galaxies nearthe 50 Mpc line had about 125 times more chance of beingincluded in the sample than the galaxies near the 10 Mpc line!The fact that the number density of objects does not decreaseby 125 from one line to the other already indicates that there aremany more “small” galaxies per volume element than “large”galaxies.
The distribution of the absolute magnitude of the disk(Mdisk) against type (Fig.6) can also be deduced from Figs 3and 4 (Mdisk / �0�2:5 log(2�h2), no inclination dependentextinction correction was applied). As scalelengths show littlecorrelation with type, the distribution of disk magnitudes re-flects the distribution of the central surface brightness againsttype. There was no apparent segregation according to barclassification in Figs 3, 4, 5 and 6.
So far, only the observed distributions were presented, butthe distributionsper volume are of more importance. Thereforethe volume correction as described in Section 3 was applied.The correction transforms Fig. 5 into the bivariate distributionin the (�0,h)-plane presented in Fig. 7. This is a representationof the true number distribution of spiral galaxies per volumeelement of one Mpc3 with respect to both disk parameters.The magnitude and �0 upper limits noticed in Fig. 5 are alsopresent here. We are dealing with low number statistics now,which is reflected in the erratic behavior of the distribution.Theuncertainty increases in the direction of small scalelength andlow surface brightness. These galaxies have so small isophotaldiameters that they really have to be nearby to be included inthe sample and such a small volume is sampled that statisticsare working against us. For example if the true volume densitiesin the (17K-mag arcsec�2 , 1 kpc) and (21K-mag arcsec�2 ,1 kpc)-bins are equal, the chance of observing a galaxy inthe last bin would be 0.5. If there had been such a galaxy inthe sample, a lot of weight would have been given to it. Inshort, the distributions are not well sampled in the low surface
THE DISTRIBUTION OF DISK, BULGE AND BAR PARAMETERS j 83
Fig. 3. The Galactic extinction corrected central surface brightness of the disks as function of morphological RC3 type. The crosses show thevalues averaged over the bins indicated by the horizontal bars. The vertical bars indicate the standard deviations of the mean values.
Fig. 4. The scalelength of the disk as function of morphological type.
Fig. 5. The scalelength of the disks versus the central surface brightness. Different symbols are used to denote the indicated morphologicaltype ranges. Exponential disks with equal absolute luminosity of indicated magnitude are found on the dashed line. Equality lines of othermagnitudes lie parallel to the dashed line. The dotted lines indicate the selection limits for all exponential disk galaxies closer than 10 and50 Mpc respectively, under the assumptions made in the text.

84 j CHAPTER 3 j THE STATISTICS OF DISK AND BULGE PARAMETERS
Fig. 6. The distribution of absolute disk magnitudes as function of type index.
Table 1. The average Galactic extinction corrected central surface brightnesses for different inclination corrections (Eq. (1)) and type indexbins. C = 0 corresponds to an optically thick disk, C = 0:5 to a semi transparent disk and C = 1 to a fully transparent disk. The values are inmag arcsec�2 with their standard deviations.h�0i (B-mag arcsec�2) h�0i (K-mag arcsec�2)
RC3 type nr. C = 0 C = 0:5 C = 1 nr. C = 0 C = 0:5 C = 10 � T < 6 61 21.32 � 0.78 21.45� 0.76 21.58 � 0.74 60 17.48 � 0.71 17.61� 0.69 17.75� 0.676 � T < 8 12 22.01 � 0.75 22.16� 0.73 22.30 � 0.72 10 18.34 � 0.90 18.50� 0.90 18.65� 0.908 � T � 10 8 22.97 � 0.60 23.12� 0.57 23.26 � 0.55 7 20.05 � 1.05 20.21� 1.03 20.37� 1.01
all 81 21.59 � 0.92 21.72� 0.90 21.86 � 0.89 77 17.82 � 1.08 17.96� 1.08 18.10� 1.08
brightness, small scalelength region. No galaxies were selectedin this region, but the traced volume is also very small. Thedominant type of spiral galaxy has a scalelength of about 1 kpcand a central surface brightness of 21 B-mag arcsec�2 (17 K-mag arcsec�2).
By summing all bins in one direction, the bivariate dis-tributions of Fig. 7 can be used to calculate the distributionsof �0 and h separately. This figure indicates therefore whereone can expect problems in the determinations of the �0 andh distributions due to the undersampling in the low surfacebrightness, small scalelength region. The �0 distributions willget incomplete for central surface brightnesses fainter than 21.5B-mag arcsec�2 (19 K-mag arcsec�2 ) and the h distributionsshould not be trusted for scalelengths smaller than 1 kpc. Theundersampling in the �0 distribution is considerably reducedwhen only the galaxies with scalelength larger than 1 kpc areused. The undersampling problem of this sample could alsobe circumvented by imposing absolute magnitude or intrinsicdiameter limits. To speak of the �0 distribution is incorrectand one should indicate to what type of galaxies the sample isrestricted.
The distributionsof central surface brightnesses of galaxieswith scalelength larger than 1 kpc are displayed in Fig. 8.The distributions are remarkably flat for the total sample. Thenumber density density decreases by about a factor of 4 from�0
i ' 21 to 24 B-mag arcsec�2 and by a factor �10 from17.5 to 22 K-mag arcsec�2 . The distributions are narrowerwhen only types earlier than T=6 are used. Disks of late-
type galaxies are bluer, which makes the overall distributionnarrower in B than in K. The distributions are not limited byselection effects at the bright end, even if one assumes there isan upper limit to the total luminosity of a galaxy (see Fig. 5).The number density of galaxies decreases sharply with �i0brighter than 20 B-mag arcsec�2 (�16 K-mag arcsec�2 ). Atthe faint end a limited volume is sampled, and Fig. 5 indicatesthat the sample is biased against galaxies with a �i0 fainter than23 B-mag arcsec�2 even for galaxies with scalelength largerthan 1 kpc. Obviously galaxies with central surface brightnessfainter than 26 B-mag arcsec�2 could never enter the sample.The distributions of �0 in Fig. 8 could be slightly higher atthe faint end and should probably be extended to much lowersurface brightnesses.
The volume corrected distributions of the logarithm of thescalelengths (Fig. 9) show first a small increase of galaxies toscalelengths of about 1 kpc. This is probably caused by theundersampling effect at low surface brightnesses and smallscalelengths. For scalelengths larger than 1 kpc we notice asteady decline of about a factor 100 in one dex. There is nosegregation with morphological type.
The most important results obtained in this subsectionare as follows. There is a large range in disk central surfacebrightnesses among galaxies, mainly due to the lower surfacebrightnesses of late-type galaxies. The range decreases slightlywhen a transparent inclination correction is used. Selectioneffects are very significant in determining number densitydistributions and after correcting for these effects there is no

THE DISTRIBUTION OF DISK, BULGE AND BAR PARAMETERS j 85
Fig. 7. The volume corrected bivariate distribution of galaxies in the (�0,h)-plane. The number density Φ(�i0,h) is per bin size, which is in stepsof 0.3 in log(h) and 1 mag arcsec�2 in �i0.
Fig. 8. The volume corrected distribution of the central surface brightness. The dashed line indicates the distribution for types earlier than typeT=6. The number density is per bin size, which is in steps of 0.75 mag arcsec�2 in �0.
Fig. 9. The volume corrected distribution of the disk scalelengths. The dashed line indicates the distribution for type earlier than T=6. Thenumber density is per bin size, which is in steps of 0.2 in log(h).

86 j CHAPTER 3 j THE STATISTICS OF DISK AND BULGE PARAMETERS
Fig. 10. The Galactic extinction corrected effective surface brightness of the bulge as function of morphological RC3 type.
Fig. 11. The effective radius of the bulge as function of morphological type.
Fig. 12. The effective radius of the bulge versus the effective surface brightness at this radius. Different symbols are used to denote the indicatedtype ranges.

THE DISTRIBUTION OF DISK, BULGE AND BAR PARAMETERS j 87
Fig. 13. The Galactic extinction corrected absolute magnitude of the bulge as function of morphological RC3 type.
Fig. 14. The volume corrected bivariate distribution of galaxies in the (�e ,re)-plane. The number density Φ(�e,re) is per bin size, which is insteps of 0.3 in log(re) and 2 mag arcsec�2 in �e.
single preferred value for the central surface brightnesses ofdisks. There is an upper limit to �0, but the number densitydistribution decreases only slowly at the faint end.
4.2 The bulge parameters
The same diagrams used to describe the disk parameters arenow used to present the bulge parameters. The distributionsof effective surface brightness are presented in Fig. 10. Theeffective surface brightness shows a tight correlation with typeindex, especially considering the uncertainty of at least 1.5T-units (1 sigma) in type index (Lahav 1995). Almost all ofthe scatter can be explained by this uncertainty. This relationalso holds for the �e parameters obtained with the other fittingmethods presented in Paper II, although with a slightly largerscatter. There is no apparent correlation of effective radiuswith galaxy type (Fig. 11). The relations in Figs 10 and 11 aretighter in K than in B. There are several explanations for thiseffect. Bulges are relatively brighter with respect to the disks in
K compared to B, which will make the fit routine work better.Furthermore, circumnuclear star formation and dust lanes willaffect theB passband more than theK passband and make thequality of the decomposition worse. There are some galaxiesin the sample with clear circumnuclear star formation and withdust lanes right down to the center. Finally, there is the effect ofthe Freeman Type II profiles (Freeman 1970) which is reducedinK, thus making fitting easier (see Paper II). The distributionof points in the (�e,re)-plane (Fig. 12) shows no correlation.The absence of a correlation between re and morphologicaltype makes the trend in the distribution of the absolute bulgemagnitude (Mbulge / �e�2:5 log(r2
e )) versus type (Fig. 13)dominated by the �e. rather large though.
The bivariate distribution of �e and re (Fig. 14) shows notrends. The dominant type of galaxy in our local universe hasa bulge with effective radius in the range of 0.1-0.3 kpc andeffective surface brightness of order 21 B-mag arcsec�2 (�16K-mag arcsec�2). The relation between the bulge parametersand the diameter selection criterion is not very obvious and

88 j CHAPTER 3 j THE STATISTICS OF DISK AND BULGE PARAMETERS
Fig. 15. The volume corrected distribution of the effective surface brightnesses of the bulge. The dashed line indicates the distribution for typeswith T<6. The Φ distribution is per bin size, which is in steps of 0.75 mag arcsec�2 in �e .
Fig. 16. The volume corrected distribution of the bulge effective radii. The dashed line indicates the distribution for types with T<6. The Φdistribution is per bin size, which is in steps of 0.2 in log(re).
therefore all galaxies are used in the calculations of the separatebulge parameter distributions. The volume corrected distribu-tions of the bulge �e and re (Figs 15 and 16) show the samebehavior as the disk parameters, i.e. constant distributionof theeffective surface brightness and a steady decline of a factor of50-100 per dex of the effective radius in the K passband.
4.3 The bulge/disk relation
The chronologyof the bulge and disk formation is a major issueand the relationships between bulge and disk parameters mightgive some insight in this matter. A strong correlation betweenbulge and disk parameters is expected if the bulge formed fromthe disk by secular evolution. A correlation might be expectedin the hierarchical infall and small merger models producingbulges, because both bulge and disk originate from the samesmaller components. In models where the bulge forms first andthe disk forms later, there is no obvious reason for a bulge-diskcorrelation.
Comparing the �i0 with �e (Fig. 17) we see no correlation,except that the late-type spirals clearly stand out. This is mostobvious in the K passband. The correlation between h andre (Fig. 18) is only tight in the K passband and not in the Bpassband. Actually the correlation is becoming steadily tighterfrom the B to the K passband with correlation coefficientsincreasing from 0.6 inB and V to� 0:75 inR and I and� 0:8inH andK passbands. The equation for the least squares fittedline is in the K passband
log(rKe ) = 0:95 log(hK)� 0:86 (1)
with a standard deviation of 0.17. The scalelength differencebetween bulge and disk thus is of order 10. The relation alsoholds for all the 1D fit techniques presented in Paper II (but lessstrongly) except for the case of an r1=4 law bulge. In the caseof 1D r1=4 law bulge there is at best a weak trend (correlationcoefficient 0.15). This relation could partly be produced by thefitting routine if the errors in both parameters are intrinsicallycorrelated. The facts that this relation holds in the K but not

THE DISTRIBUTION OF DISK, BULGE AND BAR PARAMETERS j 89
Fig. 17. The central surface brightness of the disk versus the effective surface brightness of the bulge. Different symbols are used to denote theindicated morphological type ranges.
Fig. 18. The scalelength of the disks versus the effective radius of the bulge. Different symbols are used to denote the indicated morphologicaltype ranges. The dashed line in the K passband diagram gives the least squares fit relationship between both parameters.
Fig. 19. The galactic absorption corrected absolute magnitude of the disk versus that of bulge. Morphological types ranges are denoted by theindicated symbols.

90 j CHAPTER 3 j THE STATISTICS OF DISK AND BULGE PARAMETERS
Fig. 20. The bulge to disk ratio as function of morphological type, using the results from the 2D fit of Paper II.
Fig. 21. The bulge to disk ratio as function of morphological type using an r1=4 law bulge in the bulge/disk decomposition.
in the B passband and for both of the totally different 1D and2D fitting techniques indicate that the correlation is intrinsicand not an artifact of the fit routines. The �2 distributionaround the solutions found by the fit routine also showed nocorrelation with the relationship between disk scalelength andbulge effective radius.
The absolute magnitudes of bulge and disk correlate well(Fig. 19). This is probably an example that large galaxies havemore of everything, more bulge, more disk. The combined ef-fect of good correlation between re and h and weak correlationbetween �0 and�e ensures the correlationbetweenMd andMb.Looking at the bulge-to-disk ratio as function of morphologicaltype (Fig. 20), one sees that there is a correlation, but thiscorrelation is less strong than for instance the one of �e withtype (Fig. 10). The B/D ratio is on average higher inK than inB; bulges are redder than disks. This partly explains why thecorrelations which involve bulge parameters are tighter in K.The bulge/disk decomposition is more easily performed whenthe bulge is relatively brighter.
Fig. 20 shows also that the selected galaxies are indeeddisk dominated systems. The B/D ratios plotted here are much
smaller than the ratios normally found in the literature. This ismainly due to the use of an exponential bulge. In Fig. 21 theresults with an r1=4 law bulge (Paper II) are shown. The B/Dratios are higher, but the scatter has increased and there still isno tight correlation with morphological type.
5 Discussion
In this section I will place the previously described relations inthe context of the three topics of main interest: 1) Freeman’slaw, 2) bivariate distributions and 3) the relation betweenHubble classification and the structural parameters. I will con-clude this section by confronting some galaxy formation andevolution theories with the newly found and some well knownrelationships. A combination of several models is probablyneeded to explain all aspects discussed here.
5.1 Freeman’s law
Since Freeman 1970 found disk central surface brightnesses tobe constant among spiral galaxies, a number of explanationshave been brought forward. In the introduction three expla-

DISCUSSION j 91
nations were mentioned: 1) optically thick dust, 2) erroneousmeasuring of the disk parameters from the light profiles and 3)selection effects. For each of these possibilities I check if theyare of importance for the current sample and whether they canexplain Freeman’s result.
5.1.1 Optically thick dust
It has been suggested that optically thick dust could be thecause of Freeman’s law (Jura 1980; Valentijn 1990; Peletier etal. 1994). This is only a partial explanation, because it removesthe inclinationdependence from the law. To produce Freeman’slaw in this way, galaxies must have the same surface brightnessat � = 1 (where the typical surface brightness is produced inan optically thick system), which means the problem is onlyshifted from one part of the galaxy to another. One now hasto explain why all galaxies have the same surface brightnessat � = 1. Taking a constant dust-to-stellar light ratio will notproduce a constant surface brightness. This is only the caseif all dust is in front of the star light, but dust and stars aremixed in a galaxy and a fraction of stars to the near side is lessobscured. The amount of extinction in a galaxy is not linearlydependent on the amount of dust present (see also Paper IV).Coupling the amount of dust and stars in galaxies can onlyreduce the scatter in �0, but can never produce a constant �0.
I have shown that applying the inclination correction ofEq. (1) reduces the scatter in the �0 of the disk going fromC=0 to C=1 (Table 1, indicating transparent behavior. Theeffect is small and the scatter is still dominated by the intrinsicdifferences in the brightnesses of the disks. One should realizethat the disk parameters are largely determined by the outerregions of the galaxy. They probably do not reflect the opticalthickness of the central regions. I note again that galaxies canbehave optically thin in an inclination test, while in fact beingoptically thick.
The K passband data should hardly be affected by dustextinction. Looking at Table 1 one can see that the standarddeviation of �0 is for the early-type galaxies smaller in the Kpassband than in theB passband, contrary to what is expectedfor optically thick dust. The increase in standard deviationsfor the later types can be explained by stellar populationdifferences (Paper IV). I conclude that dust extinction is not amajor effect in Freeman’s law, certainly not in theK passbanddata used here.
5.1.2 Erroneous profile fitting
Kormendy (1977), Phillipps & Disney (1983) and Davies(1990) have argued that Freeman’s law results from fittingthe exponential disks to light profiles without taking the bulgecontribution to the profiles into account. To prove their point,they created model profiles with r1=4 law bulges and expo-nential disks with a range of properties, to which exponentialdisks were fitted in a specified range. These models were ableto reproduce Freeman’s “universal” central surface brightnessvalue of 21.65 B-mag arcsec�2 with just a small scatter.
The parameter space explored in the models is not veryphysical according to current insights. Kormendy 1977 usedB/D ratios of 1–120 for the low surface brightness systems and
Phillipps& Disney 1983 assumed that bulges were so extendedthat they dominated the light profiles again at the 24.5 B-magarcsec�2 . Davies (1990) used a range of properties for the bulgeparameters which are typical in samples of galaxies, whichsuffer from severe selection effects. He used a constant centralsurface brightness of the bulge to show that the central surfacebrightnesses of disks need not be constant. A change in re=hratio was used to produce a range in bulge-to-total light ratios(BT ). I have shown that �e is not constant (Fig. 10) and thatthe re=h ratio is nearly constant (Fig. 18). Even though theseresults where obtained with a exponential rather then a r1=4
law bulge, a constant central brightness for bulges is excludedand a relationship between re and h might be expected.
Fig. 22. The variation of the measured extrapolated central surfacebrightness (�x) with bulge-to-total light ratio (BT ) ranging from 0.05to 0.75, at a given model central surface brightness �0 (see text).
I use the parameterization of Davies 1990 to show thaterroneous bulge/disk decomposition is not a major factor inthe Freeman law. Figure 22 was produced in the same wayas Davies’ Fig. 6 by fitting exponential profiles in the rangeof 22 to 25.5 mag arcsec�2 to model profiles, which were acombination of an r1=4 law bulge and an exponential disk. Inthis figure the intrinsic�0 of the model profile is compared withthe central surface brightness of the fitted disk (�x). The re=hratio was taken fixed to 0.4 and �e was adjusted to produceBTratios in the range from 0.05 to 0.75 in steps of 0.1 (contraryto Davies, who used a fixed �e and varied the re=h ratio).The tendency to shift intrinsic bright disks to the observedvalue of 21.65 mag arcsec�2 has disappeared. The low surfacebrightnessdisks have too bright�x values for their�0, but thesewere clearly fitted in the curved part of the profile at the brighterend. From Fig. 22 one can conclude that it is unlikely that thehigh surface brightness disks were underestimated (even withusing the “marking the disk” fit of Paper II). The situation forLSB systems is not as bad as it seems, because the B/D ratiosare low for LSB galaxies and the curvature of the profiles canbe readily seen. Choosing values for re/h in the range from 0.1to 1 hardly changes these results.
92 j CHAPTER 3 j THE STATISTICS OF DISK AND BULGE PARAMETERS
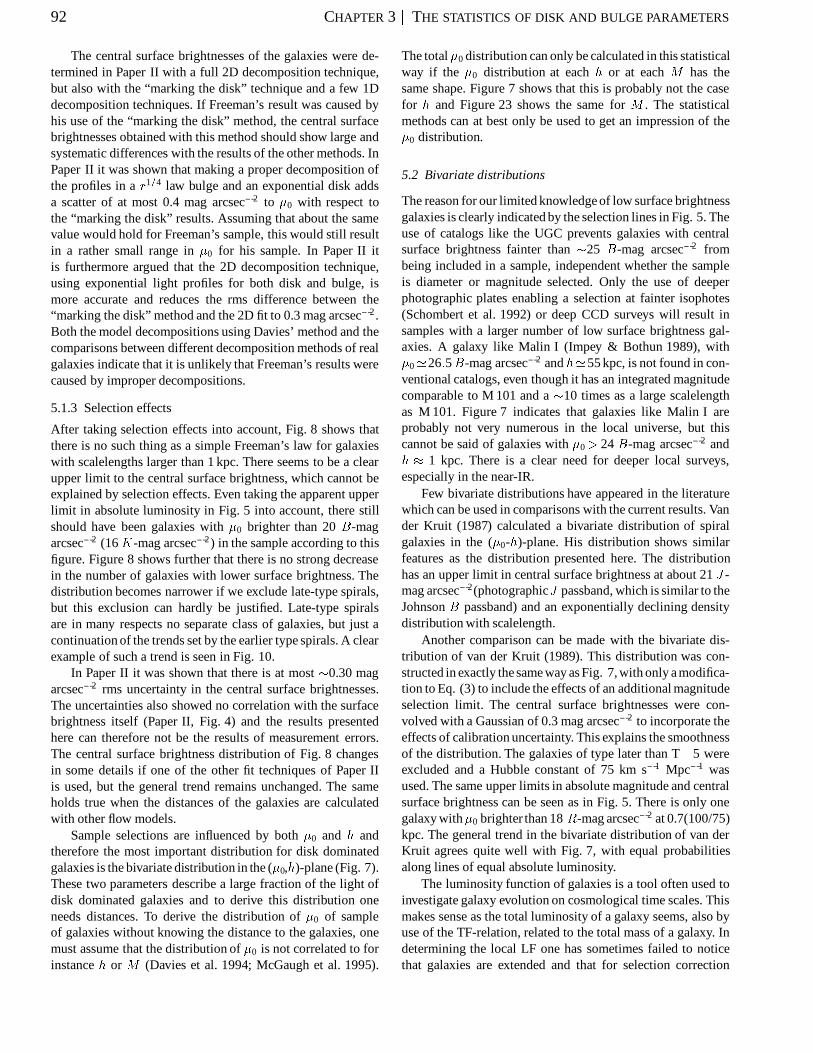
The central surface brightnesses of the galaxies were de-termined in Paper II with a full 2D decomposition technique,but also with the “marking the disk” technique and a few 1Ddecomposition techniques. If Freeman’s result was caused byhis use of the “marking the disk” method, the central surfacebrightnesses obtained with this method should show large andsystematic differences with the results of the other methods. InPaper II it was shown that making a proper decomposition ofthe profiles in a r1=4 law bulge and an exponential disk addsa scatter of at most 0.4 mag arcsec�2 to �0 with respect tothe “marking the disk” results. Assuming that about the samevalue would hold for Freeman’s sample, this would still resultin a rather small range in �0 for his sample. In Paper II itis furthermore argued that the 2D decomposition technique,using exponential light profiles for both disk and bulge, ismore accurate and reduces the rms difference between the“marking the disk” method and the 2D fit to 0.3 mag arcsec�2 .Both the model decompositions using Davies’ method and thecomparisons between different decomposition methods of realgalaxies indicate that it is unlikely that Freeman’s results werecaused by improper decompositions.
5.1.3 Selection effects
After taking selection effects into account, Fig. 8 shows thatthere is no such thing as a simple Freeman’s law for galaxieswith scalelengths larger than 1 kpc. There seems to be a clearupper limit to the central surface brightness, which cannot beexplained by selection effects. Even taking the apparent upperlimit in absolute luminosity in Fig. 5 into account, there stillshould have been galaxies with �0 brighter than 20 B-magarcsec�2 (16 K-mag arcsec�2) in the sample according to thisfigure. Figure 8 shows further that there is no strong decreasein the number of galaxies with lower surface brightness. Thedistribution becomes narrower if we exclude late-type spirals,but this exclusion can hardly be justified. Late-type spiralsare in many respects no separate class of galaxies, but just acontinuation of the trends set by the earlier type spirals. A clearexample of such a trend is seen in Fig. 10.
In Paper II it was shown that there is at most �0.30 magarcsec�2 rms uncertainty in the central surface brightnesses.The uncertainties also showed no correlation with the surfacebrightness itself (Paper II, Fig. 4) and the results presentedhere can therefore not be the results of measurement errors.The central surface brightness distribution of Fig. 8 changesin some details if one of the other fit techniques of Paper IIis used, but the general trend remains unchanged. The sameholds true when the distances of the galaxies are calculatedwith other flow models.
Sample selections are influenced by both �0 and h andtherefore the most important distribution for disk dominatedgalaxies is the bivariate distribution in the (�0,h)-plane (Fig. 7).These two parameters describe a large fraction of the light ofdisk dominated galaxies and to derive this distribution oneneeds distances. To derive the distribution of �0 of sampleof galaxies without knowing the distance to the galaxies, onemust assume that the distribution of �0 is not correlated to forinstance h or M (Davies et al. 1994; McGaugh et al. 1995).
The total�0 distribution can only be calculated in this statisticalway if the �0 distribution at each h or at each M has thesame shape. Figure 7 shows that this is probably not the casefor h and Figure 23 shows the same for M . The statisticalmethods can at best only be used to get an impression of the�0 distribution.
5.2 Bivariate distributions
The reason for our limited knowledge of low surface brightnessgalaxies is clearly indicated by the selection lines in Fig. 5. Theuse of catalogs like the UGC prevents galaxies with centralsurface brightness fainter than �25 B-mag arcsec�2 frombeing included in a sample, independent whether the sampleis diameter or magnitude selected. Only the use of deeperphotographic plates enabling a selection at fainter isophotes(Schombert et al. 1992) or deep CCD surveys will result insamples with a larger number of low surface brightness gal-axies. A galaxy like Malin I (Impey & Bothun 1989), with�0'26:5B-mag arcsec�2 and h'55 kpc, is not found in con-ventional catalogs, even though it has an integrated magnitudecomparable to M 101 and a �10 times as a large scalelengthas M 101. Figure 7 indicates that galaxies like Malin I areprobably not very numerous in the local universe, but thiscannot be said of galaxies with �0 > 24 B-mag arcsec�2 andh � 1 kpc. There is a clear need for deeper local surveys,especially in the near-IR.
Few bivariate distributions have appeared in the literaturewhich can be used in comparisons with the current results. Vander Kruit (1987) calculated a bivariate distribution of spiralgalaxies in the (�0-h)-plane. His distribution shows similarfeatures as the distribution presented here. The distributionhas an upper limit in central surface brightness at about 21 J-mag arcsec�2(photographicJ passband, which is similar to theJohnson B passband) and an exponentially declining densitydistribution with scalelength.
Another comparison can be made with the bivariate dis-tribution of van der Kruit (1989). This distribution was con-structed in exactly the same way as Fig. 7, with only a modifica-tion to Eq. (3) to include the effects of an additional magnitudeselection limit. The central surface brightnesses were con-volved with a Gaussian of 0.3 mag arcsec�2 to incorporate theeffects of calibration uncertainty. This explains the smoothnessof the distribution. The galaxies of type later than T=5 wereexcluded and a Hubble constant of 75 km s�1 Mpc�1 wasused. The same upper limits in absolute magnitude and centralsurface brightness can be seen as in Fig. 5. There is only onegalaxy with�0 brighter than 18 R-mag arcsec�2 at 0.7(100/75)kpc. The general trend in the bivariate distribution of van derKruit agrees quite well with Fig. 7, with equal probabilitiesalong lines of equal absolute luminosity.
The luminosity function of galaxies is a tool often used toinvestigate galaxy evolution on cosmological time scales. Thismakes sense as the total luminosity of a galaxy seems, also byuse of the TF-relation, related to the total mass of a galaxy. Indetermining the local LF one has sometimes failed to noticethat galaxies are extended and that for selection correction
DISCUSSION j 93
Fig. 23. The volume corrected bivariate distribution of galaxies in the (�0,M )-plane. The number density Φ(�i0,M ) is per bin size, which is insteps of 1 mag in M and 1 mag arcsec�2 in �i0.
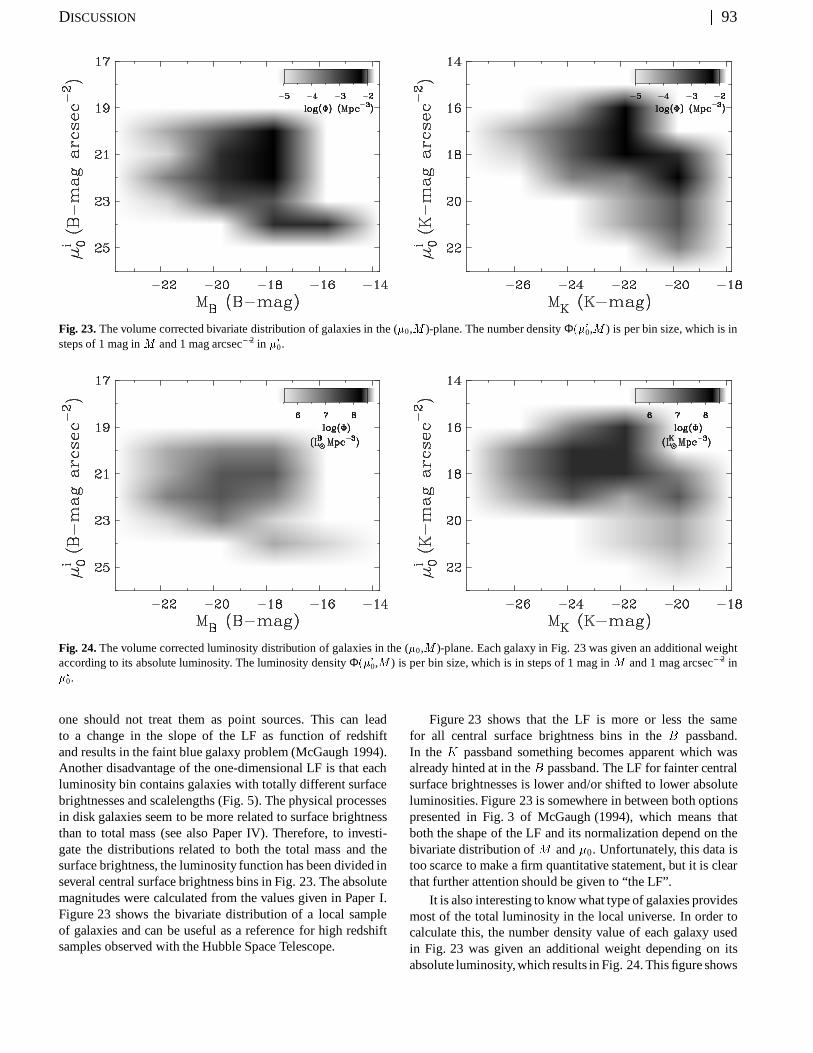
Fig. 24. The volume corrected luminosity distribution of galaxies in the (�0,M )-plane. Each galaxy in Fig. 23 was given an additional weightaccording to its absolute luminosity. The luminosity density Φ(�i0,M ) is per bin size, which is in steps of 1 mag in M and 1 mag arcsec�2 in�i0.
one should not treat them as point sources. This can leadto a change in the slope of the LF as function of redshiftand results in the faint blue galaxy problem (McGaugh 1994).Another disadvantage of the one-dimensional LF is that eachluminosity bin contains galaxies with totally different surfacebrightnesses and scalelengths (Fig. 5). The physical processesin disk galaxies seem to be more related to surface brightnessthan to total mass (see also Paper IV). Therefore, to investi-gate the distributions related to both the total mass and thesurface brightness, the luminosity function has been divided inseveral central surface brightness bins in Fig. 23. The absolutemagnitudes were calculated from the values given in Paper I.Figure 23 shows the bivariate distribution of a local sampleof galaxies and can be useful as a reference for high redshiftsamples observed with the Hubble Space Telescope.
Figure 23 shows that the LF is more or less the samefor all central surface brightness bins in the B passband.In the K passband something becomes apparent which wasalready hinted at in the B passband. The LF for fainter centralsurface brightnesses is lower and/or shifted to lower absoluteluminosities. Figure 23 is somewhere in between both optionspresented in Fig. 3 of McGaugh (1994), which means thatboth the shape of the LF and its normalization depend on thebivariate distribution of M and �0. Unfortunately, this data istoo scarce to make a firm quantitative statement, but it is clearthat further attention should be given to “the LF”.
It is also interesting to know what type of galaxies providesmost of the total luminosity in the local universe. In order tocalculate this, the number density value of each galaxy usedin Fig. 23 was given an additional weight depending on itsabsolute luminosity, which results in Fig. 24. This figure shows

94 j CHAPTER 3 j THE STATISTICS OF DISK AND BULGE PARAMETERS
the total luminosity one expects to find in a random Mpc3 fromgalaxies in the indicated bins of (�0,M ). The luminosities areexpressed in solar luminosities per passband, calibrated usingthe absolute solar luminosity values of Worthey (1994).
The distribution in the B passband is remarkably flat,almost all bins that contain galaxies are equal to within 1.5order of magnitude. In the K passband distribution there ismore structure, as most of the K passband light in the localuniverse comes from higher surface brightness galaxies. Due tothe scarceness of the data, this figure is again more of qualitativethan of quantitative interest.
5.3 Hubble classification
The Hubble sequence is one of the basic ingredients of galaxyformation and evolution schemes, even though the underlyingphysical processes are only partly understood. In this sectionI describe the consequences of some of the relations betweenthe structural parameters and Hubble type as presented here.
Figure 20 showed that B/D ratio cannot be used to deter-mine the Hubble type of face-on systems, which means thatthe classification of edge-on systems is different from that offace-on systems. Furthermore, the B/D ratios seem to be quitesmall (< 0:5), even in theK passband where the differences incolor (andM=L) due to stellar population effects between diskand bulge are minimized. The B/D ratios are larger when r1=4
law bulges are used. The difference between exponential andr1=4 law bulges in terms of generalized exponential profilesis extensively discussed in Paper II. Young & Curry (1994)showed that for ellipticals and dwarf ellipticals there is a trendin profile shape with luminosity. The brighter ellipticals haver1=4 like profiles, while fainter (dwarf) ellipticals have moreexponential like profiles. If this is also true for bulges, we mightexpect early-type spirals to have more centrally peaked bulgeprofiles than later type spirals. In Paper II it was found that r1=2
law bulges gave smaller �2 residuals for T<3 than exponentialbulges. This picture conflicts with the scale independence ofHubble type as seen in theK passband data of Fig. 18. Withinone Hubble type, a range in integrated bulge luminosities exists,which should result in different profiles when the model ofYoung & Curry (1994) is applied to bulges. There is a weakindication for this trend, because the galaxies with the brightestbulges are slightly better fitted by the r1=2 law bulges than bythe exponential bulges. The r1=4 law bulges never give thesmallest residuals, not even for the most luminous bulges.
Using an exponential bulge, an important relation is found,which is not apparent if an r1=4 law bulge is used: h correlateswith re, but these parameters do not correlate with Hubble type(Fig. 18). This is an important relation as it makes the Hubblesequence scale free. Each Hubble type comes in a range ofdifferent sizes, both in terms of diameter and total luminosityIt is an example of larger (in the sense of scale size, not mass)galaxies having more of everything, larger disk, larger bulge.Due to this correlation the scale parameters cancel each otherout in calculating B/D ratios, which means that a plot of �e–�0 (/ Σe=Σ0, important in density wave models) versus type
looks like Fig. 20 with a different scaling. Consequently�e–�0
is also a bad diagnostic for Hubble type.The relationship between Hubble type and �e (Fig. 10)
holds, independent of bulge profile function used. In fact therelation holds if one just fits a line to the central region of theprofile and uses the true central surface brightnesses, becausethe bulge generally dominates the luminosity in this centralregion. One might wonder if in classifying galaxies one hasmainly looked at the surface brightness of the bulge and not atthe B/D ratio. For the earlier systems this is harder to accept;the central regions are in general overexposed on photographicplates used for classifying. It is instructive to know that S0 gal-axies do not fit in this relation. The central surface brightnessesof S0 galaxies range from �17.7 to �19 B-mag arcsec�2 ,estimated from the data of Kormendy (1977) and Peletier etal. (1990). This translates to effective surface brightnesses inthe range of 19.5-21 B-mag arcsec�2 , in accordance with thetwo S0 galaxies in the current sample, but significantly belowthe trend of the rest of the spiral galaxies (Fig. 10).
If B/D ratio is such a bad diagnostic for Hubble type,we are left according to Sandage (1961) with only two otherclassification discriminators: 1) the spiral arm structure, 2) thepitch angle of the arms. The two remaining criteria indicate thatthe Hubble sequence should be explained in terms of spiral armappearance, even though the second criterion might also be indoubt, as measurements by Kennicutt (1981) showed that pitchangle has no tight correlation with morphological type.
The main theory on spiral structure is the spiral densitywave theory (Lin & Shu 1964; Roberts et al. 1975). The factthat Hubble type is a scale free quantity fits into this theory.When the bulge and the disk scale with the same amount, theshape of the rotation curve stays the same, only its amplitudechanges. This means that the shape of the resonances alsoscale along with the scalelength changes. If bulge and diskscalelengths are correlated, the shape of the rotation curve isfullydetermined by the relative brightness of the bulge and diskcomponent. Therefore it is harder to understand in the densitywave theory why Hubble type does not correlate tightly withB/D ratio (Fig. 20), or to be more precise �e–�0. The strengthand the pitch angle of the density wave gets modified by theratio of mass that participates in the density wave to the massthat does not. If B/D ratios are so small that they hardly couldaffect the density wave (Fig. 20) and if on top of that the B/Dratios and�e–�0 values are only weakly correlated with Hubbletype, it seems that some modifications to the standard densitywave model are needed. Maybe a connection between the �e
of the bulge and the distribution of dark matter can solve thisproblem.
5.4 Galaxy formation and evolution models
A number of new observations and relations have been pre-sented here, which can be compared with the predictions ofexisting galaxy formation and evolution models, e.g.:1) the upper limit to disk central surface brightness.2) the nearly constant Φ(�i0).3) the correlation of the bulge central surface brightness with

CONCLUSIONS j 95
Hubble type.4) the scale independence of Hubble type.
Most formation and evolution models were designed toexplain other observations. One can think of the exponen-tial radial light distribution of disk galaxies, the TF-relation,the density-morphology relation (Dressler 1980; Postman &Geller 1984) and the fact that disk scaleheight is constant asfunction of radius (Shaw & Gilmore 1990). Also the relativefractions of different Hubble types needs to be explained.
The models in the literature are in general scale free.This means that physical limits in surface brightness or totalluminosity as presented here are often not discussed. As aconsequence the following discussion will be qualitative, notquantitative. The Freeman value of 21.65 B-mag arcsec�2 isoften assumed for the central surface brightness in these evolu-tion models, but as shown here this is an invalid simplification.
The chronology of bulge and disk formation is still a majorissue. The disk galaxy evolution models can to first order bedivided into three categories: those that form the disk first,those that form the bulge first, and hierarchical clusteringmodels in which both are formed together by accreting smallerclumps of proto-galaxies. These models can partly be mixed atthe different stages of galaxy evolution. Figure 18 shows thatbulge and disk scalelengths are correlated. In models wherethe bulge forms first and then the disk, it is hard to understandhow a small dynamically hot bulge can influence the diskscalelength. In models where the bulge forms from the disk, anatural correlation between their scalelengths is expected. Thesituation is reversed for S0 galaxies, because in these galaxiesthe bulge is much larger than the disk.
In recent years theories on galaxy formation start makinguse of the developments in the study of large-scale structurewithin the framework of the standard cosmological models,such as Cold Dark Matter (CDM) models (Blumenthal etal. 1984). In the standard cosmological models a galaxy prin-cipally forms when its matter dynamically decouples from themain Hubble flow. The observations presented here concern thestellar component of galaxies and the main obstacle to translatethe predictions of the CDM models into these observationsare the poorly known star formation mechanisms. There aresome qualitative scenarios relating initial conditions to mor-phological type (e.g. Lake & Carlberg 1988; Zaritsky 1993)and therefore to the stellar component. In these scenarios thelarge potential well, which will form the final galaxy, con-tains smaller density fluctuations. In some of these subclumpsenhanced star formation may occur, triggered by neighboringclumps or galaxies. The clumps with enhanced star formationviolently relax in the main potential well to become the bulgeand the halo, while the other clumps dissipate and form the disk.Such scenarios can hardly be compared with the quantitativedescriptions of the bivariate distribution (most notably theupper limit in �0) and the correlation between bulge and diskscalelength presented here as long as there are no quantitativedescriptions of the star formation processes involved.
The secular evolution models in which the bulge is formedfrom the disk have more predictive power. In these models thedisk is formed first by a dissipational collapse of the initial gas
cloud after getting its angular momentum from tidal torquesfrom neighboring galaxies. In the following some secular evo-lution models are described. All of them could play a roleafter an initial collapse as described by the CDM models hasoccurred.
One of the models that has successfully explained thenature of exponential disks is the viscous evolution model(Lin & Pringle 1987; Yoshii & Sommer-Larsen 1989). In thismodel the angular momentum in the disk is redistributed bythe viscosity of the gas, while star formation occurs on thesame time scale. Saio & Yoshii (1990) showed that such amodel automatically develops, next to the exponential disk,a bulge with properties only depending on the time scaleof star formation relative to the time scale of viscosity andon the total angular momentum. This model could producegalaxies with correlated bulge and disk scalelengths. There isno obvious reason why there should be an upper limit to thesurface brightness in these models.
The secular evolution model (Kormendy 1993 and refer-ences therein), in which small bulges form from the bar insta-bility, can explain a number of the observations described here.In this model disk gas is transported to the center by a bar or ovaldistortion.The disk stars in the central region are heated in ver-tical direction by resonant scattering off of the bar instability tobecome a “bulge-like” component (Combes & Sanders 1981;Pfenniger & Friedli 1991). This model will naturally developa exponential bulge, where only a limited range in bulge-to-disk scalelengths is possible. Furthermore, the bar forms whenthe disk surface density is too high for its velocity dispersion(see e.g. Binney & Tremaine 1987), which might explain theupper limit observed for surface brightnesses. The density-morphology relation is in this model partly explained by thehigher chance of dynamical interaction in denser environments,which triggers the bar formation (Elmegreen et al. 1990).
A model to explain the Hubble sequence is the model ofbulge formation by a central starburst, by Sofue & Habe (1992).This model has links with the previous two models. Instead of abar, galactic winds driven by starbursts are used to produce thedynamical hotter bulge component from the disk component.Tidal interactions are known to produce starbursts, thereforemore interactions give rise to larger bulges, thus explaining thedensity-morphologyrelation. This model might explain the up-per limit in central surface brightness observed for the samplegalaxies. When a critical gas density is reached, a burst of starformation will occur and all remaining gas will be expelledor put in orbits with a much higher vertical component. The“chimneys” of ionized gas observed in some edge-on galaxies(Rand et al. 1990) indicate that large amounts of gas can bedriven out off the disk plane.
6 Conclusions
The statistics of the fundamental parameters of 86 spiral gal-axies have been studied in the optical and the near-IR. Theuse of the near-IR K passband enabled for the first timedetermination of these parameters without being hamperedby the effects of dust and differences in stellar populations.

96 j CHAPTER 3 j THE STATISTICS OF DISK AND BULGE PARAMETERS
Volume density distributions with respect to the fundamentalparameters were made, which was possible due to the carefulselection of the sample. The main conclusions are as follows:
– Freeman’s law of a preferred disk central surface brightnessvalue needs a modification. Although there seems to bea clear upper limit to the central surface brightnesses ofgalaxies, there is no clear limit at the faint end of the �0
distribution. The number of galaxies in a volume with acertain �0 is only slowly declining function of �0.
– The bulge and disk scalelengths are correlated, parameter-ized by log(rKe ) = 0:95 log(hK)�0:86. This correlationsuggests that the formation of the bulge and the disk iscoupled.
– The Hubble classification is related to the surface bright-ness properties of spiral galaxies. However, the relationsare in general not very tight and can therefore not be turnedaround to give morphological classification. The B/D ratiois not a good indication of Hubble type (Fig. 20 and 21).The best relation with Hubble type found in this study isthe one with �e (Fig. 10). The physical interpretation isdifficult, because cause and effect are hard to separate.
– Hubble type is a scale size independent parameter, butnot a total luminosity independent parameter of a galaxy.Therefore, it would be better to divide by scale size insteadof luminosity to derive scale independent parameters ofgalaxies in comparisons. The suggestion that Hubble typeis mainly driven by total mass (Zaritsky 1993) seems anoversimplification. To carry this point a bit further, it isprobably better to separate the determination of the LF ofgalaxies into bins which are related to the effective surfacebrightness (like Fig. 23) than into bins which are related toHubble type.
Larger samples are needed to enable the parameterizationof the bivariate distributions. There is especially need foraccurate surface photometry of a large sample of galaxies,selected from deep photographic plates providing isophotaldiameters at very faint levels.
Acknowledgements. I thank Renee Kraan-Korteweg for providing herVirgocentric inflow computer model. Piet van der Kruit and ReynierPeletier are thanked for the many fruitful discussions. Erwin deBlok, Rene Oudmaijer, David Sprayberry and Arpad Szomoru areacknowledged for their many useful suggestions on the manuscript.This research was supported under grant no. 782-373-044 from theNetherlands Foundation for Research in Astronomy (ASTRON),which receives its funds from the Netherlands Foundation for Sci-entific Research (NWO).
References
Andredakis Y.C., Sanders R.H. 1994, MNRAS 267, 283Allen R.J., Shu F.H 1979, ApJ 227, 67Binney J., Tremaine S. 1987, Galactic Dynamics (Princeton Univer-
sity Press, Princeton)Block D.L., Wainscoat R.J. 1991, Nature 353, 48Blumenthal G.R., Faber S.M., Primack J.R., Rees M.J. 1984, Nature
311, 517
Boroson T.A. 1981, ApJS 46, 177Burstein D., Heiles C. 1984, ApJS 54, 33Byun Y.I., Freeman K.C., Kylafis N.D. 1994, ApJ 432, 114Choloniewski J. 1985, MNRAS 214, 197Combes F., Sanders R.H. 1981, A&A 96, 164Davies J.I. 1990, MNRAS 244, 8Davies J., Phillipps S., Disney M., Boyce P., EvansRh. 1994,MNRAS
268, 984de Jong R.S. 1995a, to be submitted to A&A (Chapter 2)de Jong R.S. 1995b, to be submitted to A&A (Chapter 4)de Jong R.S., van der Kruit P.C. 1994, A&AS 106, 451 (Chapter 1)de Vaucouleurs G. 1948, Ann. d’Astrophys. 11, 247de VaucouleursG. 1974, in The Formation and Dynamics of Galaxies,
IAU Symp. 58, ed. J.R. Shakeshaft (Reidel, Dordrecht), p. 1de Vaucouleurs G., de Vaucouleurs A., Corwin H.G., Buta R.J. et
al. 1991, Third Reference Catalog of Bright Galaxies (Springer-Verlag, New York) (RC3)
Disney M.J. 1976, Nature 263, 573Disney M.J., Phillipps S. 1983, MNRAS 205, 1253Dressler A. 1980, ApJ 236, 351Efstathiou G., Ellis R.S., Peterson B.A. 1988, MNRAS 232, 431Elmegreen D.M., Bellin A.D., Elmegreen B.G. 1990, ApJ 364, 415Felten, J.E., 1976, ApJ 207, 700Freeman K.C. 1966, MNRAS 133, 47Freeman K.C. 1970, ApJ 160, 811Freeman K.C. 1978, in Structure and Properties of Nearby Galaxies,
IAU Symp. 77, eds: E. Berkhuysen and R. Wielebinski (Reidel,Dordrecht), p. 3
Giovanelli R., Haynes M.P., Salzer J.J., Wegner G., Da Costa L.N.,Freudling W. 1994, AJ 107, 2036
Grosbøl P.J. 1985, A&AS 60, 261Impey C; Bothun G. 1989, ApJ 341, 89Jura M. 1980, ApJ 238, 499Kennicutt Jr. R.C. 1981, AJ 86, 1847Kormendy J. 1977, ApJ 217, 406Kormendy J. 1993, in Galactic Bulges, IAU Symp. 153, eds: H.
Dejonghe and H.J. Habing (Kluwer, Dordrecht), p. 209Kraan-Korteweg R.C. 1986, A&AS 66, 255Lahav O., Naim A., Buta R.J, Corwin H.G., de Vaucouleurs G. et al.
1995, Science, in pressLake G., Carlberg R.G. 1988, AJ 96, 1587Lin C.C., Shu F.H. 1964, ApJ 140, 646Lin D.N.C., Pringle J.E. 1987, ApJ 320, L87McGaugh, S.S. 1994, Nat 367, 538McGaugh, S.S., Bothun D.B., Schombert J.M. 1995, in preparationNilson P. 1973, Uppsala General Catalog of Galaxies (Roy. Soc. Sci.,
Uppsala) (UGC)Peletier R.F., Davies R.L., Davis L.E., Illingworth G.D., Cawson M.
1990, AJ 100, 1091Peletier R.F., Valentijn E.A., Moorwood A.F.M., Freudling W. 1994,
A&AS 108, 621Pfenniger D., Friedli D. 1991, A&A 252, 75Phillipps S., Disney M.J. 1983, MNRAS 203, 55Phillipps S., Disney M.J. 1986, MNRAS 221, 1039Phillipps S., Evans Rh., Davies J.I., Disney M.J. 1991, MNRAS 253,
496Postman M., Geller M.J. 1984, ApJ 281, 95Rand R.J., Kulkarni S.R., Hester J.J. 1990, ApJ 352, L1Rieke G.H., Lebofsky M.J. 1985, ApJ 288, 618Roberts Jr. W.W., Roberts M.S., Shu F.H. 1975, ApJ 196, 381Saio H., Yoshii Y. 1990, ApJ 363, 40

REFERENCES j 97
Sandage A. 1961, The Hubble Atlas of Galaxies (Carnegie Inst. ofWashington, Washington DC)
Saunders W., Rowan-Robinson M., Lawrence A., Efstathiou G.,Kaiser N., Ellis R.S., Frenk C.S. 1990, MNRAS 242, 318
Schombert J.M., Bothun G.D., Schneider S.E., McGaugh S.S. 1992,AJ 103, 1107
Shaw M.A., Gilmore G. 1990, MNRAS 242, 59Simien F., de Vaucouleurs G. 1986, ApJ 302, 564Sodre L.Jr., Lahav O. 1993, MNRAS 260, 285Sofue Y., Habe A. 1992, PASJ 44, 325Tully R.B., Fisher J.R. 1977, A&A 54, 661
Valentijn E.A. 1990, Nat 346, 153van der Kruit P.C. 1987, A&A 173, 59van der Kruit P.C. 1989, The distribution of properties of galaxies.
In: Gilmore, G., King, I., van der Kruit, P.C., The Milky Way asa Galaxy (Geneva Observatory, Sauverny-Versoix, Switzerland),p.263
Worthey, G. 1994, ApJS 95, 107Yoshii Y., Sommer-Larsen J. 1989, MNRAS 236, 779Young C.K., Currie M.J. 1994, MNRAS 268, L11Zaritsky D. 1993, PASP 105, 1006