Chapter 3 Social, economic and policy environment
58
63 Improving the livelihoods of the people in the Limpopo River Basin in a sustainable manner is one of the objectives of the integrated approach to catchment basin management. Understanding the human dimension is critical to designing projects and programmes that will secure livelihoods based on stable, productive and profitable use of natural resources, particularly land use. This chapter describes the social, economic, policy and institutional dimensions that affect the capacity of the people living in the Limpopo River Basin to live with recurrent drought and climate variability. SOCIAL AND ECONOMIC CHARACTERISTICS Population characteristics Chapter 2 described the biophysical diversity and challenges facing integrated management in the Limpopo River Basin. These challenges are reflected in the diversity of rural versus urban populations of the basin. In Botswana and South Africa, the capital cities are situated in, and some of the largest urban populations reside within, the basin boundaries, such as Gaborone, Francistown, Pretoria, Polokwane, Thohoyandu and Witbank. Not reflected in the basin population figures (Table 15) are other large urban centres (Johannesburg, Maputo and Bulawayo) that lie on the fringes of the basin and influence, or are influenced by, events and activities within the basin. Aside from these urban centres, which for the most part are located at the headwaters (or near the mouth in the case of Maputo), the Limpopo River Basin is predominantly rural. On average, at the national level, the population in the Limpopo River Basin countries is just more than 50 percent rural – ranging from 31 percent in Botswana to 66 percent in Zimbabwe. However, at the subnational and district level within the basin, the population is predominantly rural – more than 60 percent. About 8 million people live in rural areas within the Limpopo River Basin (Table 16). Botswana According to the 1991 census, nearly 46 percent of Botswana’s population was urban-based, an increase of 18 percent over the 1981 estimates (GOB, 1992b). While much of this growth is a consequence of the continued expansion of the larger urban areas such as Gaborone and Francistown, most of the increase is attributed to a reclassification of some larger villages from rural to urban. Eighty-three percent of Botswana’s people live in the eastern hardveldt region with its characteristics of better surface water and groundwater availability, good communications, proximity to South Africa, access to markets, and better-quality soils compared with the rest of the country. The Limpopo River Basin covers most of the hardveldt and falls within the rural administrative districts of North East, Central, Kgatleng and Kweneng. This catchment area accounts for 59 percent of the country’s population and 28 percent of its area. The average national population density is only 2.3 persons/km 2 , although the highest population density is in the districts of Kweneng (21 persons/ km 2 ) and Kgatleng (15 persons/km 2 ) because of Chapter 3 Social, economic and policy environment TABLE 15 Selected statistics of the four basin countries Country Total area Area of country within basin As % of total basin area As % of total country area Population of country in 1998 Population in basin As % of country population Population density in basin (km 2 ) (km 2 ) (%) (%) (million) (million) (%) (persons/km 2 ) Botswana 581 730 80 118 19 14 1.6 1.0 59 12.5 Mozambique 801 590 84 981 21 11 16.5 1.3 7 15.3 South Africa 1 221 040 185 298 45 15 42.1 10.7 24 57.7 Zimbabwe 390 760 62 541 15 16 11.4 1.0 9 16.0 Total 412 938 71.6 14.0 33.9
Transcript of Chapter 3 Social, economic and policy environment

63
Improving the livelihoods of the people in the Limpopo River Basin in a sustainable manner is one of the objectives of the integrated approach to catchment basin management. Understanding the human dimension is critical to designing projects and programmes that will secure livelihoods based on stable, productive and profitable use of natural resources, particularly land use. This chapter describes the social, economic, policy and institutional dimensions that affect the capacity of the people living in the Limpopo River Basin to live with recurrent drought and climate variability.
SOCIAL AND ECONOMIC CHARACTERISTICSPopulation characteristicsChapter 2 described the biophysical diversity and challenges facing integrated management in the Limpopo River Basin. These challenges are reflected in the diversity of rural versus urban populations of the basin. In Botswana and South Africa, the capital cities are situated in, and some of the largest urban populations reside within, the basin boundaries, such as Gaborone, Francistown, Pretoria, Polokwane, Thohoyandu and Witbank. Not reflected in the basin population figures (Table 15) are other large urban centres (Johannesburg, Maputo and Bulawayo) that lie on the fringes of the basin and influence, or are influenced by, events and activities within the basin.
Aside from these urban centres, which for the most part are located at the headwaters (or near the mouth in the case of Maputo), the Limpopo River Basin is predominantly rural. On average, at
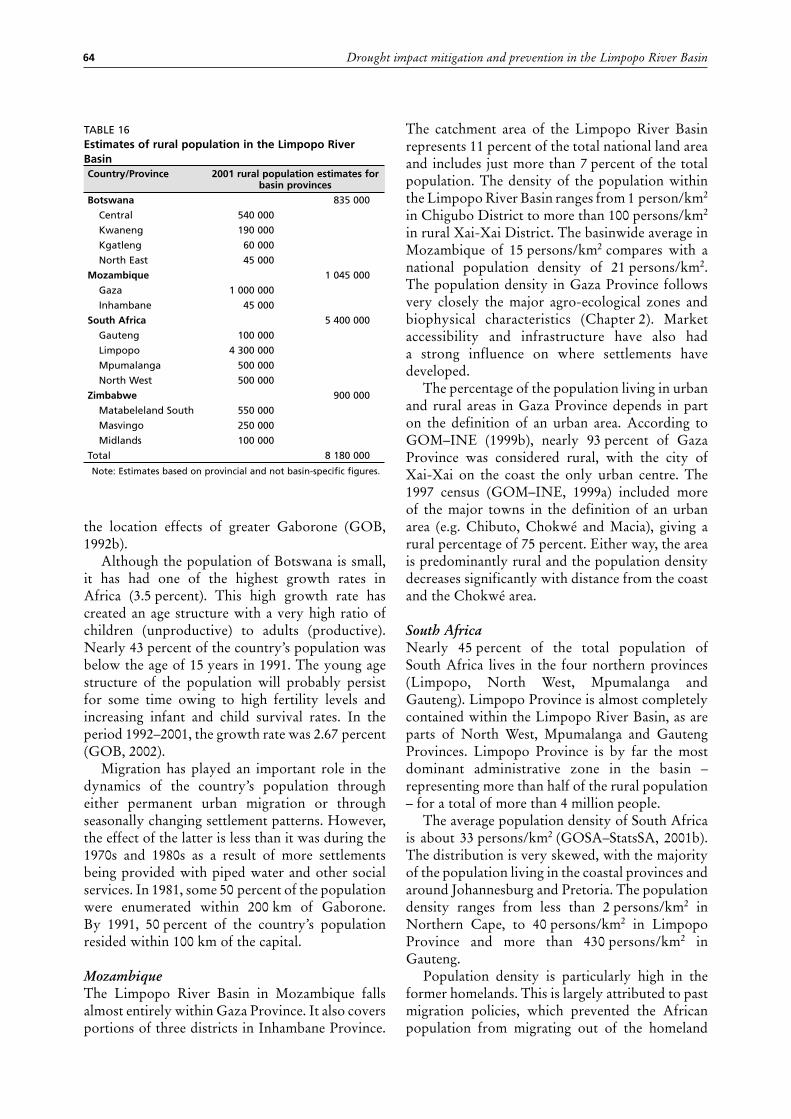
the national level, the population in the Limpopo River Basin countries is just more than 50 percent rural – ranging from 31 percent in Botswana to 66 percent in Zimbabwe. However, at the subnational and district level within the basin, the population is predominantly rural – more than 60 percent. About 8 million people live in rural areas within the Limpopo River Basin (Table 16).
BotswanaAccording to the 1991 census, nearly 46 percent of Botswana’s population was urban-based, an increase of 18 percent over the 1981 estimates (GOB, 1992b). While much of this growth is a consequence of the continued expansion of the larger urban areas such as Gaborone and Francistown, most of the increase is attributed to a reclassification of some larger villages from rural to urban.
Eighty-three percent of Botswana’s people live in the eastern hardveldt region with its characteristics of better surface water and groundwater availability, good communications, proximity to South Africa, access to markets, and better-quality soils compared with the rest of the country. The Limpopo River Basin covers most of the hardveldt and falls within the rural administrative districts of North East, Central, Kgatleng and Kweneng. This catchment area accounts for 59 percent of the country’s population and 28 percent of its area. The average national population density is only 2.3 persons/km2, although the highest population density is in the districts of Kweneng (21 persons/km2) and Kgatleng (15 persons/km2) because of
Chapter 3
Social, economic and policy environment
TABLE 15Selected statistics of the four basin countriesCountry Total area Area of
country within basin
As % of total basin
area
As % of total country
area
Population of country in
1998
Population in basin
As % of country
population
Population density in
basin
(km2) (km2) (%) (%) (million) (million) (%) (persons/km2)
Botswana 581 730 80 118 19 14 1.6 1.0 59 12.5
Mozambique 801 590 84 981 21 11 16.5 1.3 7 15.3
South Africa 1 221 040 185 298 45 15 42.1 10.7 24 57.7
Zimbabwe 390 760 62 541 15 16 11.4 1.0 9 16.0
Total 412 938 71.6 14.0 33.9
Drought impact mitigation and prevention in the Limpopo River Basin64
the location effects of greater Gaborone (GOB, 1992b).
Although the population of Botswana is small, it has had one of the highest growth rates in Africa (3.5 percent). This high growth rate has created an age structure with a very high ratio of children (unproductive) to adults (productive). Nearly 43 percent of the country’s population was below the age of 15 years in 1991. The young age structure of the population will probably persist for some time owing to high fertility levels and increasing infant and child survival rates. In the period 1992–2001, the growth rate was 2.67 percent (GOB, 2002).
Migration has played an important role in the dynamics of the country’s population through either permanent urban migration or through seasonally changing settlement patterns. However, the effect of the latter is less than it was during the 1970s and 1980s as a result of more settlements being provided with piped water and other social services. In 1981, some 50 percent of the population were enumerated within 200 km of Gaborone. By 1991, 50 percent of the country’s population resided within 100 km of the capital.
MozambiqueThe Limpopo River Basin in Mozambique falls almost entirely within Gaza Province. It also covers portions of three districts in Inhambane Province.
The catchment area of the Limpopo River Basin represents 11 percent of the total national land area and includes just more than 7 percent of the total population. The density of the population within the Limpopo River Basin ranges from 1 person/km2 in Chigubo District to more than 100 persons/km2
in rural Xai-Xai District. The basinwide average in Mozambique of 15 persons/km2 compares with a national population density of 21 persons/km2. The population density in Gaza Province follows very closely the major agro-ecological zones and biophysical characteristics (Chapter 2). Market accessibility and infrastructure have also had a strong influence on where settlements have developed.
The percentage of the population living in urban and rural areas in Gaza Province depends in part on the definition of an urban area. According to GOM–INE (1999b), nearly 93 percent of Gaza Province was considered rural, with the city of Xai-Xai on the coast the only urban centre. The 1997 census (GOM–INE, 1999a) included more of the major towns in the definition of an urban area (e.g. Chibuto, Chokwé and Macia), giving a rural percentage of 75 percent. Either way, the area is predominantly rural and the population density decreases significantly with distance from the coast and the Chokwé area.
South AfricaNearly 45 percent of the total population of South Africa lives in the four northern provinces (Limpopo, North West, Mpumalanga and Gauteng). Limpopo Province is almost completely contained within the Limpopo River Basin, as are parts of North West, Mpumalanga and Gauteng Provinces. Limpopo Province is by far the most dominant administrative zone in the basin – representing more than half of the rural population – for a total of more than 4 million people.
The average population density of South Africa is about 33 persons/km2 (GOSA–StatsSA, 2001b). The distribution is very skewed, with the majority of the population living in the coastal provinces and around Johannesburg and Pretoria. The population density ranges from less than 2 persons/km2 in Northern Cape, to 40 persons/km2 in Limpopo Province and more than 430 persons/km2 in Gauteng.
Population density is particularly high in the former homelands. This is largely attributed to past migration policies, which prevented the African population from migrating out of the homeland
TABLE 16Estimates of rural population in the Limpopo River Basin
Note: Estimates based on provincial and not basin-specific figures.
Country/Province 2001 rural population estimates for basin provinces
Botswana 835 000
Central 540 000
Kwaneng 190 000
Kgatleng 60 000
North East 45 000
Mozambique 1 045 000
Gaza 1 000 000
Inhambane 45 000
South Africa 5 400 000
Gauteng 100 000
Limpopo 4 300 000
Mpumalanga 500 000
North West 500 000
Zimbabwe 900 000
Matabeleland South 550 000
Masvingo 250 000
Midlands 100 000
Total 8 180 000

Chapter 3 – Social, economic and policy environment 65
areas. Migration has also played a significant role in redistributing South Africa’s population, especially since the formation of the new republic in 1994. Interprovincial migration data for 1992–96 indicate that Limpopo Province and Gauteng Province lost a large number of people through outmigration. However, Gauteng Province was also the most popular migration destination in the country (GOSA–NPU, 2000).
ZimbabweAccording to the population census of 1992, about 8 percent of Zimbabwe’s population resided in the Limpopo River Basin, then estimated at 850 000 people, and currently estimated at just more than 1 million. The Limpopo catchment area in Zimbabwe falls predominantly in Matabeleland South Province, as well as portions of two districts in Masvingo Province (Mwenezi and Chiredzi) and one district in Midlands Province (Mberengwa).
The average population density in the semi-arid regions of the Limpopo River Basin is generally low, ranging from 6 persons/km2 in Beitbridge District to 23 persons/km2 in Umzingwane, adjacent to Bulawayo, compared with 30 persons/km2 at the national level. However, the primarily rural district of Mberengwa has a population density of 37 persons/km2, comparable with the more densely populated rural areas around Harare.
HIV/AIDSSub-Saharan Africa (SSA) is home to about 70 percent of the 36 million people currently living with HIV/AIDS worldwide. In this region, an estimated 3.8 million adults and children became infected with HIV in 2000, bringing the total number of people living there with HIV/AIDS to 25.3 million. In the same period, millions of Africans infected in earlier years began experiencing
ill health, and 2.4 million people at a more advanced stage of infection died of HIV-related illness.
Although SSA heads the list as the region with the largest annual number of new infections, there may be a new trend on the horizon: regional HIV incidence appears to be stabilizing. Because the long-standing African epidemics have already reached large numbers of people whose behaviour exposes them to HIV, and because effective prevention measures in some countries have enabled people to reduce their risk of exposure, the annual number of new infections has stabilized or even fallen in many countries. These decreases have now begun to balance out rising infection rates in other parts of Africa, particularly the southern part of the continent.
Among the countries of the world hardest hit by HIV/AIDS are South Africa and Botswana (Table 17). In Botswana, almost 36 percent of all adults are infected with HIV/AIDS. Life expectancy has dropped from 61 years seven years ago to 39 years today, and the figure is projected to fall below 29 years by 2010. Without HIV/AIDS, it would have been more than 66 years. The epidemic began in South Africa much later than it did in other countries in Africa. By the mid-1990s, infection rates among pregnant woman were increasing rapidly. South Africa is now facing one of the most serious epidemics in the world (U.S. Census Bureau, 2001).
The provinces that are within or largely within the basin may not always be representative of the basin country at large. In Botswana, the highly populated areas of the basin districts (parts or all of the Kweneng, Southern, South-East, Kgatleng and Central Districts) are relatively highly affected. In Mozambique, Gaza Province (covering the basin area) appears not to be among the most highly affected. In South Africa, Limpopo Province is
TABLE 17HIV prevalence in countries in the Limpopo River Basin
1 2001 figures (American Friends Service Committee, 2003).2 CIA World Factbook gives a figure of 33.7 percent (CIA, 2003); 24 percent quoted by SADC–FANR (2003)Main source: U.S. Census Bureau (2001)
Botswana Mozambique1 South Africa Zimbabwe
Population 1 597 000 19 105 000 39 900 000 11 343 000
Population aged 15–49 years 786 000 No data 20 982 000 No data
Percent of total population with HIV 18 11
HIV infected people 290 000 4 200 000
Adult prevalence rate of HIV (%) 36 13 20 25.12
Adult female HIV population: % of total 51 No data 55 No data
Pregnant women HIV + prevalence (%) 43 19
AIDS orphans (living) 55 000 338 000

Drought impact mitigation and prevention in the Limpopo River Basin66
less affected than the provinces of Mpumalanga, Gauteng and North West (parts of which are within the basin). Urban and mining centres (with the exception of the Western Cape) appear to be most affected. In Zimbabwe, Matabeleland South is slightly less affected than Manicaland and Masvingo Provinces in the east (U.S. Census Bureau, 2001).
The effects of HIV/AIDS are far reaching. It has a severe effect on affected households, children and their schooling, the level of services rendered, and on business and economic growth. HIV/AIDS creates new pockets of poverty where parents and breadwinners die and children leave school earlier in order to support the remaining children. Affected households bear the brunt of the misery caused by the epidemic. Rising sickness and death often take place against a background of deteriorating public services, poor employment prospects and endemic poverty that are not directly related to the HIV epidemic, but that may be exacerbated by it (UNAIDS–WHO, 2000).
HIV is reducing the numbers of children in school. HIV-positive women have fewer babies, in part because they may die before the end of their childbearing years, and up to one-third of their children are themselves infected and may not survive to school age. Many children who have lost their parents to AIDS, or are living in households which have taken in AIDS orphans, may be forced to drop out of school in order to start earning money, or simply because school fees have become unaffordable. Teacher shortages may be looming (UNAIDS–WHO, 2000).
Some recent survey results show just how great the future impact of HIV is likely to be on business. A 1999 study among miners in southern Africa found that more than one-third of employees in their late 20s and 30s were infected with HIV, as were one-quarter of young and older employees. Rates among workers in other sectors are similarly high, at least in South Africa. For example, in a sugar mill, 26 percent of all workers were living with HIV. There, as in the mining industry, HIV rates were higher among unskilled workers than among managerial-level workers (UNAIDS–WHO, 2000).
It remains exceptionally difficult to gauge the macroeconomic impact of the epidemic. Despite incomplete data, there is growing evidence that as HIV prevalence rates rise, both total and growth in national income (GDP) fall significantly. In South Africa, where per capita income is six times the
average for SSA and the national economy accounts for 40 percent of the total economic output of the region, the overall economic growth rate in the next decade is likely to be 0.3 to 0.4 percentage points lower every year than it would have been without AIDS. Cumulating the slower economic growth over time, by 2010, real GDP may well be 17 percent lower than it would have been in the absence of AIDS. In terms of current value, that would wipe US$22 000 million off South Africa’s economy – more than twice the entire national production of any other country in the region except Nigeria (UNAIDS–WHO, 2000).
AIDS is likely to cause skills shortages in most sectors of the economy, creating major bottlenecks in business and production. This will be exacerbated by its undermining effect on education, and on the potential to expand skills as quickly as they are needed. HIV infection rates are highest among individuals in the workforce without special skills; so are the unemployment rates (about 30 percent in South Africa). Thus, in theory, individuals who are not currently employed may replace unskilled workers dying of AIDS. The skills shortage can be expected to be even more acute in neighbouring Botswana, which is already importing white-collar workers (UNAIDS–WHO, 2000).
There are indications that AIDS is starting to have negative affects on resource-poor agriculture. For example, with respect to Zimbabwe, the United Nations (UN) Relief and Recovery Unit noted “productivity has been severely affected in the agriculture sector as a direct result of the HIV/AIDS pandemic in the country” (UN–IRIN, 2003).
Human development and povertyThe rural population of about 8 million people living in the Limpopo River Basin face special challenges to make a living. The biophysical description in Chapter 2 showed that this area is predominantly semi-arid, with little arable land and very low potential for agriculture. Two related concepts that are useful for measuring “how people are doing” are human development and poverty. Human development can be thought of as the process of enlarging people’s choices so that they can live longer and healthier lives (SADC–UNDP, 1998). This is usually measured in terms of educational and health opportunities, as well as some measure of wealth or standard of living (Box 14). Poverty is usually defined as living below a certain income or income-poverty threshold, but it has many dimensions (IFAD, 2001).

Chapter 3 – Social, economic and policy environment 67
Table 18 gives selected national-level HDI values (see Box 14) for the countries in the Limpopo River Basin. At the national level, as of 1998, three of the four countries were in the medium (values between 0.500 and 0.790) human development range: South Africa, Botswana, and Zimbabwe (SADC–UNDP, 1998). Mozambique has the lowest HDI value in the region (0.374), although in percentage terms, the situation has been improving steadily (GOM–UNDP, 1999). The impact of the HIV/AIDS pandemic on life expectancy is an important factor in slowing the growth, or reducing the HDI, especially for Botswana, South Africa and Zimbabwe.
As income is an important component of the HDI, an unequal distribution of income may skew the results, especially at the national level. Income inequality can be estimated by the Gini coefficient, which is defined as the maximum vertical deviation
between the perfect diagonal and the Lorenz curve, which is a graphical representation of the proportionality of a distribution. The higher the Gini coefficient, the greater the inequality. Southern Africa has some of the highest Gini coefficients in the world and, therefore, it is appropriate to apply an adjustment for income inequality to the HDI values. The national-level HDI values for Botswana, South Africa and Zimbabwe drop dramatically, by more than 20 percent, when adjusted for income inequality. Thus, Botswana and Zimbabwe drop to an HDI of about 0.50 and South Africa moves to 0.60, which is perhaps more representative of the majority of the people living in the rural areas of these countries.
Although it is difficult to make comparisons across the four countries at the subnational level, there is also great disparity in HDI values between geographical regions and urban and rural areas.
BOX 14
Human development and poverty indices
The Human Development Index (HDI) was introduced in 1990 as an attempt to measure and rank countries according to progress in human development beyond a simple gross national product figure. Instead of using only a financial measure, the HDI is a composite of three basic components of human development:ÿ longevity – as measured by life expectancy;ÿ knowledge – as measured by a combination
of adult literacy (two-thirds weight) and mean years of schooling (one-third weight);ÿ standard of living – as measured by purchasing
power, based on real GDP per capita adjusted for the local cost of living (purchasing power parity).
The index ranges from 0 to 1. Although useful at the global scale, indices at the national level can conceal much that is happening within the country. The best solution would be to create separate HDIs for the most significant groups, e.g. by gender or by income group. Separate HDIs would reveal a more detailed profile of human deprivation in each country and disaggregated HDIs have been conducted in some SADC countries.
Similarly, human poverty is usually defined as living below a certain income level or income poverty line. From a human development perspective, poverty
means the denial of choices and opportunities most basic to human development, including deprivation in health and survival, lack of knowledge, denial of opportunities for a creative and productive life, social exclusion, lack of freedom, as well as deprivation in income. Therefore, the Human Poverty Index (HPI) was proposed in 1997 as a new way of measuring poverty in developing countries. The index measures the proportion of the population affected by three key deprivations affecting their lives:ÿ deprivation in survival – measured by the
percentage of people expected to die before age 40;ÿ deprivation in knowledge – measured by the
percentage of illiterate adults;ÿ deprivation in “economic provisioning” –
measured by the percentage of people without access to health services and safe water, as well as the percentage of underweight children under five.
The index ranges from 0 (low) to 100 (high). No class limits are given for low, moderate and high.
The HDI and HPI can be useful alternatives to gross national product for measuring the relative socio-economic progress of nations. They enable people and their governments to evaluate progress over time – and to determine priorities for policy interventions. They also enable instructive comparisons of the experiences in different countries.
Source: SADC–UNDP (1998); UNDP (2003).

Drought impact mitigation and prevention in the Limpopo River Basin68
However, the HDI is generally lower (higher HPI) in more remote rural areas, where education, health and employment opportunities are more limited.
BotswanaBotswana has completed two national-level human development reports in recent years. A 1997 report recommended nine issues to be considered for future human development studies, the first being conducted in 2000 on the theme Towards an AIDS-free generation (GOB–UNDP, 2000). This report provides a detailed assessment of the impact of the HIV/AIDS epidemic on Botswana’s society. With the highest reported HIV prevalence rate in the world, Botswana has recognized the importance of integrating a HIV/AIDS strategy with national development and poverty reduction.
The Botswana HPI was calculated using the percentage of children that die before the age of 5 years as a measure of a long and healthy life, not the percentage of people who will not survive 40 years of age. The HPI reveals that more than 25 percent of the population live in human poverty. The HPI values for rural areas are nearly double those in the urban areas – 39.0 compared with 16.8. These disparities are closely linked to available services such as schooling, water supply and health care (GOB–UNDP, 2000).
MozambiqueMozambique has also produced several national-level human development reports in recent years, although the values are at the provincial level (GOM–UNDP, 1998 and 1999). Severe problems of poverty still exist in Mozambique, affecting nearly 70 percent of the population, or 10.9 million people, according to the latest poverty assessment (GOM–UNDP, 1998). The incidence is higher in rural than in urban areas, with rural headcount reaching 71.2 percent compared with 62.0 percent in urban areas. The incidence of poverty is highest in the central region, whereas
the north and south are nearly equal. However, if Maputo city – which has low rates relative to the rest of the country – is excluded from the southern region, the remainder of the southern region (including Gaza Province) has poverty rates higher than the northern region, and not significantly different from the central region.
Nationally, the average household size is 4.8 persons, but among the poor the average household size is 5.6 persons compared with 3.6 persons for the non-poor. The difference is more pronounced in the rural areas (5.5 persons for the poor, 3.3 persons for the non-poor) than in urban areas (6.0 persons for the poor, 4.7 persons for non-poor). Only 32 percent of the adult rural population and 71 percent of the adult urban population are literate. The differences are greater between regions and sexes than between levels of poverty; adult poor = 54 percent literate, adult non-poor = 63 percent, whereas, males = 59 percent and females = 24 percent (change of 36 percent) and urban rural change is 39 percentage points. Given the dependence of the population on agricultural production, and the important role played by women in agricultural activity, the extremely low literacy rate of rural women has serious implications for agricultural productivity in the country (GOM–UNDP, 1998).
South AfricaThe national-level HDI varies across geographical regions in South Africa. Gauteng Province has the highest HDI in South Africa (0.717) while Limpopo Province has the lowest at 0.531 (GOSA–StatsSA, 2001a). There is also a close relationship between HDI values, rural areas, and former homelands. For example, Limpopo Province has the highest percentage of rural population (89 percent) and the highest percentage of the population living in former homeland areas and the lowest HDI value at the national level.
TABLE 18Selected human development and poverty indicators for the basin countries
Country Global HDI (1998)
Global HPI-1 (1998)
People not expected to live to
age 40 (1998)
Adult illiteracy rate
Population without access to safe water (1998)
Underweight children under age five (1998)
(%) (%) (%) (%)
Botswana 0.593 28.3 37.1 24.4 10.0 17.0
Mozambique 0.341 50.7 41.9 57.4 54.0 26.0
South Africa 0.697 20.2 25.9 15.4 13.0 9.0
Zimbabwe 0.555 30.0 41.0 12.8 21.0 15.0

Chapter 3 – Social, economic and policy environment 69
According to a recent poverty study (Whiteford and Van Seventer, 1999), 45 percent of South Africans are poor. The figure is even higher in mainly rural areas, and Limpopo Province has the highest poverty rate in the country – nearly 80 percent – compared with 45 percent nationwide, and 32 percent in Gauteng (GOSA–StatsSA, 2001a). Another national report (GOSA–NPU, 2000) further emphasizes the relative poverty and lack of human development in Limpopo Province. Some characteristics of Limpopo Province taken from this report include:
• highest percentage of economically active females (50 percent);
• one of the lowest percentages of economically active population (21 percent);
• one of the highest unemployment rates (46 percent);
• lowest percentage of people with inside tap water and flush toilets;
• youngest population, 63 percent are under age 24 years;
• highest percentage of population aged 20 with no schooling (35 percent).
ZimbabweZimbabwe has also produced two national-level human development reports, one focusing on poverty (GOZ–UNDP, 1998) and one focusing on globalization (GOZ–UNDP, 1999). The 1998 report discusses the relationship between poverty and health issues and economic development. The report states that although some progress has been made, the 1990s witnessed decreased income levels, a contraction of social expenditure, and low levels
of economic growth. HIV/AIDS is also taking its toll and reducing life expectancy.
In terms of HDI and HPI characteristics, Zimbabwe also exhibits a disparity between geographical regions and between urban and rural communities. At the national level, Matabeleland South Province ranks highest (best) in terms of HDI or HPI. Four of the six districts in this province have HDI values greater than 0.60, which is near the national average of 0.62 (Table 19). Beitbridge District is the lowest in the Province, comparable with Mberengwa District (Midlands Province). The two districts in Masvingo Province, Mwenezi and Chiredzi, are ranked 74 and 65, respectively, out of the 77 districts and urban centres listed in the 1999 report.
Gwanda (urban) ranked first out of all 77 districts and urban centres in terms of lowest (best) HPI, higher than Harare or Bulawayo urban centres. This indicates good access to infrastructure (markets, schools, health clinics, water, and electricity) as compared with the more remote districts, which tend to be the poorest and least developed.
Livelihoods and food securityUnderstanding how rural populations live and maintain their livelihoods is crucial to understanding food security. As with many sectors presented in this situation analysis, there has been no systematic analysis of livelihoods and food-insecure populations conducted across the four countries of the Limpopo River Basin. However, using these concepts in their broadest sense (Box 15), the information that was obtained
TABLE 19Selected poverty comparisons for Zimbabwe districts in the Limpopo River Basin
Source: GOZ–UNDP (1999).
District Non-survival to 40 years
of age %
Illiteracy %
Underweight children
%
Non-access to clean water
%
No access to health
care %
Living standard
deprivation %
HPI HDI
Mwenezi 22.0 39.1 30.3 31.7 0.7 20.9 29.8 0.44
Chiredzi 22.0 38.8 20.0 9.7 2.3 10.7 28.6 0.52
Beitbridge 16.9 37.8 10.0 14.2 3.4 9.3 27.1 0.55
Mberengwa 15.6 24.6 12.8 41.0 8.6 20.8 21.0 0.55
Bulilimamangwe 9.7 24.7 6.4 37.5 11.7 18.5 19.5 0.59
Matobo 7.7 18.5 9.0 34.1 9.3 17.7 15.9 0.60
Insiza 9.7 19.1 5.2 34.1 6.9 15.4 15.7 0.60
Gwanda rural 10.8 17.9 2.8 30.7 5.4 13.0 14.5 0.60
Umzingwane 9.7 14.7 9.3 18.7 1.0 9.6 11.9 0.62
Gwanda urban 12.0 6.6 0.0 0.8 0.0 0.3 8.7 0.67
Zimbabwe urban 16.9 19.6 10.0 1.0 8.8 3.7 16.0 0.62
Zimbabwe rural 16.9 19.6 14.7 36.5 8.8 17.1 17.9 0.62

Drought impact mitigation and prevention in the Limpopo River Basin70
is presented to highlight the general types of livelihood systems in the Limpopo River Basin. This information is also useful for determining which populations are likely to be the most chronically food-insecure as well as at risk of drought and other climate-induced events.
The analysis of livelihoods and vulnerability are also linked closely to some of the previous sections that discussed various biophysical and socio-economic characteristics, such as the risk of a drought occurring, the type of land use and farming systems, and poverty characteristics. More detailed surveys are needed to better understand the dynamics of livelihood systems and the relationship to food security, for example, between the various sources of own production and income, especially in these drought-prone, marginal production areas.
Various organizations listed in the sources under Box 15, as well as many others at national and local levels, are involved in livelihoods and vulnerability analysis. Efforts are underway to harmonize approaches and build capacity within the SADC region in order to build baseline information and expertise in this area (SADC, 2000).
BotswanaAlthough the agriculture sector of Botswana contributes only 4 percent to the national GDP and formal sector employment, 65 percent of the population within the Limpopo catchment area live on agricultural holdings and derive their livelihood mainly from agricultural activities (Table 20). More than 70 percent of these agricultural holders can be found in Central District and in Kweneng District.
BOX 15
Livelihoods and vulnerability assessments
Research in recent decades has led to a wealth of methods and approaches for analysing and monitoring livelihoods and food security. The concept of using some form of livelihood system (LHS) is becoming common as the basis for development planning, understanding food security, as well as responding to various types of emergencies for many development and response agencies and organizations. Many agencies have incorporated LHS concepts into their programming cycles and development programmes (e.g. FAO and UNDP).
In general, the LHS approach is a systematic and structured way to understand how people make their living so that development and emergency response interventions can be matched more appropriately with their real needs. The basic objective is to analyse in a holistic way the various components (physical, natural, social, economic and human) that make up the livelihood structure (see DFID, 1998). These components, and the linkages and interactions between them, can than be studied to determine which factors are the most important, and which ones are least stable. In this way, more appropriate interventions can be developed. Participatory
methods are encouraged so that the perspectives of the people are captured in the process.
Vulnerability assessment methods and techniques have been developed to help identify and understand food-insecure populations, generally using LHS concepts as the basis. Most methods respond to the basic definition of food security as given by the World Food Summit in 1996: “when all people, at all times, have physical, social and economic access to sufficient, safe and nutritious food which meets their dietary needs and food preferences for an active and healthy life.” Most use some combination of the generally accepted “pillars” of food security (food availability, access and utilization) in order to identify who does not meet the criterion.
As with livelihood analysis, there is no standardized approach to vulnerability assessments, although there is general agreement on basic concepts and components to consider. The outcomes may vary in terms of scale and level of detail, but the results of a vulnerability assessment should identify: (i) who and where are the most food insecure or vulnerable to becoming food insecure (to help prioritize/target populations for development/emergency interventions); and (ii) an understanding of why they are vulnerable (to help prioritize the appropriate type of intervention to meet their needs).
Sources and further information: DFID (http://www.dfid.gov.uk/); ODI (http://www.odi.org.uk/publications/susliv.html); FIVIMS (http://www.fivims.org/); SCF-UK (http://www.dinf.ne.jp/doc/japanese/twg/eng/contact/scf.html); USAID-EWS NET (http://www.fews.net/); UNDP (http://www.undp.org/); WFP (http://www.wfp.org/); IFPRI (http://www.ifpri.org); FAO (http://www.fao.org/); USAID/OFDA (http://www.usaid.gov/ofda/).

Chapter 3 – Social, economic and policy environment 71
Increasing demographic pressures are causing farm holdings to decrease in size, resulting in reduced options for grazing livestock, and consequently small ruminants are replacing cattle. The trends have created peri-urban production systems that include larger-scale commercial and intensive enterprises characterized by specialization and intensive market orientation, e.g. poultry, pigs, milk and beef feedlot systems, generally located near centres of consumption.
There is very little formal sector employment in Botswana rural areas. One report (GOB–CSO, 1996) indicates that for all rural areas in 1994, business profits accounted for only 15 percent of average household income, compared with 43 percent from cash earnings, 19 percent from the value of own produce consumed, and 14 percent from remittances from family members in urban formal employment. Income and expenditure data contained within the report show that the average rural household in Botswana was 51 percent self-sufficient in 1993/94 in terms of food requirement by value, compared with 68 percent in 1985/86.
The interplay between agricultural and non-agricultural activities has long existed in rural areas. The World Bank (1990) and others have suggested that the core strategy to alleviate poverty must be to create employment and increase rural incomes.
The 1993/94 Household Income and Expenditure Survey (HIES) (GOB–CSO, undated) indicated:
• Low incomes in rural areas. Income is highly skewed in favour of urban households, with more than half of rural households living below the poverty line. Average rural household income was 37 percent of similar urban households, which is similar to the 1985/86 average, indicating that there has been no real relative improvement in rural income in the last two decades. Cash income for rural households is at an even lower level (28 percent of urban household cash income).
• The poorest of the poor. Of the households measured in the 1993/94 HIES survey, and
in the poorest quintile, 16 percent are urban households and 64 percent rural.
• Lack of rural employment opportunities. There continue to be few rural economic opportunities outside of farming, as only 32 percent of rural household heads are employed, compared with 79 percent for urban households.
• Low improvement in social conditions. Most social indicators (malnutrition, education levels, mortality, literacy, and living conditions) are significantly worse in rural areas (GOB–UNICEF, 1993).
• Gender issues. Females head 52 percent of rural households. Such households have significantly lower incomes and access to employment than male-headed households.
MozambiqueMozambique has been involved in livelihood and food security analysis for many years. In the early 1990s, Medicins Sans Frontiere (MSF) developed a system to classify each district in Mozambique according to several vulnerability indicators. These structural vulnerability assessments are used to determine those areas or populations that are faced with chronic food insecurity. Table 21 describes structural vulnerability for Gaza Province. Only four variables are listed here to illustrate the methodology. Severe risk of drought includes those districts with less than 600 mm/year of rainfall, where extended dry periods are typical. At moderate risk of drought are those districts that normally receive more than 600 mm/year of rainfall but can be adversely affected by regular climatic variations. At risk of flood are those areas that are low-lying and experience periodic flooding that can be detrimental to crop production. Self-sufficiency is a measure of the total food produced (cereals, tubers, etc.) from own production from the two agricultural seasons, in terms of months of consumption. Finally, structural vulnerability is determined by combining all of the different data layers listed above, i.e. climate, agricultural
TABLE 20Profile of the traditional agriculture sector in Botswana
Source: GOB–FAO (1995).
Characteristic Administrative districts Limpopo River Basin
Botswana totalNorth East Central Kgatleng Kweneng
Population on agricultural holdings 79 200 161 170 28 150 116 200 384 720 584 280
Households with cattle (%) 39.9 60.9 60.1 46.2 52.8 53.1
Households with land (%) 94.2 63.8 79.3 72.7 73.5 69.6
Full-time farmers (%) 83.9 77.2 73.9 82.3 79.5 80.4

Drought impact mitigation and prevention in the Limpopo River Basin72
production, livestock, sources of income, access to markets, and coping strategies. The result is a relative scale ranging from none to food crisis.
Gaza Province has the most districts of all provinces in Mozambique that suffer from structural vulnerability. This is especially the case in the four northernmost districts of the province – Massangena, Chicualacuala, Mabalane and Chigubo. These areas are particularly arid, with an increased risk of drought, very poor soils and low agricultural potential. The people living there typically produce only half of their annual food consumption needs (less than 6 months). With poor access to markets and limited alternative sources of income the people in these areas are chronically food insecure (Box 16).
For Gaza Province, changing eating habits (reduced meals) and intensifying the search for part-time work to generate income were identified as principal coping strategies. Other strategies employed (depending on the district) include: intensifying fishing and hunting; sale of charcoal and fuelwood; sale of livestock; and in the worst case, moving the family (MSF-CIS, 1998). Other livelihood surveys conducted in Gaza Province highlight the importance of remittances from South Africa to maintain household food security (Diriba, Getachew and Cooke, 1995; FEWS NET, 2001). These studies also discuss the importance of diversified farming systems, i.e. planting various types of crops in at least two fields (one in the more productive, but flood-prone lowlands, as well as one on higher ground) to spread the risk from drought or floods and enhance household income.
Another system that was developed was the Food Security and Nutrition Survey (FSNS) to monitor, collect, analyse and interpret information about the food security and nutritional status at subdistrict level (FAO, 1997). The FSNS characterizes the basic livelihood economies and the factors that influence production, sales, consumption, food needs, and health. In recognition of the variability within a district, the data collected for each district are further subdivided into three wealth classes: poor, medium, and rich. The FSNS subdivides Gaza Province into two zones: a productive coastal zone, and an arid zone.
In the productive coastal zone (Bilene-Macia, Xai-Xai, Manjacaze, Chokwé, Guijá and Chibuto), conditions are favourable for agricultural production with “relatively” fertile soils and climate. The principal staple crops are maize, manioc and rice, and cash crops include fruits, such as mafurra (castor beans), mango, oranges, cashew, tobacco, cotton and sugar cane. The local markets in these areas are fairly well developed and accessible. Poor families in this area manage to produce 50–60 percent of their basic needs, and the rest comes from the sale of cash crops, animals, local beer, working as a labourer in nearby fields, donations, and remittances from family members in South Africa.
The arid zone (Massangena, Chicualacuala, Chigubo, Mabalane and Massingir) has poor soils for agriculture and the rainfall is low and irregular. Most of the agriculture is along the rivers, and the main crops are maize, sorghum, millet and cassava. Livestock was an important activity in
TABLE 21Structural vulnerability in Gaza Province
District Severe risk of drought
Moderate risk of drought
Risk of flood Self-sufficiency (months)
Structural vulnerability
Xai-Xai X X 10–12 None
Bilene Macia X X 10–12 None
Manjacaze X X 10–12 None
Chokwé X X 10–12 None
Chibuto X X 10–12 None
Guija X 7–9 Slight
Massingir X 7–9 Slight
Mabalane X 5–6 Economic
Massangena X 5–6 Economic
Chicualacuala X 5–6 Food insecure
Chigubo X 3–4 Food insecure
Source: MSF-CIS (1998).

Chapter 3 – Social, economic and policy environment 73
the area but suffered heavily during the war. The roads are not so developed and they are in poor condition, which makes transport and marketing
difficult. Poor households manage to acquire food through purchases, remittances and donations. Other principal sources of household income are
BOX 16
Livelihood study in Massangena District, Gaza Province, Mozambique
FAO conducted livelihood studies in several provinces in Mozambique in 1998. The objective was to obtain comprehensive information about traditional farming practices in areas subject to tsetse and trypanosomiasis. Farm and non-farm activities were analysed to identify the linkages that could affect (directly or indirectly) the impact of the disease. An additional objective was to examine the scope for poverty alleviation through livestock and crop development strategies.
The survey was conducted in August and September 1998 in three districts in south-central Mozambique. The total number of households surveyed was 2 231, with 548 in Massangena District, the northernmost district in Gaza Province. This district is mostly in the Limpopo River Basin and partly in the Save River Basin, adjacent to Gonarezhou National Park in Zimbabwe. There were 2 694 households within the district at the time of the survey. At 6.6 persons per household, this converts to 17 780 people.
Some salient points derived from this survey are:ÿ The district is very remote and transport
conditions are generally poor.ÿ Average annual rainfall is very low (400–
600 mm) and soils have very low agricultural potential.ÿ Main crop is finger millet – grown by 93 percent
of households – with an average yield about 400–500 kg/ha.ÿ Maize, although technically unsuited, is grown
by 80 percent of households, with crop failure common.ÿ The average household grows 7 crops – more
than 50 percent of households grow 7 or more crops, a risk reduction strategy to cope with erratic rainfall patterns.ÿ Crops ranked in terms of area planted were:
finger millet, cowpeas, grain sorghum, maize, beans, groundnuts, cassava, pumpkin, and sweet potatoes.
ÿ Only 10 percent of households sell millet regularly, and in small amounts to local farmers.ÿ Overall, less than 5 percent of farmers use any
type of fertilizer; cattle owners (8 percent), non-cattle owners (1.7 percent).ÿ Overall, nearly 70 percent of households meet
their household food needs regularly; only 8 percent were regularly dependent on food aid.ÿ Overall, 35 percent of adults generated income
from non-agricultural sources such as trading, off-farm employment, small business activities, handicrafts and brewing.ÿ In Massangena District, the earnings from these
sources in 1997 were about US$250 000.ÿ 39 percent earned income from handicrafts;
37 percent from brewing; 47 percent from remittances – although in small amounts and no more than twice a year.
Regarding livestock ownership:ÿ Cattle are owned by only 9 percent of
households.ÿ 32 percent claimed they had previously owned
cattle but lost them during the war.ÿ For those that own or hold cattle, the average
herd size is 11 head.ÿ 69 percent did not own goats, and 10 percent of
households owned about one-third of all goats.ÿ Chickens were owned by 75 percent of
households, and ownership was again skewed, with 10 percent of the population owning 59 percent of the chickens.ÿ 66 percent of households owned only chickens
and no other forms of livestock.ÿ Less than 1 percent owned pigs.ÿ More than 90 percent of the cattle sold were
sold to obtain cash for a specific purpose, e.g. to pay for clothes, school fees, purchase food, buy more cattle, purchase farm assets (ploughs), or pay medical expenses.ÿ Cattle-owning households grow significantly
more crops than do non-cattle owning households.
Source: FAO (1999b).

Drought impact mitigation and prevention in the Limpopo River Basin74
the sale of traditional beverage, charcoal, fuelwood and animals.
South AfricaOne study of the livelihood conditions in North West Province examined the population structure according to four categories: rural dwellers, rural producers, self-sufficient “subsistence” farmers, and farmers (Data Research Africa, 1995). Similar studies have not been conducted for the entire basin area, but the categories and general relationships probably apply throughout. These subcategories are described below (with the relative percentage in each category in the North West Province study area in parenthesis).
• Rural dwellers (22 percent). Rural dwellers use these areas as rural dormitories and they do not cultivate crops or run stock. Nationally, the proportion of rural households falling into this category is about 30 percent. These households could either be marginalized (unemployed or otherwise poverty-stricken) or urbanizing households (where husband and/or wife are likely to be migrants working in urban areas).
• Rural producers (35 percent). This category is characterized the breadwinner being either a migrant or a commuter. They are engaged in a number of economic activities, including some very minor forms of agricultural production. The largest barrier to increased agricultural production is the non-availability of labour.
• Self-sufficient “subsistence” farmers (34 percent). This category includes emerging farmers with very small herds of livestock and an inclination to expand agricultural production, but insufficient farm resources prevent them from doing so. Alternatively, they are likely to be smaller or ageing households who farm small plots efficiently. “Subsistence” farming is not a very accurate description in that remittances may still be received, and small surplus production could be sold.
• Farmers (9 percent). These households are true farmers in that they have access to larger plots of land and run larger herds. The vast majority of these farmers are livestock producers or full-time farmers who make their living out of marketing farm produce. The major barrier to agricultural production is the lack of access to specialized resources.
GOSA-StatsSA also conducted a rural survey in 1997. The aim of the survey was to better understand the economies of the rural population to determine, especially: their reliance on subsistence agriculture, the impacts of high unemployment, low-income levels, and, poor infrastructure and service provision. Five of the study areas in the rural survey were in North West and Limpopo Provinces. Results from this study revealed:
• The average number of people per household was 5.5.
• Most household heads were female, 71 percent of farm decision-makers were female.
• Approximately 50 percent of respondent households occupied one dwelling constructed using brick and mortar.
• Only 32 percent had access to electricity, 25 percent to piped water.
• Most households (55 percent) had been allocated agricultural land by the tribal authority with only 20 percent having title to their land.
• The vast majority (95 percent) of grazing land was communal.
• Few farmers (less than 12 percent) had received formal training.
• About 35 percent of respondent households were engaged in farming activities.
• Almost one-quarter of respondents had experienced crop failure in 1996, with reasons being: lack of rainfall (60 percent), poor quality of soil (12 percent), crop diseases/pests (10 percent), and floods/heavy rains (6 percent).
• Only 7 percent were engaged in farming as their sole source of income; almost 11 percent worked for a salary or commission, a further 3 percent had informal employment .
• The most important sources of income were: salaries and wages from household members (45 percent); pension, disability and maintenance grants (27 percent); and remittances from family members living elsewhere (20 percent).
LAND TENURE, LAND USE AND FARMING SYSTEMSLand tenureSince the 1980s, there has been renewed interest in land tenure (Box 17) in Africa as a response to the changing environment, especially as a result of

Chapter 3 – Social, economic and policy environment 75
increasing population pressure and land scarcity, commercialization of agriculture, urbanization, and globalization. In most African countries where land reform has been initiated, this has taken the form of tenure reform, i.e. conversion of customary land tenure to individualized land tenure. Land reform in Africa since 1980 has been linked closely to global macroeconomic policies and the promotion of efficient commercial agriculture and private investment in the agriculture sector. Individualization of land was considered to be a necessary step for achieving economic development in Africa.
The impact of individualization and titling on agricultural performance has been one of the central issues of land tenure in Africa, and a number of empirical studies have focused on this issue. As a critique to systematic state intervention to convert indigenous land tenure to individualized tenure, a new paradigm of evolutionary theory of land rights has been developed emphasizing adaptability and flexibility of indigenous African land tenure. However, with rapidly changing socio-economic conditions, indigenous tenure has increasingly failed to cope with emerging conflicts, and to regulate and enforce norms and rules that previously governed land.
Land reform in the Limpopo River Basin countriesLand and tenure reform is important in the four countries sharing the Limpopo River Basin. In post-war Mozambique, the return of refugees necessitated their resettlement. For post-apartheid South Africa, land reform was one of the top policy agenda items. Zimbabwe has entered a new phase of its land reform and resettlement programme and a new draft land policy has been issued. Land commissions have been set up in all four countries. Initiatives for the enactment of new land laws have also been undertaken in Mozambique and South Africa. Land tenure reform has taken different forms in the four countries, reflecting their socio-economic, political and historical conditions. In Zimbabwe and South Africa, where skewed land distribution existed along racial lines, tenure reform was combined with land redistribution and resettlement. In Mozambique, community land rights were recognized with a possibility of group registration. In Botswana, the decentralized land board system has provided an adaptable legal framework for customary land tenure reform.
Forms of land tenure and property regimeLand tenure involves the institutional as well as the social factors that govern access to and ownership of land and natural resources. It is defined in terms of a “bundle of rights” – specific rights to do certain things with land or property (Bruce, Migot-Adholla and Atherton, 1993). The form of land tenure and its relationship to agricultural performance in African countries has been one of the central issues among economists. Conventional views on the relation between land tenure and agricultural intensification assume that increasing population pressure and land scarcity will lead to evolution from a communal or collective property regime to a more privatized property regime. The underlying assumption is that more precise private ownership of land and title will encourage farmers to make investment in the land for intensive agricultural practices and technological innovations, thus contributing to the efficient use of scarce land and land conservation. However, it is important to acknowledge tenure security along with other essentials to promote agricultural development, such as informal credit, availability of technology, training and extension services, access to roads, markets and other agrarian structures (Hunter and Mabbs-Zeno, 1986; Pinkney and Kimuyu, 1994;
BOX 17
Land tenure
Tenure refers to control over resources or the way in which people hold, individually or collectively, exclusive rights to land and all or part of the natural resources upon it. Tenure is one of the principal factors determining the way in which resources are managed and used, and the manner in which the benefits are distributed (Rihoy, 1998). The term “land rights” may encompass rights to occupy a homestead and make permanent improvements, rights to cultivate, rights to bury the dead, and to have access for gathering natural resources such as wood. It also includes rights to transact, give, mortgage, lease, etc. areas of exclusive use, rights to exclude others, listed rights, and rights to enforcement of legal and administrative provisions in order to protect the rights holder (Adams, Sibanda and Turner, 1999).

Drought impact mitigation and prevention in the Limpopo River Basin76
Roth, Cochrane and Kisamba-Mugerwa, 1994; Golan, 1994; Roth and Haase, 1998).
Most African land tenure, including the countries that cover Limpopo River Basin, is a dual system of customary and statutory land tenure. Customary tenure systems are managed by more traditional practices that are often referred to as informal, communal or collective, in contrast to private or individualized tenure. Customary tenure is regulated and managed under the rules and norms of specific community and kinship systems. The colonial governments introduced customary law to codify the norms and rules of customary land tenure. Statutory land tenure is governed by formal land law and could be contested in statutory court to protect the formal land rights of landholders. Efforts are being made to formalize customary tenure with written documentation including certificate title.
With the exception of South Africa, the major common characteristic of the basin countries is that land is held mainly under customary tenure (Figures 33 and 34). Various customary land tenure systems are generally based on similar principles, namely inheritable land rights of usufruct, land held within family lineage, with land issues being regulated and sanctioned by customary authorities. Inheritance rules vary from group to group but generally provide secure access rights for different family members. Customary land tenure is understood to be flexible, dynamic and adaptable to changing conditions such as agrarian change, population growth, and agricultural markets. However, whereas the relatively secure and flexible nature of customary land tenure is generally well recognized, there are instances where customary tenure has been disrupted or unable to adapt to the changing environment, especially when changes are sudden and large in
scale such as in the event of drought and other environmental catastrophes.
Another way of classifying land tenure in Africa is by property regimes, which are categorized as private, common and state property regimes. Private property is the regime where natural resources, including land, are managed as a private property. Common property refers to the regime where natural resources are commonly managed by a group of people, who may hold a collective private ownership. In a state property regime, the state controls natural resources directly. The concept of property regime is usually applied to the case of management of pastoral grazing land in dry areas. The form of property regime is particularly relevant to farming in drought-affected areas. For example, a number of studies have shown that free movement of cattle provides a survival strategy for coping with drought and that exclusive individualized tenure regime could lead to overgrazing and have a negative effect on the flexible strategies of pastoralists for surviving severe natural conditions.
Land use and farming systemsAgriculture dominates the economies of SSA in terms of the population involved, and its contribution to GDP. For Africa as a whole, agriculture contributes 70 percent of employment, 40 percent of exports and 30–35 percent of GDP (Delgado, 1997). The contribution of agriculture to GDP in the basin countries varies from 4–5 percent in Botswana and South Africa to about 15 percent in Zimbabwe and 40 percent in Mozambique. However, the real contribution of the agriculture
Legend
Bophuthatswana
Ciskei
Gazankulu
Kangwane
KwaNdebele
KwaZulu
Lebowa
Transkei
Venda
BOTSWANA
ZIMBABWE
MO
ZA
MB
IQU
E
SW
AZ
ILA
ND
FIGURE 33Former South African homelands (northern areas)
Legend
A1A2Communal landsDamForest landOther commercial areasMining areasNational parksOld resettlementRecreational parksSafari areasSanctuariesSmall scale commercialState landUrban areas
FIGURE 34Broad land use categories in Zimbabwe
Note: A1 and A2 refer to resettlement (including former commercial farming areas).Source: GOZ–SADC–FANR (2003).

Chapter 3 – Social, economic and policy environment 77
sector in these countries is far more substantial and vital in terms of sustained food security, income generation, poverty alleviation and employment.
The prevailing land use systems in the Limpopo River Basin are a reflection of the agro-ecological potential in conjunction with cultural, socio-economic factors and policies. The traditional land use systems in the basin are primarily low-input systems based on extensive management and utilization of the natural resources. Observed changes and trends in recent years have been mainly in response to demographic pressures leading to more intensive exploitation of natural resources, resulting in irreversible land degradation. For example, as the option of grazing livestock has declined because of population pressure, small ruminants have replaced cattle. Peri-urban agriculture, consisting of intensive use of land, labour and capital, and characterized by large-scale commercial or market-oriented production in poultry, pigs, dairy, beef feedlots, and horticultural products, has also emerged near towns and urban centres in response to urbanization.
Livestock productionLivestock production in the Limpopo River Basin comprises two distinct systems: freehold commercial livestock production; and mixed crops or livestock systems under communal management. As indicated in Figure 26, the basin is covered largely by natural vegetation or a natural vegetation – cropland mosaic. Most of the natural vegetation outside nature conservation areas is used for extensive grazing.
Communal grazingThe mixed crops/livestock farming system is by far the main land use in terms of the number of people involved, the total area of land occupied, and the production output. For example, rangelands in Botswana comprise about 85 percent, of which 70 percent are communal lands. The system is characterized by ownership and management of cattle. These are kept primarily for draught power, social value and a means of saving on the hoof. They are mainly from local breeds that are generally low producers but are well adapted to the harsh climate conditions of the basin. Small stock is kept by most farmers and includes goats, sheep and chickens mainly used for own consumption and as a source of household income. It is estimated that about 70 percent of ruminant livestock species (cattle, sheep and goats) in southern Africa are
kept under small-scale farming conditions, based on communal grazing systems.
Cattle herd sizes are small and are estimated at less than 10 head per household in Zimbabwe (IFAD, 1996) and 4–10 animals in Mozambique. In general, herd sizes in Botswana are relatively larger than in the other basin countries. For example, the total number of cattle in 1988 was reported at 2.4 million (FAOSTAT) while in 1998 it was estimated at 1.8 million (PriceWaterhouseCoopers, 1999). However, even in Botswana, there are indications that the number of households owning cattle has been decreasing slowly and small stock (mainly goats) increasing, in response to demographic pressure (Low and Rebelo, 1996). Distribution of livestock is skewed throughout the country, being aligned closely to human population spread.
Herd management is characterized by low-input methods of farming, where animals depend mainly on extensive grazing with little or no supplementary feeding apart from provision of water. Most communal farmers do not have adequate resources to supplement veldt grazing with purchased stock feeds. In times of drought, the area becomes overstocked owing to limited vegetation growth and greater concentration of herds on available grazing land. Ideally, the number of livestock units that can survive the more difficult seasons rather than the best or even average seasons should determine the carrying capacity of these areas. Another overriding factor is the shortage of water as this may limit animal production even where forage is available. Movement of stock as a drought avoidance strategy is hampered by land tenure structures and the fact that severe droughts generally affect large areas.
Although traditional livestock farmers generally have a sound appreciation of the interaction between livestock grazing management and the environment, the communal management and land tenure system is not conducive to controlled grazing. Hence, accountability in natural resource degradation remains elusive. Increased pressures on land use and increasing demand for livestock products have resulted in land degradation that necessitates modifications of traditional husbandry methods. For example, in 1991, the Government of Botswana developed an agriculture policy that advocated fencing of already existing and used grazing areas by farmers in order to accord them an opportunity to take responsibility for their grazing resources (GOB, 1991).

Drought impact mitigation and prevention in the Limpopo River Basin78
The communal grazing systems result in low milk production, primarily focused on satisfying household needs. Low supplies of poor-quality feeds, coupled with harsh climate conditions, contribute to low milk yields. Cows that calve regularly remain in relatively poor condition and rarely have the opportunity to gain weight.
The reproduction rate of cattle under communal systems reported in the literature is particularly poor compared with reproduction percentages reported in commercial systems. A calving percentage of about 50 percent is reported (De Leeuw and Thorpe, 1996), which is equivalent to a 24-month calving interval (Table 22).
The extended drought periods common to this area contribute significantly towards low reproduction. It is well documented that mortality rates increase significantly during drought periods. For example, in Zimbabwe during the 1991/92 drought, 70 percent of the cows and 98 percent of the calves died or were disposed of through emergency sales or slaughter (Moyo, 1996). Lactating cows have a higher probability than non-lactating cows of dying from extended drought.
The offtake rates of cattle under communal tenure are low: 5.4 percent according to Tapson (1982); 6.9 percent according to Bembridge (1987); and 7.5 percent according to Steyn (1988). Fenyes (1982) reported low levels of cattle sales in the former Lebowa homeland in South Africa, where 42 percent of the respondents did not want to sell cattle, as they preferred to maximize the numbers in their herds as a safeguard against losses during drought.
Socio-economic status can serve as a useful predictor of successful and progressive cattle farming, (Bembridge and Burger, 1977). Thus, successful cattle farmers have a high socio-economic status in their communities in terms of the livestock farmer’s standard of livestock production and management and the general social economic development level.
Commercial livestock productionCommercial ranching for animal production is also an important use of the savannahs found within the Limpopo River Basin, especially in Zimbabwe and South Africa. Nearly half the area within the basin in Zimbabwe and South Africa is classified as commercial farmland predominantly used for cattle ranching. Some of these cattle farmers have switched to game farming because there are increased opportunities for better profits through tourism and hunting safaris (Low and Rebelo, 1996). Intensive grazing on improved pasture is rare in the basin and is mainly used for dairy production.
Commercial farmers tend to be responsive to the biophysical and socio-economic environment. For example, they are quick to sell stock when drought is apparent, this being a common response to drought. However, willingness to sell is dampened by tax liabilities on the sales (unless a drought is formally declared and tax relief offered). Commercial farmers generally recognize that early sales command better prices, leave more grazing for the remainder of the flocks and herds, and reduce the subsequent need for emergency sales. Fenced-in wildlife tends to be even less tolerant of drought than domestic stock owing to the curtailment of their natural need for movement in search of grazing. Where wildlife is concerned, there are fewer opportunities for sale and replacement; hence, survival feeding of valuable species is common in severe conditions.
Livestock production in BotswanaThe incidence of livestock ownership in the traditional sector in Botswana is fairly low. In 1995, 53 percent of agricultural households in the Limpopo River Basin owned cattle, and 84 percent owned goats. The average herd size was 44.7 head of cattle and, on average, every cattle-owning household sold 2.3 animals and slaughtered 0.2 head for home consumption. Goat flocks averaged 30 head and average sales per goat-farming household in the basin amounted to 0.7 head and home slaughter accounted for an average 1.2 head per household.
In Botswana, the main communal grazing is located in the hardveldt regions in the east of the country, accounting for about 86 percent of the country’s cattle, goat and sheep population. Although this area represents 25 percent of the potential grazing area, it supports 49 percent of the total cattle population. On average, a traditional
TABLE 22Botswana agricultural production indicators
Indicators Commercial Traditional
Livestock calving rate (%) 60 50
Livestock offtake rate (%) 17 8
Livestock mortality (%) 5 12
Average yield of crops (kg/ha) 500 200

Chapter 3 – Social, economic and policy environment 79
farm (cattle post) keeps 39 cattle, 20 goats and 13 sheep whereas an average commercial farm has 1 000 cattle, 113 goats and 120 sheep. The mopane and southern hardveldt regions, although major cropping areas, also have high animal populations.
The traditional livestock production system is economically important as it accounts for a large proportion of the country’s livestock industry in terms of livestock population and the number of households involved.
Commercial farming in Botswana is restricted mainly to freehold farms situated along the Limpopo River (the Tuli Block farms and other blocks of freehold farms). Some commercial livestock farming is also found in the leasehold Tribal Grazing Land Policy (TGLP) areas where the traditional system is predominant. The commercial system is relatively more advanced than traditional livestock production in terms of management practices and use of farm inputs. They also show better production performance (Table 22).
Livestock production in MozambiqueThe total land area of the Mozambique part of the basin is 80 million ha, of which 36 million ha are cultivatable land and nearly 12 million ha are classified as natural pastureland. Most of the natural pastureland is in the southernmost provinces of Maputo, Gaza, Inhambane, and parts of Tete, Manica and Sofala.
The national cattle herd declined by more than 80 percent during the war from 1.4 million head in 1974 to 214 000 head by 1993. Since then the sector has been recovering with a herd population of 352 000 head recorded in 1996. Of these, 83 percent were owned by the small-scale sector (GOM–MAF, 1997). Figure 35 shows the cattle numbers in three regions of the Limpopo River Basin between 1990 and 1999.
In spite of the huge potential for livestock development, the contribution of livestock to the national economy has always been relatively small. Even in 1980/81 at the peak in livestock numbers, the livestock subsector accounted for only 5 percent of total agricultural production. At the household level, animal and animal by-products consumption is negligible with an annual consumption of meat estimated at 1.2 kg/capita per year. Per capita milk consumption is estimated at 2.4 litres. The average consumption in Africa is 13 kg/capita per year for meat, and 30 litres/capita per year for milk. At present, almost half the total protein requirement in the domestic market is imported, while imports
accounted for 10 percent in 1981 (GOM–MAF, 1997). The use of traction animals is quite limited in Mozambique. Only 22 000 trained animals were used in 1996 (about 6 percent of the cattle population).
Although livestock production is currently relatively small in terms of national production, cattle and small stock play an important role in smallholder farming systems. Small ruminants are especially important to women and poorer households. Smallholder production systems are based mainly on mixed farming where cattle are grazed on fallow lands and on crop residues after the harvest of the main crops. The smallholder herds are concentrated mostly in the provinces of Gaza (28 percent), Tete (27 percent) and Manica (11 percent). Although these provinces contain a large percentage of the herds, production tends to be lower than the commercial and state beef production farms (Table 23). For example, Gaza ranks first in terms of relative percentage of the national herd but fifth in terms of beef production.
A large part of the infrastructure, such as dip tanks, watering points, development and quarantine stations that supported livestock development was destroyed during the war. Owing to the lack of veterinary facilities, a major outbreak of African swine fever wiped out most of the pigs in the country. However, the commercial pig industry is recovering and has grown to nearly 250 000 animals, of which 75 percent are local breeds owned by the small-scale sector (GOM–MAF, 1997).
Livestock production in South AfricaResults of the 1997 Rural Survey (GOSA–StatsSA, 1999b) revealed that 26 percent of all households
Cattle herd sizes in theLimpopo Basin Complex – anindicator of the availability ofanimal traction – are graduallyreturning to pre-1993 levels.
70 000
60 000
50 000
40 000
30 000
20 000
10 000
0
Cat
tle n
umbe
rs
1990 1991 1992 1993 1994 1995 1996 1997 1998 1999
Guija
Chokwe
Chibulo
Region
FIGURE 35Cattle numbers in the Limpopo River Basin in
Mozambique, 1990–99
Source: FEWS NET (2001).

Drought impact mitigation and prevention in the Limpopo River Basin80
had livestock. On average, a household with livestock had 11 Zebu-type cows in milk, 14 Zebu-type dry cows, 10 sheep, 9 goats, 5 pigs, 4 horses/mules and 3 turkeys/ducks. Fifteen percent of households produced animal products, eggs (75 percent) and milk (22 percent) being the most common products. Only 5 percent of all respondents sold cattle or slaughtered livestock for home consumption, and only 2.5 percent of respondent cattle owners sold animal products. Most livestock owners had kraal facilities and used some form of tick and parasite control.
According to a recent survey (GOSA–StatsSA, 2002), 17.6 percent of farming operations in Limpopo Province keep beef cattle (numbers not given), 0.7 percent keep dairy cattle, 2.9 percent keep donkeys, 22.7 percent keep goats, 6.1 percent keep pigs, and 33.8 percent keep poultry.
Output of livestock commodities (meat, milk, eggs, skins, etc.) accounted for 25 percent of agricultural domestic product (these calculations are based on both marketed and subsistence production for the region). Animal products contribute 45 percent to total agricultural production in South Africa (Kassier and Groenewald, 1990).
A number of commercial farmers own more than one farm. Thus, in cases of drought, possibilities exist for the transfer of stock between the farms in the event of the drought being less severe in some areas. Similarly, farmers in one area are generally able to lease grazing in another unless the drought is very widespread. Hence, the movement of stock to alternative grazing is a prime strategy for dealing with localized drought.
Commercial farmers in South Africa have far greater reserves of capital to draw on in times
of drought than do communal farmers. They also have better access to markets and supplies for buying feed and selling products. For most commercial farmers in South Africa, the principal concern in times of drought has been to avert loss of domestic stock and/or wildlife rather than short-term household food security. Increasingly, commercial livestock farmers have been investing in diversification opportunities to reduce drought impact through ecotourism, off-farm income and irrigation, especially for fruits and vegetables.
Livestock production in ZimbabweThe low rainfall in the Limpopo River Basin areas of Zimbabwe makes livestock production more viable than cropping. Cattle, goats and sheep are the common livestock. Survey results from the districts of Insiza and Beitbridge, where farmers were asked to rank the importance of different livestock species, revealed that cattle are most important, followed by goats, donkeys and chickens. Cattle are valued for their high sale value, as a source of draught power as well as an important asset for household income security. Small ruminants, sheep and goats, are valued as a source of meat, and they can be converted to cash in times of need. Poultry (chickens, ducks and pigeons) are an important source of meat and are also sold for cash. Donkeys are kept almost exclusively as a source of draught power. Browse from the mopane-dominated savannah provides the bulk of livestock feed as the dry conditions limit the availability of grazing to a few months after the rains.
There are important gender differences in the ownership, access and control of livestock within the household. Men tend to own and control access
TABLE 23Beef production in Mozambique
* Limpopo River Basin provinces.Source: GOM–MAF (1997).
1996 Beef production Percent of total
Percent by sector
Province State Private Smallholder Total State Private Smallholder
(tonnes carcasses) (%) (%)
Cabo Delgado 0.3 33.0 1.3 34.6 4.1 0.9 95.3 3.9
Niassa 0.0 2.8 8.6 11.4 1.4 0.0 24.3 75.7
Nampula 0.0 31.1 67.1 98.2 11.6 0.0 31.7 68.3
Zambezia 11.5 201.5 3.4 216.5 25.7 5.3 93.1 1.6
Tete 1.7 0.7 73.1 75.5 8.9 2.3 0.9 96.8
Manica 5.5 25.4 69.8 100.7 11.9 5.4 25.2 69.3
Sofala 60.1 64.1 1.4 125.6 14.9 47.8 51.0 1.1
Inhambane * 5.6 0.0 32.2 37.8 4.5 14.8 0.0 85.2
Gaza * 0.0 21.9 61.2 83.1 9.8 0.0 26.4 73.6
Maputo 2.4 33.3 24.6 603 7.2 4.0 55.2 40.8
National total 87.1 413.8 342.8 843.7
Percentage 10.3 49.0 40.6
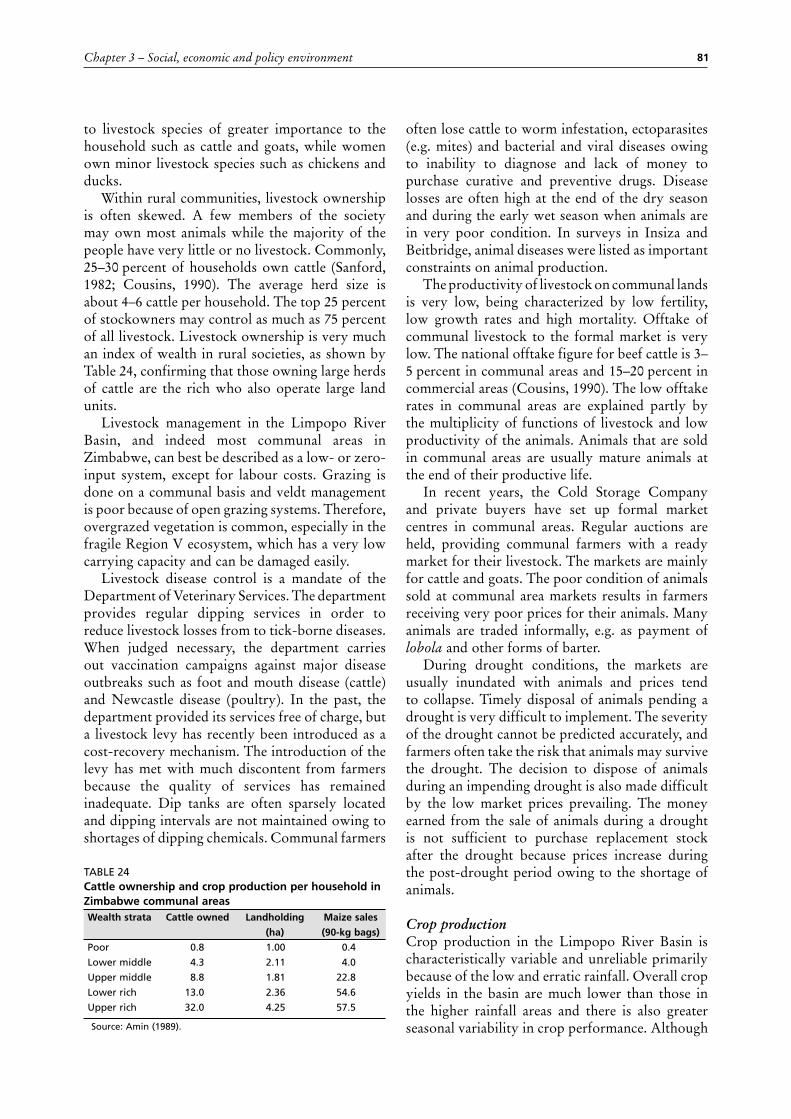
Chapter 3 – Social, economic and policy environment 81
to livestock species of greater importance to the household such as cattle and goats, while women own minor livestock species such as chickens and ducks.
Within rural communities, livestock ownership is often skewed. A few members of the society may own most animals while the majority of the people have very little or no livestock. Commonly, 25–30 percent of households own cattle (Sanford, 1982; Cousins, 1990). The average herd size is about 4–6 cattle per household. The top 25 percent of stockowners may control as much as 75 percent of all livestock. Livestock ownership is very much an index of wealth in rural societies, as shown by Table 24, confirming that those owning large herds of cattle are the rich who also operate large land units.
Livestock management in the Limpopo River Basin, and indeed most communal areas in Zimbabwe, can best be described as a low- or zero-input system, except for labour costs. Grazing is done on a communal basis and veldt management is poor because of open grazing systems. Therefore, overgrazed vegetation is common, especially in the fragile Region V ecosystem, which has a very low carrying capacity and can be damaged easily.
Livestock disease control is a mandate of the Department of Veterinary Services. The department provides regular dipping services in order to reduce livestock losses from to tick-borne diseases. When judged necessary, the department carries out vaccination campaigns against major disease outbreaks such as foot and mouth disease (cattle) and Newcastle disease (poultry). In the past, the department provided its services free of charge, but a livestock levy has recently been introduced as a cost-recovery mechanism. The introduction of the levy has met with much discontent from farmers because the quality of services has remained inadequate. Dip tanks are often sparsely located and dipping intervals are not maintained owing to shortages of dipping chemicals. Communal farmers
often lose cattle to worm infestation, ectoparasites (e.g. mites) and bacterial and viral diseases owing to inability to diagnose and lack of money to purchase curative and preventive drugs. Disease losses are often high at the end of the dry season and during the early wet season when animals are in very poor condition. In surveys in Insiza and Beitbridge, animal diseases were listed as important constraints on animal production.
The productivity of livestock on communal lands is very low, being characterized by low fertility, low growth rates and high mortality. Offtake of communal livestock to the formal market is very low. The national offtake figure for beef cattle is 3–5 percent in communal areas and 15–20 percent in commercial areas (Cousins, 1990). The low offtake rates in communal areas are explained partly by the multiplicity of functions of livestock and low productivity of the animals. Animals that are sold in communal areas are usually mature animals at the end of their productive life.
In recent years, the Cold Storage Company and private buyers have set up formal market centres in communal areas. Regular auctions are held, providing communal farmers with a ready market for their livestock. The markets are mainly for cattle and goats. The poor condition of animals sold at communal area markets results in farmers receiving very poor prices for their animals. Many animals are traded informally, e.g. as payment of lobola and other forms of barter.
During drought conditions, the markets are usually inundated with animals and prices tend to collapse. Timely disposal of animals pending a drought is very difficult to implement. The severity of the drought cannot be predicted accurately, and farmers often take the risk that animals may survive the drought. The decision to dispose of animals during an impending drought is also made difficult by the low market prices prevailing. The money earned from the sale of animals during a drought is not sufficient to purchase replacement stock after the drought because prices increase during the post-drought period owing to the shortage of animals.
Crop productionCrop production in the Limpopo River Basin is characteristically variable and unreliable primarily because of the low and erratic rainfall. Overall crop yields in the basin are much lower than those in the higher rainfall areas and there is also greater seasonal variability in crop performance. Although
TABLE 24Cattle ownership and crop production per household in Zimbabwe communal areas
Source: Amin (1989).
Wealth strata Cattle owned Landholding Maize sales
(ha) (90-kg bags)
Poor 0.8 1.00 0.4
Lower middle 4.3 2.11 4.0
Upper middle 8.8 1.81 22.8
Lower rich 13.0 2.36 54.6
Upper rich 32.0 4.25 57.5

Drought impact mitigation and prevention in the Limpopo River Basin82
basin-level production data are not available, subnational agriculture statistics generally show low production from rainfed small-scale field cropping throughout the basin.
Average grain yields of maize in the traditional (communal) sector are in the order of 250 kg/ha in Botswana compared with about 800 kg/ha in Zimbabwe. The variable most critical to cropping in the traditional sector is rainfall. Thus, sorghum, millet, groundnuts, beans/pulses and oilseeds such as sunflower tend to perform better than maize. Commercial farmers realize higher yields as they are more likely to use modern technologies and apply purchased inputs such as agrichemicals and improved hybrid seeds. Traditional agriculture typically uses family labour, whereas commercial farming uses hired labour.
Another major difference between commercial and traditional agriculture is the level of market integration. Market integration can be measured to the extent to which farming inputs are purchased and farm outputs sold. The commercial farming sector is fully market integrated and it is easier for commercial farmers to obtain credit to fund drought-mitigating activities as they can provide collateral. Supplementary feeds are easier to locate and purchase for commercial farmers but the supplies tend to be expensive as they come from outside the drought area.
In the traditional sector, there is a wide spectrum of market integration. Resource-poor farmers, especially those who do not own cattle but are engaged in marginal crop production, tend to face chronic food shortages. They normally supplement their own production through part-time or full-time casual labour employment, transfers and assistance from extended family, and other off-farm activities.
Subsistence agricultureSubsistence agriculture in the basin is typically a low-input-output system that has been adopted by local communities to minimize risks arising from climate variability and to make the most efficient use of the limited natural resources. Therefore, it is characterized by low use of purchased farm inputs such as fertilizer and certified seed as well as low management levels. There is great disparity in performance between the subsistence farm holdings and the commercial sector, primarily because of the low-level technologies used by subsistence farmers, as well as limited access to production resources.
The cropped areas, especially for annual crops,
are small. Because of poor access to draught power, the majority of the farmers rely on hand-hoeing, thus limiting the area they can cultivate. Late and poor land preparations are a common feature of the basin. They stem in part from labour constraints, poor access to mechanization, and the need for draught animals to gain condition before they can be used after the first substantial rains (which are often also the “planting rains” that fall in early summer).
Crop production is very low with an average maize yield of less than 1 tonne/ha. The low yields stem partly from the fact that soils are degraded and have low nutrient levels, especially nitrogen, as a result of continuous cropping and low use of farm inputs. Inorganic fertilizers are hardly used as few farmers can afford them, given the risks of regular crop failures. The culture of using organic sources of fertilizers is mostly poorly developed, although some farmers in Zimbabwe do have a long-term tradition of collecting leaf litter from neighbouring woodlands and applying it to their cultivated plots.
The use of improved seed is limited. An estimated 90 percent of the seed is accessed from own seed or local sources (except in Zimbabwe, where there are relatively well-developed seed distribution facilities). In general, subsistence crop production in the basin is heavily dependent on low-yielding local varieties.
Marketing channels are generally poorly developed, and farmers rely on local markets especially for the food crops. Therefore, production is mainly for home consumption, although in Zimbabwe, and to a lesser degree in the other three countries, cash crop production with sunflower and cotton is found among the slightly higher income farmers.
Overall, subsistence agriculture in the Limpopo River Basin contributes a relatively small portion to national agricultural output but it is nevertheless a very important source of income and food to the majority of people living in the basin.
Commercial crop productionThe Limpopo River Basin produces a wide variety of commercial crops, especially in South Africa. In South Africa, irrigated crop production is important in the provinces of Mpumalanga and Limpopo, particularly the Tzaneen and Louis-Trichardt areas. Large-scale commercial irrigation is focused on vegetable and fruit production, while smallholder irrigation is in its infant stages. Tree

Chapter 3 – Social, economic and policy environment 83
crops include tea (rainfed), citrus and a variety of tropical fruits such as mango and banana (irrigated).
Rainfed large-scale commercial cultivation occupies large farm units (Box 18). In general, but particularly in the western areas, farmers also face unreliable precipitation and, hence, experience occasional crop failures similar to subsistence production.
Crop production in BotswanaAn agricultural census conducted in 1993 (GOB–MOA−CSO, 1995) showed that about 99 percent of arable cultivation in Botswana was within the traditional or subsistence farming sector. The same survey also indicated that 56 percent of the subsistence farmers who planted crops in that year averaged 4 ha/household with cropped plots. However, environmental conditions have a strong influence on the performance of subsistence agriculture in Botswana, the number of farms and the total area under crops per year is quite volatile depending on the climate conditions. Thus, although almost 80 000 rural households participate in arable agriculture, of which
74 percent live in the Limpopo River Basin, not all of them have cropping activities in any given year. For example, only 63 percent of all basin farmers planted crops in 1993.
Overall, subsistence farm holdings occupy a large proportion of the country. An estimated two-thirds of traditional subsistence farmers have mixed farms comprising an individually managed cropped holding and communal grazing of livestock. In 1993, there were about 114 000 traditional farms that held more than 90 percent of all cattle and 97 percent of the area planted to crops. The Limpopo River Basin accounted for 76 percent of the total traditional sector cattle and 72 percent of the planted area.
Average yields have tended to be low reflecting the low-input/output system. In some years with relatively good rains (notably 1988, 1989 and 1995), crop production made a substantial contribution to household food requirements. Nevertheless, although subsistence agriculture might appear insignificant from a national agricultural output perspective, it is critical to the subsistence farmers themselves. They are dependent on it as a source of income and food, especially sorghum, maize, millet, beans, other pulses, and oilseeds.
The Botswana Agricultural Census of 1993 (GOB-MOA-CSO, 1995) indicated there were 253 commercial farms in the country, of which 122 (48 percent) were situated in the Limpopo River Basin. The basin accounts for 43.5 percent of commercial cattle holdings and 69 percent of the commercial holdings that practise arable agriculture. This latter figure reflects the higher incidence of irrigation availability, better soils and higher rainfall in the basin than in the rest of the country.
Horticultural production remains low in Botswana with local production tending to account for some 20 percent of local demand. There are currently 660 ha under horticultural production, 330 ha of which are either farmed by the Botswana Development Corporation or are on private farms. The balance is under small-scale projects. The country is almost self-sufficient in egg production, and poultry production expanded by 50 percent between 1991 and 1995.
Crop production in MozambiqueThe war affected crop production in Mozambique considerably. However, it has started to show signs of recovery in recent years. Infrastructure, and hence support services, are still underdeveloped, and input use is very low. Most districts have
BOX 18
Crop production in the Mpumalanga–Gauteng highveldt
Figure 22 shows the presence of Acrisols on the southeast edge of the Limpopo River Basin. Under the relatively favourable rainfall/evaporation conditions experienced in a rather limited area (Figures 7, 8 and 9), these high-potential soils of level or rolling plains (Figure 21) are highly valued for summer crop production (mostly maize). Maize yields are in the order of 5–7 tonnes/ha. Maize stover plays a major role in the overwintering of cattle, as the sourveldt grazing becomes unpalatable when frosted down in winter.
The potential of these leached, acidic soils with low natural fertility can only be realized under commercial agriculture as the input requirements in terms of lime, fertilizer, weed and pest control are high.
The economy of scale gives rise to relatively large farms of 600–2 000 ha, of which about half are generally cropped. This area is of immense importance to food security of the region.
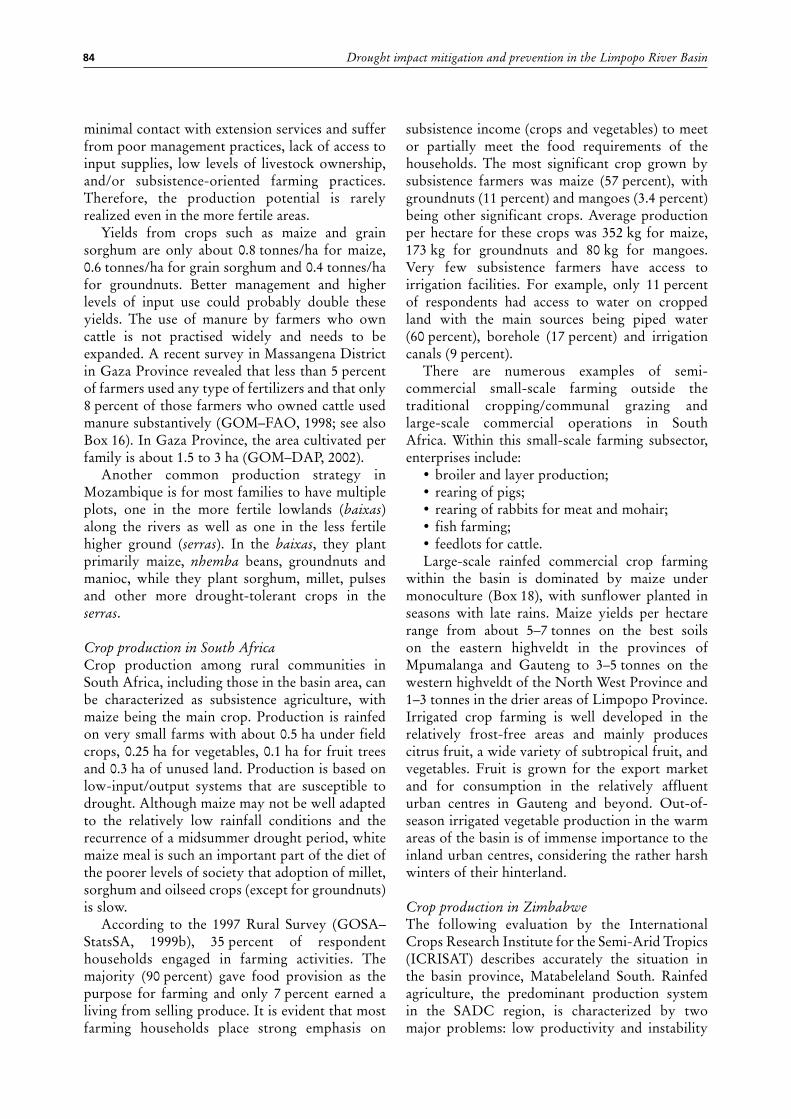
Drought impact mitigation and prevention in the Limpopo River Basin84
minimal contact with extension services and suffer from poor management practices, lack of access to input supplies, low levels of livestock ownership, and/or subsistence-oriented farming practices. Therefore, the production potential is rarely realized even in the more fertile areas.
Yields from crops such as maize and grain sorghum are only about 0.8 tonnes/ha for maize, 0.6 tonnes/ha for grain sorghum and 0.4 tonnes/ha for groundnuts. Better management and higher levels of input use could probably double these yields. The use of manure by farmers who own cattle is not practised widely and needs to be expanded. A recent survey in Massangena District in Gaza Province revealed that less than 5 percent of farmers used any type of fertilizers and that only 8 percent of those farmers who owned cattle used manure substantively (GOM–FAO, 1998; see also Box 16). In Gaza Province, the area cultivated per family is about 1.5 to 3 ha (GOM–DAP, 2002).
Another common production strategy in Mozambique is for most families to have multiple plots, one in the more fertile lowlands (baixas) along the rivers as well as one in the less fertile higher ground (serras). In the baixas, they plant primarily maize, nhemba beans, groundnuts and manioc, while they plant sorghum, millet, pulses and other more drought-tolerant crops in the serras.
Crop production in South AfricaCrop production among rural communities in South Africa, including those in the basin area, can be characterized as subsistence agriculture, with maize being the main crop. Production is rainfed on very small farms with about 0.5 ha under field crops, 0.25 ha for vegetables, 0.1 ha for fruit trees and 0.3 ha of unused land. Production is based on low-input/output systems that are susceptible to drought. Although maize may not be well adapted to the relatively low rainfall conditions and the recurrence of a midsummer drought period, white maize meal is such an important part of the diet of the poorer levels of society that adoption of millet, sorghum and oilseed crops (except for groundnuts) is slow.
According to the 1997 Rural Survey (GOSA–StatsSA, 1999b), 35 percent of respondent households engaged in farming activities. The majority (90 percent) gave food provision as the purpose for farming and only 7 percent earned a living from selling produce. It is evident that most farming households place strong emphasis on
subsistence income (crops and vegetables) to meet or partially meet the food requirements of the households. The most significant crop grown by subsistence farmers was maize (57 percent), with groundnuts (11 percent) and mangoes (3.4 percent) being other significant crops. Average production per hectare for these crops was 352 kg for maize, 173 kg for groundnuts and 80 kg for mangoes. Very few subsistence farmers have access to irrigation facilities. For example, only 11 percent of respondents had access to water on cropped land with the main sources being piped water (60 percent), borehole (17 percent) and irrigation canals (9 percent).
There are numerous examples of semi-commercial small-scale farming outside the traditional cropping/communal grazing and large-scale commercial operations in South Africa. Within this small-scale farming subsector, enterprises include:
• broiler and layer production;• rearing of pigs;• rearing of rabbits for meat and mohair;• fish farming;• feedlots for cattle.Large-scale rainfed commercial crop farming
within the basin is dominated by maize under monoculture (Box 18), with sunflower planted in seasons with late rains. Maize yields per hectare range from about 5–7 tonnes on the best soils on the eastern highveldt in the provinces of Mpumalanga and Gauteng to 3–5 tonnes on the western highveldt of the North West Province and 1–3 tonnes in the drier areas of Limpopo Province. Irrigated crop farming is well developed in the relatively frost-free areas and mainly produces citrus fruit, a wide variety of subtropical fruit, and vegetables. Fruit is grown for the export market and for consumption in the relatively affluent urban centres in Gauteng and beyond. Out-of-season irrigated vegetable production in the warm areas of the basin is of immense importance to the inland urban centres, considering the rather harsh winters of their hinterland.
Crop production in ZimbabweThe following evaluation by the International Crops Research Institute for the Semi-Arid Tropics (ICRISAT) describes accurately the situation in the basin province, Matabeleland South. Rainfed agriculture, the predominant production system in the SADC region, is characterized by two major problems: low productivity and instability

Chapter 3 – Social, economic and policy environment 85
of production. The inadequacy and uncertainty of rainfall and its uneven and irregular distribution have been further compounded by the low fertility and high fragility of soils. In addition, the subsistence and food crop sectors suffered a general neglect in terms of research, extension and provision of inputs in both the colonial and post-independence eras. The negative impact of the low emphasis on small grain cereals became progressively apparent, and the prolonged droughts precipitated a sequence of crises by dissipating self-sufficiency in food in many southern African countries. The food production gap resulted in acute hunger and malnutrition in the marginal rainfall parts of the SADC countries and, thus, it emerged as a major social issue of concern to policy-makers.
More than 60 percent of the area of Zimbabwe, accounting for 75 percent of smallholder farming areas, is located in the semi-arid region (Natural Regions IV and V) in which the basin is situated. Nearly two-thirds of the national population live in these drier parts of the country, which face a high likelihood of severe dry spells during the rainy season and frequent seasonal droughts (Hedden-Dunkhorst, 1993). The majority of the Limpopo River Basin falls within Natural Region V, the driest region of the country. This area is primarily suitable for livestock production, although rainfed production of field crops is practised throughout the region during the summer, with some irrigated crop production throughout the year.
Cropping is an important source of livelihood for communal farmers to secure adequate food supplies as well as a source of income, although production systems are extremely volatile and sensitive to rainfall patterns (Figure 36). Crops grown in the basin include maize, sorghum, cotton, groundnuts and sunflower. Average yields achieved for these major crops grown in the basin are very low, ranging from 0.40 tonnes/ha for groundnuts to just under 1 tonne/ha for maize.
Several significant trends and shifts in the production patterns have occurred in recent years:
• In all the provinces within the Limpopo River Basin (Matabeleland South, Masvingo and Midlands), production has decreased compared with the 1980s, possibly as a reflection of a deteriorating crop production potential caused by declining soil fertility and more frequent droughts.
• There has been a shift in production patterns since the late 1970s with maize gradually taking over from pearl millet, sorghum and
finger millet as the major staple, even though the chances of zero grain yields are higher with the maize than the small grains. Some of the reasons for the reduced importance of small grain cereals in recent years are high labour requirements in their production and flour preparation; shifts in taste towards maize flour; limited market opportunities; and a lack of improved crop production technologies.
• Intercropping of cereals with legumes (a traditional cropping practice in the basin) has also been giving way to monocropping as a result of vigorous extension campaigns. Intercropping is now confined to isolated patches where non-cereal crops such as pumpkins and cowpeas are planted randomly at very low densities within a cereal crop plot.
• There has been more research and extension work on maize. Hence, improved maize varieties that give higher outputs with less labour compared with the smaller grain cereals are available to farmers. Consequently, there is a preference for maize production in the basin. Of the small grains, there seems to be a preference for pearl millet as a source of food, possibly because the other grains are used for beer-making and generate higher income returns than the pearl millet (Hedden-Dunkhorst, 1993). Production of sorghum has been declining although it gives more stable but lower yields than maize. Farmers have not taken advantage of this drought-tolerant attribute as they have expanded maize production at the expense of sorghum.
• There has been a clear trend towards production of cash crops such as cotton and sunflower. However, it is mainly the above-
3 000
2 500
2 000
1 500
1 000
500
0
1 200
1 000
800
600
400
200
0
Ann
ual r
ainf
all (
mm
)
Mai
ze h
arve
st (
000s
mt)
Harvest yearMaizeRainfall19
7019
7119
7219
7319
7419
7519
7619
7719
7819
7919
8019
8119
8219
8319
8419
8519
8619
8719
8819
8919
9019
9119
9219
93
FIGURE 36Rainfall and maize production in Zimbabwe
Source: Rook (1994).
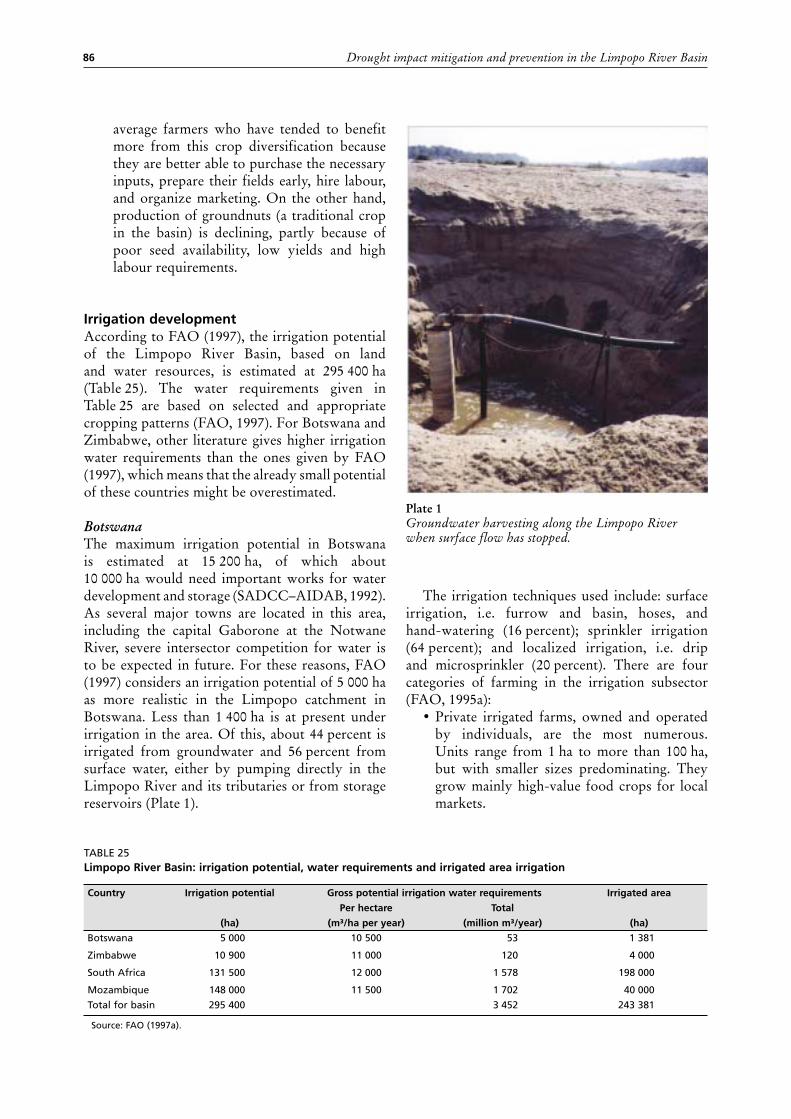
Drought impact mitigation and prevention in the Limpopo River Basin86
average farmers who have tended to benefit more from this crop diversification because they are better able to purchase the necessary inputs, prepare their fields early, hire labour, and organize marketing. On the other hand, production of groundnuts (a traditional crop in the basin) is declining, partly because of poor seed availability, low yields and high labour requirements.
Irrigation developmentAccording to FAO (1997), the irrigation potential of the Limpopo River Basin, based on land and water resources, is estimated at 295 400 ha (Table 25). The water requirements given in Table 25 are based on selected and appropriate cropping patterns (FAO, 1997). For Botswana and Zimbabwe, other literature gives higher irrigation water requirements than the ones given by FAO (1997), which means that the already small potential of these countries might be overestimated.
BotswanaThe maximum irrigation potential in Botswana is estimated at 15 200 ha, of which about 10 000 ha would need important works for water development and storage (SADCC–AIDAB, 1992). As several major towns are located in this area, including the capital Gaborone at the Notwane River, severe intersector competition for water is to be expected in future. For these reasons, FAO (1997) considers an irrigation potential of 5 000 ha as more realistic in the Limpopo catchment in Botswana. Less than 1 400 ha is at present under irrigation in the area. Of this, about 44 percent is irrigated from groundwater and 56 percent from surface water, either by pumping directly in the Limpopo River and its tributaries or from storage reservoirs (Plate 1).
The irrigation techniques used include: surface irrigation, i.e. furrow and basin, hoses, and hand-watering (16 percent); sprinkler irrigation (64 percent); and localized irrigation, i.e. drip and microsprinkler (20 percent). There are four categories of farming in the irrigation subsector (FAO, 1995a):
• Private irrigated farms, owned and operated by individuals, are the most numerous. Units range from 1 ha to more than 100 ha, but with smaller sizes predominating. They grow mainly high-value food crops for local markets.
TABLE 25Limpopo River Basin: irrigation potential, water requirements and irrigated area irrigation
Country Irrigation potential Gross potential irrigation water requirements Irrigated area
Per hectare Total
(ha) (m³/ha per year) (million m³/year) (ha)
Botswana
Zimbabwe
South Africa
Mozambique
5 000
10 900
131 500
148 000
10 500
11 000
12 000
11 500
53
120
1 578
1 702
1 381
4 000
198 000
40 000
Total for basin 295 400 3 452 243 381
Source: FAO (1997a).
Plate 1 Groundwater harvesting along the Limpopo River when surface flow has stopped.

Chapter 3 – Social, economic and policy environment 87
• Group schemes range up to 10 ha and have been developed by the government and donor agencies to provide employment and boost local incomes. Groups consist of a number of farmers, but individuals have their own plots.
• Institutional schemes are those owned and operated by government organizations, such as the Botswana Agricultural College, the Department of Agricultural Research, the Brigades Movement and the Botswana Defence Force.
• Company-owned schemes include those owned and operated by the Botswana Development Corporation (BDC) and commercial companies. BDC schemes, which total 570 ha, are located in the Tuli Block, Mogobane and Kasane.
MozambiqueBecause of unfavourable climate features, the risk of harvest loss in rainfed agriculture can reach 75 percent in the interior of Gaza Province. The irrigation potential for Mozambique in the Limpopo River Basin has been estimated at 148 000 ha (UNESCO–UNDP, 1984). Given that the Limpopo River in Mozambique may stop flowing for up to eight months of the year, the above potential has to be considered as an upper limit, requiring important storage works and good cooperation between the basin countries. Historically, the irrigation subsector in Mozambique concentrated on the development of government estates. These were established during politically unstable conditions. Little attention was paid to their financial sustainability. The state companies were inefficient, resulting in irrigation management problems and deterioration of the infrastructure. Until recently, very little effort was directed towards the development of sustainable smallholder irrigation schemes.
According to the draft national irrigation policy and strategy (GOM–DNA, 2000), the following factors contribute to a decline in irrigation:
• The abandonment of irrigated lands by the original owners just after national independence and the lack of experience of the new owners, contributing to inefficient operation and maintenance (O&M) of the irrigation schemes.
• The extended civil war, lasting more than a decade, destroying several irrigation infrastructures and leading to the abandoning of others.
• The gradual reduction of public funds for irrigation.
• The lack of inputs and technical assistance in rural areas to ensure the maintenance and improvement of the irrigation schemes.
In 1968, the irrigation subsector in Gaza Province covered 27 447 ha, or 42 percent of the national area under irrigation. This included 4 000 ha of reclaimed machongos without any infrastructure. Essentially, this area covers the Chokwé District irrigation scheme on the Limpopo River. Established for rice growing during the colonial period (1952–1972), the scheme was managed after independence in 1975 by the state enterprise Sistema de Regadio Eduardo Mondlane. In 1987, there were 29 irrigation schemes in this part of the Limpopo River Basin. Of these, six of the smaller schemes were reportedly facing water scarcity problems. The Limpopo River mouth area suffers from serious saltwater intrusion. Salinity is a major factor in limiting the use of land developed for irrigation in these areas. Mihajlovich and Gomes (1986) projected a potential for the development of 45 000 ha by 2000, given improved operational performance, and a potential for the development in the long term of 150 000 ha suited to irrigation.
In the late 1980s, the Chokwé scheme was the main water consumer in the basin (523 million m3/year). The Chokwé scheme extends about 50 km along both banks of the Limpopo River. Total water demand during an irrigation season is never satisfied. Sogreah (1987) and others have reported on inadequate O&M of the Chokwé scheme, the scheme being characterized by low irrigation efficiencies. Only about 20 percent of the water requirements are met because of structural and organizational issues. There is also considerable misuse of the water resources. This has negative consequences for downstream users of water in Xai-Xai District, where the shortage of water from the Limpopo River is critical.
Serious salinity and sodicity problems exist in the majority of the alluvial soils, especially in the lower Limpopo River areas. This is caused by the presence of saline and sodic lacustrian and estuarine deposits under the alluvium. It is aggravated by inadequate management of the irrigation and drainage systems (especially at Chokwé). A number of drainage programmes were operational in the past, especially in Xai-Xai District.
In 1983, the government initiated a policy recognizing the importance of family enterprises and redistributed scheme land. In 1989, 30 000 ha

Drought impact mitigation and prevention in the Limpopo River Basin88
of scheme land were occupied as follows: 40 percent by family enterprises, 24 percent by the State, 28 percent by private individuals, and 8 percent by cooperatives. With UNDP funds, FAO was involved in rehabilitating and improving the irrigation and drainage infrastructure of about 2 000 ha of family enterprise plots in 1988–89. The government intends to have existing schemes totally rehabilitated and recovered by 2007.
The irrigation methods vary according to the nature of the crop, topography and soil. Sprinkler irrigation is used widely in sugar cane, citrus, fruit and vegetable production. Surface irrigation is commonly applied in basins for rice and in furrows for maize and vegetables. Another method, widely used by smallholders in dambos and floodplains, is subirrigation through the control of the groundwater table. The irrigation efficiency is low.
Despite severe water shortages in some regions, the water used for irrigation is either not charged for or provided at only a token price.
South AfricaAt present, 198 000 ha are irrigated in the Limpopo River Basin in South Africa, using about 10 000 m3 of water per hectare per year. The irrigation potential shown in Table 25, based on land and water resources and a cropping pattern requiring 12 000 m3per hectare per year, is estimated at 131 500 ha (FAO, 1997). Thus, there are clear trends of less water being used on more hectares than would be suggested. The scope for irrigation development along the main stem of the Limpopo River is estimated at perhaps 4 000 ha in South Africa.
For water management purposes the Limpopo River Basin in South Africa is divided into four water management areas: Crocodile (West) and Marico, Limpopo, Elephants, and Luvuvhu and Letaba.
Crocodile (West) and Marico water management areaMore than 60 percent of the total water requirement in this water management area is for urban, industrial and mining use, about 35 percent for irrigation, and the remainder for rural water supplies and power generation. Almost 75 percent of the total requirements for water in the water management area are within the Upper Crocodile and Apies/Pienaars subareas. This again reflects the dominance of the urban and industrial
development in this part of the water management area. However, it also includes irrigation using urban return flows as well as the large irrigation developments in the vicinity of the Hartbeespoort Dam. Water requirements in the Elands subarea show a large component for mining, while the water transferred from this subarea is also destined mainly for mining use in the Lower Crocodile subarea. However, most of the water use in the Lower Crocodile subarea is for irrigation (GOSA–DWAF, 2003c).
Limpopo water management areaWater use is dominated by the irrigation sector, which accounts for nearly 75 percent of the total water requirement in the water management area. About 16 percent of the requirement is for urban, industrial and mining use, 9 percent for rural domestic supplies and stock watering, and a small quantity for power generation. The quantity of water intercepted by afforestation is relatively small and has little impact on the yield. Irrigation occurs throughout the water management area and development is distributed relatively evenly among the subareas. Some of the irrigation in the water management area is dependent on surface water from small dams or from run-of-river, which is at a very low assurance of supply. Therefore, the actual area irrigated varies from year to year, with the full area developed for irrigation only to be planted when sufficient water is available (GOSA–DWAF, 2003a).
Elephants water management areaThe bulk of the water used in the Elephants water management area is by the irrigation sector, which represents 57 percent of the total requirements for water in the water management area. Power generation represents 19 percent of the water requirements, and urban, industrial and mining combined use a further 19 percent. Most of the water used in the Upper Elephants subarea is as cooling water for thermal power stations, which is a highly consumptive use of water and requires a relatively high quality of water. A substantial quantity is also used in urban areas, more than half of which again becomes available as return flows for downstream use. As a result of the large irrigation developments downstream of the Loskop Dam, requirements for water in the Middle Elephants subarea are dominated by irrigation. Although the most populous subarea, water use for urban and rural purposes is relatively low because of

Chapter 3 – Social, economic and policy environment 89
the primary nature of water use by these sectors. Irrigation and mining are the largest water use sectors in the Steelpoort and Lower Elephants subareas, which reflects the nature of economic activity in these areas (GOSA–DWAF, 2003b).
Luvuvhu and Letaba water management areaWater use in the Luvuvhu and Letaba water management area is dominated by the irrigation sector, which represents almost 75 percent of the total requirements for water within the water management area. The impact of afforestation on the yield from water resources in the water management area represents 13 percent of the total requirements, about 9 percent is for rural
domestic supplies and for stock/game watering, and the remainder for urban, industrial and mining use. More than half of the total requirements for water within the water management area are in the catchment of the Groot Letaba River, mainly for the irrigation and forestry sectors, which shows the intensity and concentration of irrigation and afforestation in this subarea. The Luvuvhu/Mutale subarea represents a further substantial proportion of the water requirements in the water management area, followed by the Klein Letaba subarea. Irrigation is the dominant water use sector in both subareas (GOSA–DWAF, 2003d).
Table 26 provides a summary of the sectoral water requirements in each of the water management and
TABLE 26Year 2000 water requirements in South Africa
Subarea Irrigation Urban (1)
Rural (1)
Mining and bulk industrial
(2)
Power generation
(3)
Afforestation (4)
Total local requirements
Transfers out
Grand total
(million m³/year)
Crocodile (West) and Marico water management area
Apies/Pienaars 41 211 7 6 15 0 280 87 367
Upper Crocodile 208 292 5 38 13 0 558 17 573
Elands 32 23 10 48 0 0 113 24 137
Lower Crocodile 137 3 3 28 0 0 171 0 171
Marico 24 5 9 2 0 0 40 7 47
Upper Molopo 3 13 3 5 0 0 24 0 24
Total 445 547 37 127 28 0 1 184 10 1 194
Limpopo water management area
Matlabas/Mokolo 48 2 2 4 7 0 63 0 63
Lephalala 39 0 3 0 0 0 42 0 42
Mogalakwena 55 8 9 6 0 0 79 0 79
Sand 69 24 9 4 0 0 106 0 106
Nzhelele/Nwanedzi 25 0 5 0 0 1 32 0 32
Total 238 34 28 14 7 1 322 0 322
Elephants water management area
Upper Elephants 44 62 6 20 181 1 314 96 410
Middle Elephants 336 15 28 13 0 0 392 3 395
Steelpoort 69 3 5 17 0 1 95 0 95
Lower Elephants 108 7 5 43 0 1 164 0 164
Total 557 87 44 93 181 3 965 8 973
Luvuvhu and Letaba water management area
Luvuvhu/Mutale 97 4 10 1 0 7 119 2 121
Shingwedzi 0 0 3 0 0 0 3 0 3
Groot Letaba 126 3 10 0 0 35 174 11 185
Klein Letaba 25 3 8 0 0 1 37 0 37
Lower Letaba 0 0 0 0 0 0 0 0 0
Total 248 10 31 1 0 43 333 13 346
Total for basin 1 488 678 140 235 216 47 2 804 31 2 835
Notes:(1) Includes component of reserve for basic human needs at 25 litres/person per day.(2) Mining and bulk industrial water uses that are not part of urban systems.(3) Includes water for thermal power generation only. (Water for hydroelectric power, which represents a small portion of power generation
in South Africa, is generally available for other uses as well.)(4) Quantities given refer to impact on yield only.

Drought impact mitigation and prevention in the Limpopo River Basin90
subareas. Figures for the non-agriculture sectors are included to provide a sense of the situation in various subareas. All the requirements are given at a standard 98-percent assurance of supply.
ZimbabweThe irrigation potential of the Limpopo River Basin in Zimbabwe, considering both land and water resources, is estimated at 10 900 ha. Of this area, 3 950 ha are under irrigation: 1 550 ha of smallholder irrigation; 1 900 ha under large-scale commercial farmers; and 1 500 ha under the Agricultural Rural Development Authority (ARDA). It is reported that the communities in this area reap a successful crop only once in five years in the absence of irrigation. Table 27 gives information on the major smallholder irrigation schemes. For the schemes irrigating from the rivers, water is pumped from well points sunk in the riverbed sand, where water is found at a depth of about 3–10 m. These are called sand abstraction systems. The other schemes receive
their water from dams. In both cases, water is diverted into conveyance canals/pipes and then into the secondary and tertiary canals. The in-field irrigation technology in use is predominantly surface irrigation, where water is applied using furrows or border-strips. The farmers use syphons to apply water from the field canals into the field furrows or border-strips.
Some schemes on the Zimbabwe highveldt, such as the Mziki Irrigation Scheme, use draghose sprinkler irrigation systems. Here, the sprinkler head, riser and tripod are mounted to a hose that the farmer can drag freely as the sprinkler positions are changed during irrigation. Most of the newer schemes in the Mashonaland provinces use this technology (GOZ–AGRITEX, 1999a).
The plot sizes vary from scheme to scheme, ranging generally from 0.1 ha/household in the older schemes to 0.5 ha/household in the schemes developed after independence. Elsewhere in the country, where more water is available, the newer schemes can have plot sizes of 0.5–1.0 ha. The irrigation management committees, comprising a
TABLE 27Major smallholder irrigation schemes in the Limpopo River Basin in Zimbabwe
Scheme Size
(ha)
Number of farmers Technology used
Silalabuhwa 360 880 Dam and surface irrigation
Duncal 5 35 Dam and surface irrigation
Mzinyathini 12 80 Dam and surface irrigation
Tuli Makwe 102 505 Dam and surface irrigation
Masholomoshe 90 480 Dam and surface irrigation
Rustler’s Gorge 30 77 Sand abstraction and surface irrigation
Mambali 22 80 Sand abstraction and surface irrigation
Bili 21 42 Sand abstraction and surface irrigation
Mankonkoni 50 100 Sand abstraction and surface irrigation
Muziki 23 60 Borehole and sprinkler irrigation
Siwaze 22 50 Dam and surface irrigation
Malikango 60 300 Sand abstraction and surface irrigation
Manjinji 52 150 Boreholes and surface irrigation
Chikwarakwara 60 166 Surface irrigation and sand abstraction
Jalukanga 42 98 Sand abstraction and canals
Kwalu 50 225 Dams and surface irrigation
Shashe 80 182 Sand abstraction and surface irrigation
Sebasa 40 80 Dam and surface irrigation
Guyu Chelesa 20 160 Dam and surface irrigation
Sukwi 24 53 Dam and surface irrigation
River Range 10 20 Dam and surface irrigation
Valley 200 400 Dam and surface irrigation
Lilombe 10 50 Dam and surface irrigation
Somunene 20 50 Dam and surface irrigation
Tshangwa 17 85 Dam and surface irrigation
Moza 23 138 Dam and surface irrigation
Total 1 445 4 546
Source: GOZ–AGRITEX (1999b).

Chapter 3 – Social, economic and policy environment 91
chairperson, a secretary, a treasurer and some other committee members, run the smallholder schemes. These are elected every two years and they are guided by the scheme by-laws in their operations.
ForestryForestry in the Limpopo River Basin comprises natural forests and woodlands as well as commercial or plantation forestry. The latter is practised on a relatively small scale, mainly in South Africa (Figure 37). Natural woodlands are quite extensive in terms of total area covered and are the main source of wood products, especially building materials and fuelwood for local communities. They also provide non-wood products such as indigenous fruits, mushrooms, thatch grass and material for medicinal use.
Large-scale commercial plantation forestry is the most important form of forestry economically but it requires high management levels. Plantation forestry in southern Africa is predominantly based on exotic species of pine, eucalyptus and Australian wattles. These require relatively high rainfall and, therefore, they are found in the wetter parts of the basin.
In South Africa, plantation forestry is confined to the higher rainfall belt (above about 700 mm/year) along the eastern escarpment of the Drakensberg Mountains and the adjacent highveldt of northern Mpumalanga and Limpopo Provinces (Box 19). This is the northernmost part of the South African timber belt, which originates in the Western Cape
and Eastern Cape Provinces and runs along the east coast towards the Limpopo River Basin (Schulze, 1997). The area under forest in the provinces of Mpumalanga and Limpopo in South Africa has expanded steadily over the past half-century. The rest of the Limpopo River Basin in South Africa, Botswana, Zimbabwe and Mozambique is climatically unsuitable for commercial production of exotic forest species (Herbert, 1993).
The commercial forestry and related processing industry forms an important part of the economy in particular in Mpumalanga Province, where it covers 8 percent of the area and contributes significantly to GDP and employment (Scholes et al., 1995).
Plantation forestry is a minor activity in Botswana, Mozambique and Zimbabwe. The total plantation area in Botswana is estimated at about 1 200 ha, with 85 percent belonging to the government and 15 percent as private woodlots.
Limpopo Province
Gauteng MpumalandaSwazi-land
Zimbabwe
Botswana
Mozam
bique
Eucalypture
Pine
Wattle
FIGURE 37Plantation forestry in the northern provinces of
South Africa
Source: GOSA–FSA (2003).
BOX 19
Plantation forestry and water use
In the 1930s, the Government of South Africa started to establish exotic tree species plantations in order to make South Africa self-sufficient in its timber requirements and to provide more job opportunities in a diversified economy. Plantation yields vary from an average of 15 m3/ha per year for softwood to 20 m3/ha per year for eucalyptus and 9 m3/ha per year for wattle (timber and bark together).
Plantation forests occur on about 1.5 million ha of land in South Africa. These forests support industries that are important to the economy of South Africa. Although the area of these forests is relatively small (little more than 1 percent of total land area), the forests place high demands on the environment (e.g. in terms of water use) compared with both the area occupied, and compared with the natural vegetation that they replace.
In the period from the 1930s to the 1950s, South Africa established a series of whole-catchment experiments to assess the impacts of commercial forestry with alien species on water resources in high-rainfall areas. The outcome of this is that the reduction of usable run-off by commercial afforestation is estimated to be about 7 percent.
Source: GOSA–DWAF (2003e).

Drought impact mitigation and prevention in the Limpopo River Basin92
It may be assumed that most plantations are situated in the basin. Production from eucalyptus woodlots is similar to that of unattended savannah woodland.
The occurrence of natural forests is limited in the Limpopo River Basin, and dense woodlands and forests are mainly found outside the basin, e.g. Chobe forest reserves of Botswana and Zimbabwe. These Miombo and Baikiaea woodlands comprise Mukusi (aikiaea plurijuga) and Mukwa (Pterocarpus angolensis) as the most typical species.
Community forestryExtraction and collection from natural woodlands and grasslands (natural vegetation) is an extremely important land use in the basin. It includes utilization of prevailing natural vegetation as well as hunting and fishing. The economic/social importance of indigenous forest and wood products to local communities as a source of income and for subsistence is often underestimated. While the importance of timber/wood products has been well recognized, non-timber products are undervalued. Multiple uses of the natural vegetation in the basin include grazing and browsing of the open woodland, bushland or savannah types, hunting and collection of timber, fuelwood and non-timber products. The category of non-timber products includes:
• bark, leaves and stems for making ropes, baskets, mats and other household products such as utensils;
• fruit and other extracted substances to provide dietary supplements and ingredients for brewing;
• edible animal and plant products such as honey, insects and mushrooms;
• plant products (roots, bulbs, leaves and fruits) for medicinal and cultural purposes;
• grass and reed for thatching, weaving, basketry and other applications.
As the population has increased, also the demand for various woodland products has been increasing. This has led to local shortages of forest resources, culminating in deforestation and land degradation, especially around major settlements. Community forestry management approaches are based on the improvement of natural woodlands and planted communal woodlots that are under the communal land tenure system. These are lands that have been exposed increasingly to land degradation from overgrazing, opening of new lands to expand
cropping, and overharvesting of natural fauna and flora to meet low-resource household needs. Thus, by handing over management responsibilities to the local communities, more sustainable utilization is practised. In recent years, large-scale commercial plantations have attempted to develop linkages with communities through outgrower schemes as well as by offering a variety of services and products.
In the past, there were traditional methods of managing natural resources in a sustainable manner. For example, traditional chiefs regulated harvesting of forest products and protected species threatened by extinction. Local beliefs also prevented overexploitation of certain species. Many of the traditional methods of managing resources collapsed after the control over land changed, owing to instability, civil war, resettlement and different legislation after independence.
Communities have realized the impacts of excessive harvesting of forest resources in their communal areas. Some communities have banned any form of tree cutting without consulting the local authorities. Others have introduced bans that prevent people coming from outside the community to collect any wood from their forests. Others collect levies on fuelwood traders. These restrictions on forestry resources may reduce depletion of these resources and at the same time promote the use of substitutes.
Community forestry management is a relatively recent concept that was introduced to promote sustainable community-based natural resource management by allowing communities access to wood and non-wood products while also practising conservation measures. Therefore, it is a natural resource management tool that allows sustainable utilization of natural and planted woodlands. Community forestry is generally characterized by complex management systems in terms of land tenure, ownership and user rights, management responsibility, access to the forestry products, and management of conflict between traditional and modern values (FAO, 1999a).
Community or social forestry relates to activities that involve community and individual participation in the planning, execution and management of a variety of social and economic forestry elements. It refers to activities such as farm/homestead tree planting, agroforestry practices, woodlots and the establishment of trees for conservation and preservation of indigenous species, and catchment management. In a wider

Chapter 3 – Social, economic and policy environment 93
sense, it also includes commercial outgrower schemes on communal land, and management and use of the natural forests and woodlands within the community boundaries.
Community forestry management approaches differ within the Limpopo River Basin as there is wide biodiversity of the vegetation. The land tenure, population pressure and the conditions and utilization of the forest resources differ among the four countries. In Botswana and Mozambique, community forestry is relatively underdeveloped and is based largely on gathering food, plants, forage, handicrafts materials, medicinal plants, fruits, fibres and wildlife species. Almost all rural dwellers, and a large proportion of the urban population, rely on fuelwood for energy.
AgroforestryAgroforestry refers to a mixed land use where trees, crops and livestock are integrated in space and/or time. It has the advantage of providing better microclimate conditions for crop growth and supplements the soil with additional nutrients from leaves and roots. Trees with palatable foliage
provide livestock fodder. Agroforestry systems also provide households with wood products, especially fuelwood and building materials, as well as non-wood products including fruit (Box 20).
Planted agroforestry is not practised much in the basin as the climate is not very favourable, especially in the tree establishment phase. Therefore, agroforestry appears to have limited potential in the semi-arid areas, although it performs slightly better in the more humid areas along the escarpment parts of Zimbabwe and in Mozambique. Natural agroforestry practices, based on improved natural woodlands management, have high potential in the basin.
Agroforestry systems comprise different combinations of trees, crops and livestock. Systems include woodlots, trees in cropland, boundary plantings and homestead plantings. Communal forestry is considered a component of agroforestry. Of prime importance is the selection of suitable tree species to interface with crops in a way that ensures complementary advantages, such as improved soil nutrients without creating undue moisture competition. Therefore, of crucial concern in the promotion of agroforestry in the basin is the
BOX 20
Agroforestry in Zimbabwe
Integration of trees into crop and livestock production systems has always played an important role in the smallholder farming sector in Zimbabwe. Traditionally, farmers deliberately left trees growing in their crop fields, albeit at low rates, for the provision of products and services including: shade, leaf litter, windbreaks, fruits, and livestock feed. Furthermore, rural communities have relied on trees as a means of survival in very dry years because they are resilient. However, agroforestry was discouraged in favour of monocropping during the colonial period.
A survey of tree planting practices in the smallholder-farming sector of Zimbabwe carried out by the Forestry Commission established the following:ÿ Tree cultivation is more prevalent in the higher
rainfall areas and is dominated by exotics and fruit trees. Species planted in the drier areas include: paw paw, mulberry, lemon, peach, guava, marula, syringa berry, snot apple, rubber
hedge, and cockwood. Their major uses were reportedly provision of fruit, poles, fuelwood and live fencing. The potential contribution of trees to crop production through soil fertility was not mentioned explicitly by farmers during the study.ÿ Areas around the homestead, the garden and
field boundaries were very popular for tree cultivation in the study districts. The homestead and the garden were the most popular sites for planting fruit trees and live fencing (rubber hedge and cockwood). Trees for poles and fuelwood (syringa berry) were established on contours and on field boundaries. The fact that individual households control the areas planted to trees confirms the view that tree cultivation is more successful in situations where benefits can be internalized at the household level, as this provides incentives for better tree management and protection.ÿ Major constraints on tree cultivation include
lack of protection against livestock, termite damage and persistent droughts.
Source: Shumba, Mushaka and Muchichwa (1998).

Drought impact mitigation and prevention in the Limpopo River Basin94
selection of tree species that are suitable for dry conditions and are compatible with typical farming systems. Most of the exotic species growing in the humid areas are not suitable. The selection of tree species should also reflect community needs (FAO, 1995b).
Urban and peri-urban forestry are related to community or social forestry as the responsibility for the planning and management of single trees, forests and parks is shared with the urban authorities. Urban forestry has scope for development in the basin
Other land use systems and activitiesIn addition to livestock production, crops and forestry, other activities and land uses in the Limpopo River Basin comprise:
• wildlife utilization (mostly hunting, with some tourism (Box 21);
• gathering of veldt products (for fuel, construction, food and medicines);
• craft such as woodcarving, beadwork, pottery and basketwork for sale to tourists and local markets;
• agri-/rural tourism initiatives whereby tourists come and experience the rural way of life;
BOX 21
Making the most of wildlife resources – the CAMPFIRE programme in Zimbabwe
Vast tracts of land that dominate the Limpopo River Basin provide habitats for a wide range of wild animals. Wildlife has become an important land use option in the area, and activities such as safari hunting and ecotourism are a source of revenue for the local communities. Game farming (hunting) and ecotourism (paying tourists) are well suited to the basin. South Africa and Zimbabwe have thousands of hectares under these two production systems. Zimbabwe’s largest national park, the Gonarezhou, and the Kruger National Park and other game reserves (e.g. Pilanesburg and Madikwe) maintain large herds of elephants, lions, buffaloes, and other wildlife.
The Communal Area Management Programme for Indigenous Resources (CAMPFIRE) was introduced in Zimbabwe in order to assist local communities in profiting from and conserving these valuable resources. CAMPFIRE was established by a parliamentary act of 1987, allowing communities to benefit from wildlife resources within their boundaries. Communities benefit directly from income derived from animals hunted for trophy or income earned from tourism-related activities. Wildlife utilization quotas set by the Department of National Parks are marketed by district councils, and the revenue generated is passed on to the communities.
Communities living on the fringes of national parks have the greatest endowment of wildlife and, therefore, greater potential revenue earnings from
CAMPFIRE. The establishment of private wildlife estates on former commercial ranches, e.g. the Save Valley Conservancy and Malilangwe Trust, has also contributed to an increase in wildlife population in the area. The harsh climate conditions in the Limpopo River Basin have kept the human population density low, thus favouring wildlife. In the basin, successful CAMPFIRE projects have been established in the districts of Chipinge, Beitbridge and Chiredzi.
The majority of CAMPFIRE funds are generated through trophy hunting. The use of CAMPFIRE funds are determined by communities in accordance with their needs, such as the construction of clinics, schools, roads and boreholes, and to develop community income generating projects, such as grinding mills and garden projects. In some districts, revenue is used to compensate for crop and livestock losses caused by wildlife. In times of drought, people may opt for cash and seed packs to offset drought impacts.
It has been argued that revenue from CAMPFIRE may be an incentive to reduce livestock population in the dry and fragile environments. However, this has not happened, even in the most successful projects, as the revenue from CAMPFIRE is usually too small to substitute benefits from livestock ownership. Nonetheless, CAMPFIRE has been very successful and improved community ownership of natural resources and interest in conservation, as well as providing alternative sources of income. A similar approach to CAMPFIRE could be adopted in other communal lands surrounding existing game reserves within the Limpopo River Basin and other similar environments.
Source: Murombedzi (1992); Makombe (1993).
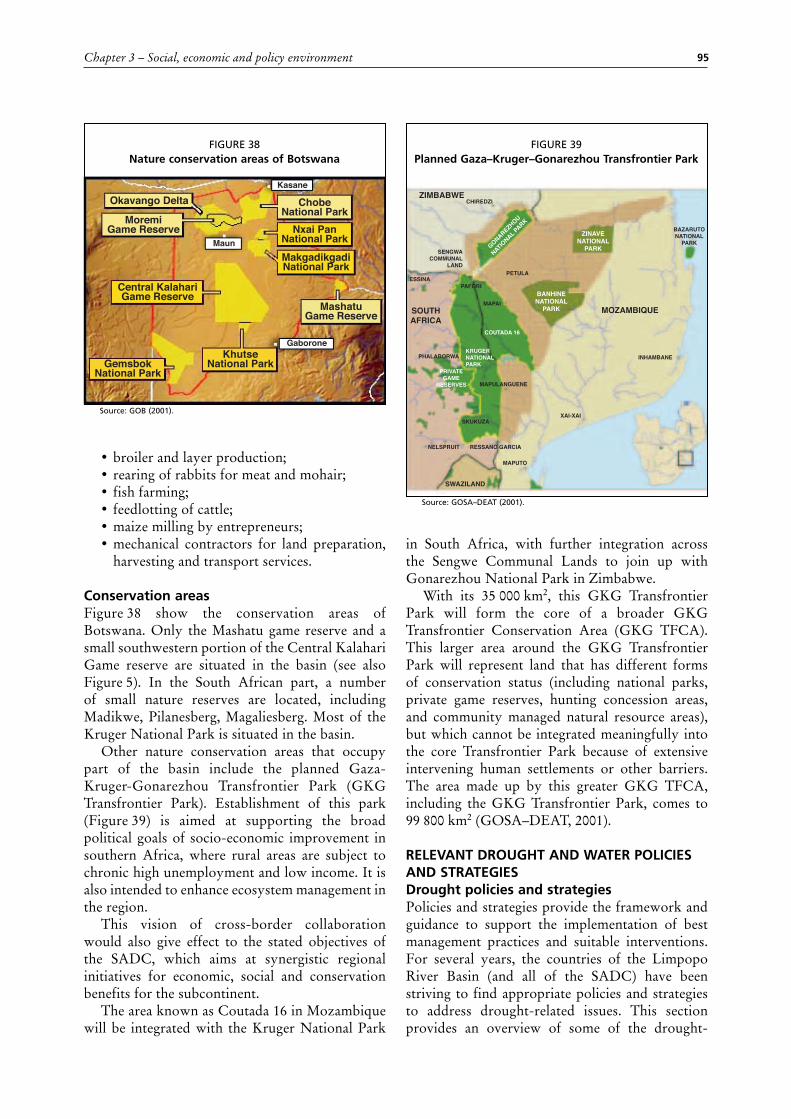
Chapter 3 – Social, economic and policy environment 95
• broiler and layer production;• rearing of rabbits for meat and mohair;• fish farming;• feedlotting of cattle;• maize milling by entrepreneurs;• mechanical contractors for land preparation,
harvesting and transport services.
Conservation areasFigure 38 show the conservation areas of Botswana. Only the Mashatu game reserve and a small southwestern portion of the Central Kalahari Game reserve are situated in the basin (see also Figure 5). In the South African part, a number of small nature reserves are located, including Madikwe, Pilanesberg, Magaliesberg. Most of the Kruger National Park is situated in the basin.
Other nature conservation areas that occupy part of the basin include the planned Gaza-Kruger-Gonarezhou Transfrontier Park (GKG Transfrontier Park). Establishment of this park (Figure 39) is aimed at supporting the broad political goals of socio-economic improvement in southern Africa, where rural areas are subject to chronic high unemployment and low income. It is also intended to enhance ecosystem management in the region.
This vision of cross-border collaboration would also give effect to the stated objectives of the SADC, which aims at synergistic regional initiatives for economic, social and conservation benefits for the subcontinent.
The area known as Coutada 16 in Mozambique will be integrated with the Kruger National Park
in South Africa, with further integration across the Sengwe Communal Lands to join up with Gonarezhou National Park in Zimbabwe.
With its 35 000 km2, this GKG Transfrontier Park will form the core of a broader GKG Transfrontier Conservation Area (GKG TFCA). This larger area around the GKG Transfrontier Park will represent land that has different forms of conservation status (including national parks, private game reserves, hunting concession areas, and community managed natural resource areas), but which cannot be integrated meaningfully into the core Transfrontier Park because of extensive intervening human settlements or other barriers. The area made up by this greater GKG TFCA, including the GKG Transfrontier Park, comes to 99 800 km2 (GOSA–DEAT, 2001).
RELEVANT DROUGHT AND WATER POLICIES AND STRATEGIESDrought policies and strategiesPolicies and strategies provide the framework and guidance to support the implementation of best management practices and suitable interventions. For several years, the countries of the Limpopo River Basin (and all of the SADC) have been striving to find appropriate policies and strategies to address drought-related issues. This section provides an overview of some of the drought-
Kasane
Okavango Delta
MoremiGame Reserve
Central KalahariGame Reserve
GemsbokNational Park
KhutseNational Park
MashatuGame Reserve
ChobeNational Park
Nxai PanNational Park
MakgadikgadiNational Park
Maun
Gaborone
FIGURE 38Nature conservation areas of Botswana
Source: GOB (2001).
ZIMBABWE
MOZAMBIQUESOUTHAFRICA
INHAMBANE
XAI-XAI
MAPUTO
NELSPRUIT RESSANO GARCIA
SKUKUZA
MAPULANGUENE
MAPAI
PAFORI
PETULA
SENGWACOMMUNAL
LAND
ESSINA
CHIREDZI
BAZARUTONATIONAL
PARK
PHALABORWA
PRIVATEGAME
RESERVES
KRUGERNATIONALPARK
BANHINENATIONAL
PARK
ZINAVENATIONAL
PARKGONAREZHOU
NATIONAL P
ARK
COUTADA 16
SWAZILAND
FIGURE 39Planned Gaza–Kruger–Gonarezhou Transfrontier Park
Source: GOSA–DEAT (2001).

Drought impact mitigation and prevention in the Limpopo River Basin96
related strategies, legislation and policies relevant in the four countries of the Limpopo River Basin, as well as the more general policy and strategy developments within the SADC. Although the focus is on drought and water policies, it is recognized that many national and regional policies have drought-related components, such as agriculture, livestock, land, natural resources, rural development, and poverty alleviation.
A complete review of the many drought-related policies and strategies cannot be realized within the limits of this situation analysis. Furthermore, it is recognized that there are many ministries and projects ongoing that address various aspects of drought that are not presented in this report. It is important to establish the linkages with these other policies and strategies in order to facilitate risk reduction and reduce the impacts of drought and climate variability. These other policies interface with national disaster and/or drought policies and plans, and vice versa. For example, the SADC regional policy for livestock recognizes the linkages between the livestock sector and the other priority development sectors, such as human resources development, agricultural research, wildlife–livestock disease interactions, crop–livestock interactions, and industry and trade.
General SADC drought strategiesSince the foundation in 1980 of the Southern African Development Co-ordination Conference (SADCC), the member states have been concerned with food security and the effects of drought. On becoming members of the SADC, each country signed a legally binding treaty through which all member countries agreed to coordinate, harmonize and rationalize their policies and strategies for sustainable development in all areas. The SADC now consists of 14 countries, including the four countries that form part of the Limpopo River Basin.
In November 1997, the SADC FSTAU organized a high-level drought policy seminar in Botswana, in response to the threat of a serious regional drought following a strong El Niño phenomenon. The report on this seminar recognized that drought in southern Africa is a normal and recurring event, and it called for long-term action in:
• investment in soil and water management, such as the improved development and management of fragile catchment areas and river basins, including small-scale irrigation;
• reviewing the appropriateness of current
crop production patterns and possibilities in support of more intensified crop diversification policies;
• redirecting research towards more appropriate farming systems;
• improved rangeland and livestock management;
• reviewing institutional arrangements and physical infrastructure.
For a long time, the emphasis of drought strategies in the region has been on short-term mitigation measures rather than on long-term prevention programmes. In recent years, new policies have been emerging in which preparedness, rehabilitation, prevention and planning are the key elements. Current drought management strategies are attempting to treat drought as a potentially serious disaster, and to integrate it into programme management cycles aimed at mitigation and prevention.
Along with the acceptance that drought is a normal and recurrent phenomenon, new policies tend to transfer the responsibility for dealing with the impacts of drought more onto the farmer or the user of the land. New strategies are designed to ensure that drought relief assistance and programmes to support farmers are consistent with existing livelihood strategies and market development policies. This may require redefining drought relief programmes, for example, designing market-based approaches using vouchers or cash to replace food and farm input handouts as a means of ensuring food security without distorting the market (SADC, 1999). Compatibility between short-term and long-term development is an important element in the new policies, in which alternative ways of supporting farmers are recommended that will reduce their vulnerability to drought in the longer term. Long-term development programmes should be better integrated into drought relief measures, e.g. infrastructure projects, such as the building of roads, dams and other utilities. These may be accelerated during drought in the form of food or cash for work programmes.
Most SADC countries are developing explicit legal frameworks for drought management, treating drought as a recurrent phenomenon that should be included in the normal planning process of development. The countries have also recognized the need to coordinate actions on regional issues that are common to them, such as water. However, many of these policies and legal frameworks are fragmented, and implementation

Chapter 3 – Social, economic and policy environment 97
plans and decision-making levels are often not well defined. Most countries have high-level institutions to provide a framework for coordination and implementation. New policies tend to promote the creation of new independent drought institutions and funds, which are yet to be established. There seems to be some contradiction between the efforts of further institutionalization of drought and the newly accepted principle of increased farmer responsibility to cope with drought.
Relevant strategic progress achieved by the SADC countries includes the following areas:
• recognition that drought impact risk-reduction can be managed within the scope of long-term development planning;
• emphasis on drought policy formulation;• highly placed functional implementation and
coordination structures;• active early-warning systems;• special programmes launched to support
specific interventions at regional level;• implications for agricultural and general land
use planning policies;• changes in general policies as a direct result of
new drought policy.The SADC (1999) has stated that reducing
long-term vulnerability to drought will require a fundamental shift in government approaches, especially towards a multidisciplinary approach in:
• promotion of drought-mitigating technologies and practices;
• poverty alleviation;• creation of an enabling policy environment;• adequate planning.Progress in technology development has been
limited. Practices relating to water use, food and nutrition, seed production, energy production, etc., need drastic improvement in order to enhance efficiency and reduce vulnerability to drought. Although considerable progress has been achieved in poverty alleviation and policy development, there is still a lack of government capacity to achieve these goals. For example, policies that need refinement to create an enabling environment include those that support sustainable management of natural resources including land and water (SADC, 1999).
Some of the most relevant objectives related to institutional arrangements discussed in the SADC strategy are:
• build human capacity for designing and implementing drought policies and
programmes, with regional support to national governments;
• promote contingency planning for drought;• develop data banks on early-warning food
security and market information;• promote technology development and
transfer;• strengthen management of resources.Earlier strategy formulations have already
recognized most of these objectives. The new SADC policy does not offer many practical suggestions on how other overall objectives related to drought prevention could be achieved. There is an objective related to management of water resources, but none to land resources. However, conditions during drought may have a serious impact on land through erosion and land degradation.
Enhanced management of existing water resources includes activities such as dam building, borehole construction, promotion of more efficient irrigation systems, pollution control, revision of water rights, and promotion of water harvesting. These recommended activities are all valuable, but the most fundamental issue in drought areas is the assessment of the potential for water development, which is not addressed.
Drought management strategies in BotswanaManamela (1997) provides an overview of drought management in Botswana, which has evolved over time on the basis of much experience. However, no single policy document has been produced to consolidate this experience apart from the 1980 strategy document and to a lesser extent a 1991 white paper. The main thrust of current government policy is to include drought management in the normal planning and development process. This implies that the non-emergency aspects of drought form an important part of regular development programmes and that in emergency areas government can use existing projects, programmes and budgets to respond to the situation, albeit in an expanded and accelerated way. As such, no special structures need be created in the event of a drought.
Drought strategies in Botswana can be divided into two distinct categories: short-term drought relief programmes, and long-term drought mitigation strategies. Drought relief programmes in Botswana have been essentially short-term operations and programmes, with action taken immediately after a drought. Drought mitigation

Drought impact mitigation and prevention in the Limpopo River Basin98
programmes are intended to help build up an overall national resilience to drought through broader national development strategies, with special attention to the rural areas.
Major objectives of the drought relief programmes have been to:
• prevent human mortality through:s averting deterioration in nutritional status
of particularly vulnerable groups,s setting up emergency water supplies for
human survival,s using labour-based work programmes to
compensate households for income lost;• protect endangered rural household productive
assets required to generate household and self-sustenance (e.g. cattle breeding stock and cattle for draught power);
• facilitate rural recovery and post-drought rehabilitation.
Three practical main components related to these overall objectives are:
• human relief, which means that in addition to existing and ongoing institutional programmes, human feeding strategies are geared up to include specific targeted populations;
• livestock relief, which includes the provision of free vaccinations in certain drought-related conditions, an expanded livestock water development programme, the facilitation of supplies of livestock feeds and requisites, and, where feasible, incentives for an increased livestock offtake;
• arable assistance packages, which include the provision of free seeds, ploughing services, and row-planting grants.
The Botswana National Development Plan stresses the role of natural resources for present and future generations (GOB–MFDP, 1997). It envisages sustainability as a strategic concept that links populations, economy and natural resources together in the context of long-term socio-economic development. Economic diversification is seen to be a major strategy element in drought mitigation. The National Development Plan states: “The diversification of the rural economy, the expansion of non-farm employment opportunities in rural areas, and improvements in agricultural efficiency, especially for smallholders, will reduce the vulnerability of the rural areas to drought.”
Disaster management strategies in Mozambique Mozambique has had ample experience dealing with the detrimental effects of various natural
disasters such as floods and droughts (Figure 40). The government created the Department for the Prevention and Response to Natural Disasters (DPCCN) in 1980 to take responsibility for providing humanitarian assistance and overall coordination in disaster response (Manjate, 1997). The DPCCN worked closely with provincial and local government structures, as well as donors and NGOs.
The overall approach to disaster management in Mozambique has recently been reviewed (although the demands of responding to the devastating floods of 2000 and 2001 distracted from major institutional changes). The DPCCN was restructured and renamed the National Disaster Management Institute (INGC) in 1999. The INGC was also scaled down to emphasize its role in planning and coordinating emergency prevention and response, rather than the actual operational logistics of distributing aid (FAO, 1998b). There is also a National Council for Disaster Management, comprised of higher-level ministerial staff from pertinent ministries. Although the government has acknowledged that the impacts of and response to disasters such as drought are related to the overall development of the country, there is no formal drought policy as yet. However, the formal policy guiding institutional arrangements for disaster management, including drought and the relationship with other national policies, is under review.
FIGURE 40Cyclone Eline (February 2000) – an example of the information available to national disaster
management committees

Chapter 3 – Social, economic and policy environment 99
Drought management strategies in South Africa In the 1990s, South Africa implemented major changes in policy related to agriculture, land use and drought. During the 1992 drought, a large number of NGOs and government departments launched the National Consultative Forum on Drought (NCFD) to coordinate a response to the drought crisis in the country. This initiative represented the broadest grouping of forces in the history of drought response in the country (AFRA, 1993). The objective of the NCFD was to ensure that relief reached the worst affected sectors and to promote the cause of the rural poor.
A new approach to disaster management was adopted in a white paper on disaster management (GOSA–MPACD, 1999) and the ensuing Disaster Management Act (Act 57 of 2002). Unlike previous policies that focused mainly on relief and recovery efforts, this act highlights the importance of preventing human, economic and property losses, and avoiding environmental degradation. This new approach aims to:
• create an environment for effective disaster management;
• promote proactive disaster management through risk reduction programmes;
• improve the ability to manage disasters and their consequences;
• promote integrated and coordinated disaster management through partnerships with stakeholders and cooperative relations between government departments;
• ensure adequate financial arrangements;• promote disaster management training and
community awareness.The act is administered by the Department of
Provincial and Local Government. It prescribes the establishment of disaster management structures at national, provincial and municipal levels. At the national level, these include: an intergovernmental committee on disaster management, a national disaster management advisory forum, a national disaster management framework, and a national disaster management centre. The duties of the latter include: communication with role players, establishing a disaster management information system, and the development of disaster management plans and strategies. At the provincial level, disaster management structures include the following (per province): a provincial disaster management advisory forum; a disaster management centre; a provincial disaster management framework; and provincial disaster
management plans. Equivalent structures are to be established in each metropolitan and district municipality.
The responsibility for developing a national drought management strategy to slot into the national disaster management plan was assigned to the Department of Agriculture. A draft agriculture disaster management plan (GOSA–DOA, 2003a) and a drought management strategy (GOSA–DOA, 2003b) followed. The following priority areas and programmes were proposed for addressing drought and drought management:
• increased awareness and preparedness by way of a national drought plan;
• reduction of risk to droughts through appropriate research plans;
• establishment of mitigation plans;• recovery and development programmes
– post-drought;• implementation of education, training and
information plans;• risk management, with a strong emphasis
on an insurance-based solution, which can be applicable to the agriculture sector as a whole.
In order to fulfil its role and responsibilities, the Department of Agriculture established the Directorate of Agricultural Risk and Disaster Management consisting of three subdirectorates: one for information, policy and implementation; one for early warning; and one for post-disaster recovery and rehabilitation.
The following measures are in place or are in the process of establishment:
• an agricultural insurance bill, aimed at providing a system of agricultural insurance in order to: improve the economic stability of agriculture, enhance the income of those farmers and producers most vulnerable to losses of agricultural crops and livestock from natural disasters, provide financial assistance, and control certain activities of agricultural insurers and intermediaries.
• approaches for an integrated risk management system for identifying, reducing and managing risk, whether natural or human-induced.
Drought management strategies in Zimbabwe Throughout the recent drought periods in Zimbabwe, the response by the Government of Zimbabwe (GOZ), local communities and authorities, as well as donors, has focused on short-term emergency response. Most local government
Drought impact mitigation and prevention in the Limpopo River Basin100
authorities lacked the capacity to react to these disasters, let alone prepare for them in an effort to mitigate the possible impact of drought. The GOZ realized the need to develop appropriate action plans to counter both the short-term and long-term effects of drought, to develop institutional capacity, and to invest more resources in order to meet the needs of the most vulnerable population groups.
To address these issues, the GOZ developed the National Policy on Drought Management (NPDM), which was formulated in 1998 and approved in 1999 (GOZ–NEPC, 1999). The policy document discusses general drought management issues and reviews government capacities and structures to deal with drought preparedness, mitigation and response issues. Special emphasis was placed on developing sustainable livelihoods for those populations most at risk to drought-induced shocks. The policy states that these activities should be integrated with other developmental programmes and projects and that they should form an integral part of all district-, provincial- and national-level development policy and planning processes.
The NPDM emphasizes long-term drought mitigation measures, such as the harvesting and efficient utilization of water, increased agricultural productivity in both commercial and communal areas, land use planning and proper management of national resources and the environment. This paradigm emphasizes forward planning, preparedness, prevention, mitigation response, recovery and rehabilitation. The policy is designed to facilitate the sharing of risk between government and farmers, while building the capacity of individuals and communities at household level to plan and undertake activities that utilize household resources efficiently and effectively. Livelihood sustainability is premised on a balance between economically efficient and ecologically sound options for households to make a living and cope with the short- and long-term impacts of drought.
In order to achieve these objectives, the NPDM will be operationalized through a number of strategies including:
• facilitating sustainable management of natural resources;
• encouraging: crop production only in those areas that are climatically and topographically suitable for particular crops, proper mechanical and biological precautions versus soil loss, good land use practices through educational awareness campaign, and research
into promotion of drought-tolerant food crops;
• ensuring correct stocking rates of domestic livestock and establishment of grazing schemes;
• supporting current policies and programmes on reforestation;
• ensuring and enforcing correct protection and management of water catchment areas, construction of more dams, and sustainable exploitation of underground water;
• accelerating rural industrialization;• promotion of small-scale enterprises;• reducing land pressure through resettlement
and proper land use practices;• introducing appropriate water resources
management and irrigation development schemes.
Zimbabwe’s agriculture policy also recognizes that the country is susceptible to recurrent droughts. The Ministries of Lands and Agriculture, Public Service Labour and Social Welfare and Local Government coordinate the development of policies and strategies to minimize the effects of drought. The thrust of the government’s agriculture policy is to reduce the current emphasis on the provision of food aid in favour of a broad approach involving the development of sound strategies and schemes that help families to cope with the effects of drought. The strategy involves an improvement in water availability through the expansion of irrigation schemes, water harnessing by construction of dams, and the equitable distribution of water for irrigation. The policy also highlights the need for intensive research on improving the tolerance of staple food crops to drought and diseases.
Water policies and strategies in the SADC regionGeneral SADC water policiesIn the past decade, SADC has been in the process of developing a regional water policy and strategy as well as harmonizing national policies and legislation related to water management. In the SADC region, water is an important transboundary issue and will require well-coordinated efforts between the various countries to manage the water resources properly. SADC has realized the need for integrated water resources development and management in the region in order to combat issues such as drought, floods, and food security.
In view of the above, SADC established the

Chapter 3 – Social, economic and policy environment 101
SADC Water Sector Coordinating Unit (SADC–WSCU) in 1996. The overall responsibility and day-to-day coordination of activities was entrusted to the Government of the Kingdom of Lesotho, within the Ministry of Natural Resources. The vision of the SADC–WSCU was: “to attain the sustainable, integrated planning, the development, utilization and management of water resources that contribute to the attainment of SADC’s overall objectives of an integrated regional economy on the basis of balance, equity and mutual benefit for all member States.”
In pursuit of the above vision, the SADC member countries have developed a legal framework in the form of the SADC Protocol on Shared Watercourses that should be applied to all water related developments and management (SADC–WSCU, 1995). Eleven member states signed this protocol in August 1995 and it came into force in 1998 after ratification by the required two-thirds majority of the SADC member states. Recently, the SADC–WSCU has amended this protocol, now called Shared Watercourse Systems Ptrotocols, in order to incorporate the current developments in international law and to align them with other accepted international legal instruments (SADC–WSCU, 2001). One example is the United Nations Convention on the Law of the Non-navigational Uses of International Watercourses, adopted by the UN General Assembly in April 1997.
In 1997, with the assistance of the UNDP, the SADC–WSCU embarked on the development of a regional strategic action plan (RSAP) on integrated water resources development and management (SADC–WSCU, 1998). This action plan represents a five-year (1999–2004) programme framework and contains 31 prioritized project concepts. These projects were presented to the Cooperating Partners at the Geneva Round Table Conference in December 1998. The plan and various donors selected individual projects for support. The final 31 project concept notes (PCNs) addressed eight major issues: legal and regulatory framework; institutional strengthening; sustainable development policies; information acquisition, management and dissemination; education and training; awareness building; public participation; and infrastructure. In relation to these major issues, the RSAP aims to harmonize policy, legislation and management of water sources in general and transboundary water sources in particular in the region.
The establishment of the SADC–WSCU and development of the Shared Watercourse Systems
Protocol represent important strides towards realizing the importance of water in the region in achieving the strategic and development objective of the SADC of poverty alleviation, food security and industrial development. SADC member countries hope to achieve these goals through the implementation of the above initiatives. Many of these initiatives will have a direct impact on the management of the Limpopo River Basin or they mention explicitly the Limpopo River Basin as the project or pilot area (Box 22).
The cooperation between the countries regarding water resources has developed to reflect specific countries’ demands. For example, in 1983, Botswana and South Africa had already established a joint permanent technical committee to deal with water matters of interest to these two countries. A joint permanent technical commission replaced this in 1989, followed by a water commission in November 1995 (Pallett, 1997). It was noted that a commission has more legal power than a committee, which explains the effort to establish commissions. Other examples of multinational water agreements are:
• Establishment of a tripartite permanent technical committee to manage the Incomati, Limpopo and Maputo River Basins, agreed upon by Mozambique, South Africa and Swaziland in 1983.
• Limpopo Basin Permanent Technical Committee (LBPTC) established in Harare in 1986 by Botswana, Mozambique, South Africa and Zimbabwe.
• Agreement between Mozambique and South Africa concluded in 1996, and known as the South Africa/Mozambique Joint Water Commission Agreement.
• Limpopo Hydrometric Study (1996) approved by the LBPTC on 14 August 1995.
• Establishment of a Limpopo Basin Commission (LIMCOM) is under consideration to elevate the status of the LBPTC of 1986 to that of a permanent commission.
BotswanaThe Director of Water Affairs is the registrar of the Water Apportionment Board, provides the secretariat and acts as technical advisor to the board. The Water Act and the Borehole Act, administered by the board, require individuals or groups to apply for a right to use irrigation water. Responsibility for planning and implementation of

Drought impact mitigation and prevention in the Limpopo River Basin102
irrigation development rests with the Ministry of Agriculture.
Botswana accepts that food self-sufficiency is neither achievable nor sustainable. Therefore, its objectives are to improve food security at both household and national levels by giving top
priority to production systems and programmes that are sustainable, efficient in resources and environmentally compatible. Any proposed irrigation project must be economically viable and sustainable. Botswana faces a substantial shortfall in water supplies (Box 23) as competing uses and
BOX 22
Selected project concept notes from the SADC–WSCU Shared Watercourse Systems Protocol
PCN 8: SUPPORT FOR THE IMPLEMENTATION PROGRAMME FOR THE SADC PROTOCOL ON SHARED WATERCOURSE SYSTEMSGeneric replicable methodologies will be tested on pilot river basins, of which one is the Limpopo River Basin. Among others, the Limpopo Technical Committee is to be involved. USAID and the Gesellschaft für Technische Zusammenarbeit (GTZ) are the donors giving the support to piloting in the Limpopo River Basin. Currently, the Terms of Reference for the implementation of the Protocol and the River Basin Management Approach on the Limpopo are being prepared.
PCN 10: SUPPORT DEVELOPMENT OF NATIONAL WATER SECTOR POLICIES/STRATEGIES IN SELECTED MEMBER COUNTRIESIn this project USAID will collaborate with FAO and UNEP to support policy review processes in selected countries i.e. the Limpopo River Basin riparian States.
PCN 6: GROUNDWATER MANAGEMENT PROGRAMME FOR THE SADC REGIONThe Limpopo River Basin has been selected as one pilot area. One of the outputs will be an assessment report of the Limpopo/Save Basin aquifer. Initial elaboration of this PCN was done in 1998 with support from UNEP. The French Cooperation is spearheading the implementation of the whole programme through the Technical Assistance (TA) at WSCU.
Additionally, the two regional projects below will have long-term implications on the Limpopo River Basin:
PCN 1: GUIDELINES FOR REVIEW AND FORMULATION OF NATIONAL WATER LEGISLATIONThe project rationale is that much of the negotiation over shared water resources will depend on the development of compatible policy and legislative frameworks at national level together with the requisite institutional capacity. These frameworks and capacities are essential if each country is to negotiate shared water resources from equal positions.
The purpose of the GEF grant will be to support the development of domestic water resources legislation of SADC member countries and on its administration. Thus, facilitating meaningful negotiations on and implementation of treaty obligations concerning, the management, development and conservation of the water resources of rivers, lakes and underground aquifers the SADC member countries share with one another or with each other across their international boundary lines. FAO is the leading Cooperating partner with support from GEF.
PCN 11: FORMULATION OF REGIONAL WATER SECTOR POLICY AND STRATEGYThe long-term objective with this initiative is to formulate a Regional Integrated Water Resources Development and Management Policy and Strategy for the SADC Region. The expected project outputs are as follows:ÿ Regional Water Sector Policy and Strategy
formulated and approved by the SADC Water Sector Committee of Ministers and the SADC Council of Ministers.ÿ The Regional Water Sector Policy and Strategy
is being implemented and respected by SADC member States as a framework to guide cooperation in water resources and management in the SADC region.ÿ A consultative process for soliciting
stakeholders’ views on the long-term Water Sector Policy and Strategy is functioning effectively.

Chapter 3 – Social, economic and policy environment 103
consequent high opportunity cost of water makes irrigation uneconomic. Therefore, any further large-scale irrigation is doubtful (GOB, 1992a).
MozambiqueThe Water Law of 1991 defines the institutional and legal framework for the licensing and allocation of water concessions (Box 24). Under this law, the National Water Council provides intersector coordination and strategic decision-making (GOM, 1991).
The government programme for 1994–99 had as its main objective the reconstruction of the national social and economic structure. In this context, a national water policy was published in 1995 (GOM–DNA 1995) and included the following salient aspects:
• The satisfaction of basic needs is a high priority and will require increased water supply and sanitation, in particular to rural, low-income groups.
• Water is regarded as having an economic as well as a social value. For services to be financially viable, the price of water should reflect its economic value, eventually covering the cost of supply.
• The operational water resources management will be decentralized to autonomous catchment authorities. The provision of water supply and
BOX 23
Botswana’s vulnerability to water problems
The 1997 UN Comprehensive Freshwater Assessment showed that southern Africa is one of the most vulnerable regions for water-related problems. The water resources problem is seen as a potential limit to development and a stress on population and economic growth. The assessment classified the water resources of Botswana and Namibia as stressed and moving towards being very vulnerable by 2025.
While national-level data show Botswana withdrawing only 4 percent of its available water, the 1992 National Water Master Plan of Botswana predicted that the capital, Gaborone, will run out of water within the next 10 years based on current supplies and population forecasts. Gaborone, expected to be one of the main centres of growth of the SADC region into the twenty-first century, receives its water supply primarily from surface water sources. In fact, groundwater is considered a non-renewable resource because of the very low recharge rates, and will only be used in cases of emergency to augment existing surface water supplies in Gaborone.
Source: IIASA (1998).
BOX 24
Institutions involved in water and irrigation development in Mozambique
The National Water Council was created in 1991. It coordinated the four ministries involved in water development: the Ministry of Agriculture, the Ministry of Energy, the Ministry of Industry, and the Ministry of Construction and Water (which chaired the council). The council’s main function was to develop a national water management policy, and to monitor its execution.
The National Water Directorate (DNA) is one of the four directorates of the Ministry of Construction and Water. Its objectives are to ensure the proper utilization of groundwater and surface water resources.
The recently created Regional Water Administrations or Administraçaoes regional de agues (ARAs), which are basin authorities responsible for water development and management, have administrative and financial autonomy but report to the DNA. The ARAs are also in charge of collecting hydrological information. The only ARA created by the end of 1994 was ARA-sul, in charge of the southern part of the country up to the Save River, where most problems of water management exist.
The Secretariat of State of Agricultural Hydraulics (SEHA), under the Ministry of Agriculture, is the coordinating authority for activities relating to irrigation and drainage. Inside the SEHA, a programme has been created specifically for small-scale irrigation (Programa nacional de irrigacao de pequena escala).
Source: GOM (1991).

Drought impact mitigation and prevention in the Limpopo River Basin104
sanitation services should be decentralized to autonomous local agencies. These should become financially self-sufficient.
• The allocation of bulk raw water through integrated river basin management should optimize benefits to the community, balancing the interests of both present and future users. It should take into account environmental impacts, and conserve water resources for the future.
• The investment policy will balance economic development with poverty alleviation. Principal investments should be aimed at conserving the existing infrastructures and reducing water losses.
• The government will promote private sector participation. Conditions should be created for the attraction of private investment.
• Prime objectives will be the provision of basic water supply needs to low-income groups in peri-urban areas and the provision of basic water supply needs to low income groups in rural areas. Special attention will also be given to the rehabilitation of small water supply systems of urbanized centres in the rural areas as part of the process of reactivating social and economic infrastructures and activities such as hospitals, schools and commerce.
South AfricaThe water sector in South Africa was completely reformed following the elections in 1994. The reform process led to a series of documents and principles to guide the water management and development of South Africa. These principles guided the intensive programme of work involving the minister and other political leaders, officials from the Department of Water Affairs and Forestry (DWAF) and other government departments, organized user groups and South Africans in a process of consultation, research and synthesis. One of the results has been a new national water act, which was approved in 1998, as well as progress to integrating these concepts with other policies, such as drought, disaster and agriculture (Box 25).
White Paper on Water Policy of 1997The White Paper on Water Policy was the product of two years of hard work and wide consultation and it represented the policy of the Government of South Africa, as approved by Cabinet on 30 April 1997. The White Paper forms an important part of
the review and reform of the Water Law in South Africa, and many of these proposals are relevant to water sector reform beyond South Africa. Some of the key proposals are:
• The national government will act as the custodian of the nation’s water resources and its powers in this regard will be exercised as a public trust.
• All water in the water cycle whether on land, underground or in surface channels, falling on, flowing through or infiltrating between such systems, will be treated as part of the common resource.
• Only that water that is required to meet basic human needs and maintain environmental sustainability will be guaranteed as a right. This will be known as the Reserve.
• In shared river basins, government will be empowered to give priority over other uses to ensure that the legitimate requirements of neighbouring countries can be met.
• All other water uses will be recognized only if they are beneficial in the public interest. These other water uses will be subject to a system of allocation that promotes use that is optimal for the achievement of equitable and sustainable economic and social development.
BOX 25
South Africa’s water sector reform documents
ÿ Water Supply and Sanitation Policy White Paper, November 1994.
ÿ Fundamental Principles and Objectives for a New Water Law in South Africa.
ÿ White Paper on the National Sanitation Policy, July 1996.
ÿ White Paper on Water Policy, April 1997.ÿ Water Services Bill, published in the Govern-
ment Gazette, May 1997.ÿ National Water Bill, September 1997.ÿ Water Services Act (Act 108 of 1997).ÿ Drought policy – water issues, June 1997.ÿ National Water Act (Act 36 of 1998), August
1998.ÿ Drought and Agricultural Disaster Policy
Development.ÿ National Water Resource Strategy, August
2002.
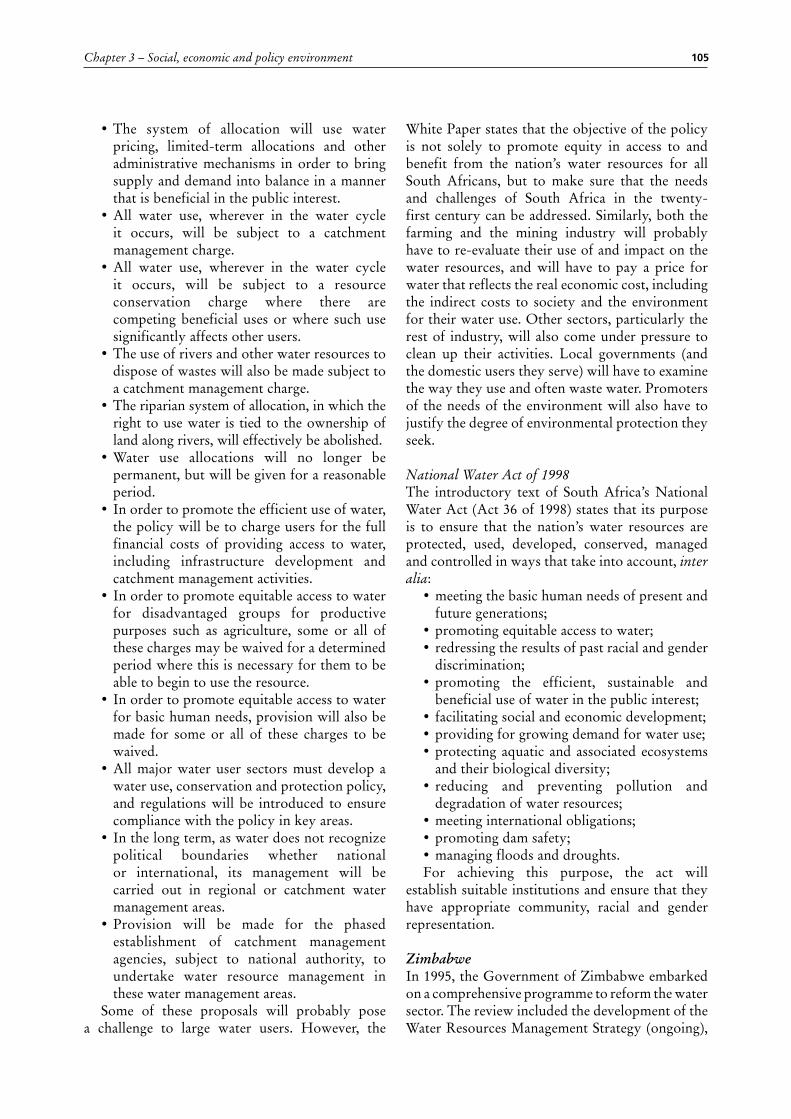
Chapter 3 – Social, economic and policy environment 105
• The system of allocation will use water pricing, limited-term allocations and other administrative mechanisms in order to bring supply and demand into balance in a manner that is beneficial in the public interest.
• All water use, wherever in the water cycle it occurs, will be subject to a catchment management charge.
• All water use, wherever in the water cycle it occurs, will be subject to a resource conservation charge where there are competing beneficial uses or where such use significantly affects other users.
• The use of rivers and other water resources to dispose of wastes will also be made subject to a catchment management charge.
• The riparian system of allocation, in which the right to use water is tied to the ownership of land along rivers, will effectively be abolished.
• Water use allocations will no longer be permanent, but will be given for a reasonable period.
• In order to promote the efficient use of water, the policy will be to charge users for the full financial costs of providing access to water, including infrastructure development and catchment management activities.
• In order to promote equitable access to water for disadvantaged groups for productive purposes such as agriculture, some or all of these charges may be waived for a determined period where this is necessary for them to be able to begin to use the resource.
• In order to promote equitable access to water for basic human needs, provision will also be made for some or all of these charges to be waived.
• All major water user sectors must develop a water use, conservation and protection policy, and regulations will be introduced to ensure compliance with the policy in key areas.
• In the long term, as water does not recognize political boundaries whether national or international, its management will be carried out in regional or catchment water management areas.
• Provision will be made for the phased establishment of catchment management agencies, subject to national authority, to undertake water resource management in these water management areas.
Some of these proposals will probably pose a challenge to large water users. However, the
White Paper states that the objective of the policy is not solely to promote equity in access to and benefit from the nation’s water resources for all South Africans, but to make sure that the needs and challenges of South Africa in the twenty-first century can be addressed. Similarly, both the farming and the mining industry will probably have to re-evaluate their use of and impact on the water resources, and will have to pay a price for water that reflects the real economic cost, including the indirect costs to society and the environment for their water use. Other sectors, particularly the rest of industry, will also come under pressure to clean up their activities. Local governments (and the domestic users they serve) will have to examine the way they use and often waste water. Promoters of the needs of the environment will also have to justify the degree of environmental protection they seek.
National Water Act of 1998The introductory text of South Africa’s National Water Act (Act 36 of 1998) states that its purpose is to ensure that the nation’s water resources are protected, used, developed, conserved, managed and controlled in ways that take into account, inter alia:
• meeting the basic human needs of present and future generations;
• promoting equitable access to water;• redressing the results of past racial and gender
discrimination;• promoting the efficient, sustainable and
beneficial use of water in the public interest;• facilitating social and economic development;• providing for growing demand for water use;• protecting aquatic and associated ecosystems
and their biological diversity;• reducing and preventing pollution and
degradation of water resources;• meeting international obligations;• promoting dam safety;• managing floods and droughts.For achieving this purpose, the act will
establish suitable institutions and ensure that they have appropriate community, racial and gender representation.
ZimbabweIn 1995, the Government of Zimbabwe embarked on a comprehensive programme to reform the water sector. The review included the development of the Water Resources Management Strategy (ongoing),

Drought impact mitigation and prevention in the Limpopo River Basin106
the creation of the Zimbabwe National Water Authority (ZINWA) (GOZ, 1997), the repeal of the Water Act of 1976, and, the development of the new Water Act of 1998 (GOZ, 1998). Zimbabwe chose not to establish a water resources management policy document as such. Instead, the three components were developed simultaneously in order to ensure coherence between the water legislation and the water management strategy. The following documents were produced within the scope of the review:
• Guidelines on equitable and sustainable allocation of water between and among users and uses.
• Guidelines on water demand management and increased water use efficiency in all user sectors.
• Comprehensive water pricing policies and guidelines.
• Guidelines on catchment planning for the optimum development of catchments.
• Guidelines on environmental management for sustainable environmental protection and species preservation to include development of water quality guidelines for pollution control and monitoring.
• Guidelines on how best to involve stakeholders in water resources management.
• Mainstreaming of gender in water resources both spatially and temporary to enable a rapid assessment of availability in the event of a drought or some major development that would require water.
• Quantified interrelationships between people, land and water to provide for an integrated approach to planning for the development and use of water on a sustainable basis.
• Guidelines on economic and financial analysis for determining investment priorities in the water sector and to provide for the participation of the private sector in water resources development.
• New or re-defined legal and institutional frameworks to provide for the management of the resource and the settlement of disputes in the event of conflict at both the local and international level. The legal framework should be congruent with and conform to the international conventions on water as well as the SADC Protocol on Shared Watercourses.
The development of the above documents was completed in a three-year period guided by fundamental principles adopted from several
international conventions and declarations (e.g. Dublin Principles and Agenda 21). These principles include:
• Ownership of all surface water and groundwater is vested in the State. Except for primary purposes, any exploitation of water resources requires specific authority from the State. That authority should be given for a given specific economic period.
• Stakeholders should be involved in all important decision-making and management of water resources.
• Water resources should be managed on a catchment basis as rivers defy provincial and district boundaries.
• Development of water resources should be implemented on an environmentally sustainable basis.
• The skewed allocation and distribution of water must be redressed and the access to water by all Zimbabweans improved.
• Water prices should be based on the “user pays and polluter pays” principle and be socially acceptable to the different interest groups in the water sector.
• Water has an economic value in all its competing uses and should be recognized as an economic good. Managing water as an economic good is an important way of achieving efficient and equitable use, and of encouraging conservation and protection of water resources. An important corollary is that water authorities should be treated as commercial enterprises.
Zimbabwe National Water Act of 1998After independence, and with the frequency of droughts experienced in Zimbabwe, many experts and ordinary people alike called for a complete revision of the old Water Act of 1976, most notably, because this act failed to serve the interests of all Zimbabweans and to meet the needs of contemporary society.
One of the major areas of concern was access to water. The allocation of water rights under the Water Act of 1976 was based on the principle of “first come, first served”. The water rights were issued in perpetuity as long as they were being used beneficially. This provided an unfair advantage to those rights holders that were in a position to establish the first claim. In areas with water shortages, the act prevented newcomers from obtaining a share of the resource. The skewed

Chapter 3 – Social, economic and policy environment 107
distribution of land carried with it the skewed distribution of water as most communal people are settled in the drier parts of the country, such as the Limpopo River Basin. The demand for water rights for agricultural use increased especially after independence. However, the situation became particularly acute during periods of drought.
The Water Act of 1998 introduced a number of new features in the management and use of water resources. Its essential features include:
• The vesting of all water in the President, thus removing the concept of private ownership of water.
• Removing the concept of water rights as being issued in perpetuity, being attached to the land in respect of which they are granted. In place of this, a permit system was introduced, permitting the use of water for a specified period of time, subject to review as circumstances may demand.
• The removal of much of the differentiation in approach between the management of surface water and groundwater.
• The removal of the preferential rights to water held by riparian owners.
• The conferring on catchment councils, set up to manage the use of water in the catchment areas under their jurisdiction, of the power to issue the permits required for certain uses of water. Thus, this function is decentralized and removed from the administrative court, to which appeals may now be made under certain circumstances.
• Ensuring that catchment councils set up to manage river systems are representative of all water users in the area concerned, the intention being to involve people in communal and resettlement areas in water management.
• Introducing the ZINWA, established under the Zimbabwe National Water Authority Act of 1997.
The Water Act also introduces fees for applications for permits to use water and for the commercial use of water. There are also charges for the permission to discharge any effluent into streams or water bodies. Moreover, economic penalties have been introduced in respect of contravention of the act.
Zimbabwe National Water Authority (ZINWA)The Government of Zimbabwe formed the ZINWA in May 1994 to coordinate the functions of regional water authorities and those of the
Department of Water Resources, and to operate on commercial lines. It was considered that, in spite of the provisions of the Water Act, too much attention was given to the provision of water supplies with little effort being directed to planning and policy-making (GOZ, 1997). ZINWA would primarily be a water management and bulk raw-water-supplying parastatal. It would work closely with the catchment and subcatchment councils, involving a very high degree of stakeholder participation, whose functions would include assisting in catchment planning, environmental protection and water allocation. There would also be a commercialized engineering services section in ZINWA.
INSTITUTIONS AND SERVICESInstitutional, policy and service environments change constantly, particularly in young democracies. This section should to be viewed in that context.
SADC drought-related structures and servicesReadily available information is critical for the effective management of drought and for targeted mitigation measures to reduce vulnerability of households. Historically, early-warning systems were geared towards the biophysical aspects of agricultural production, especially climate events and abnormalities in rainfall amounts and patterns that may affect regional and national food security.
The SADC Food, Agriculture and Natural Resources SectorSince 1980, the 14-nation SADC has implemented a programme of action covering cooperation in various sectors including food security, and hence developed a food security strategy (FSS). The main objective of the FSS (SADC, 2003) is to ensure adequate food availability to meet the needs of individual households and the population of the region as a whole, and that the individual households have access to food. Over time, increasing emphasis has been placed on the demand side of the food security issue, focusing on household economies and vulnerable groups. The coordination of the Food Security Programme is the responsibility of the Food, Agriculture and Natural Resources (FANR) Directorate. The following principles underpin the Food Security Programme:

Drought impact mitigation and prevention in the Limpopo River Basin108
• The public sector should only finance or supply services that would otherwise be undersupplied by the private or not-for-profit sectors.
• Subsidiarity should apply (only do those things at the regional level that cannot be done at the national level).
• The important role of women should be reflected in planning and implementing the programme.
• Recognition of the multiplicity of stakeholders in the private and not-for-profit sectors as well as in the public sector.
• The economic and ecological diversity of the region requires that different food security strategies be implemented in different areas.
The scope of the Food Security Programme has widened over time and now encompasses issues of general economic development, trade, investment and poverty. This requires a clear understanding of intersectoral links and the promotion of policies to facilitate economic development rather than direct intervention in production and marketing. The following are strategic objectives of the FANR:
• Improved availability of food in the SADC region, including improvement in smallholders’ competitiveness, increased efficiency of use of natural resources and increased agricultural and intraregional trade.
• Improved access to food in the SADC region, including the generation of employment and a focus on small-scale agriculture with a comparative advantage, the improvement of income stability while maintaining economic efficiency, and the development of safety nets for vulnerable groups.
• Improved nutrition in the SADC region, including improved levels of food quality and nutrition for all members of the SADC society.
A major component of the Food Security Programme is the SADC Food Security and Rural Development Hub. This is a regional resource facility meant to act as a catalyst for rural development in member countries through capacity building and resource mobilization at local and regional level. The main activities of the hub include:
• assist national governments in rural development and agricultural strategy formulation, policy analysis and research, and programme preparation, implementation, monitoring and evaluation;
• support regional policy analysis networking in food, agriculture and natural resources and promoting regional integration in trade, investment phytosanitary regulations and programmes;
• support national and regional capacity building through training and fellowship programmes;
• support regional programmes for communication in development;
• support the agricultural potential information system (APIS).
Other FANR programmes and projects are mentioned below.
Regional FANR Coordination and Cooperation ProgrammeThis programme provides the core financial and technical support for the processes of cooperation within the SADC on all food security, agricultural development and natural resources development issues. FANR is responsible for implementing the food security programme as well as coordinating and providing direction to the cluster of sectors within the overall FANR sector. The main functions are developing sectoral policy and strategies and coordinating the activities of the overall cluster of FANR sectors.
Regional Information System for Food SecurityThe generation and exchange of information relating to all aspects of food security, ranging from information about policies through socio-economic data of economies to data concerning the nutrition of households is an essential prerequisite for decision-making across all the facets of the FANR sector. The main components of the programme are:
• Regional Early Warning System;• Regional Remote Sensing Component of the
Regional Early Warning System;• Regional Agricultural Potential Information
System;• Regional Food Security and Nutrition
Information System;• Regional Environmental Information System;• Regional Food Security Database Project,
including a market information component;• Famine Early Warning System (FEWS)
implemented in collaboration with the United States Agency for International Development (USAID) (see Figure 41 and Box 26);
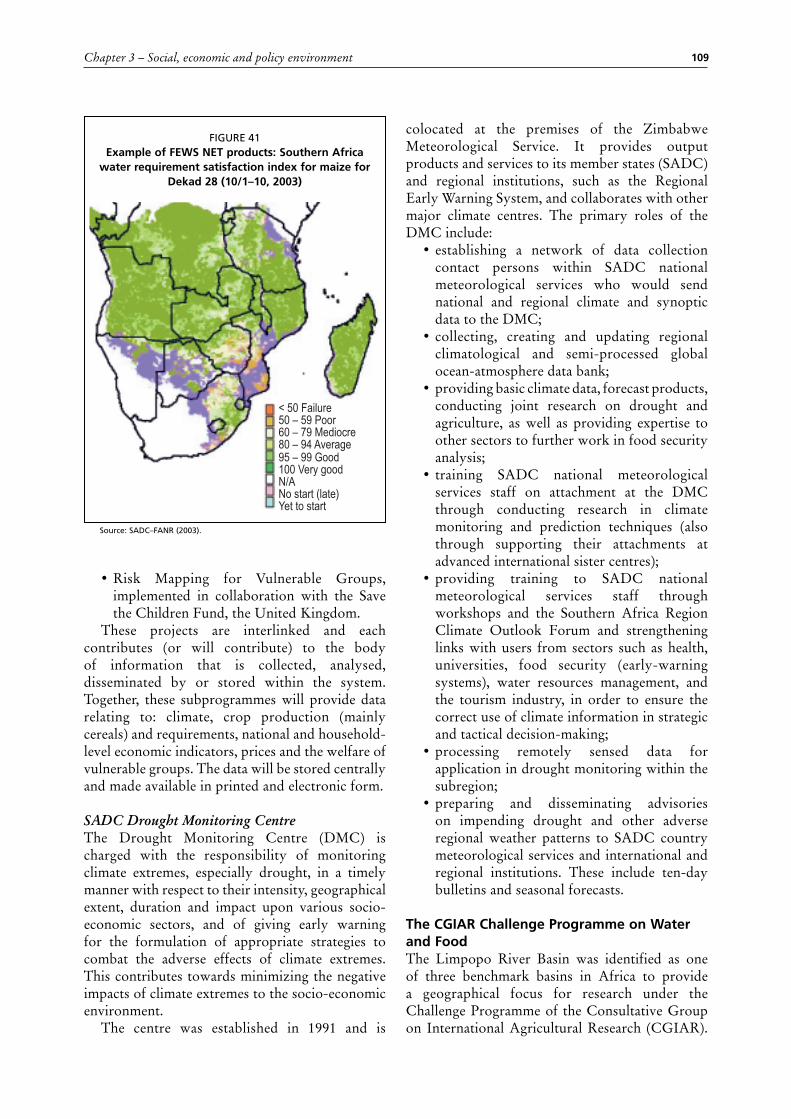
Chapter 3 – Social, economic and policy environment 109
• Risk Mapping for Vulnerable Groups, implemented in collaboration with the Save the Children Fund, the United Kingdom.
These projects are interlinked and each contributes (or will contribute) to the body of information that is collected, analysed, disseminated by or stored within the system. Together, these subprogrammes will provide data relating to: climate, crop production (mainly cereals) and requirements, national and household-level economic indicators, prices and the welfare of vulnerable groups. The data will be stored centrally and made available in printed and electronic form.
SADC Drought Monitoring CentreThe Drought Monitoring Centre (DMC) is charged with the responsibility of monitoring climate extremes, especially drought, in a timely manner with respect to their intensity, geographical extent, duration and impact upon various socio-economic sectors, and of giving early warning for the formulation of appropriate strategies to combat the adverse effects of climate extremes. This contributes towards minimizing the negative impacts of climate extremes to the socio-economic environment.
The centre was established in 1991 and is
colocated at the premises of the Zimbabwe Meteorological Service. It provides output products and services to its member states (SADC) and regional institutions, such as the Regional Early Warning System, and collaborates with other major climate centres. The primary roles of the DMC include:
• establishing a network of data collection contact persons within SADC national meteorological services who would send national and regional climate and synoptic data to the DMC;
• collecting, creating and updating regional climatological and semi-processed global ocean-atmosphere data bank;
• providing basic climate data, forecast products, conducting joint research on drought and agriculture, as well as providing expertise to other sectors to further work in food security analysis;
• training SADC national meteorological services staff on attachment at the DMC through conducting research in climate monitoring and prediction techniques (also through supporting their attachments at advanced international sister centres);
• providing training to SADC national meteorological services staff through workshops and the Southern Africa Region Climate Outlook Forum and strengthening links with users from sectors such as health, universities, food security (early-warning systems), water resources management, and the tourism industry, in order to ensure the correct use of climate information in strategic and tactical decision-making;
• processing remotely sensed data for application in drought monitoring within the subregion;
• preparing and disseminating advisories on impending drought and other adverse regional weather patterns to SADC country meteorological services and international and regional institutions. These include ten-day bulletins and seasonal forecasts.
The CGIAR Challenge Programme on Water and FoodThe Limpopo River Basin was identified as one of three benchmark basins in Africa to provide a geographical focus for research under the Challenge Programme of the Consultative Group on International Agricultural Research (CGIAR).
< 50 Failure50 – 59 Poor60 – 79 Mediocre80 – 94 Average95 – 99 Good100 Very goodN/ANo start (late)Yet to start
FIGURE 41Example of FEWS NET products: Southern Africa
water requirement satisfaction index for maize for Dekad 28 (10/1–10, 2003)
Source: SADC–FANR (2003).
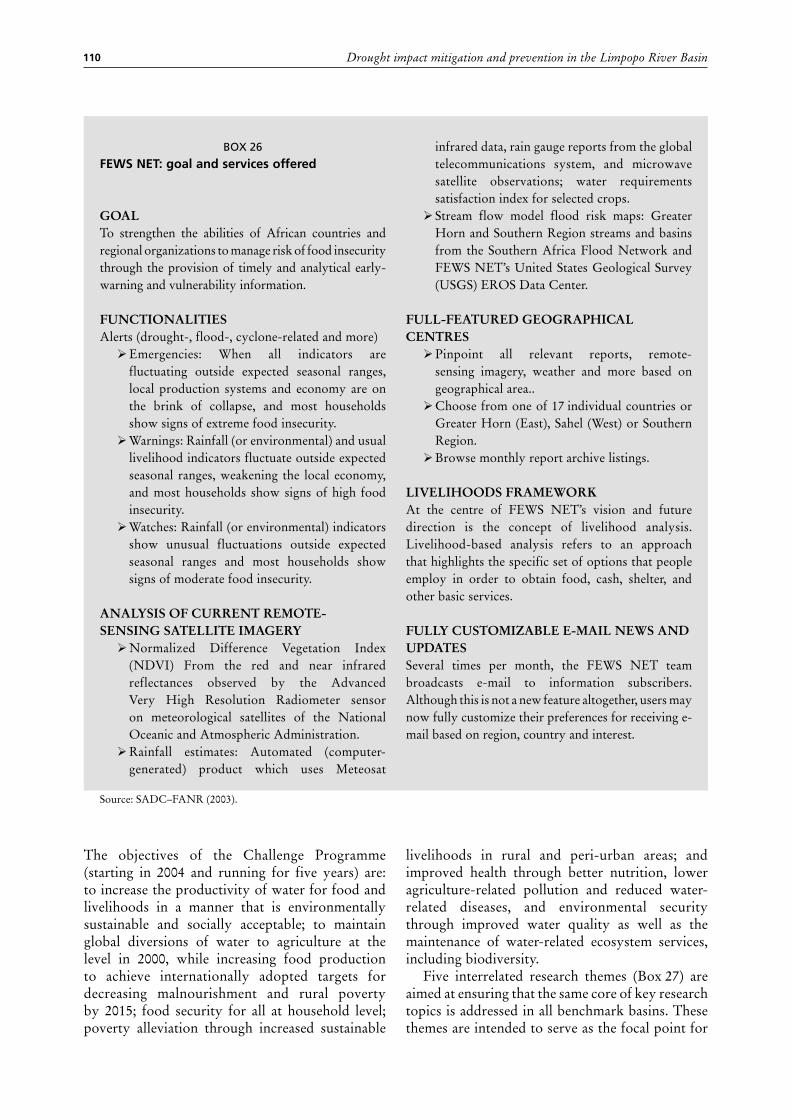
Drought impact mitigation and prevention in the Limpopo River Basin110
The objectives of the Challenge Programme (starting in 2004 and running for five years) are: to increase the productivity of water for food and livelihoods in a manner that is environmentally sustainable and socially acceptable; to maintain global diversions of water to agriculture at the level in 2000, while increasing food production to achieve internationally adopted targets for decreasing malnourishment and rural poverty by 2015; food security for all at household level; poverty alleviation through increased sustainable
livelihoods in rural and peri-urban areas; and improved health through better nutrition, lower agriculture-related pollution and reduced water-related diseases, and environmental security through improved water quality as well as the maintenance of water-related ecosystem services, including biodiversity.
Five interrelated research themes (Box 27) are aimed at ensuring that the same core of key research topics is addressed in all benchmark basins. These themes are intended to serve as the focal point for
BOX 26
FEWS NET: goal and services offered
GOALTo strengthen the abilities of African countries and regional organizations to manage risk of food insecurity through the provision of timely and analytical early-warning and vulnerability information.
FUNCTIONALITIESAlerts (drought-, flood-, cyclone-related and more)ÿ Emergencies: When all indicators are
fluctuating outside expected seasonal ranges, local production systems and economy are on the brink of collapse, and most households show signs of extreme food insecurity.ÿ Warnings: Rainfall (or environmental) and usual
livelihood indicators fluctuate outside expected seasonal ranges, weakening the local economy, and most households show signs of high food insecurity.ÿ Watches: Rainfall (or environmental) indicators
show unusual fluctuations outside expected seasonal ranges and most households show signs of moderate food insecurity.
ANALYSIS OF CURRENT REMOTE-SENSING SATELLITE IMAGERYÿ Normalized Difference Vegetation Index
(NDVI) From the red and near infrared reflectances observed by the Advanced Very High Resolution Radiometer sensor on meteorological satellites of the National Oceanic and Atmospheric Administration.ÿ Rainfall estimates: Automated (computer-
generated) product which uses Meteosat
infrared data, rain gauge reports from the global telecommunications system, and microwave satellite observations; water requirements satisfaction index for selected crops.ÿ Stream flow model flood risk maps: Greater
Horn and Southern Region streams and basins from the Southern Africa Flood Network and FEWS NET’s United States Geological Survey (USGS) EROS Data Center.
FULL-FEATURED GEOGRAPHICAL CENTRESÿ Pinpoint all relevant reports, remote-
sensing imagery, weather and more based on geographical area..ÿ Choose from one of 17 individual countries or
Greater Horn (East), Sahel (West) or Southern Region.ÿ Browse monthly report archive listings.
LIVELIHOODS FRAMEWORKAt the centre of FEWS NET’s vision and future direction is the concept of livelihood analysis. Livelihood-based analysis refers to an approach that highlights the specific set of options that people employ in order to obtain food, cash, shelter, and other basic services.
FULLY CUSTOMIZABLE E-MAIL NEWS AND UPDATESSeveral times per month, the FEWS NET team broadcasts e-mail to information subscribers. Although this is not a new feature altogether, users may now fully customize their preferences for receiving e-mail based on region, country and interest.
Source: SADC–FANR (2003).

Chapter 3 – Social, economic and policy environment 111
synthesizing results from the various countries and regions, and bring out generic conclusions from the overall research programme.
National institutionsBotswanaMinistry of Agriculture (MOA)MOA operates through the following departments:
• Department of Crop Production and Forestry, with responsibility for crop production, horticulture, plant protection, land use planning, soil conservation, forestry, range ecology, beekeeping, and for providing technical extension services.
• Department of Animal Health and Production, responsible for the prevention and control of animal diseases, the operation of the National Veterinary Laboratory, and for providing extension and advisory services to farmers.
• Department of Integrated Agricultural Research. Research focuses on the areas of crop and livestock improvement, sustainable utilization of range resources, soil and water management, optimizing utilization of locally
available animal feed resources, crop pests and disease management, and pasture and forage crop improvement.
• Department of Cooperatives. Cooperative societies in Botswana consist of producer cooperatives, consumer cooperatives, multipurpose cooperatives, marketing cooperatives, savings and credit cooperatives, and secondary cooperatives. The department continues to encourage the establishment and strengthening of all categories.
• Department of Ministry Management (provision of administrative support).
• Department of Agricultural Planning and Statistics.
• Division of Agricultural Information and Public Relations.
MOA launched the National Master Plan for Arable Agriculture and Dairy Development (NAMPAADD) in October 2002 (GOB–MOA, 2002). It aims at streamlining arable agriculture and dairy development programmes to address the following existing policy objectives: improvement in food security at both household and national levels; diversification of the agricultural production base; increased agricultural output and productivity; increased employment opportunities
BOX 27
CGIAR Challenge Programme research themes
THEME 1 – CROP WATER PRODUCTIVITY IMPROVEMENTÿ Plant-level perspective: Impact and future
directions of plant breeding.ÿ Crop and field-level perspective: New
opportunities for integrated natural resource management.ÿ Agro-ecological system perspective: Integrating
land and water management.ÿ Policies and institutions facilitating adoption of
improvements.
THEME 2 – MULTIPLE USE OF UPPER CATCHMENTSÿ Water, poverty and risk in upper catchments.ÿ Potential for improved water management.ÿ Enabling people to benefit from improved
management of land and water resources.
THEME 3 – AQUATIC ECOSYSTEMS AND FISHERIESÿ Policies, institutions and governance.ÿ Valuation of ecosystem goods and services, and
the cost of degradation.ÿ Environmental water requirements.ÿ Improving water productivity.
THEME 4 – INTEGRATED BASIN WATER MANAGEMENT SYSTEMSÿ Interactions and scales of analysis.ÿ Integrated decision-support tools.ÿ Good governance.
THEME 5 – THE GLOBAL AND NATIONAL FOOD AND WATER SYSTEMÿ Globalization, trade, macroeconomic and
sectoral policies.ÿ Investment and financing for agricultural water
development and water supply.ÿ Transboundary water policy and institutions.ÿ Global water cycle change.

Drought impact mitigation and prevention in the Limpopo River Basin112
for the fast growing labour force; provision of a secure and productive environment for agricultural producers; and conservation of scarce agricultural and land resources for future generations. The plan is to be implemented over a period of ten years. The first three years of implementation will include the establishment of pilot projects in areas of high production potential designated as priority areas in the master plan. The NAMPAADD will:
• target active traditional and commercial farmers, and thus enable traditional farmers to transform to commercial farming and assist commercial farmers to upgrade their technologies and management levels;
• encourage more involvement of the private sector and civil society in both farming and the provision of supporting services – this will promote and facilitate smart partnerships between investors and landowners and among farmers themselves;
• promote the establishment of agro-industries such as cotton gins, agroprocessing plants and other enterprises such as transportation to service the agriculture industry and create additional employment opportunities in rural areas;
• depart from the present welfare-oriented approach to a business approach to farming – instead of relying on grants and subsidies, farmers and other participating entrepreneurs will be encouraged to access finance from the Citizen Entrepreneurial Development Agency and other financial institutions;
• establish with private sector involvement a contributory insurance scheme to cover agricultural production losses in years and in specific regions declared as eligible for compensation (this is expected to be a confidence-building measure that will encourage investment in agriculture and improve access to credit);
• provide an enabling environment for agricultural production, including the development of infrastructure to and in production areas with high potential.
ParastatalsThe Botswana Meat Commission has a statutory monopoly over the export of beef, by-products, processed and canned meat, and live cattle. Therefore, it provides the major market for most producers. The Botswana Livestock Development Corporation acts as the public-sector buyer of
cattle in the remote areas of the country where buying demand is at its weakest. It also supplies quality breeding animals. The Botswana Vaccine Institute produces and supplies vaccines (including exports) and conducts research. The Botswana Agricultural Marketing Board buys products from farmers and sells inputs. The Botswana College of Agriculture, an associate institution of the University of Botswana, offers certificate, diploma, higher diploma and degree courses in agriculture, extension and related fields.
Other institutionsOther institutions include the National Development Bank of Botswana, the Botswana Development Corporation, cooperative societies, agricultural management associations, commercial banks, private cattle traders, and a range of NGOs. Other government departments with important roles as far as agriculture is concerned include the Ministry of Works, Transport and Communications (rural infrastructure), the Departments of Geological Surveys and Water Affairs in the Ministry of Minerals, Energy and Water Affairs (water and boreholes), and the Ministry of Local Government, Lands and Housing (land allocation). In the context of drought management, the National Early Warning Unit comprises representatives of different MOA departments and the Ministries of Works and Health in association with SADC structures.
Administrative structuresThe machinery of local government in Botswana reflects a long tradition of democratic consultation and devolved decision-making, and plays a crucial role in development processes, particularly in rural areas. There are four different types of local authorities:
• District and urban councils have stipulated functions by law and their responsibilities include provision of primary education, primary health care, tertiary and access roads and water supplies, as well as related issues such as sanitation, social and community development, the administration of self-help housing agencies, municipal abattoirs and markets.
• Tribal administration is composed of chiefs, subchiefs, headmen, administrative staff and the local police force. Apart from holding office in the traditional house of chiefs, the chiefs preside over customary courts that
Chapter 3 – Social, economic and policy environment 113
handle 85 percent of criminal cases and 90 percent of civil cases in Botswana. There are 361 customary courts and 2 courts of appeal. Chiefs also take care of the kgotla, an important traditional meeting place where cases are tried, information disseminated on government policies, and where public participation is encouraged. Elections to the village development committees are held at the kgotla every two years, and these committees coordinate development activities within districts.
• Tribal land boards, of which there are 11, have statutory powers to allocate tribal land for residential, commercial, industrial, arable and grazing use. Some 50 percent of the land board members are elected, the remaining members being appointed by the Minister of Local Government, Lands and Housing. The land boards, which may grant customary and common law land rights in accordance with the Tribal Land Act, hold tribal land in trust. They can also cancel land use rights and impose restrictions on land use.
• District administration in Botswana is divided into 10 administrative districts and 15 subdistricts, with 9 district councils. The larger districts are divided into subdistricts for ease of administration. A district commissioner coordinates the range of development activities carried out at district level by central government, local authorities and other agencies. The district commissioner chairs the district development committee, which is an advisory body that addresses development issues that affect the district. It is made up of senior representatives of central government, the district council, the land board, the tribal administration, parastatal and other government development agencies at the tribal level.
MozambiqueThe institutional environment in Mozambique underwent a process of revitalization after 1990, the year in which the new constitution was adopted. Foreign aid and advisors played a role in this process. Table 28 lists some of the prominent national institutions of relevance to basin issues.
International organizations in MozambiqueOwing to the severe economic plight of post-war Mozambique, the country has received aid
from many governments in the developed world and from international institutions. The attention was drawn to Mozambique of vast numbers of university departments from all over the developed world and many cooperative research projects were undertaken. International experts assisted with the development of structures and strategies for revitalized government departments. Major permanent foreign aid structures include the UN, USAID and World Bank.
The UN System in Mozambique (UN, 2003) comprises resident programme and/or funding agencies such as UNDP, United Nations Population Fund (UNFPA), United Nations Children’s Fund (UNICEF), and WFP, and specialized agencies, such as FAO, United Nations Educational, Scientific and Cultural Organization (UNESCO), and World Health Organization (WHO). In addition, non-resident UN agencies have participated in the preparation of the United Nations Development Assistance Framework (UNDAF). UNDAF is the principal country-level component of global UN reform to maximize goal-oriented development cooperation in support of Mozambique’s economic and social development. UNDAF enables the UN System in Mozambique, in collaboration with its partners, to harmonize development efforts and strive for programmatic coherence and mutual reinforcement. In addition, non-resident UN agencies plan activities under the umbrella of UNDAF, and are committed to the UNDAF principles of cooperation and coordination. While each agency has its own individual country programme based on its mandate, the heads of all resident UN agencies constitute the United Nations Country Management Team (UNCMT). The Bretton Woods Institutions, i.e. the World Bank and International Monetary Fund (IMF) are invited to participate in the UNCMT as partners, and the World Bank has collaborated in the formulation of the UNDAF and its implementation through their own instruments. The UNCMT is guided by a set of common goals, objectives, and coordination modalities. Progress towards these goals is monitored by a set of common core indicators that measure the contribution and impact of the UN System on national capacity and development.
In support of Mozambique’s Action Plan for the Reduction of Absolute Poverty (PARPA) to reduce poverty by one-third by 2010 and its commitments to international human rights

Drought impact mitigation and prevention in the Limpopo River Basin114
instruments, the UN System in Mozambique seeks to empower all Mozambicans – independent of gender, race, age, religion, political affiliation, and economic or social status – to participate in and gain from the development process in an equitable manner. Box 28 details UN involvement in relief work during the 2001 floods.
In 2003, the USAID programme focused on increased rural household income, effective democratic governance, increased use of essential maternal/child health and family planning services, and an enabling environment for private sector-led growth and development. USAID field activities targeted the most populous and high-potential areas of the country, i.e. the provinces of Manica, Nampula, Sofala and Zambezia, which are outside the Limpopo River Basin (USAID, 2003).
Mozambique joined the World Bank Group in 1984. Beginning with a credit from the World Bank’s International Development Association
for rehabilitation in 1985, the portfolio comprises 21 active projects with commitments of US$1 100 million in all major sectors in 2003.
The World Bank and other donors fully endorse Mozambique’s poverty reduction agenda defined in the Poverty Reduction Strategy Paper (PRSP), in Mozambique also called the PARPA, which was presented to the World Bank and the IMF boards in 2001. The PRSP was subsequently updated in the first PRSP Progress Report of February 2003.
The PRSP/PARPA was developed through a participatory process. The key objective is the reduction of absolute poverty, and it identifies the following fundamental action areas: education, health, agriculture and rural development, infrastructure, good governance, and macroeconomic and financial management. Other areas of action as identified in the PRSP/PARPA include: employment and business development, social action, housing, fisheries, tourism,
TABLE 28Some of the prominent national institutions in Mozambique
Ministry Institution Functions
Agriculture and Rural Development
National Directorate of Forestry and Wildlife
Forestry and wildlife administration, research, economics and development
Agricultural Market Information System
Agricultural marketing
Early Warning Department Inter alia, crop estimates
National Directorate of Livestock Inter alia, disease outbreak management (Newcastle disease, African swine fever, ticks and tick-borne diseases, and trypanosomiasis)
National Directorate of Agriculture
Provincial directorates of agriculture
National Directorate of Rural Extension
Agricultural extension
Unit of Agriculture Emergency Coordination (UCEA)
Coordination of flood relief in coordination with UN agencies
Cotton Institute
Agriculture Sector Public Expenditure Programme
Sustainable and equitable growth in the agriculture sector; reducing poverty and improve household food security; and protecting the physical and social environment
Public Works and Housing National Directorate of Water Rural and urban water policies and their implementation; strategic and integrated planning; international rivers; and provision of water supplies and sanitation services
Transportation and communication
National Institute of Meteorology
Meteorological data collection, databases and information dissemination
Environmental Action Coordination
Biological inventories and conservation
Higher Education, Science and Technology
National Institute for Agronomic Research
Agricultural and natural resources research
Fisheries Regulation and administration of fisheries industry; semi-industrial fisheries; artisanal fisheries; small-scale fisheries; fish processing; and information and training
Health Health strategies; integrated provincial planning; province-based support programmes; donor pooling arrangements; subsector programmes and strategies; and information systems
Tourism Policies, strategies and action plans for promoting the tourism industry, which is to be driven essentially by private sector initiatives
Women and Social Action Coordination
Provincial directorates People with disability; women’s rights, and children

Chapter 3 – Social, economic and policy environment 115
BOX 28
UN initiatives for minimizing the impact of water disasters during the 2001 floods in Mozambique
OFFICE FOR THE COORDINATION OF HUMANITARIAN AFFAIRS (OCHA)ÿ Created a web site for the Mozambique floods, set
up a financial tracking page for donations and issued regular situation reports.
ÿ With the Office of the Resident Coordinator, established the Emergency Coordination Unit, comprised of internationally and locally recruited emergency specialists and the United Nations Volunteers (UNV) who were placed with provincial teams in Beira, Quelimane, Chimoio, Tete and Maputo, and as coordinators for the data/information, communications, and public relations/media UN emergency clusters.
ÿ In collaboration with the United Nations Disaster Management Team (UNDMT), the Office of the Resident Coordinator provided daily situation reports, mapping, emergency cluster meetings, daily updated website with weather, river and dam levels, UNDMT member reports, cyclone tracking, situation reports, reporting to donors and government, etc.
WORLD FOOD PROGRAMME (WFP)ÿ Acted as the lead UN agency coordinating the UN
Logistics Cluster and, thus, giving direct support to the UN family, especially UNICEF and FAO by facilitating warehousing and shipment of food and non-food items including medicines, water and sanitation supplies, and seeds and tools, as well as assisting partners with office space, equipment and staff support.
ÿ WFP and UNICEF headed the UN Assessment Cluster’s formulation and piloting of emergency data gathering instruments in close consultation with OCHA, USAID, the United Kingdom’s Department for International Development (DFID) and NGOs.
ÿ Provided staff to set up a Joint Logistics Coordination Centre (JLOC) in Beira, the capital of Sofala Province and the centre of coordination for the humanitarian programme. At its peak, the JLOC was operating with 20 aircrafts. WFP managed the fleet and contributed US$2.5 million for air operations until
the end of April. WFP also hired barges and boats to transport beans, rice and high-energy biscuits for Beira, Quelimane, Mutarara, Marromeu, Chinde and other locations to supplement stocks.
ÿ Established the first requirements for field communications for the UN System and partners including installation of repeaters, e-mail, HF radio installations, and emergency hub and travel linkages on common frequencies. The OCHA Communications Coordinator then worked with WFP and UNDP to ensure proper installation, maintenance, and information to partners, including the INGC.
ÿ Established a technical working group on food requirements to arrive at a consolidated picture of food needs. Technical working groups were formed in the Ministries of Health, Education, Public Works and Housing. Government, UN agencies, and donors led these groups, and NGOs took part together.
ÿ WFP fed some 230 000 displaced persons in 65 temporary accommodation centres in the four affected provinces. By the end of May, about 8 000 tonnes of mixed food commodities had been distributed by ten different implementing partners.
UNITED NATIONS CHILDREN’S FUND (UNICEF)
ÿ Coordinated the UN family’s assessment and response in the area of water and sanitation and was asked by the government in late March to provide overall coordination of the sector.
ÿ Led the UN Education Cluster and was a joint coordinator of the Assessment Cluster with WFP and OCHA. In addition, was a member of the Logistics, Shelter and Public Information Clusters.
ÿ Assisted WHO to coordinate the UN Health Cluster.
ÿ In collaboration with WFP, formulated and piloted needs assessment forms for emergency data gathering and analysis.
ÿ Provided emergency staff as part of Sofala and Zambezia UN team operations.
ÿ Provided malaria drugs sufficient to treat 1 million people, and sent teams into the field in the affected areas to conduct public awareness campaigns on health and hygiene.
(Continued)
Source: SARPN (2004).

Drought impact mitigation and prevention in the Limpopo River Basin116
ÿ Provided support to the Ministry of Health for campaigns to control measles and meningitis through vaccinations and for vitamin-A supplements and helped with training government health staff in the provinces of Zambezia, Sofala and Tete in the prevention and case management of diarrhoea and cholera.
ÿ Supported the provision of clean water in the temporary accommodation centres, by supplying water treatment equipment, bladders, tap stands and chlorine.
ÿ Through partner NGOs, distributed jerry cans, buckets and soap, as well as 32 000 latrine slabs and plastic sheeting for shelter. About 11 000 latrines were installed, benefiting 220 000 people.
ÿ NGO activists were trained in hygiene promotion in the accommodation centres.
ÿ Supported nutritional surveys, and subsequent preparation of a 4-month blanket supplementary feeding programme to cover 66 000 people, including children (6 months to 5 years), pregnant women and nursing mothers. Technical and financial assistance provided to implement the programme.
ÿ Supported a social marketing campaign to promote the use of insecticide treated bed nets, 45 000 of which were procured for distribution to the accommodation centres.
ÿ To assist children return to school as quickly as possible, UNICEF (through the Save the Children Fund) supported the Ministry of Education to distribute school kits (60 294) and writing boards, as well as family kits to affected teachers.
ÿ Supplied 60 tents to the Ministry of Education for use as temporary classrooms in accommodation centres and where school buildings were destroyed.
ÿ Telecommunications and logistics support for UN and government partners.
FAOÿ Funded by the OCHA, FAO assisted the Ministry
of Agriculture and Rural Development’s Emergency Coordination Unit (UCEA), which is set to become a permanent structure.
ÿ With FAO technical support, the UCEA prepared weekly updates of numbers of affected families and areas lost as a result of permanent field assessments.
ÿ FAO and the Ministry of Agriculture and Rural Development (MARD) called for a donor meeting in early March with the objective of funding agricultural kits to be provided to affected families.
The meeting was successful and total coverage for the number of affected farming families was obtained.
ÿ Up to 80 000 households benefited from the distribution of seeds and tools to plant a second season crop. FAO provided agricultural kits for 30 500 households, with funds from Italy. The kits were distributed by various NGOs based in the affected districts of the provinces of Tete, Manica, Sofala and Zambezia in coordination with local authorities.
UNITED NATIONS VOLUNTEERS (UNV)ÿ Recruited four volunteers each for OCHA and
WFP, as well as seconding many others to tasks in the emergency relief operations.
ÿ Provided equipment and logistics support to start the coordination centre in Beira.
ÿ Funding volunteers to work with the Mozambique Red Cross in the temporary accommodation centres.
WORLD HEALTH ORGANIZATION (WHO)ÿ Coordinated the UN Health Cluster.ÿ Provided technical specialists for malaria, cholera,
and malnutrition assessments and action planning in collaboration with UNICEF ensuring that sufficient medicines were made available in country. Provided US$83 420 of additional assistance for medicine kits and supported operational costs of the assessments.
ÿ Provided insecticides for shelter spraying in the accommodation centres.
ÿ Supported action plan for emergency diseases of Ministry of Health.
ÿ UN health focal point in the INGC health technical committee.
UNITED NATIONS DEVELOPMENT PROGRAMME (UNDP)
ÿ Coordinated the UN Cluster for Shelter, partnering with the Mozambican Red Cross and the Ministry of Public Works.
ÿ Seconded staff to serve as food, communications, and coordination emergency staff for WFP and OCHA.
ÿ Supported the UNV office to ensure quick and appropriate UNV selection, secondment and placement through a grant of US$100 000.
ÿ Ensured vehicle and equipment secondment and pooling for immediate emergency response needs.

Chapter 3 – Social, economic and policy environment 117
processing industry, transport and communication, technology, environment, and reduction of vulnerability to natural disasters.
One of the key challenges in achieving sustainable improvements in poverty indicators derives from the rising numbers of HIV infections. Aside from its direct impact on poverty-related indicators, this will also have severe consequences for the productive labour force and, hence, for growth. Multicountry evidence suggests that at HIV prevalence rates of 15 percent, GDP growth per capita is reduced by about 0.8 percent. Therefore, Mozambique is vulnerable to substantive reversals of its development process. Action is needed now at all levels of society in order to control the spread of HIV.
Other key constraints on the implementation of the PRSP/PARPA reform programmes include: the increasing disparity between a booming mega-projects sector and a small and medium-sized enterprise sector that the business environment does not adequately support; corruption, particularly in the financial sector; and a weak banking sector.
South AfricaConsiderable transformation has taken place in the institutional environment since the change to a representative government in 1994. In the new dispensation, a relatively large spectrum of functions is delegated to the provincial and municipal levels. For the first time, all land has come under the jurisdiction of municipalities. The Department of Land Affairs was constituted to regulate inter alia issues of land reform (land claims, land redistribution and making state land available to communities). Probably the most important change of all was the abolition of all racial restrictions on land ownership.
Table 29 lists prominent South African institutions with direct relevance to basin issues. It does not list a large number of institutions with indirect relevance, e.g. universities in other provinces that draw students inter alia from the basin area. Of the institutions listed, only those branches and functions with relevance to the basin are indicated.
ZimbabweTable 30 lists key Zimbabwean institutions relevant to land-related issues.
International agenciesLand-related non-SADC international agencies operating in Zimbabwe include the African Centre
for Fertilizer Development (ACFD), ICRISAT, and the International Livestock Centre for Africa (ILCA).
ACFD is a non-profit, autonomous international centre of the Organization for African Unity, governed by a board of directors and recognized as an international agency by the Government of Zimbabwe. It aims at stimulating the production and use of fertilizers. It operates in terms of a technical cooperation agreement with the International Fertilizer Development Centre (the United States of America). ACFD consists of two technical divisions, one for research and development and one for technology transfer. The programmes of ACFD are: land resource management, policy analysis, resource development and utilization, marketing services, human resource development, information services and engineering advisory services.
The heads of government of the SADC countries requested ICRISAT to establish a regional sorghum and millet research programme for southern Africa. An agreement for initiating the sorghum and millet improvement programmes, funded by the USAID, the GTZ and the Canadian International Development Agency (CIDA), was signed in September 1983 and the programme centre was established at Matopos near Bulawayo in Zimbabwe. In 1999, ICRISAT expanded its work and staff in the region under a new agreement with the Government of Zimbabwe. Work continued to be headquartered in Zimbabwe and conducted on a regional basis. ICRISAT consists of: Programme Director’s Office, Site Leader’s Office, Administrative Unit, Crop Improvement Unit, Natural Resource Management Unit, and the Farm and Physical Plant Services.
The ILCA is one of 17 international agricultural research centres financed through the CGIAR, an informal association of countries, international organizations, and private institutions. The mandate of the ILCA is to assist the efforts of countries in tropical Africa to increase the sustained yield and output of livestock products and to improve the quality of life of the people in the region. Its research structure concentrates on the three most important ruminant species in Africa: cattle, sheep and goats.
Major donors, such as DFID and USAID, have limited or no development programmes in Zimbabwe.

Drought impact mitigation and prevention in the Limpopo River Basin118
TABLE 29South African institutional environmentInstitution Branch Functions
Department of Agriculture #
Farmer support and development
Agricultural risk management
Farmer settlement
Agricultural finance and cooperative development
Food security and rural development
Trade and business development
Domestic marketing
International trade
Business and entrepreneurial development
Sustainable resources use and management
Water use and irrigation development
Land use and soil management
Scientific research and development
Agricultural productionAnimal and aqua production
Plant production
Communication, planning and information management
Education and training
Agricultural information services
International relations
Limpopo Provincial Government
Department of Agriculture and Environment
Land redistribution; land use planning; resource conservation; control of pests and noxious weeds; infrastructure; policy development; empowering small emerging farmers; agricultural statistics
Department of Finance, Economic Affairs, Tourism and Environment
Trade and industry; tourism; economic planning, research and policy
Department of Health and WelfareDistrict health systems; social welfare programmes; poverty alleviation
North West Provincial Government
Department of Agriculture, Conservation and Environment
Sustainable natural resource management
Gauteng Provincial Government
Department of Agriculture, Conservation, Environment and Land Affairs
Sustainable agriculture; household food security; farmer settlement and support; commercial farming; resource conservation and development
Agricultural Research Council
Horticulture:
Institute for Tropical and Subtropical Crops;
Roodeplaat Vegetable and Ornamental Plant Institute
Research and technology exchange on all aspects of the cultivation of tropical and subtropical crops, potatoes, vegetables, hydroponic production, indigenous vegetables and indigenous flowers
Grain and industrial crops:
Grain Crops Institute;
Small Grain Institute
Institute for Industrial Crops
Research and technology exchange on all aspects of the cultivation of grain and industrial crops (maize, sunflower, dry beans, sorghum, groundnut, soybeans, cowpeas, millets, lupins, bambara, cotton, tobacco, hemp, flax, sisal, kenaf and indigenous fibre crops). Included are: cultivar evaluation, plant breeding, improvement of crop quality, weed control, tillage, plant nutrition, water utilization, plant pathology, entomology and nematology.
Livestock:
Animal Improvement Institute;
Animal Nutrition and Products Institute;
Range and Forage Institute;
Onderstepoort Veterinary Institute
Sustainable animal resource conservation and utilization; livestock production for global competitiveness; livestock-based technology transfer and dissemination; maintenance of animal improvement schemes and gene, data and DNA banks; waste and effluent management; probiotics and culture management; product technology and sensory analysis services to the food and beverage industries; food safety and hygiene; laboratory diagnosis of animal diseases; production of vaccine against foot and mouth disease (FMD); research into various aspects of FMD and African swine fever, particularly their epi-zootiologies; other highly communicable diseases; training of veterinarians and laboratory workers in the recognition of dangerous epizootic diseases and in laboratory techniques; sustainable utilization of rangeland, pasture and livestock resources; sustainable improvement of animal products (meat, dairy and fibre)
Public support services:
Institute for Soil, Climate and Water;
Institute for Agricultural Engineering;
Plant Protection Research Institute
Characterization of soil resources; natural resources monitoring, auditing and impact assessment (climate stations and data bank); sustainable natural resources use and management; information technology; sustainable rural livelihoods; development and application of engineering technology for sustainable utilization and development of resources; protection, and reclamation of deteriorated natural resources; development of human resources in agricultural engineering technology; biosystematic services (national collections of insects, arachnids, nematodes and fungi); agricultural biodiversity information systems; integrated pest management in crops, plantations and stored products; plant pathology research and services; weeds and alien invaders; beneficial organisms

Chapter 3 – Social, economic and policy environment 119
Institution Branch Functions
Department of Land Affairs
Restitution
Promoting equity for victims of dispossession by the State, particularly the landless and the rural poor; facilitating development initiatives by bringing together all stakeholders relevant to land claims; promoting reconciliation through the restitution process; contributing towards an equitable redistribution of land rights; farmer settlement; commonages; equity schemes; non-agricultural enterprises
Land tenure reform and support services State land policy and administration
Department of Water Affairs and Forestry
Policy and regulation
Water resources planning and management; policy formulation; international projects; geohydrology; hydrology; catchment management; water conservation; water quality management; water utilization; Working for Water ##
OperationSanitation management; commercial and community forestry; indigenous forests; water development (construction).
Water Research Commission
Water resource managementSustainable water resource management; balancing the competing demands of domestic needs, agriculture, industry and the environment
Water-linked ecosystems Sustainable utilization of the aquatic environment and biota
Water use and waste managementManagement of waste and other water-polluting products; integrated solutions
Water utilization in agricultureEfficient use of water for production of food, fibre, fuelwood and timber; water efficient production technologies, models and information systems
Water-centred knowledge Knowledge-sharing and dissemination
Department of Environmental Affairs and Tourism
Environmental management
Systems of environmental monitoring and reporting; environmental management and planning; environmental education and capacity building; environmental legislation and implementation; environmental conflict management and conciliation; preventing and/or limiting pollution and environmental degradation
Tourism Conditions conducive to tourism growth and development
Biodiversity and conservationConservation of biodiversity; transfrontier conservation areas; protected areas
Department of Health
Health service deliveryHospital services; disease prevention and control; non-personal health services; health and welfare
Strategic health programmesHealth information evaluation and research; medicines regulatory affairs; pharmaceutical services; district health systems; HIV/AIDS; maternal, child and women’s health
Department of Education
Higher education Development and regulation of the higher education system
University of the NorthAgricultural and environmental sciences; health sciences; computational and mathematical sciences; molecular and life sciences; physical and mineral sciences.
University of PretoriaNatural and agricultural sciences; veterinary science; humanities; health
University of South Africa (distance education institution)
Geography and environmental studies; information science; agricultural management; animal health; horticulture; nature conservation; tourism management; water care
University of the North West Agriculture, science and technology; human and social sciences
Tswane University of Technology
Agricultural management; animal production; nature conservation; horticulture; tourism management; biotechnology and food technology; environmental sciences; food and hospitality management; water care
Lowveldt Agricultural College
Specializes in agronomy and horticulture (tobacco, cotton, sugar cane, drybean production, vegetable, subtropical fruit and citrus under irrigation); supporting subjects are soil science, irrigation, plant propagation, computer practices, plant protection, botany, agricultural engineering and farm management. In addition to the diploma course, special and short courses are offered
# The National Department is primarily responsible for policy and issues of national implications. The provincial departments are charged with implementation.
## The Working for Water programme was launched in 1995 in an effort to tackle the problem of invading alien plants and unemployment. It is a multidepartmental initiative led by the Departments of Water Affairs and Forestry, Environmental Affairs and Tourism and Agriculture. With 300 projects throughout the country, the programme aims to enhance water security, improve ecological integrity, restore the productive potential of land, promote sustainable use of natural resources, and invest in the most marginalized sectors of South African society.
TABLE 29South African institutional environment (continued)

Drought impact mitigation and prevention in the Limpopo River Basin120
TABLE 30Zimbabwe institutional environment
Ministry Institution Functions
Ministry of Lands, Agriculture and Rural Resettlement
Agriculture, Technical and Extension Service (AGRITEX)
Agricultural extension, land use planning, soil and water conservation; irrigation development.
Land acquisition and rural resettlement Land resettlement
Department of Research and Specialist Services Agricultural research
Department of Water Resources and Development Water resources management
Department of Livestock and Veterinary Services
Prevention, control and eradication of animal diseases and pests affecting livestock production and development
Ministry of Environment and Tourism
National Climate Committee National focal point for the UN Framework Convention on Climate Change
Department of National Parks and Wildlife Management
Management of parks and wildlife lands; use of indigenous plants and animals
Department of Natural Resources Matters pertaining to natural resources, excluding minerals; environmentally sustainable development
Natural Resources Board Custodian of the natural resources in Zimbabwe
Forestry Commission All aspects of forestry: afforestation; protection of indigenous woodlands, advisory and extension services
Zimbabwe Tourist Development Cooperation Promoting Zimbabwe as a tourist destination
Ministry of Energy and Water Resources and Development
Department of Water Development Development of water resources; construction of dams, irrigation systems, water supply schemes; drilling of boreholes and wells
Zimbabwe National Water Authority (ZINWA)
Office of the President Research Council of Zimbabwe Science and technology for development
Ministry of Health and Child Welfare National AIDA coordination programme Health services
Ministry of Local Government, Urban and Rural Development
Urban councils
Rural district councils
Ward development committees
Village development committees
Lead organization in smallholder irrigation development; Rural Water Supply and Sanitation Programme; supervisory role over local government
Ministry of Transport and Communications Department of Meteorological Services Monitoring and interpretation of regional climate systems
Parastatals and government stakeholder institutions
University of Zimbabwe General academic training, including agriculture
Zimbabwe Open University Distance teaching, including environmental science
Agricultural and Rural Development Authority (ARDA)
Agricultural and rural development on behalf of government
Regional Water Authority Managing the water resources infrastructures in the irrigated lands of southeastern lowveldt
Pig Industry Board Research and development; genetic improvement; advisory services; training programmes
Southern African Regional Institute for Policy Studies
Policy issues and public concerns, particularly in the areas of regional cooperation and integration, international cooperation, gender relations, social and public policy development technology and environment and economic policy
Tobacco Research Board Research and investigative work in connection with both small- and large-scale production of tobacco
Private Agricultural Research TrustCommercial food crop and horticultural research; facilities for contract research to the government, the university and to private agribusinesses