CHAPTER 3 MATERIALS AND METHODS 3.1.1...
20
Materials and Methods 83 CHAPTER 3 MATERIALS AND METHODS 3.1. Fungal growth studies 3.1.1 Fungus and fungal culture The fungus (Fusarium oxysporum NCIM No. 1072) was obtained from National Collection of Industrial Microorganisms (NCIM), National Chemical Laboratory, Pune. The culture of fungus was maintained in petri plates on potato dextrose agar (PDA) medium. The PDA medium was obtained from Hi Media laboratories. Kanamycin was used as an antimicrobial agent. All stock cultures were maintained on PDA slants and subcultured. The slants were incubated at 25°C for 7 days and then stored at 4°C.
Transcript of CHAPTER 3 MATERIALS AND METHODS 3.1.1...

Materials and Methods
83
CHAPTER 3
MATERIALS AND METHODS
3.1. Fungal growth studies
3.1.1 Fungus and fungal culture
The fungus (Fusarium oxysporum NCIM No. 1072) was obtained
from National Collection of Industrial Microorganisms (NCIM), National
Chemical Laboratory, Pune. The culture of fungus was maintained in
petri plates on potato dextrose agar (PDA) medium. The PDA medium
was obtained from Hi Media laboratories. Kanamycin was used as an
antimicrobial agent. All stock cultures were maintained on PDA slants
and subcultured. The slants were incubated at 25°C for 7 days and then
stored at 4°C.

Materials and Methods
84
3.1.2 Inoculum preparation
A part of the fungal colony was then transferred into the potato
dextrose broth (PDB) by aseptically punching out 5 mm of the agar plate
culture with a cutter. A shake flask culture was carried out in 250-ml
flasks containing 50 ml of the medium at 130 rpm and incubated at room
temperature over a period of time. The inoculum was periodically tested
at every 24 hours for various growth parameters as provided below.
3.1.3 Dry weight of the fungus/ Biomass production
The fungal mycelium was harvested after every 24 hours of growth,
separated from the culture liquid by filtration through a Whatman No. 1
filter paper. The mycelial pellet was repeatedly washed with distilled
water and dried at 70°C overnight. The dry weight of the fungus was
calculated by using the following formula:
Dry weight = (weight of filter paper + mycelium) - (weight of filter paper)
The standard curve was prepared using the data collected above.
3.1.4 Glucose utilization
Glucose utilization was periodically measured using the DNS
reagent method as suggested by Miller (1959). Glucose estimation was
carried out in the culture filtrate (media) at different time interval
spectrophotometrically at 540 nm by measuring the reduction of DNS
(Dinitrosalicylic acid). 3 ml of DNS was added to 1 ml of diluted sample,
Materials and Methods
85
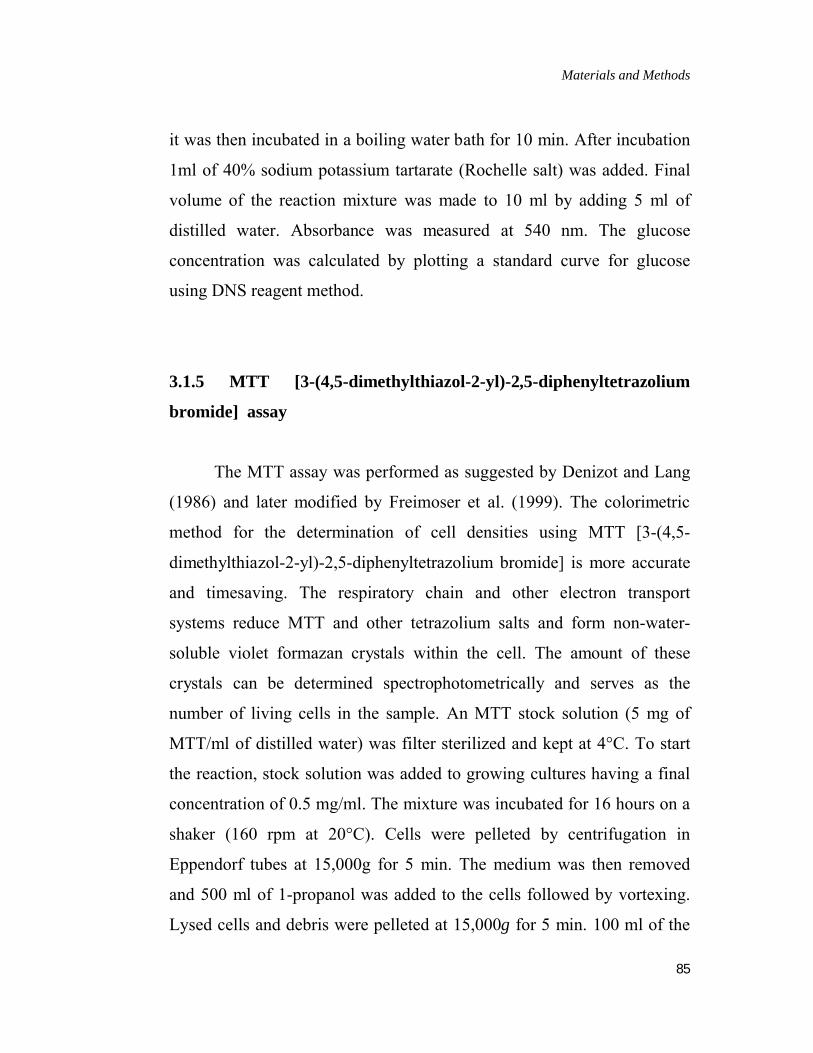
it was then incubated in a boiling water bath for 10 min. After incubation
1ml of 40% sodium potassium tartarate (Rochelle salt) was added. Final
volume of the reaction mixture was made to 10 ml by adding 5 ml of
distilled water. Absorbance was measured at 540 nm. The glucose
concentration was calculated by plotting a standard curve for glucose
using DNS reagent method.
3.1.5 MTT [3-(4,5-dimethylthiazol-2-yl)-2,5-diphenyltetrazolium
bromide] assay
The MTT assay was performed as suggested by Denizot and Lang
(1986) and later modified by Freimoser et al. (1999). The colorimetric
method for the determination of cell densities using MTT [3-(4,5-
dimethylthiazol-2-yl)-2,5-diphenyltetrazolium bromide] is more accurate
and timesaving. The respiratory chain and other electron transport
systems reduce MTT and other tetrazolium salts and form non-water-
soluble violet formazan crystals within the cell. The amount of these
crystals can be determined spectrophotometrically and serves as the
number of living cells in the sample. An MTT stock solution (5 mg of
MTT/ml of distilled water) was filter sterilized and kept at 4°C. To start
the reaction, stock solution was added to growing cultures having a final
concentration of 0.5 mg/ml. The mixture was incubated for 16 hours on a
shaker (160 rpm at 20°C). Cells were pelleted by centrifugation in
Eppendorf tubes at 15,000g for 5 min. The medium was then removed
and 500 ml of 1-propanol was added to the cells followed by vortexing.
Lysed cells and debris were pelleted at 15,000g for 5 min. 100 ml of the

Materials and Methods
86
supernatant was transferred into a 96-well plate. The optical density (OD)
was measured with the spectrophotometer at 560 nm. A blank with
propanol alone was measured and subtracted from all values.
3.1.6 pH variation over time
The pH of the culture filtrate was taken at every 24 hours using a
pH meter. A standard curve was prepared for the pH of culture filtrate
over time.
3.1.7 Protein estimation
Total protein contents in the pellet and supernatant were
determined by the method of Lowry et al. (1951) using bovine serum
albumin (BSA) as standard. The fungal mycelia present in the PD broth
were centrifuged at 5000 rpm at 4oC for 10 min. The supernatant was
taken for protein estimation by the method proposed by Lowry et al.
(1951). The pellet was thoroughly washed and suspended in a mixture of
100mM TRIS (pH 6.8) and 30 μl 1% Triton X 100. The fungal cells were
harvested by centrifugation at 10,000 rpm for 10 min at 4oC. The pellet
was discarded and the supernatant taken for protein estimation of the
pellet.

Materials and Methods
87
3.2 Production of silver nanoparticles
Two types of experiments were conducted parallel in duplicate: one
with the washed fungal mycelium and other with the growth medium of
the fungus in which it was harvested. The biomass of F. oxysporum was
prepared by growing the fungus in a liquid medium (potato dextrose
broth). The flasks were inoculated and put on orbital shaker at 25oC and
agitated at 120 rpm for 72 h. The biomass was harvested after complete
incubation by filtering through filter paper followed by repeated washing
with distilled water to remove any medium component from the biomass.
The fungus was then brought in contact with 100 ml of sterilized double
distilled water for 24 h at 25oC in a 250 ml Erlenmeyer flask and agitated
again at 120 rpm. After the incubation, the cell filtrate was obtained by
passing it through Whatman filter paper No. 1. The silver nanoparticles
were produced by the following two methods
(i) The washed mycelium was challenged with 100 ml of 1 mM silver
nitrate (AgNO3) solution (prepared in deionized water) and incubated in
shaker at 200 rpm in dark condition at 37°C. Simultaneously, a positive
control of incubating the fungus mycelium with deionized water and a
negative control containing only silver nitrate solution were maintained
under same conditions.
(ii) The filtrate was treated with aqueous 1 mM silver nitrate (AgNO3)
solution in an Erlenmeyer flask and incubated at room temperature.

Materials and Methods
88
3.3 Detection and characterization of silver nanoparticles
The characterization of silver nanoparticles was carried out by
different instruments and techniques. It included visual observation,
scanning electron microscopy (SEM) and transmission electron
microscopy (TEM) analysis.
3.3.1 Detection of silver nanoparticles
The preliminary detection of the formation of silver nanoparticles
was carried out by observing the colour change of the cell filtrate after
treatment with silver nitrate solution (1 mM).
3.3.1.1 Scanning electron microscope (SEM) analysis
SEM was used to obtain images of silver nanoparticle. The first
step involved dehydration of the material utilizing the principal of critical
point drying (CPD). Processing of CPD was initiated by cleaning the
surface of sample with ethanol. Further fixation of the sample was carried
out in gluteraldehyde at room temperature for 24 hrs. After fixation,
dehydration of sample with different concentrations of ethanol (10, 20,
30, 50, 70, 90 and 100%) was carried out. After dehydration some drops
of acetone were added and kept in CPD machine for complete drying of
the sample. After the completion of CPD process, mounting of sample on
aluminium stub was carried out. For coating of the sample,

Materials and Methods
89
gold/palladium metal was used. The micrographs were taken with
scanning electron microscopy (Leo Electron Microscopy Ltd.,
Cambridge).
3.3.1.2 Transmission electron microscope (TEM) analysis
For TEM, a drop of aqueous solution containing the silver
nanomaterials was placed on the carbon coated copper grids and dried
under infrared lamp. Micrographs were obtained using a FEI-Philips
Tecnai 12 operating at 200 kV. The size distribution of the silver
nanoparticles was based on diameter of >200 particles on TEM
micrographs.
3.3.1.3 Zetasizer
Particle size and size distribution of the sample was performed
using Zetasizer Nano-ZS, Model ZEN3600 equipped with 4.0 mW, 633
nm laser (Malvern Instruments, Worcestershire, United Kingdom). Water
was used as a dispersant. Two experiments were carried out
simultaneously. The aqueous solution of AgNO3 without the fungus
served as control, while the treated sample comprised of AgNO3 and
fungus filtrate.

Materials and Methods
90
3.4 In silico studies
3.4.1 Selection of microorganisms
The selection of microorganisms for further study was carried out
by using the following paths:
(a) Literature survey
(b) Screening of water pathogenic bacteria from literature
After exhaustive surveys, the following two microorganisms viz.
Escherichia coli and Pseudomonas aeruginosa were selected. This
selection was based on criteria like prominence in water samples, easy
availability, ease of culture and economic importance.
3.4.2 Retrieval of essential genes and their products in selected micro-
organisms
Retrieval of essential genes and their products in selected micro-
organisms was performed using Database of Essential genes (DEG)
(Figure 3.1) and The National Microbial Pathogen Database Resource
(NMPDR) (Figure 3.2).

Materials and Methods
91
Figure 3.1 Homepage of DEG.
Figure 3.2 Homepage of NMPDR.

Materials and Methods
92
3.4.3 In-silico screening of membrane proteins of selected microbes
In-silico screening of membrane proteins (Target Identification) of
selected microbes was done using Universal Protein Resource (UniProt)
(Figures 3.3 and 3.4). The Universal Protein Resource (UniProt) is a
comprehensive resource for protein sequence and annotation data. The
UniProt databases are the UniProt Knowledge base (UniProtKB), the
UniProt Reference Clusters (UniRef), and the UniProt Archive (UniParc).
The UniProt Metagenomic and Environmental Sequences (UniMES)
database is a repository specifically developed for metagenomic and
environmental data.
A total of 5 proteins were selected from 2 microorganisms namely:
Outer Membrane Protein (trans membrane domain) (1QJ8)- E. coli
Outer Membrane Protein (trans membrane domain) (1QJP)- E. coli
Drug Discharge outer membrane Protein (1WP1)- P. aeruginosa
Outer membrane Protein (3D5K)- P. aeruginosa
Outer Membrane Protein (Modelled) (Opr 86)- P. aeruginosa

Materials and Methods
93
Figure 3.3 Homepage of UniProt.
Figure 3.4 Homepage of UniProt showing protein data.

Materials and Methods
94
3.4.4 Search of 3D structure of screened membrane proteins
The 3-dimensional structure of proteins was downloaded from
Research Collaboratory for Structural Bioinformatics (RCSB Protein Data
Bank- PDB; http://www.rcsb.org) (Figures 3.5 and 3.6).
Figure 3.5 Homepage of PDB.
Figure 3.6 Homepage of PDB showing protein data.

Materials and Methods
95
3.4.5 Search for ligand structure
The ligand structure was searched at Pubchem (Figure 3.7), a free
database of chemical molecules and their activities against biological
assays.
Figure 3.7 Homepage of Pubchem.
Ag-Commercial Item Description (CID) No. 23954 obtained from
Pubchem was used for further studies.

Materials and Methods
96
3.4.6 Ligand binding site prediction
Identifying the location of ligand binding sites on a protein is of
fundamental importance for a range of applications including molecular
docking, de novo drug design and structural identification and comparison
of functional sites. Q-Site Finder (Figure 3.8) and Pocket-Finder were
utilized for prediction of functional site amino acids using the online tools
available at http://www.bioinformatics.leeds.ac.uk/qsitefinder and
http://www.bioinformatics.leeds.ac.uk/pocketfinder
Figure 3.8 Homepage of Q-SiteFinder.
Materials and Methods
97
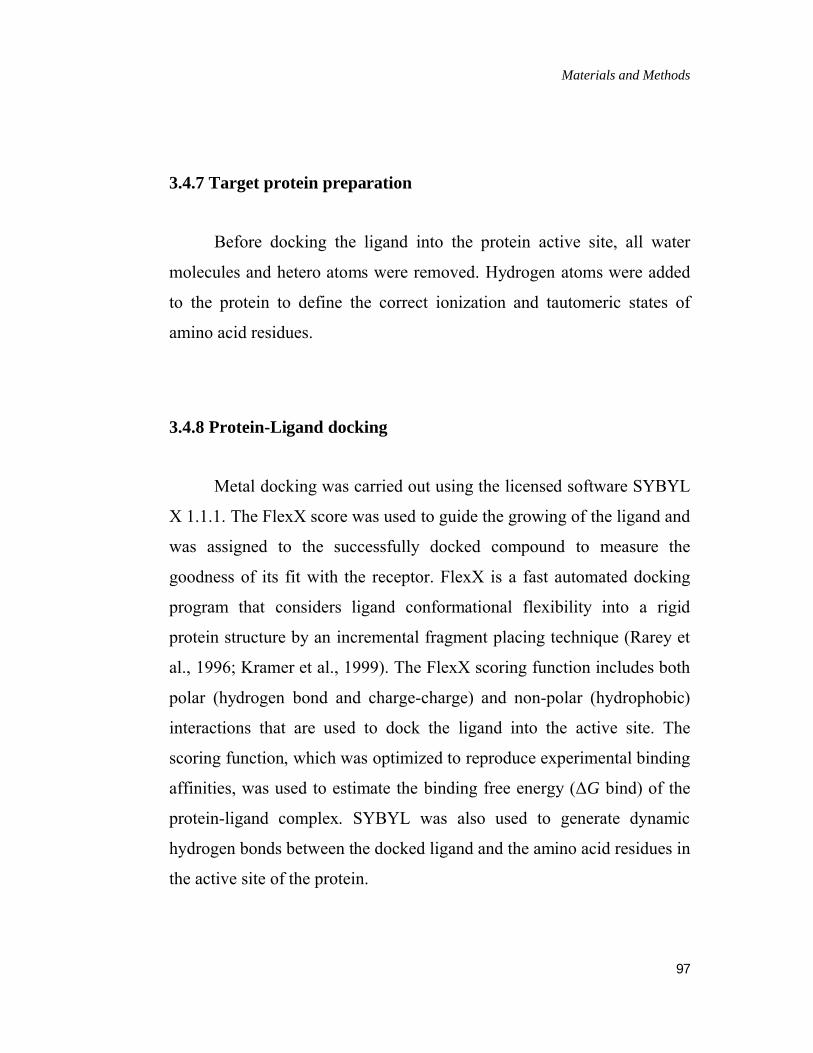
3.4.7 Target protein preparation
Before docking the ligand into the protein active site, all water
molecules and hetero atoms were removed. Hydrogen atoms were added
to the protein to define the correct ionization and tautomeric states of
amino acid residues.
3.4.8 Protein-Ligand docking
Metal docking was carried out using the licensed software SYBYL
X 1.1.1. The FlexX score was used to guide the growing of the ligand and
was assigned to the successfully docked compound to measure the
goodness of its fit with the receptor. FlexX is a fast automated docking
program that considers ligand conformational flexibility into a rigid
protein structure by an incremental fragment placing technique (Rarey et
al., 1996; Kramer et al., 1999). The FlexX scoring function includes both
polar (hydrogen bond and charge-charge) and non-polar (hydrophobic)
interactions that are used to dock the ligand into the active site. The
scoring function, which was optimized to reproduce experimental binding
affinities, was used to estimate the binding free energy (ΔG bind) of the
protein-ligand complex. SYBYL was also used to generate dynamic
hydrogen bonds between the docked ligand and the amino acid residues in
the active site of the protein.
Materials and Methods
98
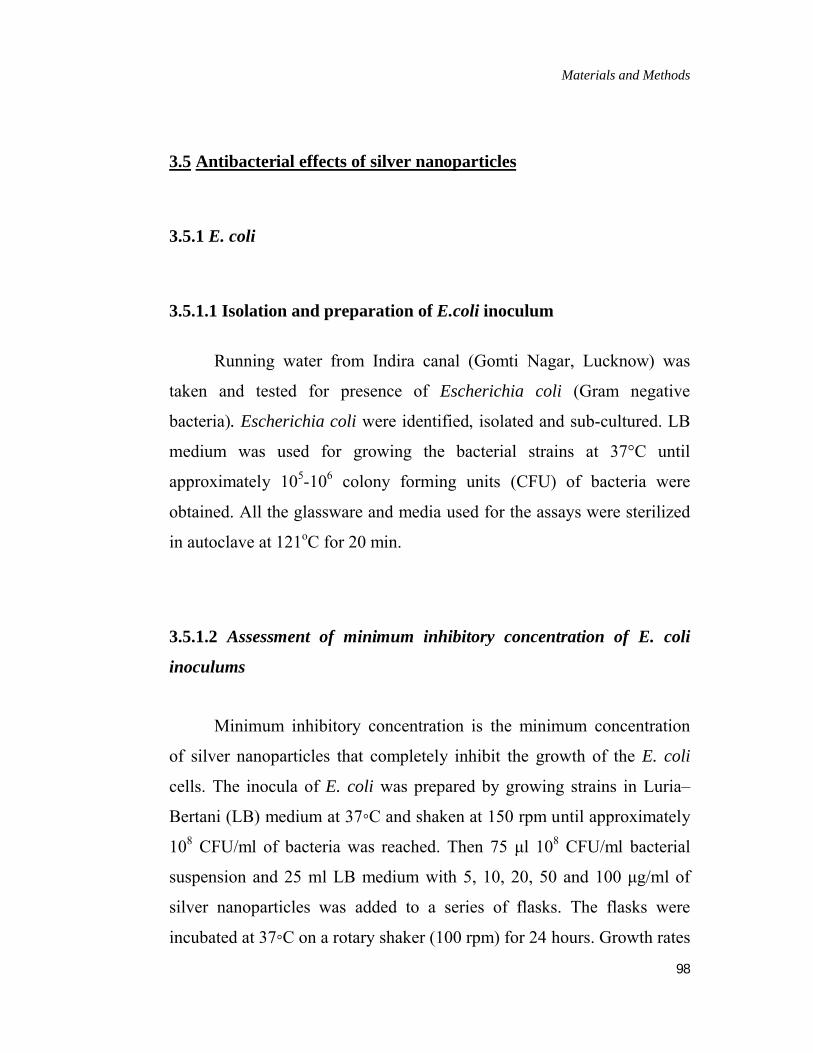
3.5 Antibacterial effects of silver nanoparticles
3.5.1 E. coli
3.5.1.1 Isolation and preparation of E.coli inoculum
Running water from Indira canal (Gomti Nagar, Lucknow) was
taken and tested for presence of Escherichia coli (Gram negative
bacteria). Escherichia coli were identified, isolated and sub-cultured. LB
medium was used for growing the bacterial strains at 37°C until
approximately 105-106 colony forming units (CFU) of bacteria were
obtained. All the glassware and media used for the assays were sterilized
in autoclave at 121oC for 20 min.
3.5.1.2 Assessment of minimum inhibitory concentration of E. coli
inoculums
Minimum inhibitory concentration is the minimum concentration
of silver nanoparticles that completely inhibit the growth of the E. coli
cells. The inocula of E. coli was prepared by growing strains in Luria–
Bertani (LB) medium at 37◦C and shaken at 150 rpm until approximately
108 CFU/ml of bacteria was reached. Then 75 μl 108 CFU/ml bacterial
suspension and 25 ml LB medium with 5, 10, 20, 50 and 100 μg/ml of
silver nanoparticles was added to a series of flasks. The flasks were
incubated at 37◦C on a rotary shaker (100 rpm) for 24 hours. Growth rates

Materials and Methods
99
and bacterial concentrations were determined by measuring optical
density (OD) at 600 nm (O.D. of 0.1 corresponds to a concentration of 108
cells per milliliter).
3.5.1.3 Antibacterial activity of silver nanoparticles in liquid media
Inoculations were given from fresh E. coli colonies on agar plates
into 50 ml LB culture medium. 108 CFU from above were added to 100
ml liquid LB media supplemented with 5, 10, 20, 50 and 100 μg/ml of
silver nanoparticles. The flasks were incubated at 37◦C on a rotary shaker
(100 rpm) for 24 hours. Growth rates and bacterial concentrations were
determined by measuring optical density (OD) at 600 nm (O.D. of 0.1
corresponds to a concentration of 108 cells per milliliter). Control broths
were used without nanoparticles.
3.5.1.4 Antibacterial activity of silver nanoparticles on solid media
To examine the bactericidal effect of silver nanoparticles on Gram-
negative bacteria, approximately 108 colony forming units (CFU) of E.
coli were cultured on LB agar plates. LB agar plates containing 108
colony forming units (CFU) of E. coli were supplemented with silver
nanoparticles at concentrations of 5, 10, 20, 50 and 100 μg/ml. Silver
nanoparticle free LB plates cultured under the same conditions were used
as a control. Plates were incubated for 24 h at 37◦C.

Materials and Methods
100
The bacterial cell colonies on agar-plates were detected by viable
cell counts. Viable cell counts are the counted number of colonies that are
developed after a sample has been diluted and spread over the surface of a
nutrient medium solidified with agar in a petri dish. The number of CFU
were counted. The counts on the three plates corresponding to a particular
sample were averaged.
3.5.2 Pseudomonas aeruginosa
3.5.2.1 Isolation and preparation of P. aeruginosa inoculum
P. aeruginosa was obtained from National Collection of Industrial
Microorganisms (NCIM), NCL, Pune. Cultures of the bacterium were
sub-cultured in Muller Hinton broth and agar (Hi Media laboratories) for
24 h at 37oC. All the glassware and media used for the assays were
sterilized in autoclave at 121oC for 20 min.
3.5.2.2 Assessment of minimum inhibitory concentration of P.
aeruginosa inoculum
Minimum inhibitory concentration is the minimum concentration
of silver nanoparticles that completely inhibit the growth of the P.
aeruginosa cells. For determining the minimum concentration of silver
nanoparticles required for the inhibition of P. aeruginosa growth, broth
dilution method was used which facilitated the testing of inhibitory
activity at various nanoparticle concentrations. Nutrient broth was

Materials and Methods
101
supplemented with different concentration of nanoparticles (5, 10, 15, 20,
25 µg/ml) and inoculated with bacterial suspension to obtain 106 colony
forming units (CFU)/ml. Control tubes were maintained without silver
nanoparticles. The flasks were incubated at 37◦C on a rotary shaker (100
rpm) for 24 h. The MIC was determined after 24 h of incubation at 37oC
by observing the visible turbidity and measuring the optical density (OD)
of these culture broths at 600 nm.
3.5.2.3 Antibacterial activity of silver nanoparticles on P. aeruginosa in
liquid media
Inoculations were given from fresh E. coli colonies on agar plates
into 50 ml LB culture medium. 108 CFU from above were added to 100
ml liquid LB media supplemented with 1, 2, 5, 10 and 20 μg/ml of silver
nanoparticles. The flasks were incubated at 37◦C on a rotary shaker (100
rpm) for 24 hours. Growth rates and bacterial concentrations were
determined by measuring optical density (OD) at 600 nm (O.D. of 0.1
corresponds to a concentration of 108 cells per milliliter). Control broths
were used without nanoparticles.
3.5.2.4 Antibacterial activity of silver nanoparticles on P. aeruginosa on
solid media
Agar dilution method was used to study the bactericidal activity of
silver nanoparticles on P. aeruginosa. MHA was supplemented with

Materials and Methods
102
various concentrations of nanoparticles (1-25 µg/ml) and each plate was
inoculated with 106 colony forming units (CFU) by spread plating. Plates
without nanoparticles were used as control. Number of surviving bacteria
in agar plates was counted after 18 h of incubation at 37◦C. The bacterial
cell colonies on agar-plates were detected by viable cell counts. The
numbers of CFU were counted. The counts on the three plates
corresponding to a particular sample were averaged.