CHAPTER 3 Graphing Linear Functions - Big Ideas Learning€¦ · 3.1 Notetaking with Vocabulary...
8
59 Copyright © Big Ideas Learning, LLC All rights reserved. CHAPTER 3 Graphing Linear Functions 3.1 Functions ...........................................................................................................61 3.2 Linear Functions ................................................................................................67 3.3 Function Notation ..............................................................................................73 3.4 Graphing Linear Equations in Standard Form ...................................................79 3.5 Graphing Linear Equations in Slope-Intercept Form .........................................85 3.6 Transformations of Graphs of Linear Functions ................................................91
Transcript of CHAPTER 3 Graphing Linear Functions - Big Ideas Learning€¦ · 3.1 Notetaking with Vocabulary...
59Copyright © Big Ideas Learning, LLC
All rights reserved.
CHAPTER 3Graphing Linear Functions
3.1 Functions ...........................................................................................................61 3.2 Linear Functions ................................................................................................67 3.3 Function Notation ..............................................................................................73 3.4 Graphing Linear Equations in Standard Form ...................................................79 3.5 Graphing Linear Equations in Slope-Intercept Form .........................................85 3.6 Transformations of Graphs of Linear Functions ................................................91
60Copyright © Big Ideas Learning, LLCAll rights reserved.
Integrated Mathematics I Copyright © Big Ideas Learning, LLC Student Journal All rights reserved. 58
Chapter
3 Maintaining Mathematical Proficiency
Name _________________________________________________________ Date _________
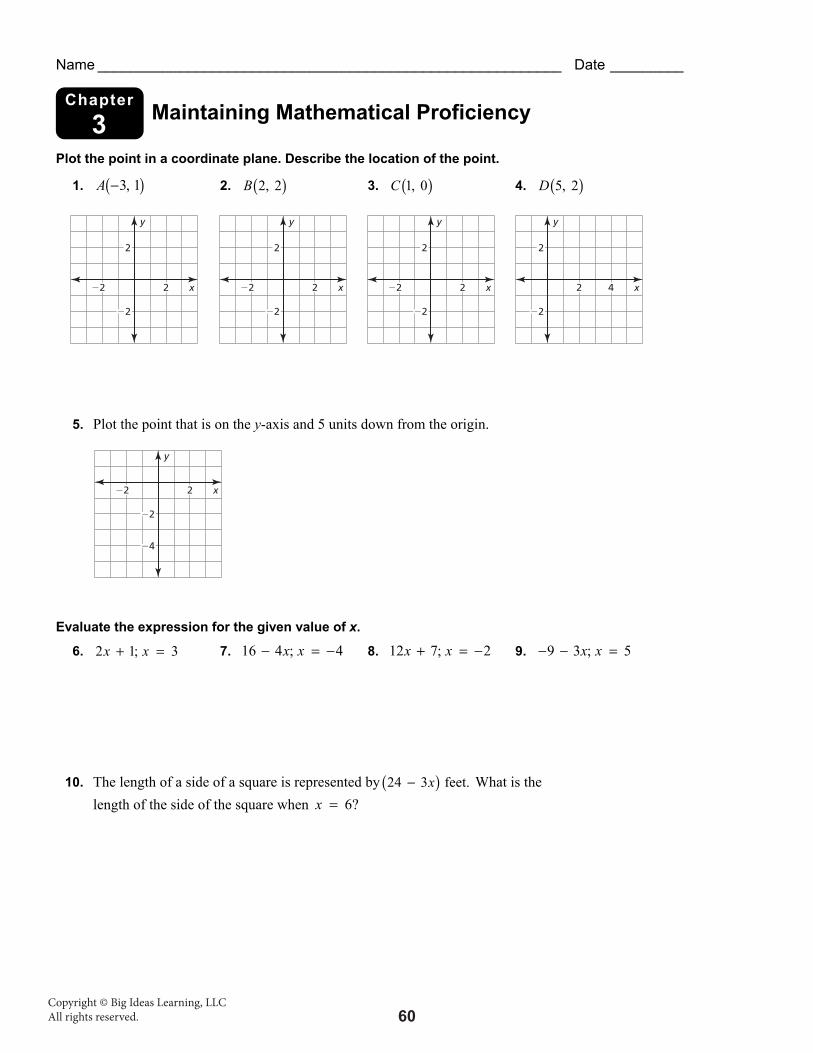
Plot the point in a coordinate plane. Describe the location of the point.
1. ( )3, 1A − 2. ( )2, 2B 3. ( )1, 0C 4. ( )5, 2D
5. Plot the point that is on the y-axis and 5 units down from the origin.
Evaluate the expression for the given value of x.
6. 2 1; 3x x+ = 7. 16 4 ; 4x x− = − 8. 12 7; 2x x+ = − 9. 9 3 ; 5x x− − =
10. The length of a side of a square is represented by ( )24 3 feet.x− What is the length of the side of the square when 6?x =
x
y
−2 2
2
−2
x
y
−2 2
2
−2
x
y
−2 2
2
−2
x
y
2 4
2
−2
x
y
−2 2
−2
−4
61Copyright © Big Ideas Learning, LLC
All rights reserved.
Copyright © Big Ideas Learning, LLC Integrated Mathematics I All rights reserved. Student Journal
59
3.1 Functions For use with Exploration 3.1
Name _________________________________________________________ Date __________
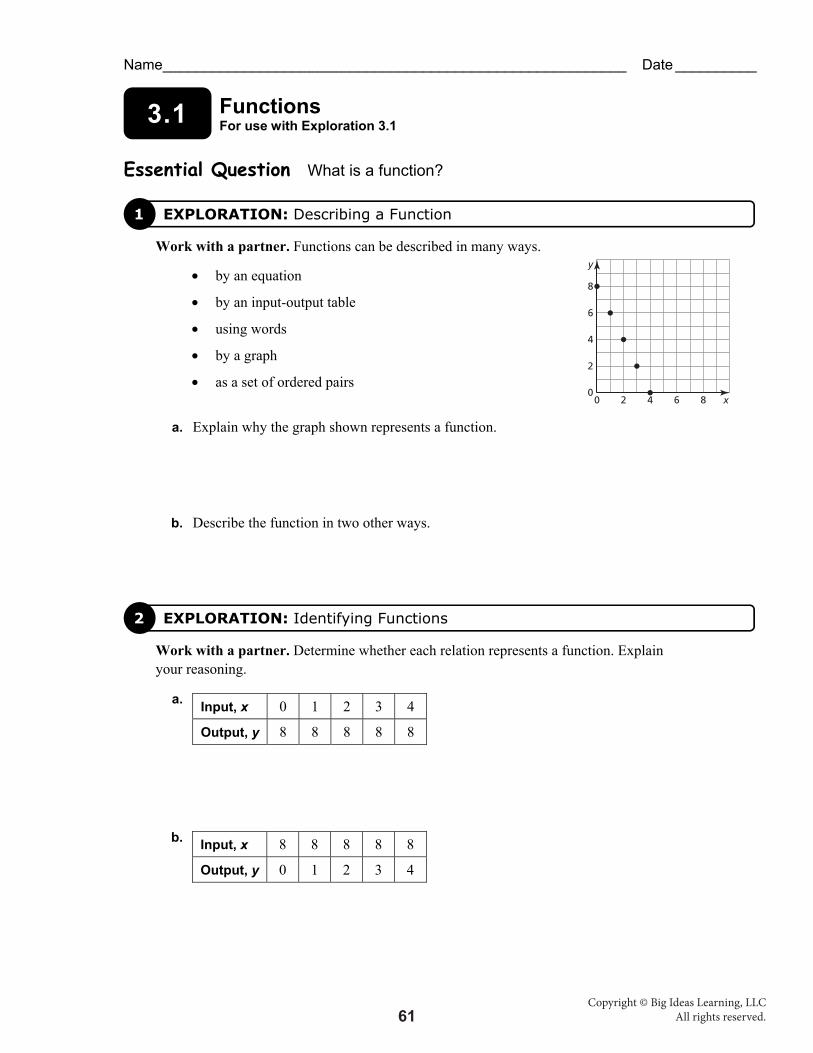
Essential Question What is a function?
Work with a partner. Functions can be described in many ways.
• by an equation
• by an input-output table
• using words
• by a graph
• as a set of ordered pairs
a. Explain why the graph shown represents a function.
b. Describe the function in two other ways.
Work with a partner. Determine whether each relation represents a function. Explain your reasoning.
a.
b.
1 EXPLORATION: Describing a Function
2 EXPLORATION: Identifying Functions
Input, x 0 1 2 3 4
Output, y 8 8 8 8 8
Input, x 8 8 8 8 8
Output, y 0 1 2 3 4
x
y
4
2
0
8
6
420 86
62Copyright © Big Ideas Learning, LLCAll rights reserved.
Integrated Mathematics I Copyright © Big Ideas Learning, LLC Student Journal All rights reserved. 60
3.1 Functions (continued)
Name _________________________________________________________ Date _________
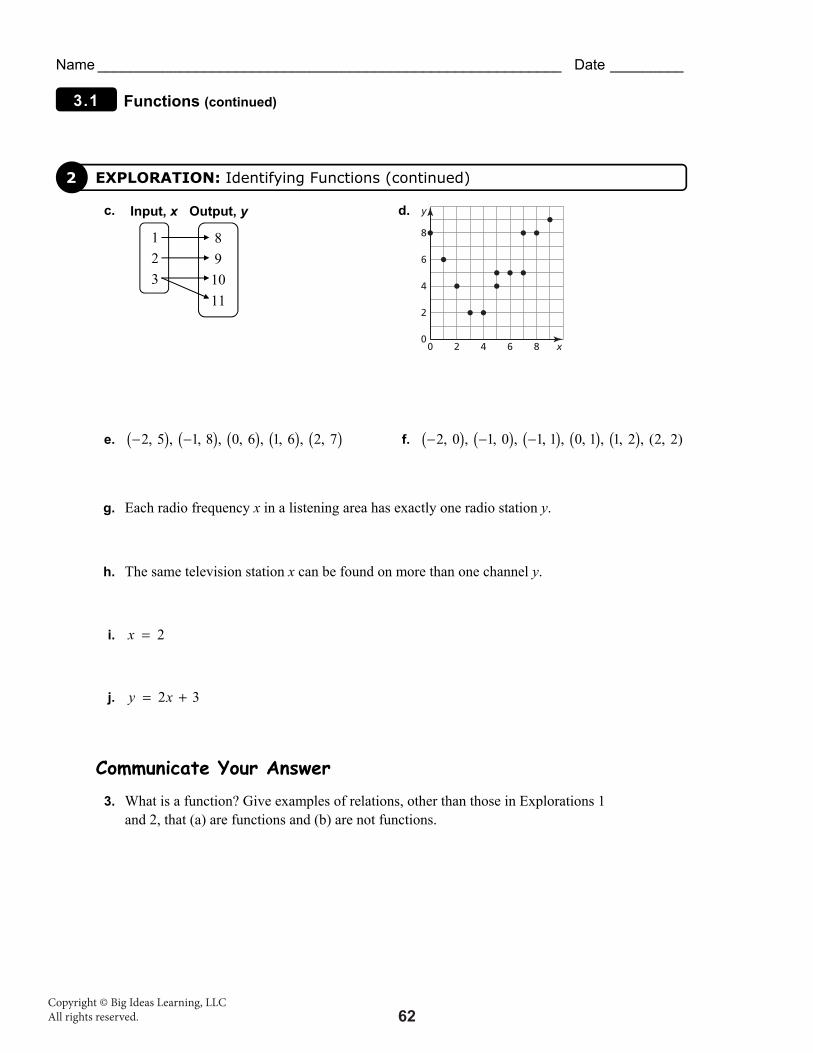
c. d.
e. ( ) ( ) ( ) ( ) ( )2, 5 , 1, 8 , 0, 6 , 1, 6 , 2, 7− − f. ( ) ( ) ( ) ( ) ( )2, 0 , 1, 0 , 1, 1 , 0, 1 , 1, 2 , (2, 2)− − −
g. Each radio frequency x in a listening area has exactly one radio station y.
h. The same television station x can be found on more than one channel y.
i. 2x =
j. 2 3y x= +
Communicate Your Answer 3. What is a function? Give examples of relations, other than those in Explorations 1
and 2, that (a) are functions and (b) are not functions.
2 EXPLORATION: Identifying Functions (continued)
4
2
0
8
6
420 86 x
yInput, x Output, y
1 2 3
8 9 10 11
63Copyright © Big Ideas Learning, LLC
All rights reserved.
Copyright © Big Ideas Learning, LLC Integrated Mathematics I All rights reserved. Student Journal
61
3.1 Notetaking with Vocabulary For use after Lesson 3.1
Name _________________________________________________________ Date __________
In your own words, write the meaning of each vocabulary term.
relation
function
domain
range
independent variable
dependent variable
Notes:
64Copyright © Big Ideas Learning, LLCAll rights reserved.
Integrated Mathematics I Copyright © Big Ideas Learning, LLC Student Journal All rights reserved. 62
3.1 Notetaking with Vocabulary (continued)
Name _________________________________________________________ Date _________
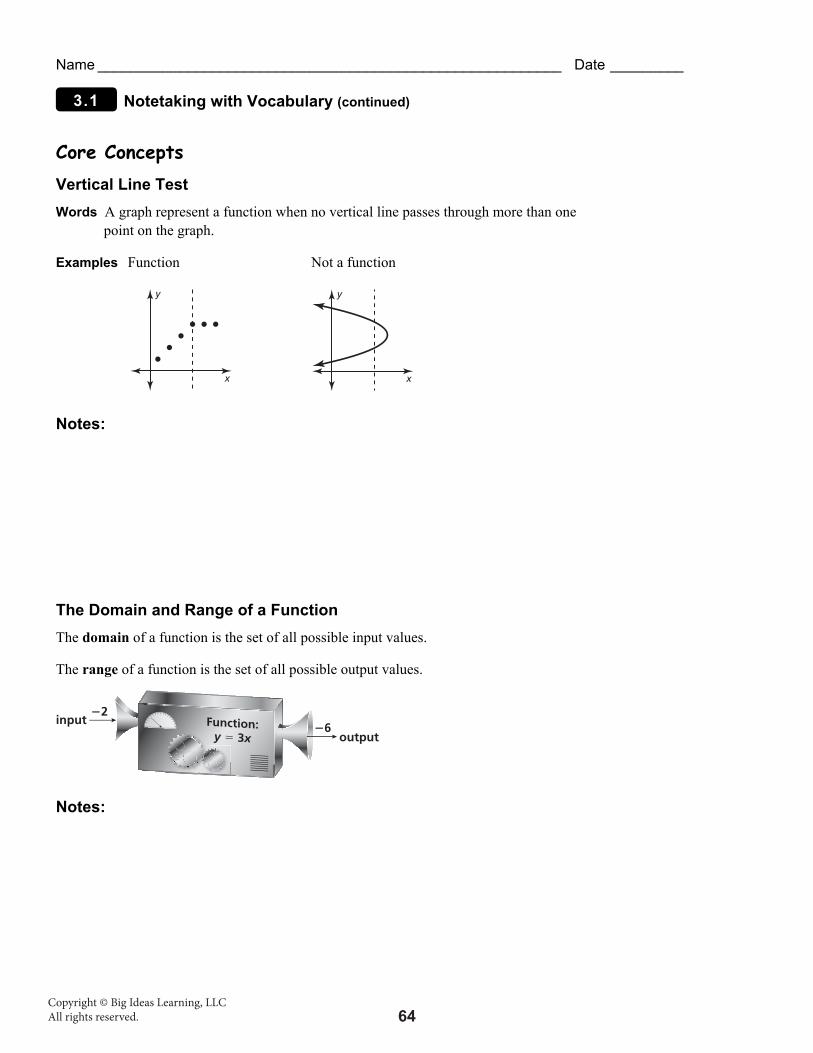
Core Concepts Vertical Line Test Words A graph represent a function when no vertical line passes through more than one
point on the graph.
Examples Function Not a function
Notes:
The Domain and Range of a Function The domain of a function is the set of all possible input values.
The range of a function is the set of all possible output values.
Notes:
x
y
x
y
input−2
output−6
65Copyright © Big Ideas Learning, LLC
All rights reserved.
Copyright © Big Ideas Learning, LLC Integrated Mathematics I All rights reserved. Student Journal
63
3.1 Notetaking with Vocabulary (continued)
Name _________________________________________________________ Date __________
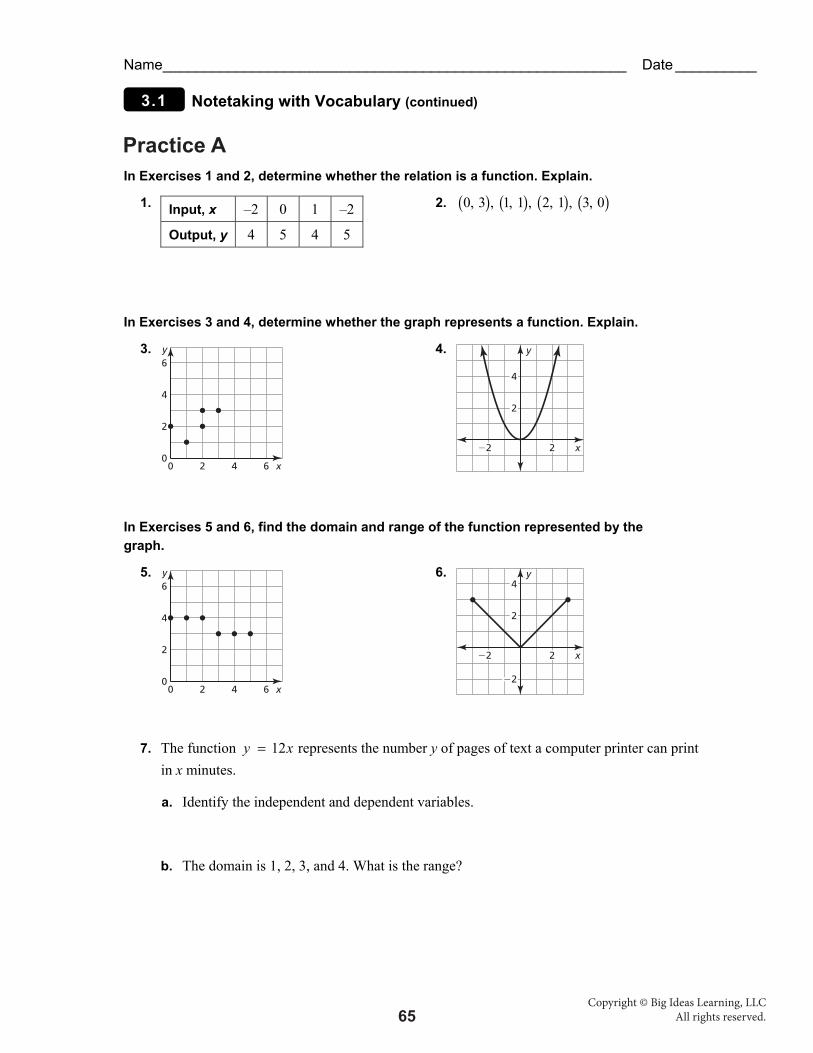
Extra Practice In Exercises 1 and 2, determine whether the relation is a function. Explain.
1. 2. ( ) ( ) ( ) ( )0, 3 , 1, 1 , 2, 1 , 3, 0
In Exercises 3 and 4, determine whether the graph represents a function. Explain.
3. 4.
In Exercises 5 and 6, find the domain and range of the function represented by the graph.
5. 6.
7. The function 12y x= represents the number y of pages of text a computer printer can print in x minutes.
a. Identify the independent and dependent variables.
b. The domain is 1, 2, 3, and 4. What is the range?
Input, x –2 0 1 –2
Output, y 4 5 4 5
x
y
2 4 60
2
4
6
0x
y
2−2
2
4
x
y
2 4 60
2
4
6
0
x
y
2−2
2
−2
4
Practice A
66Copyright © Big Ideas Learning, LLCAll rights reserved.
Copyright © Big Ideas Learning, LLC Integrated Mathematics I All rights reserved. Resources by Chapter
75
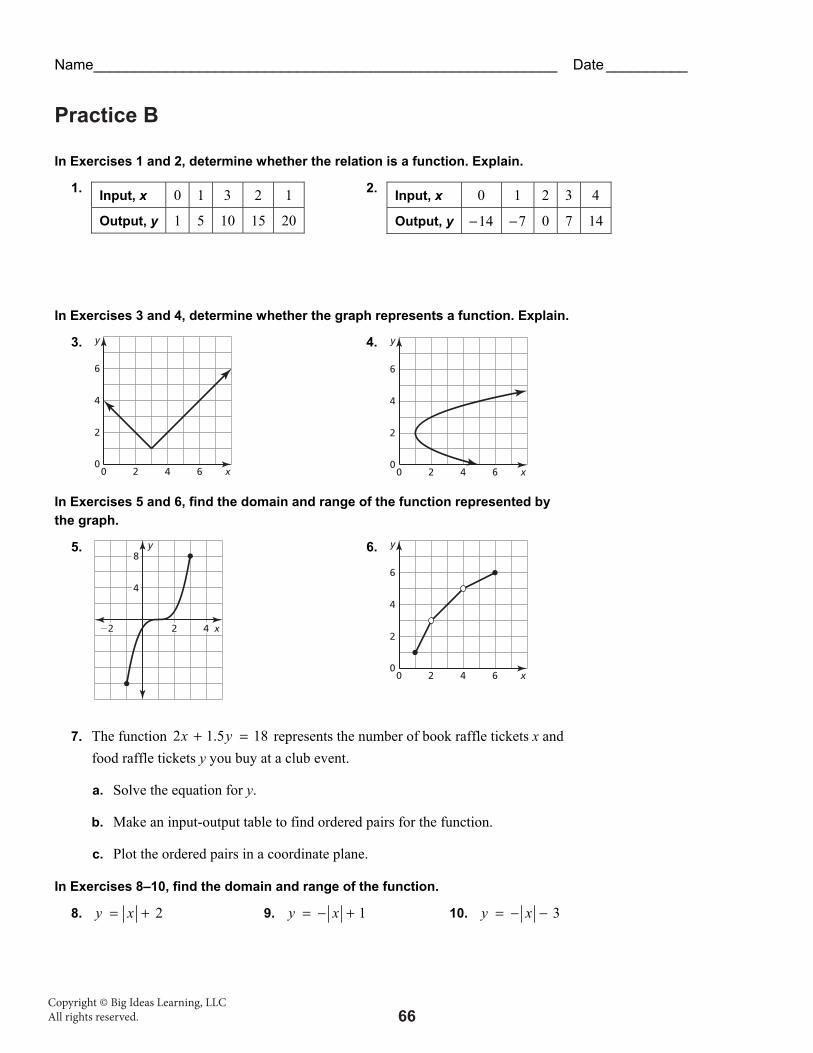
3.1 Practice B
Name _________________________________________________________ Date __________
In Exercises 1 and 2, determine whether the relation is a function. Explain.
1. 2.
In Exercises 3 and 4, determine whether the graph represents a function. Explain.
3. 4.
In Exercises 5 and 6, find the domain and range of the function represented by the graph.
5. 6.
7. The function 2 1.5 18x y+ = represents the number of book raffle tickets x and food raffle tickets y you buy at a club event.
a. Solve the equation for y.
b. Make an input-output table to find ordered pairs for the function.
c. Plot the ordered pairs in a coordinate plane.
In Exercises 8–10, find the domain and range of the function.
8. 2y x= + 9. 1y x= − + 10. 3y x= − −
Input, x 0 1 3 2 1
Output, y 1 5 10 15 20
Input, x 0 1 2 3 4
Output, y −14 −7 0 7 14
4
6
2
0x
y
420 6
4
6
2
0x
y
420 6
x
y
4
8
2 4−2
4
6
2
0x
y
420 6
Practice B

![Notetaking Made Easy[2]](https://static.fdocuments.net/doc/165x107/5550dae8b4c905e8318b5371/notetaking-made-easy2.jpg)