Chapter 3 Forecasts of Aviation Activity
58
Chapter 3 Forecasts of Aviation Activity
Transcript of Chapter 3 Forecasts of Aviation Activity

Chapter 3 Forecasts of Aviation Activity


Final 3‐1 01/11/2011 St. Lucie County International Airport Master Plan Update
CCCHHHAAAPPPTTTEEERRR TTTHHHRRREEEEEE
FFFooorrreeecccaaassstttsss ooofff AAAvvviiiaaatttiiiooonnn AAAccctttiiivvviiitttyyy During 2008 in the United States and around the world, many industries were negatively
affected by struggling economies and stock markets, bankruptcies, foreclosures, and record
high fuel prices. Within the aviation industry, these factors led to a dramatic decline in
general aviation (GA) activity as well as commercial airline travel, which had previously
shown signs of recovery since the terrorist attacks on September 11, 2001. As large
corporations experienced significant losses, such as those within the automobile and banking
industries, the latter portion of 2008 saw an increased sell-off of corporate jet aircraft, with
some executives opting for commercial airline travel as a cost savings measure. Still, there
are tremendous benefits of corporate jet travel, particularly amongst organizations that value
face-to-face interaction where executive time is highly valued, and the corporate jet industry
supports thousands of important manufacturing, maintenance, and pilot jobs around the
United States. Therefore, these types of recent circumstances which may negatively or
positively influence future activity levels were examined in this Airport Master Plan Update
(AMPU) for the St. Lucie County International Airport (FPR).
Forecasts are a vital component of the master planning process, and they are used throughout
the remainder of this study to determine long-term facility requirements, development
alternatives, and recommended improvements. According to Federal Aviation
Administration (FAA) Advisory Circular (AC) 150/5070-6, Airport Master Plans, aviation
forecasting “should consider socioeconomic data, demographics, disposable income,
geographic attributes, and external factors such as fuel costs and local attitudes towards
aviation.”1 Consideration of all these factors is necessary to accurately forecast future activity
at FPR. For example, the United States economy is experiencing a decline, although at the
same time, airports to the south of FPR (e.g., West Palm Beach International Airport (PBI)
are more congested than ever which may shift some tenants, GA activity, and based aircraft
to the north. Also, the fact that the airport property is part of a Foreign Trade Zone (FTZ
#218) within St. Lucie County may allow for greater development opportunities and activity
growth at FPR than many other GA airports within the Treasure Coast Region of Florida.
1 FAA AC 150/5070‐6, Airport Master Plans.

Final 3‐2 01/11/2011 St. Lucie County International Airport Master Plan Update
As mentioned in Chapter 2, Inventory of Existing Conditions, the forecast base year was 2008
since it represents the most recent full-year of activity at FPR. Typically the planning
forecast is based upon a twenty-year period divided into short-term (2008-2013), mid-term
(2014-2018), and long-term (2019-2028). In addition to a review of historical and forecast
socioeconomic and activity characteristics, various aviation activity forecasts were presented
in this chapter, including the following:
Annual GA Operations (Local versus Itinerant)
Annual Instrument Operations
Annual Air Charter/Air Taxi Operations
Based Aircraft Totals
Based Aircraft Fleet Mix
Annual Operational Fleet Mix
Peak Period Operations
Existing Critical Aircraft Determination
3.1 Needs and Benefits Forecasts of future activity are a key component of a master planning study since every
subsequent decision related to the purpose, size, design, and location of any structure or
equipment relies on the estimated levels of activity. Failure to properly plan for the future
can result in negative consequences to the capacity, activity, safety, and efficiency of the
airport. Therefore, the forecast planning horizon term is twenty years in order to ensure the
adequate facilities are in-place for the operator, the traveling public, and the surrounding
community.
3.2 Forecasting Limitations Forecasting future activity is a complex assessment based on a multitude of factors, both
controllable and those beyond an airport’s control. Forecasts of future activity are not to be
construed with predictions of the future but rather an educated guess of future activity based
upon a variety of predictors, mathematical formulae, assumptions, and subjective judgment.
The accuracy of the estimates decline as the planning term is extended, by unforeseen local
or geo-political events, by unpredictable events involving natural disasters, or, more subtly,
longer-term weather or climatological events. These caveats notwithstanding, the forecasts
provided in this section utilize a variety of methodologies, which together constitute best
practices in the industry.

Final 3‐3 01/11/2011 St. Lucie County International Airport Master Plan Update
3.3 Existing and Forecast Socioeconomic Characteristics In determining the Forecasts of Aviation Demand, it is often the case that a correlation exists
between local demographics (i.e., socioeconomic characteristics), such as population and
employment, and past activity and/or based aircraft levels. For this study, historic and
forecast demographic data was obtained from Woods & Poole Economics of Washington,
D.C., which the FAA recognizes as an acceptable source of demographic forecasts according
to their report, Forecasting Aviation Activity by Airport (July 2001). The data obtained from
Woods & Poole (2008 State Profile – Florida) includes historical data from 1970 and forecasts
to 2040 for 121 different variables. “The strength of Woods & Poole's economic and
demographic projections stems from the comprehensive historical county database and the
integrated nature of the projection model. The projection for each county in the United
States is done simultaneously so that changes in one county will affect growth or decline in
other counties. For example, growth in employment and population in Houston will affect
growth in other metropolitan areas, such as Cleveland. This reflects the flow of economic
activity around the country as new industries emerge or relocate in growing areas and as
people migrate, in part because of job opportunities. The county projections are developed
within the framework of the United States projection made by Woods & Poole. The U.S.
projection is the control total for the 2008 regional projections.”2
Previous studies for St. Lucie County utilized demographic forecasts from the University of
Florida Bureau of Economic and Business Research (BEBR). For example, the St. Lucie
County Comprehensive Plan (revised January 2004) projects the county population to reach
375,845 by 2020 using 1990 BEBR forecasts; the October 2008 St. Lucie County Evaluation
and Appraisal Report (EAR) projects the county population to reach 390,400 by 2020 using
2006 BEBR forecasts. At the time of this writing, the BEBR had not yet released
demographic forecasts for 2008. Further, according to the Florida Legislature Office of
Economic and Demographic Research, unlike previous years, much of the state experienced
more outmigration than in-migration due to the weakened economic climate and housing
market. This trend is expected to continue through mid-2001.3 Subsequently, the 2008
Woods & Poole demographic forecasts provided up-to-date and FAA-recognized data for use
in this AMPU study. The Woods & Poole data provides a more conservative growth
projection for St. Lucie County considering current economic conditions, with the
population expected to reach 360,096 by 2020.
2 Woods & Poole Economics, 2008 State Profile – Florida. 3 Florida Legislature office of Economic and Demographic Research, February 18, 2009 Demographic Estimating Conference Executive Summary.

Final 3‐4 01/11/2011 St. Lucie County International Airport Master Plan Update
3.3.1 Local Area Characteristics/Airport Service Area
Within the Treasure Coast Region of Florida, each of the four counties (St. Lucie, Indian
River, Martin, and Okeechobee Counties) contains at least one airport that is included in the
FAA’s National Plan of Integrated Airport Systems (NPIAS), as previously shown in Table 2-
2. A review of FPR’s based aircraft owner addresses revealed that the majority of aircraft are
registered to Fort Pierce or Port St. Lucie addresses (both cities located in St. Lucie County),
with sporadic others registered in nearby counties. As such, it was determined that the
socioeconomic characteristics of St. Lucie County, as provided by Woods & Poole, best
represents FPR’s service area, and could, therefore, be used in the Forecasts of Aviation Demand to identify historic and forecast conditions. 3.3.2 Population
In general, changes in population within an airport’s service area may reasonably be expected
to affect activity levels at the airport, although the degree to which population impacts
aviation activity varies from airport to airport. As summarized in Table 3-1, historic
population data illustrates that the population of St. Lucie County increased nearly 39
percent from 2000 to 2008 (i.e., approximately 70,000 new citizens), while at the same time
the population of Florida increased nearly 16 percent and the United States increased nearly
8 percent. Much of the strong population growth in St. Lucie County has occurred in Port St.
Lucie to the south of the airport, which “had the nation’s fastest growth rate among large
cities (100,000 or more population) between July 1, 2003 and July 1, 2004.”4 The residential
boom in St. Lucie County coincided with decreasing interest rates in 2001. However, most
new homeowners consisted of transplants from counties to the south (e.g., Broward and Palm
Beach Counties) and continue to commute to jobs in those counties.5 Subsequently, “this
residential growth has not been met by job growth in the county necessitating many people
to travel out of the area. This has spurred a distinct north-south commute. The growth has
also not been met by new or upgraded infrastructure – the vast majority of the county lacks
sidewalks, greenways, trails, and other amenities, but is experiencing heavy traffic
congestion.”6 These types of factors are important when trying to determine if there is a
correlation between population and airport activity; for example, recent studies suggest that
much of St. Lucie County’s growing residential population still has ties to areas to the south
and also includes large numbers of retirees. Consequently, a correlation between population
and airport activity may not be apparent. It can, however, be assumed that with the
population of St. Lucie County projected to increase more than 56 percent between 2008 and
2028 (i.e., approximately 150,000 new citizens) that some increased activity should occur at
4 Port St. Lucie, Fla., is Fastest‐Growing City, Census Bureau Says, The America’s Intelligence Wire, June 30, 2005. 5 Growth Slowdown Anticipated for Port St. Lucie, Fla., South Florida Sun‐Sentinel, September 28, 2004. 6 St. Lucie County Bicycle, Pedestrian, Greenways and Trails Master Plan.

Final 3‐5 01/11/2011 St. Lucie County International Airport Master Plan Update
FPR perhaps beyond forecast aviation activity levels for the United States as a whole.
Further, as mentioned in Chapter 2, Inventory of Existing Conditions, the Fort Pierce-Port
St. Lucie Metropolitan Statistical Area (MSA) is projected to experience the second highest
growth increase, 56.4 percent, between 2008 and 2028 in Florida behind the Naples-Marco
Island MSA.
3.3.3 Employment Major private sector employers in St. Lucie County include Liberty Medical Supply, Wal-
Mart, Indian River State College, Publix Supermarkets, QVC, Lawnwood Regional Medical
Center, Riverside National Bank, St. Lucie County Medical Center, National City Bank, and
Tropicana.7 Historical and forecast employment numbers are summarized in Table 3-2. As
shown, from 2000 to 2008 the number of jobs in St. Lucie County grew by nearly 36,000
while at the same time the population grew by approximately 70,000. Over the next 20
years, approximately 50,000 jobs are forecast for the county while the population is expected
to increase by over 150,000.
7 eflorida.com county profile – St. Lucie County.

Final 3‐6 01/11/2011 St. Lucie County International Airport Master Plan Update
TABLE 3‐1 TOTAL POPULATION
Year United States
Florida Fort Pierce‐
Port St. Lucie MSA St. Lucie County
1990 249,622,814 13,033,307 254,702 152,669
1991 252,980,941 13,369,798 263,143 158,173
1992 256,514,224 13,650,553 269,716 163,060
1993 259,918,588 13,927,185 277,235 167,735
1994 263,125,821 14,239,444 285,006 172,790
1995 266,278,393 14,537,875 290,527 176,229
1996 269,394,284 14,853,360 297,947 180,497
1997 272,646,925 15,186,304 304,912 184,633
1998 275,854,104 15,486,559 311,185 187,492
1999 279,040,168 15,759,421 316,323 190,349
2000 282,194,308 16,049,316 320,595 193,429
2001 285,112,030 16,348,628 326,943 197,790
2002 287,888,021 16,667,906 336,115 204,489
2003 290,447,644 16,959,251 347,311 212,736
2004 293,191,511 17,342,623 362,521 225,490
2005 295,895,897 17,736,027 376,328 237,851
2006 298,754,819 18,057,508 388,637 250,270
2007 301,621,157 18,251,243 400,121 260,939
2008 304,579,417 18,573,921 411,333 268,691
2009 307,577,894 18,898,835 422,520 276,419
2010 310,603,348 19,225,221 433,675 284,119
2011 313,626,654 19,551,328 444,760 291,767
2012 316,689,114 19,879,715 455,840 299,406
2013 319,778,173 20,209,669 466,904 307,029
2014 322,897,008 20,541,430 477,962 314,643
2015 326,038,477 20,874,564 489,006 322,244
2016 329,201,638 21,209,053 500,042 329,835
2017 332,387,230 21,544,966 511,072 337,419
2018 335,582,900 21,881,531 522,084 344,987
2019 338,796,192 22,219,237 533,088 352,547
2020 342,020,014 22,557,651 544,080 360,096
2021 345,256,449 22,896,924 555,063 367,636
2022 348,505,660 23,237,072 566,039 375,169
2023 351,758,848 23,577,518 576,999 382,689
2024 355,027,731 23,919,065 587,961 390,208
2025 358,302,480 24,261,052 598,911 397,717
2026 361,577,000 24,603,068 609,842 405,212
2027 364,861,093 24,945,791 620,770 412,702
2028 368,146,748 25,288,672 631,683 420,181
AAGR 2000‐2008 0.96% 1.84% 3.16% 4.19%
Change 2000‐2008 7.93% 15.73% 28.30% 38.91%
AAGR 2008‐2028 0.95% 1.55% 2.17% 2.26%
Change 2008‐2028 20.87% 36.15% 53.57% 56.38%
ST AAGR 0.98% 1.70% 2.57% 2.70%
MT AAGR 0.97% 1.60% 2.26% 2.36%
LT AAGR 0.93% 1.46% 1.92% 1.99%
Sources: Woods & Poole Economics, 2008 State Profile – Florida, The LPA Group Incorporated, 2009.

Final 3‐7 01/11/2011 St. Lucie County International Airport Master Plan Update
TABLE 3‐2 TOTAL EMPLOYMENT
Year United States
Florida Fort Pierce‐
Port St. Lucie MSA St. Lucie County
1990 139,380,789 6,800,165 110,840 59,155
1991 138,605,941 6,774,853 109,687 59,105
1992 139,162,051 6,820,439 109,470 58,511
1993 141,779,349 7,061,120 112,271 59,849
1994 145,223,523 7,293,989 114,670 61,355
1995 148,982,796 7,554,304 118,608 62,464
1996 152,150,252 7,804,290 123,654 64,242
1997 155,608,200 8,068,144 127,375 65,736
1998 159,628,114 8,368,075 134,597 67,853
1999 162,955,412 8,656,378 139,416 69,047
2000 166,758,669 8,933,097 144,754 71,241
2001 167,014,580 9,112,067 150,598 74,004
2002 166,633,047 9,204,767 155,361 79,065
2003 167,553,448 9,411,408 163,532 84,305
2004 170,512,658 9,774,569 174,729 92,935
2005 174,176,362 10,185,201 186,365 98,440
2006 178,332,932 10,521,970 194,749 102,987
2007 180,481,565 10,692,379 198,649 105,089
2008 182,657,692 10,865,522 202,526 107,161
2009 184,859,674 11,041,345 206,469 109,273
2010 187,088,401 11,220,008 210,490 111,424
2011 189,343,706 11,401,455 214,583 113,618
2012 191,626,308 11,585,754 218,751 115,855
2013 193,936,435 11,773,000 223,000 118,133
2014 196,274,287 11,963,136 227,323 120,454
2015 198,640,326 12,156,339 231,732 122,823
2016 201,035,040 12,352,548 236,216 125,235
2017 203,458,519 12,551,832 240,784 127,693
2018 205,911,006 12,754,277 245,438 130,199
2019 208,393,381 12,959,955 250,184 132,760
2020 210,905,689 13,168,827 255,005 135,361
2021 213,448,068 13,380,982 259,930 138,020
2022 216,021,194 13,596,460 264,931 140,722
2023 218,625,284 13,815,376 270,030 143,479
2024 221,260,624 14,037,704 275,225 146,291
2025 223,927,959 14,263,485 280,513 149,155
2026 226,627,424 14,492,891 285,898 152,077
2027 229,359,400 14,725,867 291,388 155,054
2028 232,124,218 14,962,531 296,973 158,085
AAGR 2000‐2008 1.14% 2.48% 4.29% 5.24%
Change 2000‐2008 9.53% 21.63% 39.91% 50.42%
AAGR 2008‐2028 1.21% 1.61% 1.93% 1.96%
Change 2008‐2028 27.08% 37.71% 46.63% 47.52%
ST AAGR 1.21% 1.62% 1.94% 1.97%
MT AAGR 1.21% 1.61% 1.94% 1.96%
LT AAGR 1.21% 1.61% 1.92% 1.96%
Sources: Woods & Poole Economics, 2008 State Profile – Florida, The LPA Group Incorporated, 2009.

Final 3‐8 01/11/2011 St. Lucie County International Airport Master Plan Update
These trends are illustrative of the ‘bedroom community’ phenomenon described in the
population section, where residents of Port St. Lucie are commuting to jobs in cities like
West Palm Beach. Also, the median age of the county is forecast to increase from 39.92 in
2008 to 42.27 by 2028 which is indicative of the large existing retiree population and
anticipated growth in retirement community development within the county. Table 3-3
provides rankings of jobs and earnings by employment sector in St. Lucie County.
TABLE 3‐3 ST. LUCIE COUNTY EMPLOYMENT RANKINGS
Employment Sector 2008 Jobs Ranking
2028 Jobs Raking
2008 Earnings Ranking
2028 Earnings Ranking
State/Local Government 1 3 1 1
Retail Trade 2 4 4 5
Health Care/Social Assistance 3 1 2 2
Construction 4 5 3 3
Administrative/Waste Services 5 2 10 7
Other, Except Public Admin. 6 8 11 9
Real Estate, Rental, and Lease 7 7 14 13
Accommodation/Food Services 8 10 12 12
Forestry/Fishing 9 12 13 14
Wholesale Trade 10 9 5 4
Professional/Technical Services 11 6 6 6
Finance/Insurance 12 11 7 8
Manufacturing 13 13 9 10
Transportation 14 14 8 11
Arts/Entertainment/Recreation 15 15 18 18
Farm 16 17 20 22
Information 17 16 16 17
Educational Services 18 18 21 21
Federal Civilian Government 19 19 15 15
Federal Military 20 20 19 19
Utilities 21 21 17 16
Mgmt. Companies/Enterprises 22 22 22 20
Mining 23 23 23 23
Sources: Woods & Poole Economics, 2008 State Profile – Florida, The LPA Group Incorporated, 2009.
While state and local government jobs currently rank highest in the county, health care jobs
are expected to be the most prevalent employment sector by 2028. Professional and
technical services jobs are also expected to dramatically increase by 2028, which is consistent
with the county’s initiatives and variety of incentive programs. Employment data was
further examined specifically within the transportation sector as shown in Table 3-4.

Final 3‐9 01/11/2011 St. Lucie County International Airport Master Plan Update
TABLE 3‐4 TRANSPORTATION EMPLOYMENT
Year United States
Florida Fort Pierce‐
Port St. Lucie MSA St. Lucie County
1990 4,418,462 212,742 2,920 1,923
1991 4,423,857 214,862 2,893 1,870
1992 4,360,467 213,214 2,900 1,854
1993 4,510,504 224,939 3,097 2,019
1994 4,654,009 233,209 3,153 2,111
1995 4,765,149 241,934 3,268 2,197
1996 4,877,148 252,707 3,260 2,191
1997 4,984,481 259,611 3,275 2,220
1998 5,184,593 268,500 3,218 2,139
1999 5,344,830 280,996 3,341 2,137
2000 5,513,252 289,685 3,339 2,123
2001 5,475,692 290,780 3,426 2,166
2002 5,345,667 287,057 3,637 2,351
2003 5,296,566 285,056 2,627 1,510
2004 5,408,031 291,953 3,807 2,716
2005 5,587,769 306,007 4,388 3,150
2006 5,765,973 317,046 4,781 3,559
2007 5,829,905 321,389 4,823 3,590
2008 5,894,083 325,760 4,865 3,621
2009 5,958,752 330,179 4,905 3,651
2010 6,023,875 334,639 4,945 3,680
2011 6,089,520 339,150 4,985 3,710
2012 6,155,620 343,704 5,023 3,738
2013 6,222,265 348,308 5,062 3,767
2014 6,289,346 352,956 5,099 3,794
2015 6,356,879 357,648 5,137 3,822
2016 6,425,018 362,387 5,172 3,848
2017 6,493,544 367,180 5,208 3,874
2018 6,562,577 372,019 5,243 3,900
2019 6,632,140 376,901 5,277 3,925
2020 6,702,210 381,835 5,310 3,950
2021 6,772,746 386,819 5,342 3,973
2022 6,843,763 391,849 5,374 3,997
2023 6,915,329 396,925 5,404 4,019
2024 6,987,355 402,053 5,434 4,041
2025 7,059,938 407,234 5,463 4,062
2026 7,132,951 412,459 5,491 4,083
2027 7,206,515 417,734 5,519 4,103
2028 7,280,521 423,065 5,545 4,122
AAGR 2000‐2008 0.84% 1.48% 4.82% 6.90%
Change 2000‐2008 6.91% 12.45% 45.70% 70.56%
AAGR 2008‐2028 1.06% 1.32% 0.66% 0.65%
Change 2008‐2028 23.52% 29.87% 13.98% 13.84%
ST AAGR 1.09% 1.35% 0.80% 0.79%
MT AAGR 1.07% 1.33% 0.71% 0.70%
LT AAGR 1.04% 1.29% 0.56% 0.56%
Sources: Woods & Poole Economics, 2008 State Profile – Florida, The LPA Group Incorporated, 2009.

Final 3‐10 01/11/2011 St. Lucie County International Airport Master Plan Update
Over the past few years, transportation jobs in the county have experienced a number of
fluctuations. Although since 2004, there has been a consistent increase and stabilization
trend. This may be reflective of typical business cycles at FPR, and will subsequently be
revisited in the activity forecast effort. Forecast job growth within the transportation sector
in St. Lucie County is modest, particularly in comparison to the State of Florida and United
States as a whole.
3.3.4 Income and Earnings Per capita personal income (PCPI) specifically relates to the measure of wealth among a
sample of population. Historic numbers indicate that PCPI grew at 3.43 percent between
2000 and 2008 in the United States, as shown in Table 3-5. The PCPI of the State of Florida
and the Fort Pierce-Port St. Lucie MSA have grown at similar rates as the United States, and
the same trend is forecast to continue through 2028. However, the historic and forecast PCPI
of St. Lucie County is approximately 25 percent less than the other evaluation areas (e.g.,
approximately $30,000 in 2008 versus $40,000 for the United States). Various factors may
contribute to St. Lucie County’s comparatively low PCPI, including the large number of
retirees, former agricultural base, the ‘bedroom community’ phenomenon, and the fact that
many of the county’s largest employment sectors rank low on earnings (e.g., administrative,
real estate, accommodation/food services, and forestry) as evidenced in Table 3-3. Therefore,
it is speculative to assume that PCPI has any direct correlation to aircraft activity at FPR.
Although it may be reflective of the limited amount of non-residential development that has
occurred in the county in recent years, since business development often results in PCPI
increases, additional tax revenue, and high paying jobs.

Final 3‐11 01/18/2011 St. Lucie County International Airport Master Plan Update
TABLE 3‐5 TOTAL PER CAPITA PERSONAL INCOME (2008 $)
Year United States
Florida Fort Pierce‐
Port St. Lucie MSA St. Lucie County
1990 19,477 19,564 21,114 15,511
1991 19,892 19,780 21,061 15,652
1992 20,854 20,417 21,461 15,817
1993 21,346 21,050 21,886 16,306
1994 22,172 21,666 22,394 16,798
1995 23,076 22,691 24,020 17,871
1996 24,175 23,655 25,029 18,570
1997 25,334 24,502 26,095 19,232
1998 26,883 25,987 27,666 20,313
1999 27,939 26,894 28,695 20,930
2000 29,845 28,508 30,100 22,243
2001 30,574 29,277 31,173 22,941
2002 30,821 29,727 30,853 23,043
2003 31,504 30,330 31,232 23,403
2004 33,123 32,618 34,432 25,744
2005 34,757 34,798 36,086 26,575
2006 36,714 36,720 37,937 27,540
2007 37,743 37,656 38,127 27,766
2008 39,097 38,891 39,044 28,565
2009 40,612 40,331 40,243 29,519
2010 42,269 41,945 41,665 30,603
2011 44,068 43,726 43,292 31,814
2012 46,006 45,669 45,111 33,145
2013 48,081 47,768 47,109 34,595
2014 50,295 50,023 49,280 36,161
2015 52,653 52,438 51,626 37,848
2016 55,162 55,021 54,152 39,659
2017 57,830 57,781 56,868 41,603
2018 60,671 60,731 59,787 43,689
2019 63,694 63,885 62,922 45,926
2020 66,914 67,259 66,292 48,327
2021 70,343 70,866 69,911 50,901
2022 73,995 74,724 73,797 53,663
2023 77,890 78,854 77,973 56,626
2024 82,040 83,273 82,458 59,804
2025 86,469 88,007 87,280 63,217
2026 91,158 93,041 92,424 66,853
2027 96,118 98,387 97,903 70,722
2028 101,368 104,066 103,739 74,839
AAGR 2000‐2008 3.43% 3.96% 3.31% 3.18%
Change 2000‐2008 31.00% 36.42% 29.71% 28.42%
AAGR 2008‐2028 4.88% 5.04% 5.01% 4.93%
Change 2008‐2028 159.27% 167.58% 165.70% 162.00%
ST AAGR 4.22% 4.20% 3.83% 3.90%
MT AAGR 4.76% 4.92% 4.88% 4.78%
LT AAGR 5.27% 5.53% 5.67% 5.53%
Sources: Woods & Poole Economics, 2008 State Profile – Florida, The LPA Group Incorporated, 2009.

Final 3‐12 01/18/2011 St. Lucie County International Airport Master Plan Update
3.4 Historic and Current Activity Historic trends are one of the primary considerations that can influence activity forecasts at
an airport. By tracing these trends, it is possible to determine the impact that economic
fluctuations, as well as changes in the aviation industry, have had on activity at the airport.
The study of historic trends is particularly valuable at those airports having an active Air
Traffic Control Tower (ATCT). Historic activity at FPR includes air taxi, GA, and military
operations. However, GA operations have consistently represented the majority of airport
operations. Also, in looking at historic based aircraft levels at FPR, as well as the based
aircraft fleet mix, past development trends for aprons, hangars, and other landside facilities
can be examined to see if airport users were adequately served. Further, reviews of based
aircraft and development trends at nearby airports can also help pinpoint what may or may
not be worthwhile investments for catering to local based aircraft owners. After reviewing
historic operations and based aircraft levels, the establishment of current or baseline activity
representing 2008 conditions was presented in this section.
3.4.1 Historic and Current Operations Many elements compose the broad definition of general aviation (GA) activity. GA includes
all segments of the aviation industry except those conducted by scheduled commercial air
carriers and the U.S. military. Its activities include the training of new pilots, sightseeing,
aerial photography, law enforcement, and medical flights, as well as business, corporate, and
personal travel. GA operations are divided into the categories of local or itinerant. Local
operations are those arrivals or departures performed by aircraft that remain in the airport
traffic pattern, or those that occur within sight of the airport. This covers an area within a 20
nautical mile radius of the airfield. Local operations are most often associated with training
activity and flight instruction. Itinerant operations are arrivals or departures other than local
operations, performed by either based or transient aircraft that do not remain within the
airport traffic pattern.
The FAA defines an operation as either a single aircraft landing or takeoff. Under this
definition, touch-and-go training procedures are considered two operations (one arrival and
one departure) and are deemed local operations. Itinerant GA operations are typically
comprised of private, business/corporate, and air taxi (i.e., on-demand or for-hire service)
flight activity. Additionally, itinerant activity may include law enforcement and medical
flights. The FAA maintains historic operations data as part of their 2008 Terminal Area
Forecast (TAF) shown in Table 3-6, which presents past activity levels from 1990 through
2008. It is noted that the TAF presents forecast operational data for 2008, thus actual 2008
activity levels were confirmed based upon data provided by airport and air traffic control
personnel.
Final 3‐13 01/18/2011 St. Lucie County International Airport Master Plan Update
At FPR in 2007, the airport experienced approximately 120,000 operations, representing the
second lowest year of overall activity since 1990 besides 2006. As can be seen between 2005
and 2006, ‘local civil’ or local GA traffic decreased over 50 percent. Much of the ‘local civil’
activity consists of flight training touch-and-go operations of which numerous cycles of
landings and takeoffs can be flown by one aircraft in a short amount of time. According to
the article, Flight Schools’ End to Eliminate 107 Jobs in St. Lucie, Pan Am International
Flight Academy left FPR in the summer of 2005 and relocated to Phoenix to avoid further
hurricane related damages.8 2004 and 2005 were also busy hurricane seasons, with St. Lucie
County being hit by Hurricanes Frances and Jeanne in 2004 and Hurricane Wilma in 2005.
Occurring in the latter portion of 2004, the airport’s preliminary damage claims from
Hurricane Frances were estimated at $75 million to $100 million.9 Consequently, these
factors impacted activity levels at FPR across all sectors of flight shown in Table 3-6. These
types of factors illustrate the uncertainty of forecasting, since they represent natural events or
airport-specific business decisions that cannot necessarily be predicted in an AMPU study.
Other events, such as the terrorist attacks on September 11, 2001, record high fuel prices,
increased security measures, and rising insurance rates, have resulted in an overall decline in
GA activity around the United States. However, activity was up at FPR in 2007, and overall
activity increased by over 30,000 operations from 2007 to 2008. Thus, after a rebuilding
effort from hurricane damage, the airport shows positive signs of recovery. New businesses
are pushing significant investment into the airport as evidenced by the two new Fixed Base
Operators (FBOs), Key Air and APP Jet Center of Ft. Pierce (formerly Volo Aviation), which
both have large-scale development plans over the next several years. In discussions of
current and forecast activity provided later in this chapter, operational data in Table 3-6 was
defined by aircraft type and other pertinent forecast variables. Recent and anticipated trends
affecting aviation and Forecasts of Aviation Demand are presented in Section 3.5, Factors and Opportunities Affecting Activity Levels.
8 Flight Schools’ End to Eliminate 107 Jobs in St. Lucie, Palm Beach Post, April 8, 2005. 9 St Lucie County Assesses Damages, Palm Beach Post, September 5, 2004.

Final 3‐14 01/18/2011 St. Lucie County International Airport Master Plan Update
TABLE 3‐6 HISTORIC OPERATIONS
Year Itinerant Air
Carrier Itinerant Air Taxi
Itinerant GA
Itinerant Military
Local Civil Local
Military Total
Airport Ops
1990 0 2,004 42,649 94 104,340 6 149,093
1991 0 3,052 58,022 159 115,602 29 176,864
1992 0 2,075 69,441 211 85,131 16 156,874
1993 0 2,307 81,490 165 89,328 4 173,294
1994 0 2,540 77,484 277 73,535 64 153,900
1995 20 2,350 75,886 94 71,554 2 149,906
1996 12 2,210 64,449 34 68,531 2 135,238
1997 4 1,545 72,554 359 69,614 0 144,076
1998 0 1,503 71,974 40 70,876 0 144,393
1999 0 1,477 80,166 133 73,656 29 155,461
2000 12 1,908 84,084 87 84,335 22 170,448
2001 1 2,037 108,564 143 82,290 50 193,085
2002 0 1,783 113,296 22 78,231 0 193,332
2003 0 1,334 104,059 97 78,188 38 183,716
2004 0 1,220 104,625 91 83,014 99 189,049
2005 0 742 89,749 59 72,477 0 163,027
2006 0 677 66,785 119 35,726 12 103,319
2007 0 780 73,050 172 46,112 17 120,131
2008 0 953 85,566 96 73,400 261 160,277
Note: 2008 activity levels provided by airport records. Sources: FAA 2008 Terminal Area Forecast, airport records, The LPA Group Incorporated.
3.4.2 Historic and Current Based Aircraft The FAA’s 2008 TAF also includes historic based aircraft data for the airport, as shown in
Table 3-7. Total based aircraft levels at FPR have not experienced the same cycle of increases
and decreases as operations, although there was some variation year-to-year. Also, the high
based aircraft number in 2008 partially accounts for seasonal peaks in based aircraft;
specifically, there are several based aircraft owners that only spend a few months of the year
in Florida. Per FAA guidelines, these aircraft are generally counted as a one-half of a based
aircraft. While the overall number of based aircraft has been relatively stable, there has been
a decline in single-engine aircraft and an increase in multi-engine and jet aircraft. Some of
this change can be attributed to the loss of Pan Am International Flight Academy in 2005 and
the additional of the airport’s new FBOs. A large component of both Key Air and APP Jet
Center’s businesses include corporate charter and corporate aircraft management. It is the
intent of both organizations to attract new multi-engine turboprops and corporate jets to FPR
through large-scale hangar development. Future based aircraft growth is most highly
anticipated within the jet and turboprop categories, particularly due to the limited
availability of hangar space and high rents at airports to the south of FPR force aircraft
owners to seek available facilities elsewhere.

Final 3‐15 01/18/2011 St. Lucie County International Airport Master Plan Update
TABLE 3‐7 HISTORIC BASED AIRCRAFT
Year Single‐Engine Multi‐Engine Jet Helicopter Total Ops. Per Based AC
1990 110 60 0 2 172 867
1991 123 44 0 1 168 1,053
1992 123 44 1 1 169 928
1993 123 44 1 1 169 1,025
1994 123 44 1 1 169 911
1995 96 29 3 1 131 1,144
1996 89 25 3 2 119 1,136
1997 89 25 3 2 119 1,211
1998 89 25 3 2 119 1,213
1999 100 40 5 2 147 1,058
2000 122 44 5 3 174 980
2001 115 45 5 5 170 1,136
2002 125 50 5 5 185 1,045
2003 128 51 5 5 189 972
2004 125 50 5 5 185 1,022
2005 125 50 5 5 185 881
2006 125 50 5 5 185 558
2007 125 50 5 5 185 649
2008 122 71 14 4 211 760
Note: 2008 numbers provided by validated inventory of the National Based Aircraft Inventory Program. Sources: FAA 2008 Terminal Area Forecast, National Based Aircraft Inventory Program, The LPA Group Incorporated.
3.5 Factors and Opportunities Affecting Activity Levels In reviewing the previous 20 years of activity at FPR, many developments and changes that
have since occurred were not anticipated in any forecast at that time. As described
throughout this chapter, evolution of technology and business practices has resulted in
gradual changes, while economic events and natural disasters have also impacted demand.
Although many of these factors cannot be forecast, they were considered in the evaluation
and selection the preferred forecast for this AMPU study.
3.5.1 Natural Disasters As previously mentioned, FPR was hit by Hurricane Frances and Jeanne in 2004 and
Hurricane Wilma in 2005, with preliminary damage claims from Hurricane Frances
estimated at $75 million to $100 million. Consequently, Pan Am International Flight
Academy left FPR in the summer of 2005 and relocated to Phoenix to avoid further hurricane
damage. Natural disasters such as hurricanes can have a major impact on airports; they can
suspend service, cause significant damage, and subsequently result in the loss of revenues and
businesses.

Final 3‐16 01/18/2011 St. Lucie County International Airport Master Plan Update
3.5.2 Terrorism/Security As evidenced by the events of September 11, 2001, and the British bomb plot in 2006 with
the proceeding liquids ban, terrorism and security issues are a current and serious threat to
aviation demand. Before the recent economic recession at the end of 2008, commercial
service demand had recovered to pre-9/11 demand. However, both 9/11 and the British
bomb plot have impacted airport security procedures. The level and type of threats
impacting commercial and general aviation is ever changing. Therefore, airport security is in
a state of flux. Due in part to these events, the Transportation Security Administration (TSA)
is also proposing stricter security measures for GA airports and aircraft operators which may
affect future aviation demand.
The TSA recently proposed a Large Aircraft Security Program (LASP) for operators of aircraft
with maximum takeoff weights exceeding 12,500 pounds such as corporate jets. According to
the TSA, the purpose of the LASP would be to enhance GA security by developing a
comprehensive strategy to: “establish baseline standards of security for GA operations; ensure
that flight crews have undergone a fingerprint-based criminal history records and terrorist
name check; designate security coordinators; conduct watch list matching of passengers
through TSA-approved watch list matching service provider; and check/validate property on
board for unauthorized persons and accessible weapons.”10 The LASP proposal has been faced
with extreme criticism within the aviation community, since the associated security
standards would essentially place commercial standards onto GA and air charter operations.
Further, charter operators argue that they are familiar with every passenger, and that the
LASP proposal would significantly impact their business.11 While the LASP proposal is still
under review, it is anticipated that the opposition to the proposal will result in the TSA
developing a revised plan for large aircraft security.
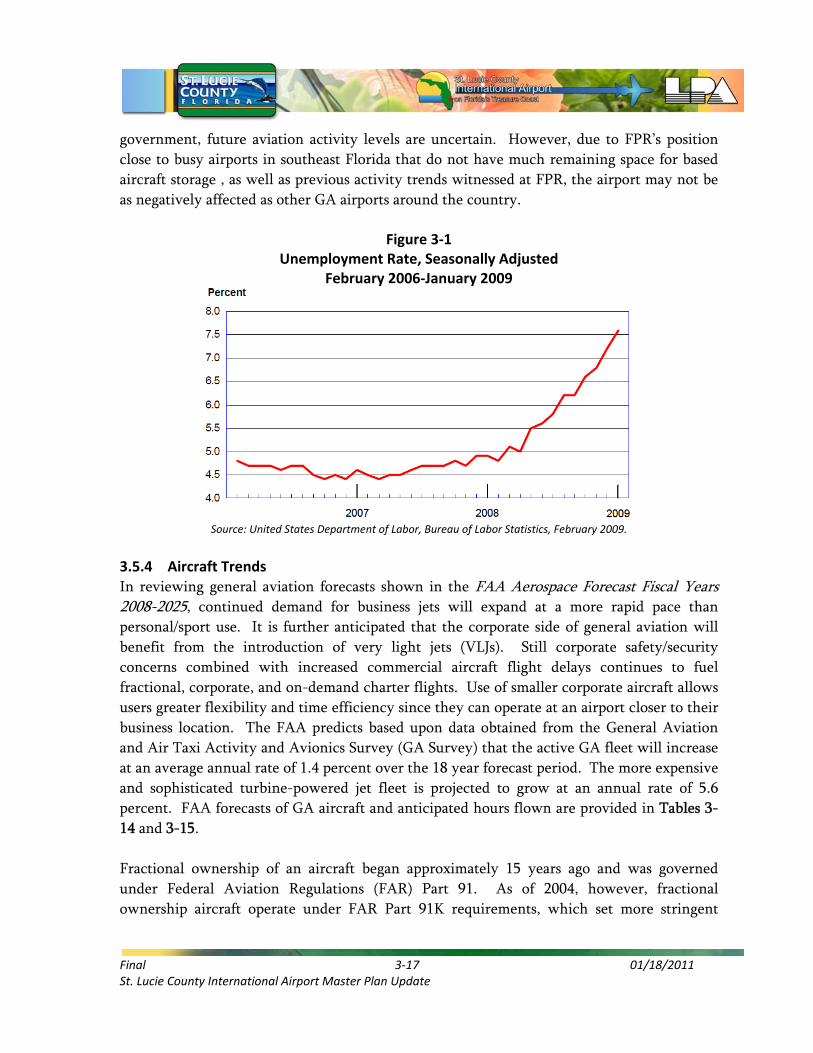
3.5.3 Economic Conditions As mentioned earlier, in 2008 and the beginning of 2009, there was an overall decline in GA
and commercial airline activity in the United States and around the world, which was caused
by declining economies and stock markets, bankruptcies, foreclosures, and record high fuel
prices. As shown in Figure 3-1, the unemployment rate in the United States grew to 7.6
percent in January 2009, and according to the Department of Labor (DOL), approximately 3.6
million jobs were been lost in the United States since the current recession began in
December 2007.12 Still, with talks of a major financial rescue plan from the federal
10 TSA Press Release, TSA Proposes Large Aircraft Security Program: Proposal to Achieve Comprehensive General Aviation Security, October 9, 2009. 11 AOPA Online, TSA plan would cripple more than large aircraft operators, January 26, 2009. 12 Source: United States Department of Labor, Bureau of Labor Statistics, February 2009.
Final 3‐17 01/18/2011 St. Lucie County International Airport Master Plan Update
government, future aviation activity levels are uncertain. However, due to FPR’s position
close to busy airports in southeast Florida that do not have much remaining space for based
aircraft storage , as well as previous activity trends witnessed at FPR, the airport may not be
as negatively affected as other GA airports around the country.
Figure 3‐1 Unemployment Rate, Seasonally Adjusted
February 2006‐January 2009
Source: United States Department of Labor, Bureau of Labor Statistics, February 2009.
3.5.4 Aircraft Trends In reviewing general aviation forecasts shown in the FAA Aerospace Forecast Fiscal Years 2008-2025, continued demand for business jets will expand at a more rapid pace than
personal/sport use. It is further anticipated that the corporate side of general aviation will
benefit from the introduction of very light jets (VLJs). Still corporate safety/security
concerns combined with increased commercial aircraft flight delays continues to fuel
fractional, corporate, and on-demand charter flights. Use of smaller corporate aircraft allows
users greater flexibility and time efficiency since they can operate at an airport closer to their
business location. The FAA predicts based upon data obtained from the General Aviation
and Air Taxi Activity and Avionics Survey (GA Survey) that the active GA fleet will increase
at an average annual rate of 1.4 percent over the 18 year forecast period. The more expensive
and sophisticated turbine-powered jet fleet is projected to grow at an annual rate of 5.6
percent. FAA forecasts of GA aircraft and anticipated hours flown are provided in Tables 3-
14 and 3-15.
Fractional ownership of an aircraft began approximately 15 years ago and was governed
under Federal Aviation Regulations (FAR) Part 91. As of 2004, however, fractional
ownership aircraft operate under FAR Part 91K requirements, which set more stringent
Final 3‐18 01/18/2011 St. Lucie County International Airport Master Plan Update
requirements including regulations concerning runway length requirements. Aircraft
fractional ownership is defined as shared ownership of an aircraft by corporations, businesses
and individuals who purchase a certain number of aircraft hours related to a specific aircraft
(e.g., Cessna 560). Growth in fractional ownership according to both FAA and industry
forecasts will continue to grow. Fractional ownership aircraft fly about 1,200 hours annually
compared to approximately 350 hours for all business jets in all applications.13
VLJs, often referred to as microjets, are newly certified aircraft which are based upon a
combination of new jet engine technology and sophisticated avionics equipment. VLJs
typically hold between four to six passengers and can be used for trips of 500 nautical miles
or less. The impetus of VLJs was to provide users the option of using smaller GA airports
closer to the ultimate destination. These aircraft are Stage 4 noise certified, and during dry
pavement and average temperatures can operate on shorter runways. According to FAA,
growth in VLJs worldwide is expected to exceed 8,000 aircraft by 2025. It is anticipated that
because of its lower costs, VLJs will eventually replace twin-piston and turboprop aircraft.
However, demand for larger cabins and longer haul length will continue to drive demand for
light, medium and heavy corporate jet aircraft in support of the global business community.
Also, certification issues, as well as the current economic climate, are slowing the influx of
VLJs into the nation’s GA airports.
3.5.5 Airspace Modernization/NextGen As described in Chapter 2, Inventory of Existing Conditions, in an effort to reduce congestion
around the country, the FAA is evaluating the implementation of the Next Generation Air
Transportation System (NextGen), which is a “plan to modernize the National Airspace
System (NAS) through 2025. Through NextGen, the FAA is addressing the impact of air
traffic growth while simultaneously improving safety, environmental impacts, and user
access to the NAS.”14 As part of the plan, the FAA has already implemented upgrades to the
southeast Florida airspace by publishing new Area Navigation (RNAV) paths (i.e., GPS-
guided point-to-point paths) which allow for more efficient aircraft travel with reduced
delay. These upgrades are the initial efforts of the NextGen plan, and the FAA intends to
roll-out new technologies and airspace reconfigurations in the future. Chapter 4, Demand Capacity/Facility Requirements, further describes the anticipated effect NextGen’s
implementation will have on air traffic around FPR.
3.5.6 Potential for Commercial Airline Service In April 2008, Port St. Lucie officials formed a committee to determine the need and viability
of either developing a new commercial airport within the Treasure Coast region or upgrading
13 FAA Aerospace Forecast Fiscal Years 2008‐2025, page 41 14 FAA NextGen Fact Sheet, October 29, 2008.

Final 3‐19 01/18/2011 St. Lucie County International Airport Master Plan Update
FPR to provide commercial service. The Treasure Coast region is one of only two regions in
Florida without a commercial service airport. This issue of converting FPR to a commercial
service airport was last evaluated in 2002, during the last master plan update. It was
determined at that time for the airport to remain a general aviation facility.
However, in November 2007, DayJet, an on-demand air taxi operator, provided several
services and flights at FPR before filing for bankruptcy and discontinuing service in
September 2008. Still companies and population are migrating northward to St. Lucie
County from South Florida as a result of continued congestion at West Palm Beach
International (PBI), Ft. Lauderdale International (FLL) and Miami International (MIA)
Airports.
Based upon these discussions, the viability of commercial service at FPR was evaluated as part
of this Master Plan Update. As noted in several previous documents, commercial demand
could be associated with local demand as well as potential passenger “leakage” from the South
Florida market. However, in order to effectively pursue commercial service under FAR Part
139 certification, installation and development of several facilities would need to be pursued.
These facilities are identified in Chapter 4, Demand/Capacity and Facility Requirements. However, because of the nature of commercial service in South Florida and limited historic
information, accurate commercial operations and passenger demand could not be forecast.
As a result, commercial demand was not included as part of this forecast analyses.
3.6 Regression Analyses and Socioeconomic Correlation Often times, a correlation can be made between historic airport activity and historic
socioeconomic characteristics, which were presented in earlier sections of this chapter. In
order to test if such a correlation exists, regression analysis is used to determine if an
independent variable (X) can be used to predict a dependent variable (Y). Some regression
analyses provide strong correlations (e.g., a comparison of automobile insurance rates to
population within a square mile). The increased traffic in higher populated areas results in an
additional number of accidents, thefts, etc. and, therefore, causes insurance rates to increase.
In this example, the population per square mile would be the independent variable, whereas
the cost of insurance would be the dependent variable. The independent variable in aviation
forecasting is typically a socioeconomic characteristic (e.g., population or employment),
while the dependent variable is generally passenger enplanements, airport operations or
based aircraft.
According to the FAA Report, Forecasting Aviation Activity by Airport (July 2001), the
ability of an independent variable to predict a dependent variable is measured by the
‘Coefficient of Determination’ or ‘R-Squared’ (R2) regression statistic. “An R2 of 0.0 indicates

Final 3‐20 01/18/2011 St. Lucie County International Airport Master Plan Update
that there is no statistical relationship between changes in the independent and dependent
variables. R2 values near 1.0 mean there is a very strong statistical relationship.” 15 The R2
value “measures the percent of the variation in Y [e.g., historic change in airport activity]
that is explained by the variation in X [e.g., historic change in population].”16 In aviation
forecasting, an R2 value of 90 percent or greater should be achieved for the independent
variable (X) to be considered a confident predictor of the dependent variable (Y).
In the case of FPR, the independent variables (X) are comprised of total population, total
employment, transportation employment, and total per capita personal income (PCPI) for St.
Lucie County, and the dependent variables (Y) are the number of annual operations and
based aircraft. The objective of the regression analyses was to determine if a correlation
existed between historic socioeconomic variables and historic airport activity. If such a
correlation were to exist (i.e., producing an R2 value of 90 percent or greater), then it is likely
that forecasts of the socioeconomic variables could be used to determine future airport
activity. The regression analyses were performed for two separate time periods, between
1990 and 2008 and also between 2000 and 2008. By evaluating historical relationships over a
long-term and short-term period, we can better understand the types of national, state, and
local factors that have the potential to influence airport activity. The regression analyses for
FPR produced the R2 values in Table 3-8.
TABLE 3‐8 REGRESSION ANALYSIS – SOCIOECONOMIC CHARACTERISTICS
Socioeconomic Variable (X Variable)
Operations (Y Variable) Based Aircraft (Y Variable)
1990‐2008 2000‐2008 1990‐2008 2000‐2008
Total Population – R2 Value 4.65% 50.00% 31.20% 51.87%
Total Employment – R2 Value 3.35% 47.56% 39.30% 47.53%
Trans. Employment – R2 Value 21.12% 55.16% 18.74% 22.75%
Total PCPI – R2 Value 1.01% 48.56% 29.43% 43.75%
Source: The LPA Group Incorporated, January 2009.
As shown, none of the evaluated historic socioeconomic characteristic of St. Lucie County
produced a good correlation (i.e., R2 value of 90 percent or greater) with historic operations
and based aircraft levels at FPR. In looking at historic operations (Table 3-6), there are
several cycles of annual increases and decreases that can be explained by incoming or
outgoing businesses, hurricane damage, and national economic conditions. Consequently,
the general increase in population, employment, and PCPI over time does not correlate well
with the cyclical aircraft operations levels. Further, St. Lucie County’s transportation
employment levels between 2000 and 2008 were shown to have the highest correlation with
operations levels, producing an R2 value of 55.16 percent. However, all regression analyses
for operations produced a negative sloping trend line due to high variation and minimal
15 FAA Forecasting Aviation Activity by Airport, July 2001. 16 Basic Statistics for Business and Economics, Third Edition, 2000.
Final 3‐21 01/18/2011 St. Lucie County International Airport Master Plan Update
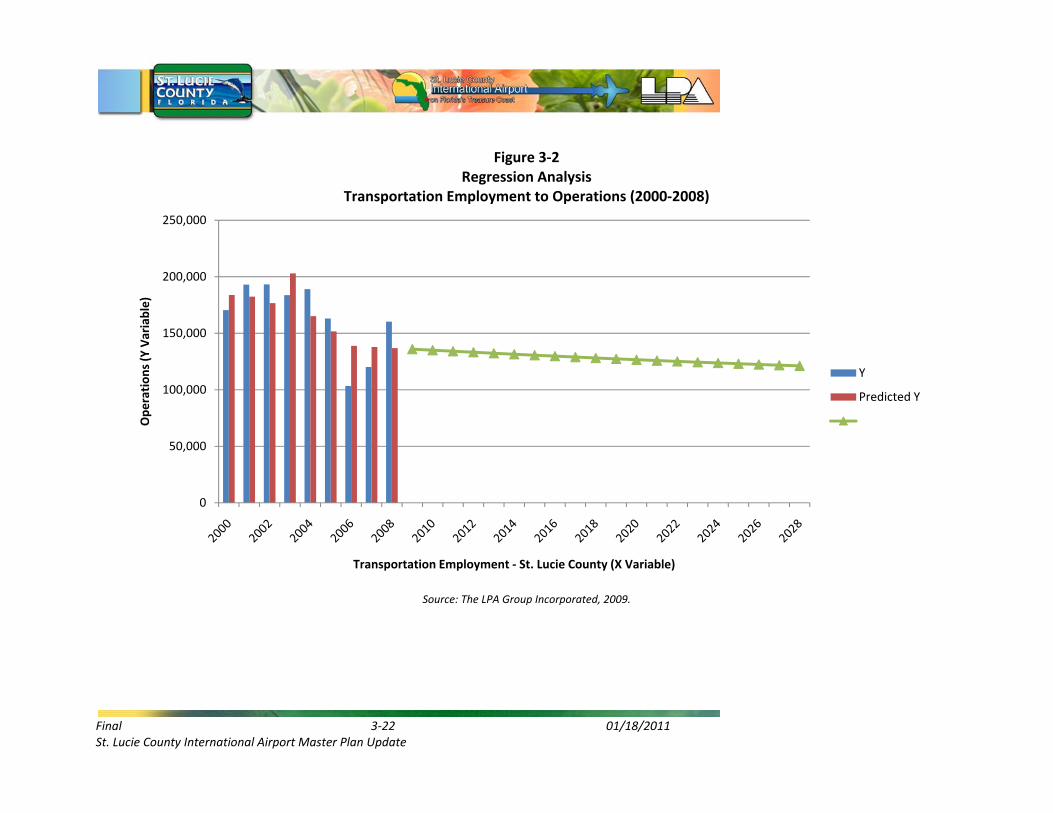
overall activity growth during the evaluation periods. Although not presented herein, this
trend also occurred when regression was performed using socioeconomic data for the United
States, State of Florida, and Fort Pierce-Port St. Lucie MSA. Subsequently, the use of
regression analysis for predicting future operations at FPR would result in a negative growth
forecast as shown in Figure 3-2, and may therefore be an ineffective method of evaluating
future aviation demand. Specific factors, such as the construction of the new training
Runway 10L-28R and large-scale development plans by the FBOs, are among the reasons
why a negative growth forecast may not be realistic.
Similar to historic operations levels at FPR, historic based aircraft levels (Table 3-7) have
experienced cycles of increases and decreases over the years. Consequently, the cyclical
nature of based aircraft in earlier years (i.e., 1994 to 2000) resulted in the low R2 regression
values shown in Table 3-8, specifically because population, employment, and PCPI were
generally increasing year-after-year – total population levels between 2000 and 2008
illustrated the highest correlation with based aircraft levels, producing an R2 value of 51.87
percent. As depicted in Figure 3-3, the associated trend line formulas produced low growth
scenarios, in addition to very low confidence/R2 values, for predicting future based aircraft
levels at FPR.
It is noted that regression analysis often produces more confident results for commercial
airports than GA airports. Specifically, a correlation can often be seen between historic
population and historic commercial passenger enplanements (i.e., the number of passengers
that fly in a year). Therefore, the results of the regression analyses for FPR are not
uncommon of GA airports.
Final 3‐22 01/18/2011 St. Lucie County International Airport Master Plan Update
Figure 3‐2
Regression Analysis Transportation Employment to Operations (2000‐2008)
Source: The LPA Group Incorporated, 2009.
0
50,000
100,000
150,000
200,000
250,000
Operations (Y Variable)
Transportation Employment ‐ St. Lucie County (X Variable)
Y
Predicted Y

Final 3‐23 01/18/2011 St. Lucie County International Airport Master Plan Update
Figure 3‐3
Regression Analysis Total Population to Based Aircraft (2000‐2008)
Source: The LPA Group Incorporated, 2009.
0
50
100
150
200
250
Based Aircraft (Y Variable)
Total Population ‐ St. Lucie County (X Variable)
Y
Predicted Y
Predicted Values

Final 3‐24 01/18/2011 St. Lucie County International Airport Master Plan Update
3.7 Previous Forecasting Efforts As previously described in Section 3.5, Factors and Opportunities Affecting Activity Levels, several factors and trends may negatively or positively affect future activity levels at FPR.
Therefore, it is important to consider previous forecasting efforts to determine if they are
consistent with current airport activity levels and anticipated trends. The following
forecasting efforts are evaluated in this section:
2008 FAA Terminal Area Forecast (TAF)
2002 Airport Master Plan Update (AMPU)
2005 FAR Part 150 Noise Study Update
2004 Florida Aviation System Plan (FASP), updated March 2007
FAA Aerospace Forecasts (2008-2025)
3.7.1 2008 FAA Terminal Area Forecast (TAF) Every year, the FAA prepares detailed Terminal Area Forecasts (TAF) for airports included in
the National Plan of Integrated Airport Systems (NPIAS). Typically, the TAF projects airport
operations and based aircraft, as well as passenger enplanements for commercial service
airports, over a 17 to 20-year planning period. In developing the TAF, the FAA’s
methodologies involve regression analysis of national economic indicators and industry
trends, though the forecast typically lacks an in-depth analysis of specific airport issues in its
composition. As described later in this chapter, the TAF is used by FAA as a benchmark in
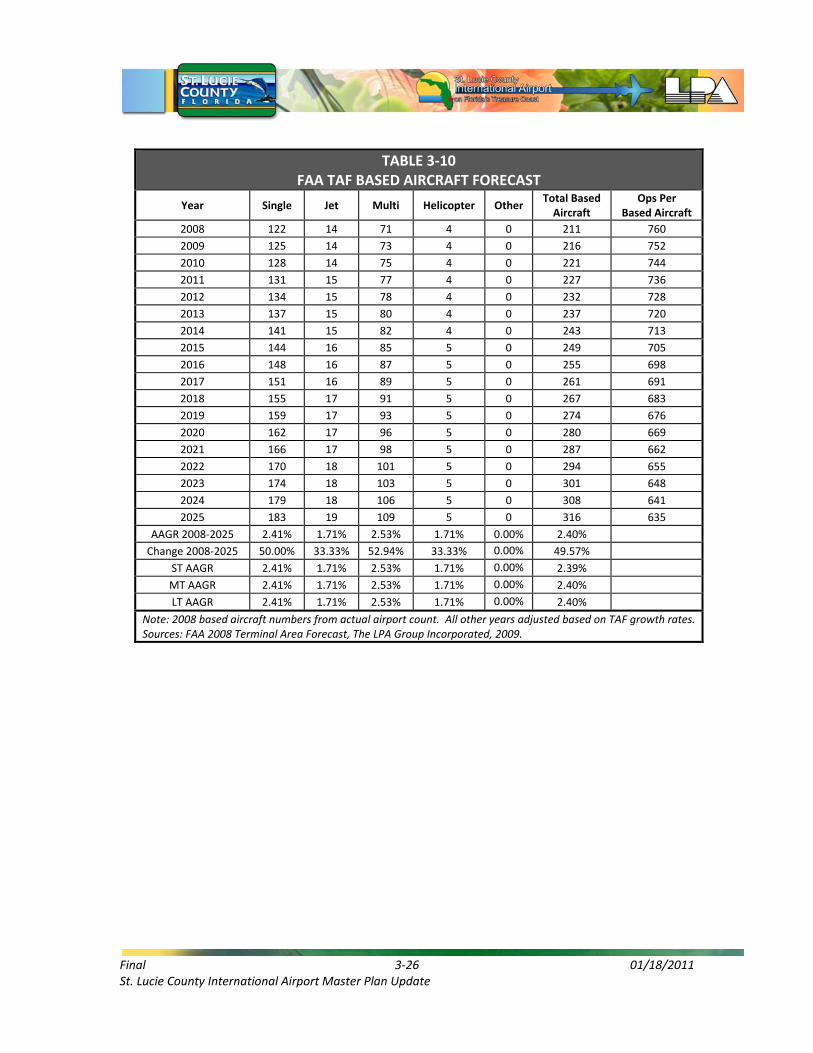
evaluating detailed airport forecasts. FPR’s TAF for operations is shown in Table 3-9 and for
based aircraft in Table 3-10. The TAF for based aircraft has been adjusted to reflect actual
based aircraft counts in 2008.
The FAA projects operations to grow at an average annual growth rate (AAGR) of 1.32
percent between 2008 and 2025, whereas based aircraft are projected to increase at an AAGR
of 2.4 percent during that same period. Therefore, as shown in Table 3-10, the number of
operations per based aircraft (OPBA) is expected to decrease throughout the forecast period.
This is consistent with recent aviation trends, where aircraft are flying longer distances with
fewer stopovers to maximize fuel efficiency. It is also important to note that the FAA TAF
does not forecast Itinerant Air Taxi or Military operations above the base year (2008)
operations primarily due to limited data and trends within the industry.

Final 3‐25 01/18/2011 St. Lucie County International Airport Master Plan Update
TABLE 3‐9 FAA TAF OPERATIONS FORECAST
Year Itinerant Air
Carrier Itinerant Air Taxi
Itinerant GA
Itinerant Military
Local Civil
Local Military
Total Airport Ops
2008 0 953 85,566 96 73,400 261 160,277
2009 0 953 86,456 96 74,613 261 162,380
2010 0 953 87,356 96 75,846 261 164,512
2011 0 953 88,265 96 77,099 261 166,674
2012 0 953 89,183 96 78,373 261 168,866
2013 0 953 90,110 96 79,668 261 171,089
2014 0 953 91,048 96 80,985 261 173,343
2015 0 953 91,995 96 82,323 261 175,628
2016 0 953 92,952 96 83,683 261 177,945
2017 0 953 93,919 96 85,066 261 180,295
2018 0 953 94,896 96 86,471 261 182,677
2019 0 953 95,883 96 87,900 261 185,093
2020 0 953 96,880 96 89,353 261 187,543
2021 0 953 97,888 96 90,829 261 190,027
2022 0 953 98,906 96 92,330 261 192,547
2023 0 953 99,935 96 93,855 261 195,101
2024 0 953 100,975 96 95,406 261 197,691
2025 0 953 102,025 96 96,983 261 200,318
AAGR 2008‐2025 0.00% 0.00% 1.04% 0.00% 1.65% 0.00% 1.32%
Change 2008‐2025 0.00% 0.00% 19.24% 0.00% 32.13% 0.00% 24.98%
ST AAGR 0.00% 0.00% 1.04% 0.00% 1.65% 0.00% 1.31%
MT AAGR 0.00% 0.00% 1.04% 0.00% 1.65% 0.00% 1.32%
LT AAGR 0.00% 0.00% 1.04% 0.00% 1.65% 0.00% 1.33%
Note: 2008 operations numbers from actual airport count. All other years adjusted based on TAF growth rates. Sources: FAA 2008 Terminal Area Forecast, The LPA Group Incorporated, 2009.
Final 3‐26 01/18/2011 St. Lucie County International Airport Master Plan Update
TABLE 3‐10 FAA TAF BASED AIRCRAFT FORECAST
Year Single Jet Multi Helicopter Other Total Based Aircraft
Ops Per Based Aircraft
2008 122 14 71 4 0 211 760
2009 125 14 73 4 0 216 752
2010 128 14 75 4 0 221 744
2011 131 15 77 4 0 227 736
2012 134 15 78 4 0 232 728
2013 137 15 80 4 0 237 720
2014 141 15 82 4 0 243 713
2015 144 16 85 5 0 249 705
2016 148 16 87 5 0 255 698
2017 151 16 89 5 0 261 691
2018 155 17 91 5 0 267 683
2019 159 17 93 5 0 274 676
2020 162 17 96 5 0 280 669
2021 166 17 98 5 0 287 662
2022 170 18 101 5 0 294 655
2023 174 18 103 5 0 301 648
2024 179 18 106 5 0 308 641
2025 183 19 109 5 0 316 635
AAGR 2008‐2025 2.41% 1.71% 2.53% 1.71% 0.00% 2.40%
Change 2008‐2025 50.00% 33.33% 52.94% 33.33% 0.00% 49.57%
ST AAGR 2.41% 1.71% 2.53% 1.71% 0.00% 2.39%
MT AAGR 2.41% 1.71% 2.53% 1.71% 0.00% 2.40%
LT AAGR 2.41% 1.71% 2.53% 1.71% 0.00% 2.40%
Note: 2008 based aircraft numbers from actual airport count. All other years adjusted based on TAF growth rates.Sources: FAA 2008 Terminal Area Forecast, The LPA Group Incorporated, 2009.
Final 3‐27 01/18/2011 St. Lucie County International Airport Master Plan Update
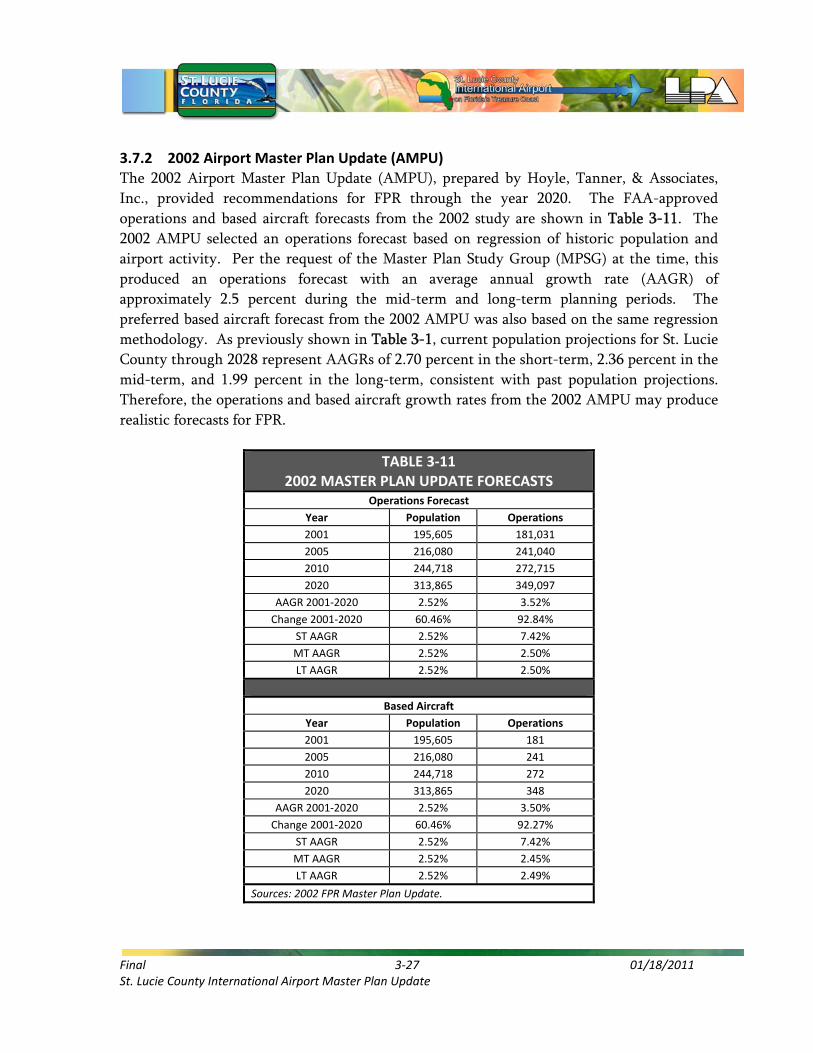
3.7.2 2002 Airport Master Plan Update (AMPU) The 2002 Airport Master Plan Update (AMPU), prepared by Hoyle, Tanner, & Associates,
Inc., provided recommendations for FPR through the year 2020. The FAA-approved
operations and based aircraft forecasts from the 2002 study are shown in Table 3-11. The
2002 AMPU selected an operations forecast based on regression of historic population and
airport activity. Per the request of the Master Plan Study Group (MPSG) at the time, this
produced an operations forecast with an average annual growth rate (AAGR) of
approximately 2.5 percent during the mid-term and long-term planning periods. The
preferred based aircraft forecast from the 2002 AMPU was also based on the same regression
methodology. As previously shown in Table 3-1, current population projections for St. Lucie
County through 2028 represent AAGRs of 2.70 percent in the short-term, 2.36 percent in the
mid-term, and 1.99 percent in the long-term, consistent with past population projections.
Therefore, the operations and based aircraft growth rates from the 2002 AMPU may produce
realistic forecasts for FPR.
TABLE 3‐11 2002 MASTER PLAN UPDATE FORECASTS
Operations Forecast
Year Population Operations
2001 195,605 181,031
2005 216,080 241,040
2010 244,718 272,715
2020 313,865 349,097
AAGR 2001‐2020 2.52% 3.52%
Change 2001‐2020 60.46% 92.84%
ST AAGR 2.52% 7.42%
MT AAGR 2.52% 2.50%
LT AAGR 2.52% 2.50%
Based Aircraft
Year Population Operations
2001 195,605 181
2005 216,080 241
2010 244,718 272
2020 313,865 348
AAGR 2001‐2020 2.52% 3.50%
Change 2001‐2020 60.46% 92.27%
ST AAGR 2.52% 7.42%
MT AAGR 2.52% 2.45%
LT AAGR 2.52% 2.49%
Sources: 2002 FPR Master Plan Update.

Final 3‐28 01/18/2011 St. Lucie County International Airport Master Plan Update
3.7.3 2005 FAR Part 150 Noise Study Update The 2005 Federal Aviation Regulations (FAR) Part 150 Noise Study Update, prepared by the
MEA Group, Inc., provided FAA-approved operations forecasts through 2010 and
recommended noise abatement measures for FPR. Forecasts of based aircraft are not required
in a Noise Study. As shown in Table 3-12, the Noise Study forecasts were based on earlier
forecasts developed as part of the 2001 Environmental Assessment (EA) associated with
training Runway 10L-28R (formerly 9L/27R), which used the FAA’s TAF and added a 10
percent growth factor to account for potential growth. Consequently, in reviewing the Noise
Study forecasts, which show an AAGR associated with aircraft operations of 4.29 percent
between 2003 and 2010 (under the ‘revised total’ column), there does not appear to be any
resemblance to recent and current activity levels at FPR. Although at the time the Noise
Study forecasts were derived, such a high growth rate could have reasonably been expected
due to the presence of Pan Am International Flight Academy, site plan approvals for
industrial development, and the overall economic climate. Therefore, this high growth
factor should be considered in the operations forecast since it accounts for potential cycles of
quick growth that may occur.
TABLE 3‐12 2002 FAR PART 150 NOISE STUDY UPDATE FORECASTS
Year Itinerant Ops Local Ops Total
Ops Night Ops Revised Total Avg. Annual Day
Air Taxi GA Mil GA Mil
2003 1,329 103,639 92 78,197 12 183,269 8,808 192,077 526
2004 1,334 124,862 97 93,691 38 220,022 9,681 229,703 629
2005 1,334 128,005 97 96,025 38 225,499 9,922 235,421 645
2009 1,334 137,821 97 103,309 38 242,599 10,674 253,273 694
2010 1,334 140,275 97 105,131 38 246,875 10,863 257,738 706
AAGR 2003‐2010 0.05% 4.42% 0.76% 4.32% 17.90% 4.35% 3.04% 4.29% 4.29%
Change 2003‐2010 0.38% 35.35% 5.43% 34.44% 216.67% 34.71% 23.33% 34.18% 34.18%
AAGR 2005‐2010 0.00% 1.85% 0.00% 1.83% 0.00% 1.83% 1.83% 1.83% 1.83%
Sources: 2005 FPR Noise Study Update.
3.7.4 2004 Florida Aviation System Plan (FASP) The Florida Aviation System Plan (FASP) is the result of an ongoing project performed in
conjunction with the Florida Department of Transportation (FDOT) and the FAA to
continually monitor and evaluate the progress of aviation in the State of Florida. The process
is ongoing with various parts and phases, such as forecast and facility requirements, are
periodically updated. The most recent FASP Forecast for FPR has a base year of 2004 and
extends to year 2024 as shown in Table 3-13. With an average annual growth rate of 1.45
percent for activity over the twenty-year forecast period (i.e., an increase of approximately
65,000 annual operations by 2024), the FASP forecast illustrates a modest growth scenario for
FPR. Further, the FASP notes airport tenants’ plans to develop new hangars and also the

Final 3‐29 01/18/2011 St. Lucie County International Airport Master Plan Update
construction of new training Runway 10L/28R (formerly referred to as 9L-27R) as factors
contributing to growth at FPR.
TABLE 3‐13 FASP FORECASTS
Year Based Aircraft Operations
2004 256 195,309
2009 283 209,886
2014 312 225,550
2024 380 260,473
AAGR 2004‐2024 1.99% 1.45%
Change 2004‐2024 48.44% 33.36%
ST AAGR 2.03% 1.45%
MT AAGR 1.97% 1.45%
LT AAGR 1.99% 1.45%
Source: Florida Aviation System Plan.
3.7.5 FAA Aerospace Forecasts (2008‐2025) The FAA also publishes its national Aerospace Forecasts annually in March. This forecast
provides a 17-year projection of aviation activity at the national level, taking into account
global and national economic activity and aviation industry trends in aircraft manufacturing,
advanced technology, and the operational characteristics of general aviation, commercial,
and charter sectors of aviation. The FAA Aerospace Forecasts include projected growth rates
for the GA hours flown (Table 3-14), which may be applied to determine future airport
operations. The FAA Aerospace Forecasts also provides projected growth rates for the active
GA fleet (Table 3-15), which may be applied to determine future based aircraft fleet mix
levels. Unlike the specific TAF for FPR, the FAA Aerospace Forecasts is a national forecast
and, therefore, shows greater operational growth than based aircraft. This is another national
trend that was incorporated into the forecast effort.

Final 3‐30 01/18/2011 St. Lucie County International Airport Master Plan Update
TABLE 3‐14 FAA AEROSPACE GROWTH FORECAST
ACTIVE GENERAL AVIATION AND AIR TAXI HOURS FLOWN
Period Piston Turbine
Rotor
Experimental
Sport
Other
Total Single Multi Turboprop Jet*
AAGR 2000‐07 ‐4.1% ‐4.1% 1.4% 6.9% 6.7% ‐0.5% N/A ‐7.6% ‐1.2%
AAGR 2007‐10 ‐0.5% ‐1.5% 1.4% 12.2% 4.9% 2.7% 30.1% 1.2% 2.8%
AAGR 2010‐20 0.9% ‐1.8% 1.2% 8.1% 3.0% 2.7% 11.1% 0.3% 3.1%
AAGR 2007‐25 1.0% ‐1.2% 1.2% 7.7% 3.1% 2.5% 12.1% 0.5% 3.0%
Note: *Jet aircraft growth includes very light jets. Source: FAA Aerospace Forecast 2008‐2025, Table 28, March 2008.
TABLE 3‐15 FAA AEROSPACE GROWTH FORECAST
ACTIVE GENERAL AVIATION AND AIR TAXI AIRCRAFT FLEET
Period Piston Turbine
Rotor
Experimental
Sport
Other
Total Single Multi Turboprop Jet
AAGR 2000‐07 ‐0.5% ‐1.8% 5.2% 6.7% 4.4% 2.3% N/A ‐0.7% 0.5%
AAGR 2007‐10 ‐0.1% ‐0.9% 1.5% 8.9% 5.3% 3.2% 27.5% 0.7% 1.4%
AAGR 2010‐20 0.4% ‐0.9% 1.7% 5.8% 3.0% 2.2% 9.0% ‐0.2% 1.4%
AAGR 2007‐25 0.5% ‐0.9% 1.6% 5.6% 3.1% 2.2% 9.9% 0.0% 1.4%
Source: FAA Aerospace Forecast, 2008‐2025, Table 27, March 2008.
3.8 Applied Forecasts The preparation of forecasts for GA airports can often be more complex, and at the same time
more uncertain, than preparing forecasts for a commercial service airport. As mentioned
earlier, commercial activity tends to have a strong correlation with historic population or
employment growth within a region, whereas general aviation activity may have no obvious
link to these socioeconomic characteristics. Consequently, to determine realistic GA
forecasts, it is necessary to take an in-depth look at the available airport property, tenant
expansion plans, location within the country, and community growth plans. Various
forecasting methods are presented in this chapter, some of which are based on national, state,
and local trends including the following:
Growth rates of forecast socioeconomic characteristics – forecasts of St. Lucie County’s
total population, total employment, transportation employment, and PCPI were used to
determine AAGRs for the short (2008-2013), mid (2014-2018), and long-term (2019-
2028) planning periods. In this section, the associated AAGRs are applied to existing
airport activity to determine forecast activity levels through 2028.

Final 3‐31 01/18/2011 St. Lucie County International Airport Master Plan Update
Regression analyses of historic socioeconomic characteristics and airport activity –
regression analyses were conducted to identify whether a correlation existed between St.
Lucie County’s historic socioeconomic characteristics and historic airport activity.
Although no confident correlation could be identified (i.e., R2 value of 90 percent or
greater), the historic socioeconomic characteristics which produced the highest R2 values
were identified as Transportation Employment (2000-2008) for operations and Total Operations (2000-2008) for based aircraft. In this section, the AAGRs associated with the
identified trend line formulae are applied to existing airport activity to determine forecast
activity levels through 2028.
Growth rates of previous forecast efforts for FPR – the AAGRs from previous forecasting
efforts, including the 2008 FAA TAF, 2002 AMPU, 2005 Noise Study Update, 2004 FASP,
and 2008-2025 FAA Aerospace Forecasts were used to determine forecast airport activity.
Average operations per based aircraft – the selected operations forecast was divided by
the ‘2008 Operations Per Based Aircraft’ value of 760 (shown in Table 3-7) to forecast
based aircraft levels.
As described in the sections below, ten different forecasting methods were utilized to
determine future operations and based aircraft at FPR. Although some methods have their
strengths and weaknesses, such as a low statistical confidence or previous miscalculation (i.e.,
previous forecast not coming to fruition), it is unfair to assume that one method would
provide a more likely outcome than another. Based on the review of historic airport activity,
it appears that FPR’s year-over-year activity has been most significantly influenced by
unexpected local factors like hurricane damage and business loss. Therefore, three different
forecasting scenarios are presented in this section – Low Growth, Medium Growth, and High
Growth. However, only one forecast is selected as the Preferred Forecast, which is used to
determine long-term requirements and development alternatives for the airport.
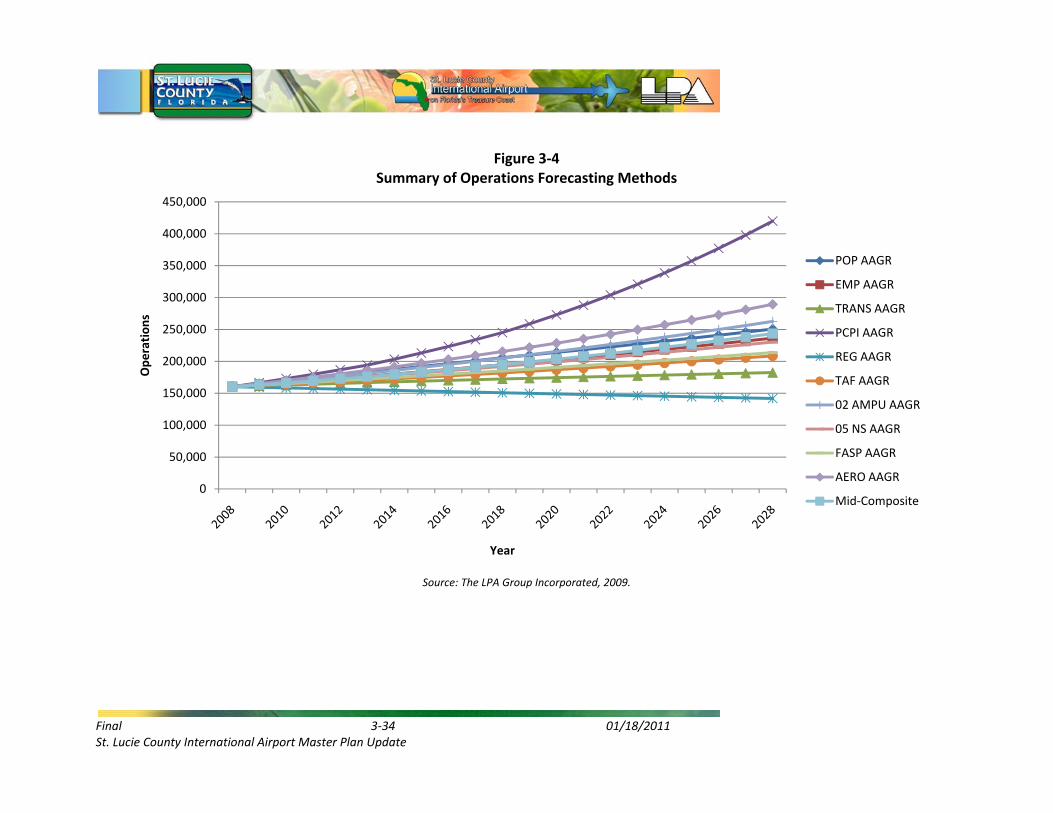
3.8.1 Forecast Operations Table 3-16 summarizes the ten different forecasting methods for operations at FPR, and also
presents a ‘Composite Forecast’ representing the average of the ten methods – the blue rows
are forecasts with lower end values than the ‘Composite Forecast’ and the green rows are
forecasts with higher end values than the ‘Composite Forecast’. This information is also
graphically depicted in Figure 3-4. The ‘Composite Forecast’ produces a median growth
projection for FPR operations, increasing operations by 2.11 percent annually or nearly
79,000 over the twenty-year period, and it also incorporates national, state, and local trends.
As previously shown in Table 3-6, the ‘Composite Forecast’ in 2028 only exceeds operations
levels in 2002 (i.e., the busiest recorded year at FPR) by approximately 37,000. Further, it
produces an end forecast lower than the 2002 Master Plan Update (349,097 by 2020), 2005
Noise Study Update (257,738 by 2010), and FASP (260,473 by 2024), and only slightly higher

Final 3‐32 01/18/2011 St. Lucie County International Airport Master Plan Update
than the 2008 TAF (189,258 by 2025). As such, the ‘Composite Forecast’ has been selected as
the ‘Medium Growth’ forecast for operations at FPR.
In looking at the forecasting methods that produced end values higher and lower than the
‘Composite Forecast,’ only a few methods appear to show much variation from the
‘Composite Forecast’. Subsequently, the ‘High Growth’ forecast was derived by averaging all
forecast methods shown in green in Table 3-16, and the ‘Low Growth’ forecast was derived
by averaging all forecast methods shown in blue. All three forecasting scenarios are
summarized in Table 3-17 and graphically depicted in Figure 3-5.
TABLE 3‐16 LEGEND SUMMARY OF OPERATIONS FORECASTING METHODS
Forecast Methodology Table Abbreviation St. Lucie Population Average Annual Growth Rate (AAGR) POP AAGR
St. Lucie County Employment AAGR EMP AAGR St. Lucie County Transportation Employment TRANS AAGR
Personal Per Capita Income AAGR PCPI AAGR Transportation Employment Regression Analysis 2000‐2008 REG AAGR
2008 FPR Terminal Area Forecast AAGR TAF AAGR 2002 Airport Master Plan Forecast AAGR 02 AMPU AAGR
2005 FPR Noise Study AAGR 05 NS AAGR 2004 Florida Aviation System Plan FPR AAGR FASP AAGR 2008‐25 FAA Aerospace Forecasts AAGR AERO AAGR
Composite (Average) of All Ten Forecast Methods Mid‐Composite

Final 3‐33 01/18/2011 St. Lucie County International Airport Master Plan Update
TABLE 3‐16 SUMMARY OF OPERATIONS FORECASTING METHODS
Year POP AAGR
EMP AAGR
TRANS AAGR
PCPI AAGR
REG AAGR
TAF AAGR 02 AMPU AAGR
05 NS AAGR FASP AAGR
AERO AAGR
Mid‐Composite
2008 160,277 160,277 160,277 160,277 160,277 160,277 160,277 160,277 160,277 160,277 160,277
2009 164,610 163,432 161,549 166,536 159,304 162,195 164,284 163,207 162,601 165,085 163,280
2010 169,060 166,650 162,831 173,039 158,336 164,137 168,391 166,190 164,959 170,038 166,363
2011 173,631 169,931 164,124 179,795 157,375 166,102 172,601 169,228 167,351 175,139 169,528
2012 178,325 173,276 165,426 186,816 156,419 168,090 176,916 172,321 169,778 180,393 172,776
2013 183,146 176,687 166,739 194,111 155,469 170,102 181,339 175,471 172,239 185,805 176,111
2014 187,466 180,158 167,901 203,386 154,525 172,389 185,872 178,678 174,737 191,379 179,649
2015 191,888 183,696 169,070 213,105 153,587 174,707 190,519 181,944 177,270 197,120 183,291
2016 196,414 187,304 170,247 223,288 152,654 177,056 195,282 185,270 179,841 203,034 187,039
2017 201,046 190,983 171,433 233,958 151,727 179,437 200,164 188,656 182,448 209,125 190,898
2018 205,788 194,734 172,626 245,137 150,806 181,850 205,169 192,105 185,094 215,399 194,871
2019 209,886 198,550 173,585 258,693 149,890 184,356 210,298 195,616 187,778 221,861 199,051
2020 214,066 202,441 174,548 272,998 148,980 186,896 215,555 199,192 190,500 228,517 203,369
2021 218,329 206,408 175,517 288,095 148,075 189,471 220,944 202,833 193,263 235,372 207,831
2022 222,676 210,453 176,492 304,026 147,176 192,082 226,468 206,540 196,065 242,433 212,441
2023 227,111 214,577 177,472 320,839 146,283 194,728 232,130 210,315 198,908 249,706 217,207
2024 231,633 218,782 178,457 338,581 145,394 197,411 237,933 214,160 201,792 257,198 222,134
2025 236,246 223,070 179,448 357,304 144,511 200,131 243,882 218,074 204,718 264,913 227,230
2026 240,950 227,441 180,444 377,063 143,634 202,889 249,979 222,060 207,686 272,861 232,501
2027 245,749 231,898 181,446 397,914 142,762 205,684 256,228 226,119 210,698 281,047 237,954
2028 250,642 236,442 182,453 419,918 141,895 208,518 262,634 230,252 213,753 289,478 243,599
AAGR 2008‐2028 2.26% 1.96% 0.65% 4.93% ‐0.61% 1.32% 2.50% 1.83% 1.45% 3.00% 2.12%
Change 2008‐2028 56.38% 47.52% 13.84% 162.00% ‐11.47% 30.10% 63.86% 43.66% 33.36% 80.61% 51.99%
ST AAGR 2.70% 1.97% 0.79% 3.90% ‐0.61% 1.20% 2.50% 1.83% 1.45% 3.00% 1.90%
MT AAGR 2.36% 1.96% 0.70% 4.78% ‐0.61% 1.34% 2.50% 1.83% 1.45% 3.00% 2.05%
LT AAGR 1.99% 1.96% 0.56% 5.53% ‐0.61% 1.38% 2.50% 1.83% 1.45% 3.00% 2.26% Forecast Type Local Local Local Local Local National Local Local National State All
Source: The LPA Group Incorporated, January 2009. (1) Since the FAA TAF only forecasts operations to 2025, the growth rates from the TAF were used to project future operations, representing an adjusted forecast.
Final 3‐34 01/18/2011 St. Lucie County International Airport Master Plan Update
Figure 3‐4
Summary of Operations Forecasting Methods
Source: The LPA Group Incorporated, 2009.
0
50,000
100,000
150,000
200,000
250,000
300,000
350,000
400,000
450,000
Operations
Year
POP AAGR
EMP AAGR
TRANS AAGR
PCPI AAGR
REG AAGR
TAF AAGR
02 AMPU AAGR
05 NS AAGR
FASP AAGR
AERO AAGR
Mid‐Composite

Final 3‐35 01/18/2011 St. Lucie County International Airport Master Plan Update
TABLE 3‐17 LOW, MEDIUM, AND HIGH OPERATIONS FORECASTS
Year Low/Average Medium/Composite High/Average
2008 160,277 160,277 160,277
2009 162,048 163,280 165,129
2010 163,851 166,363 170,132
2011 165,685 169,528 175,292
2012 167,552 172,776 180,613
2013 169,451 176,111 186,100
2014 171,398 179,649 192,026
2015 173,379 183,291 198,158
2016 175,395 187,039 204,505
2017 177,447 190,898 211,073
2018 179,536 194,871 217,873
2019 181,629 199,051 225,185
2020 183,760 203,369 232,784
2021 185,928 207,831 240,685
2022 188,135 212,441 248,901
2023 190,380 217,207 257,446
2024 192,666 222,134 266,336
2025 194,992 227,230 275,586
2026 197,359 232,501 285,213
2027 199,768 237,954 295,234
2028 202,219 243,599 305,668
AAGR 2008‐2028 1.17% 2.12% 3.28%
Change 2008‐2028 26.17% 51.99% 90.71%
ST AAGR 1.12% 1.90% 3.03%
MT AAGR 1.16% 2.05% 3.20%
LT AAGR 1.20% 2.26% 3.44%
Forecast Type All All National/Local
Selected Forecast No Yes No
Source: The LPA Group Incorporated, 2009.

Final 3‐36 01/18/2011 St. Lucie County International Airport Master Plan Update
Figure 3‐5
Low, Medium, and High Operations Forecasts
Source: The LPA Group Incorporated, 2009.
0
50,000
100,000
150,000
200,000
250,000
300,000
350,000
Operations
Year
Mid‐Composite
Low‐Average
High‐Average
TAF

Final 3‐37 01/18/2011 St. Lucie County International Airport Master Plan Update
FAA Terminal Area Forecast (TAF) / Airport Forecast Comparison According to the FAA Memorandum, Review and Approval of Aviation Forecasts June 2008,
“When reviewing a sponsor’s forecast, FAA must ensure that the forecast is based on
reasonable planning assumptions, uses current data, and is developed using appropriate
forecasting methods.” The FAA also reviews forecasts for consistency with the Terminal
Area Forecast (TAF), with consistency defined as follows: “Forecasts differ by less than 10
percent in the five-year forecast period, and 15 percent in the ten-year forecast period.”17 As
shown in Table 3-18, the ‘Low Growth’ and ‘Medium Growth’ forecasts are consistent with
the TAF, per the above definition, whereas the ‘High Growth’ forecast is not consistent with
the TAF in the ten-year forecast period. Further, operations levels in the ‘Low Growth’
forecast are less than the TAF in all years. Since the ‘Medium Growth’ forecast represents a
composite of numerous forecasting methods inclusive national, state, and local trends, and
also illustrates a reasonable expectation of future activity at FPR, it was selected as the
preferred operations forecast for the airport. This will be used throughout this chapter to
calculate subsequent/derivative operations forecasts (peak hour, operations by aircraft type,
etc.), and serves as the baseline for determining the twenty-year facility requirements and
development recommendations for FPR.
17 FAA Memorandum, Review and Approval of Aviation Forecasts June 2008.

Final 3‐38 01/18/2011 St. Lucie County International Airport Master Plan Update
TABLE 3‐18 OPERATIONS FORECASTS COMPARISION TO FAA TAF
Year FAA TAF (Adjusted)
Low/Average Deviation From TAF
Medium/Composite SELECTED
Deviation From TAF
High/Average Deviation From TAF
2008 160,277 160,277 0.00% 160,277 0.00% 160,277 0.00%
10% Deviation Acceptable in a Five‐Year Period
2009 162,380 162,048 ‐0.20% 163,280 0.55% 165,129 1.90%
2010 164,512 163,851 ‐0.40% 166,363 1.13% 170,132 3.82%
2011 166,674 165,685 ‐0.59% 169,528 1.71% 175,292 5.76%
2012 168,866 167,552 ‐0.78% 172,776 2.32% 180,613 7.73%
2013 171,089 169,451 ‐0.96% 176,111 2.94% 186,100 9.73%
15% Deviation Acceptable in a Ten‐Year Period
2014 173,343 171,398 ‐1.12% 179,649 3.64% 192,026 11.90%
2015 175,628 173,379 ‐1.28% 183,291 4.36% 198,158 14.11%
2016 177,945 175,395 ‐1.43% 187,039 5.11% 204,505 16.36%
2017 180,295 177,447 ‐1.58% 190,898 5.88% 211,073 18.65%
2018 182,677 179,536 ‐1.72% 194,871 6.67% 217,873 20.99%
No FAA Requirement for Last Ten Years
2019 185,093 181,629 ‐1.87% 199,051 7.54% 225,185 23.53%
2020 187,543 183,760 ‐2.02% 203,369 8.44% 232,784 26.14%
2021 190,027 185,928 ‐2.16% 207,831 9.37% 240,685 28.82%
2022 192,547 188,135 ‐2.29% 212,441 10.33% 248,901 31.56%
2023 195,101 190,380 ‐2.42% 217,207 11.33% 257,446 34.38%
2024 197,691 192,666 ‐2.54% 222,134 12.36% 266,336 37.27%
2025 200,318 194,992 ‐2.66% 227,230 13.43% 275,586 40.23%
2026 N/A 197,359 N/A 232,501 N/A 285,213 N/A
2027 N/A 199,768 N/A 237,954 N/A 295,234 N/A
2028 N/A 202,219 N/A 243,599 N/A 305,668 N/A
Source: The LPA Group Incorporated, 2009.
Instrument Operations Forecast Although included in the total operations forecast, a separate forecast for Instrument Flight
Rules (IFR) operations was also analyzed in this section. This analysis was important since it
supports the development of adequate facilities pertaining to aircraft operations under
Instrument Meteorological Conditions (IMC), such as the capability of existing approaches to
the runways and ground based navigational equipment. The FAA Aerospace Forecasts Fiscal Years 2008-2025 predicts general aviation instrument operations to grow at an AAGR of 2.1
percent through 2025. The anticipated growth in the number of general aviation instrument
operations is primarily associated with the introduction of VLJs, as well as improved
navigation associated with NextGen and RNAV implementation. An analysis of historic
ATCT data from 2005 to 2008 revealed fluctuations in instrument operations growth at FPR
varying from a 11 percent reduction to an increase of 8 percent. However IFR operations
have generally been approximately 16 percent of total operations in all years. Therefore,
growth in IFR operations from 2009 to 2028 used the FAA Aerospace Forecast growth rate of

Final 3‐39 01/18/2011 St. Lucie County International Airport Master Plan Update
2.1 percent as shown in Table 3-19, which is consistent with the annual growth in total
airport operations of 2.12 percent.
TABLE 3‐19 INSTRUMENT OPERATIONS FORECAST
Year Preferred
Operations Forecast Instrument Operations
Percent of Operations
Year‐Over‐Year Change
2005 163,027 25,263 15.50%
2006 103,319 22,479 21.76% ‐11.02%
2007 120,131 22,467 18.70% ‐0.05%
2008 160,277 24,261 15.14% 7.99%
2009 163,280 24,770 15.17% 2.10%
2010 166,363 25,291 15.20% 2.10%
2011 169,528 25,822 15.23% 2.10%
2012 172,776 26,364 15.26% 2.10%
2013 176,111 26,918 15.28% 2.10%
2014 179,649 27,483 15.30% 2.10%
2015 183,291 28,060 15.31% 2.10%
2016 187,039 28,649 15.32% 2.10%
2017 190,898 29,251 15.32% 2.10%
2018 194,871 29,865 15.33% 2.10%
2019 199,051 30,492 15.32% 2.10%
2020 203,369 31,133 15.31% 2.10%
2021 207,831 31,787 15.29% 2.10%
2022 212,441 32,454 15.28% 2.10%
2023 217,207 33,136 15.26% 2.10%
2024 222,134 33,831 15.23% 2.10%
2025 227,230 34,542 15.20% 2.10%
2026 232,501 35,267 15.17% 2.10%
2027 237,954 36,008 15.13% 2.10%
2028 243,599 36,764 15.09% 2.10%
Source: The LPA Group Incorporated, January 2009. *Instrument operations count provided by ATCT.
Local / Itinerant Operations Forecast The preferred operations forecast shown in Table 3-18 is further refined by local and
itinerant activity in Table 3-20. A historic analysis of the TAF data from 1990 to 2008
revealed that activity at FPR has been as high as 70 percent local in 1990 to as low as 35
percent in 2006 (i.e., following the departure of Pan Am International Flight Academy in
2005). The TAF forecasts show a slight increase in the percent of local operations year-over-
year through 2025. This is consistent with expected operations at FPR, particularly due to
the recent construction of training runway 10L-28R (9L-27R) which is used predominately
for local touch-and-go operations.

Final 3‐40 01/18/2011 St. Lucie County International Airport Master Plan Update
At the same time, itinerant operations are also expected to grow each year associated
primarily with corporate aircraft operations, and itinerant operations should continue to
comprise the majority of FPR’s operations. As shown in Table 3-20, the forecast split in local
and itinerant operations from the TAF was utilized in the forecasts for FPR.
TABLE 3‐20 LOCAL / ITINERANT OPERATIONS FORECAST
Year Preferred
Operations Forecast Local Operations TAF Local Split Itinerant Operations TAF Itinerant Split
2008 160,277 73,662 45.96% 86,616 54.04%
2009 163,280 75,290 46.11% 87,991 53.89%
2010 166,363 76,963 46.26% 89,400 53.74%
2011 169,528 78,685 46.41% 90,843 53.59%
2012 172,776 80,455 46.57% 92,321 53.43%
2013 176,111 82,276 46.72% 93,835 53.28%
2014 179,649 84,202 46.87% 95,448 53.13%
2015 183,291 86,187 47.02% 97,104 52.98%
2016 187,039 88,234 47.17% 98,805 52.83%
2017 190,898 90,345 47.33% 100,553 52.67%
2018 194,871 92,522 47.48% 102,349 52.52%
2019 199,051 94,809 47.63% 104,242 52.37%
2020 203,369 97,176 47.78% 106,194 52.22%
2021 207,831 99,624 47.94% 108,207 52.06%
2022 212,441 102,158 48.09% 110,283 51.91%
2023 217,207 104,780 48.24% 112,427 51.76%
2024 222,134 107,496 48.39% 114,638 51.61%
2025 227,230 110,308 48.54% 116,922 51.46%
2026 232,501 112,867 48.54% 119,634 51.46%
2027 237,954 115,514 48.54% 122,440 51.46%
2028 243,599 118,254 48.54% 125,345 51.46%
Source: The LPA Group Incorporated, 2009.
Operations by Flight Type The local and itinerant operations shown in Table 3-20 can be further defined by flight type,
including air taxi (i.e., on-demand or for-hire service), general and corporate aviation, and
military as presented in Table 3-21. As previously mentioned earlier, DayJet operated for a
short time at FPR, which was a “Per-Seat, On-Demand” air carrier service that used very
light jet (VLJ) aircraft, until ultimately discontinuing service in September 2008.
Still VLJs are expected to make air taxi service more affordable, subsequently increasing the
potential for growth in air taxi operations at FPR. Further, both Key Air and APP Jet Center
of Ft. Pierce maintain large corporate aircraft fleets for charter (including King Airs, Learjets,
Hawkers, Challengers, Gulfstreams, and Globals), and both FBOs are expecting to see
increases in air taxi operations, especially once they have additional time to establish
themselves within the southeast Florida market.

Final 3‐41 01/18/2011 St. Lucie County International Airport Master Plan Update
According to the FAA National Plan of Integrated Airport Systems (NPIAS) 2009-2013, air
taxi operations are forecast to grow at an AAGR of 2.7 percent from 2007 through 2025.
Therefore, this growth rate was applied to baseline 2008 air taxi operations at FPR to
determine forecast activity through 2028.
Further, military operations, primarily associated with the US Navy training aircraft from the
Bahamas and limited US Coast Guard operations, are not expected to significantly increase or
decrease during the planning period. Since available data related to military operations is
limited and based upon “mission”, military operations were kept constant to be consistent
with the FAA’s TAF. The remaining values from the local/itinerant operations forecast in
Table 3-20 above were then applied to ‘itinerant GA’ and ‘local civil’ operations.
TABLE 3‐21 OPERATIONS BY FLIGHT TYPE
Year Itinerant Air Taxi
Itinerant GA
Itinerant Military
Local Civil
Local Military
Total Airport Ops
2008 953 85,566 96 73,400 261 160,277
2009 978 86,916 96 75,028 261 163,280
2010 1,005 88,298 96 76,702 261 166,363
2011 1,032 89,714 96 78,424 261 169,528
2012 1,060 91,165 96 80,194 261 172,776
2013 1,088 92,650 96 82,014 261 176,111
2014 1,118 94,233 96 83,941 261 179,649
2015 1,148 95,859 96 85,926 261 183,291
2016 1,179 97,529 96 87,973 261 187,039
2017 1,211 99,246 96 90,084 261 190,898
2018 1,244 101,009 96 92,261 261 194,871
2019 1,277 102,868 96 94,548 261 199,051
2020 1,312 104,785 96 96,915 261 203,369
2021 1,347 106,763 96 99,363 261 207,831
2022 1,383 108,804 96 101,897 261 212,441
2023 1,421 110,909 96 104,519 261 217,207
2024 1,459 113,083 96 107,235 261 222,134
2025 1,499 115,327 96 110,047 261 227,230
2026 1,539 117,999 96 112,605 261 232,501
2027 1,581 120,763 96 115,253 261 237,954
2028 1,623 123,625 96 117,993 261 243,599
AAGR 2008‐2028 2.70% 1.86% 0.00% 2.40% 0.00% 2.12%
Change 2008‐2028 70.38% 44.48% 0.00% 60.75% 0.00% 51.99%
Source: The LPA Group Incorporated, 2009.
3.8.2 Forecast Based Aircraft Table 3-22 summarizes the ten different forecasting methods for based aircraft at FPR, and
also presents a ‘Composite Forecast’ representing the average of the ten methods – the blue
rows are forecasts with lower end values than the ‘Composite Forecast’ and the green rows

Final 3‐42 01/18/2011 St. Lucie County International Airport Master Plan Update
are forecasts with higher end values than the ‘Composite Forecast’. This information is also
graphically depicted in Figure 3-6. Note that the growth rates from the 2005 Noise Study are
not applied to based aircraft since that study did not include a based aircraft forecast;
alternatively, a forecast was included based on historic numbers of based aircraft per
operation. Operations per based aircraft (OPBA) forecast , as determined above, was divided
by the “2008 Operations Per Based Aircraft” value of 760 (shown in Table 3-7) to forecast
based aircraft levels.
The ‘Composite Forecast’ produces a median growth projection for FPR based aircraft,
increasing based aircraft by 2.22 percent annually or 116 aircraft over the twenty-year
period, and also incorporates national, state, and local trends. In looking at the forecasting
methods that produced end values higher and lower than the ‘Composite Forecast,’ only a
few methods appear to show much variation from the ‘Composite Forecast.’ Like the
operations forecasts, the ‘High Growth’ based aircraft forecast was derived by averaging all
forecast methods shown in green in Table 3-22, and the ‘Low Growth’ forecast was derived
by averaging all forecast methods shown in blue. All three forecasting scenarios are
summarized in Table 3-23 and graphically depicted in Figure 3-7.
TABLE 3‐22 LEGEND SUMMARY OF BASED AIRCRAFT FORECASTING METHODS
Forecast Methodology Table Abbreviation
St. Lucie Population Average Annual Growth Rate (AAGR) POP AAGR
St. Lucie County Employment AAGR EMP AAGR
St. Lucie County Transportation Employment TRANS AAGR
Personal Per Capita Income AAGR PCPI AAGR
Total Operations Regression Analysis 2000‐2008 REG AAGR
2008 FPR Terminal Area Forecast AAGR TAF AAGR
2002 Airport Master Plan Forecast AAGR 02 AMPU AAGR
Operations per Based Aircraft Based upon 2008 Data OPS/811
2004 Florida Aviation System Plan FPR AAGR FASP AAGR
2008‐25 FAA Aerospace Forecasts AAGR AERO AAGR
Composite (Average) of All Ten Forecast Methods Mid‐Composite

Final 3‐43 01/18/2011 St. Lucie County International Airport Master Plan Update
TABLE 3‐22 SUMMARY OF BASED AIRCRAFT FORECASTING METHODS
Year POP AAGR
EMP AAGR
TRANS AAGR
PCPI AAGR
REG AAGR
TAF AAGR
02 AMPU AAGR
OPS/ 760
FASP AAGR
AERO AAGR
Mid‐Composite
2008 211 211 211 211 211 211 211 211 211 211 211
2009 217 215 213 219 212 216 216 215 215 214 215
2010 223 219 214 228 214 221 222 219 220 217 220
2011 229 224 216 237 215 227 227 223 224 220 224
2012 235 228 218 246 217 232 233 227 229 223 229
2013 241 233 220 256 218 237 239 232 233 226 233
2014 247 237 221 268 220 243 245 237 238 229 238
2015 253 242 223 281 221 249 251 241 243 233 244
2016 259 247 224 294 223 255 257 246 247 236 249
2017 265 251 226 308 225 261 264 251 252 239 254
2018 271 256 227 323 226 267 270 257 257 242 260
2019 276 261 229 341 228 274 277 262 262 246 266
2020 282 267 230 359 229 280 284 268 267 249 272
2021 287 272 231 379 231 287 291 274 273 253 278
2022 293 277 232 400 232 294 298 280 278 256 284
2023 299 282 234 422 234 301 306 286 284 260 291
2024 305 288 235 446 236 308 313 292 289 264 298
2025 311 294 236 470 237 315 321 299 295 267 305
2026 317 299 238 496 239 323 329 306 301 271 312
2027 324 305 239 524 241 331 337 313 307 275 320
2028 330 311 240 553 242 339 346 321 313 279 327
AAGR 2008‐2028 2.26% 1.96% 0.65% 4.93% 0.69% 2.39% 2.50% 2.12% 1.99% 1.40% 2.22%
Change 2008‐2028 56.38% 47.52% 13.84% 162.00% 14.84% 60.50% 63.86% 51.99% 48.44% 32.06% 55.14%
ST AAGR 2.70% 1.97% 0.79% 3.90% 0.69% 2.39% 2.50% 1.90% 2.03% 1.40% 2.04%
MT AAGR 2.36% 1.96% 0.70% 4.78% 0.69% 2.39% 2.50% 2.05% 1.97% 1.40% 2.15%
LT AAGR 1.99% 1.96% 0.56% 5.53% 0.69% 2.39% 2.50% 2.26% 1.99% 1.40% 2.34%
Forecast Type Local Local Local Local Local National Local Local State National All
Source: The LPA Group Incorporated, January 2009. (1) Since the FAA TAF only forecasts operations to 2025, the growth rates from the TAF were used to project future operations, representing an adjusted forecast. Further 2008 based aircraft value was adjusted to reflect actual counts from the airport.
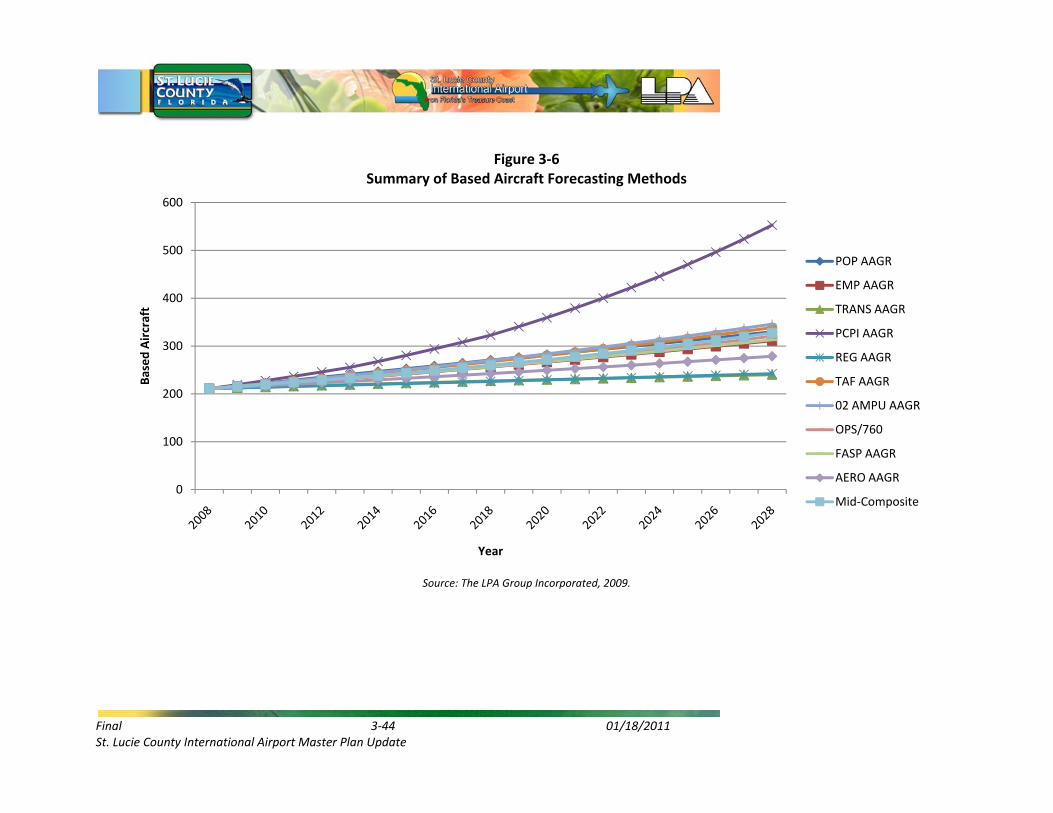
Final 3‐44 01/18/2011 St. Lucie County International Airport Master Plan Update
Figure 3‐6 Summary of Based Aircraft Forecasting Methods
Source: The LPA Group Incorporated, 2009.
0
100
200
300
400
500
600
Based Aircraft
Year
POP AAGR
EMP AAGR
TRANS AAGR
PCPI AAGR
REG AAGR
TAF AAGR
02 AMPU AAGR
OPS/760
FASP AAGR
AERO AAGR
Mid‐Composite

Final 3‐45 01/18/2011 St. Lucie County International Airport Master Plan Update
TABLE 3‐23 LOW, MEDIUM, AND HIGH BASED AIRCRAFT FORECASTS
Year Low/Average Medium/Composite High/Average
2008 211 211 211
2009 214 215 217
2010 218 220 224
2011 221 224 231
2012 225 229 238
2013 228 233 245
2014 232 238 253
2015 236 244 261
2016 240 249 270
2017 244 254 279
2018 248 260 288
2019 252 266 298
2020 256 272 308
2021 260 278 319
2022 264 284 331
2023 269 291 342
2024 273 298 355
2025 278 305 367
2026 282 312 381
2027 287 320 395
2028 292 327 410
AAGR 2008‐2028 1.64% 2.22% 3.37%
Change 2008‐2028 38.45% 55.14% 94.08%
ST AAGR 1.60% 2.04% 3.04%
MT AAGR 1.62% 2.15% 3.27%
LT AAGR 1.67% 2.34% 3.59%
Forecast Type All All Local, National
Selected Forecast No Yes No
Source: The LPA Group Incorporated, January 2009.
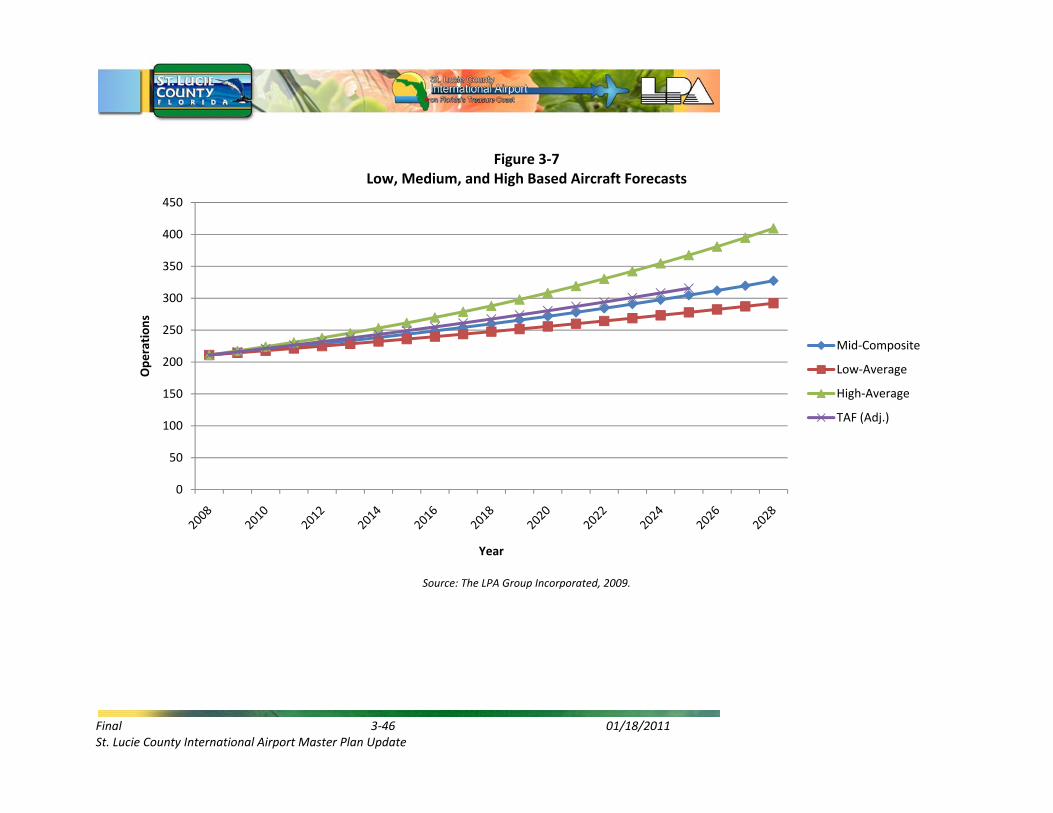
Final 3‐46 01/18/2011 St. Lucie County International Airport Master Plan Update
Figure 3‐7 Low, Medium, and High Based Aircraft Forecasts
Source: The LPA Group Incorporated, 2009.
0
50
100
150
200
250
300
350
400
450
Operations
Year
Mid‐Composite
Low‐Average
High‐Average
TAF (Adj.)

Final 3‐47 01/18/2011 St. Lucie County International Airport Master Plan Update
FAA Terminal Area Forecast (TAF) / Airport Forecast Comparison Like operations forecasts, the FAA also reviews based aircraft forecasts for consistency with
the TAF, with consistency defined as follows: “Forecasts differ by less than 10 percent in the
five-year forecast period, and 15 percent in the ten-year forecast period.”18 As shown in
Table 3-24, all three based aircraft forecasts are consistent with the TAF, per the above
definition. However, based on the FAA Aerospace Forecasts which show the highest
growth in based aircraft occurring in the corporate turbine aircraft category (i.e., turboprops
and jets), with minimal growth expected for pistons, it was determined that the ‘Medium
Growth’ forecast was most consistent with anticipated trends, and has been selected as the
preferred based aircraft forecast for FPR.
TABLE 3‐24 BASED AIRCRAFT FORECASTS COMPARISION TO FAA TAF
Year FAA TAF (Adjusted)
Low/ Average
Deviation From TAF
Medium/Composite SELECTED
Deviation From TAF
High/ Average
Deviation From TAF
2008 211 211 0.00% 211 0.00% 211 0.00%
10% Deviation Acceptable in a Five‐Year Period
2009 216 214 ‐0.78% 215 ‐0.36% 217 0.63%
2010 221 218 ‐1.55% 220 ‐0.71% 224 1.26%
2011 227 221 ‐2.31% 224 ‐1.05% 231 1.91%
2012 232 225 ‐3.06% 229 ‐1.37% 238 2.56%
2013 237 228 ‐3.80% 233 ‐1.69% 245 3.21%
15% Deviation Acceptable in a Ten‐Year Period
2014 243 232 ‐4.54% 238 ‐1.95% 253 4.07%
2015 249 236 ‐5.26% 244 ‐2.20% 261 4.95%
2016 255 240 ‐5.98% 249 ‐2.43% 270 5.84%
2017 261 244 ‐6.69% 254 ‐2.65% 279 6.76%
2018 267 248 ‐7.38% 260 ‐2.86% 288 7.69%
No FAA Requirement for Last Ten Years
2019 274 252 ‐8.08% 266 ‐3.01% 298 8.83%
2020 280 256 ‐8.76% 272 ‐3.13% 308 9.99%
2021 287 260 ‐9.43% 278 ‐3.24% 319 11.20%
2022 294 264 ‐10.08% 284 ‐3.32% 331 12.45%
2023 301 269 ‐10.73% 291 ‐3.39% 342 13.74%
2024 308 273 ‐11.36% 298 ‐3.43% 355 15.07%
2025 316 278 ‐11.99% 305 ‐3.46% 367 16.44%
2026 N/A 282 N/A 312 N/A 381 N/A
2027 N/A 287 N/A 320 N/A 395 N/A
2028 N/A 292 N/A 327 N/A 410 N/A
Source: The LPA Group Incorporated, 2009.
18 FAA Memorandum, Review and Approval of Aviation Forecasts June 2008.
Final 3‐48 01/18/2011 St. Lucie County International Airport Master Plan Update
Based Aircraft Fleet Mix Aside from determining the number of based aircraft, it is also vital to identify the aircraft
fleet mix at the airport, both in terms of based aircraft and aircraft operations.
Understanding the future fleet mix allows the airport to develop facilities to accommodate
various types of aircraft that are forecast to operate at the airport. The future fleet mix data
was derived primarily from the active general aviation fleet forecasts from the FAA Aerospace Forecasts Fiscal Years 2008-2025 previously presented in Table 3-15. As shown
in Table 3-25, the annual growth rates from the Aerospace Forecasts were applied to
existing turboprop, jet, and helicopter based aircraft levels at FPR to determine the forecasts
through 2028.
Multi-engine piston aircraft were held stable throughout the forecast period, and single-
engine piston aircraft were calculated as the remainder of total based aircraft. Of key
importance to this forecast is the anticipated growth in jet and single-engine piston aircraft
at FPR. Specifically, it is anticipated that FPR will attract new jet aircraft as available space
and high rents at other airports to the south (e.g., PBI) continue to drive demand for aircraft
storage at FPR. Both FBOs are anticipating this growth in the short-term, and subsequently
have plans for significant hangar development targeted towards corporate aircraft.
Therefore, the forecast increase in based jets from 11 to 36 is consistent with FAA growth
projections and trends within southeast Florida.
High growth is also expected for based single-engine pistons. With the recent construction
of training Runway 10L-27R (former 9L-27R), the airport is in a prime position to attract a
new flight school, aircraft manufacturer/sales center, etc., which typically attract large
numbers of piston-powered aircraft. This anticipated trend is consistent with the forecast
increase in percent of local/training operations to total airport operations as previously
shown in Table 3-20 (i.e., increase from 45.13 percent of total operations in 2008 to 47.71
percent by 2028).
The operations fleet mix forecast is presented in Table 3-26. Since the ATCT does not
record all operations by aircraft type, the baseline 2008 activity levels were determined as
follows:
Helicopter Operations – There are currently four based helicopters at FPR. It was
assumed that each helicopter conducts two landings and two takeoffs every day,
resulting 5,840 total helicopter operations at FPR in 2008. [4 Helicopters x 2 Takeoffs x 2
Landings = 16 Operations per Day x 365 = 5,840 Operations per Year].
Jet Operations – the FAA records filed flight plans within their Enhanced Traffic
Management System Counts (ETMSC) database. According to the ETMSC database,
3,375 jet operations were flown at FPR in 2008.

Final 3‐49 01/18/2011 St. Lucie County International Airport Master Plan Update
Single-Engine Piston Operations – The 2005 Noise Study indicated that 72.5 percent of
total airport operations were conducted by single-engine piston aircraft. [160,277 Total
Operations X 72.5 % = 116,200 Single-Engine Piston Operations].
Multi-Engine Piston and Turboprop Operations – Calculated as the remainder of the
operations above, and split by based aircraft distribution. For example, after subtracting
the number of operations for helicopters, jets, and single-engine pistons from total
operations, there are 34,862 operations remaining. There is a combined total of 71 based
multi-engine piston and turboprop aircraft at FPR, of which approximately 83.1 percent
are multi-engines and 16.9 percent are turboprops. Therefore, total multi-engine
operations in 2008 were estimated at 28,962 and turboprop operations were estimated at
5,900. [34,862 Remaining Operations X 83.1% = 28,962 Multi-Engine Piston Operations; 34,862
Remaining Operations X 16.9% = 5,900 Turboprop Operations].
The future operations by fleet mix data was derived primarily from the active general
aviation hours flown forecasts provided in FAA Aerospace Forecasts Fiscal Years 2008-2025
as previously presented in Table 3-14. As shown in Table 3-26, the annual growth rates
from the Aerospace Forecasts were applied to existing multi-engine piston, turboprop, jet,
and helicopter operations levels at FPR to determine the forecasts through 2028. Single-
engine piston aircraft were calculated as the remainder of total operations. Consistent with
the based aircraft fleet mix forecasts, jet operations are projected to grow at the fastest
annual rate of 8.49 percent throughout the twenty-year period.
As population and employment continue to grow within St. Lucie County and southeast
Florida, this presents a realistic jet operations forecast, particularly in earlier years when the
FBOs intend to develop new hangar facilities for corporate aircraft storage. Single-engine
piston operations are also projected to increase at a high rate, primarily because of the
anticipated growth in flight training activity from the recent development of Runway 10L-
27R (9L-27R). While flight training/local operations in multi-engine piston aircraft is
expected to continue, a decrease in activity is expected for itinerant multi-engine piston
aircraft.

Final 3‐50 01/18/2011 St. Lucie County International Airport Master Plan Update
TABLE 3‐25 BASED AIRCRAFT FLEET MIX FORECAST
Year Single‐Engine Multi‐Engine Turboprop Jet Helicopter Total
Aircraft % Total Aircraft % Total Aircraft % Total Aircraft % Total Aircraft % Total Aircraft % Total
2008 122 57.82% 59 27.96% 12 5.69% 14 6.64% 4 1.90% 211 100.00%
2009 125 57.89% 59 27.41% 12 5.66% 15 7.08% 4 1.96% 215 100.00%
2010 127 57.93% 59 26.86% 12 5.63% 17 7.56% 4 2.02% 220 100.00%
2011 130 58.19% 59 26.32% 13 5.61% 18 7.84% 5 2.04% 224 100.00%
2012 134 58.44% 59 25.79% 13 5.59% 19 8.13% 5 2.06% 229 100.00%
2013 137 58.67% 59 25.27% 13 5.57% 20 8.42% 5 2.08% 233 100.00%
2014 140 58.90% 59 24.75% 13 5.54% 21 8.72% 5 2.09% 238 100.00%
2015 144 59.12% 59 24.23% 13 5.52% 22 9.03% 5 2.11% 244 100.00%
2016 148 59.31% 59 23.72% 14 5.49% 23 9.35% 5 2.13% 249 100.00%
2017 151 59.50% 59 23.21% 14 5.46% 25 9.68% 5 2.15% 254 100.00%
2018 155 59.66% 59 22.72% 14 5.44% 26 10.02% 6 2.17% 260 100.00%
2019 159 59.83% 59 22.22% 14 5.41% 28 10.36% 6 2.18% 266 100.00%
2020 163 59.98% 59 21.73% 15 5.37% 29 10.72% 6 2.20% 272 100.00%
2021 167 60.12% 59 21.24% 15 5.34% 31 11.08% 6 2.21% 278 100.00%
2022 171 60.24% 59 20.76% 15 5.31% 33 11.45% 6 2.23% 284 100.00%
2023 175 60.35% 59 20.29% 15 5.28% 34 11.84% 7 2.24% 291 100.00%
2024 180 60.44% 59 19.82% 16 5.24% 36 12.23% 7 2.26% 298 100.00%
2025 184 60.52% 59 19.36% 16 5.20% 39 12.64% 7 2.27% 305 100.00%
2026 189 60.58% 59 18.91% 16 5.17% 41 13.05% 7 2.29% 312 100.00%
2027 194 60.63% 59 18.46% 16 5.13% 43 13.48% 7 2.30% 320 100.00%
2028 199 60.66% 59 18.02% 17 5.09% 46 13.91% 8 2.31% 327 100.00%
AAGR 2008‐2028 2.47% 0.00% 1.66% 6.08% 3.24% 2.22%
Change 2008‐2028 62.76% 0.00% 38.87% 225.34% 89.21% 55.14%
FAA Aerospace AAGR 2007‐2010 N/A‐Remainder N/A‐Stable 1.50% 8.90% 5.30% N/A
FAA Aerospace AAGR 2010‐2020 N/A‐Remainder N/A‐Stable 1.70% 5.80% 3.00% N/A
Source: The LPA Group Incorporated, January 2009.

Final 3‐51 01/18/2011 St. Lucie County International Airport Master Plan Update
TABLE 3‐26 OPERATIONS FLEET MIX FORECAST
Year Single‐Engine Multi‐Engine Turboprop Jet Helicopter Total
Aircraft % Total Aircraft % Total Aircraft % Total Aircraft % Total Aircraft % Total Aircraft % Total
2008 116,201 72.50% 28,962 18.07% 5,900 3.68% 3,375 2.11% 5,840 3.64% 160,277 100.00%
2009 118,845 72.79% 28,539 17.48% 5,984 3.67% 3,785 2.32% 6,126 3.75% 163,280 100.00%
2010 121,497 73.03% 28,123 16.90% 6,070 3.65% 4,246 2.55% 6,427 3.86% 166,363 100.00%
2011 124,568 73.48% 27,608 16.29% 6,142 3.62% 4,589 2.71% 6,621 3.91% 169,528 100.00%
2012 127,679 73.90% 27,102 15.69% 6,214 3.60% 4,960 2.87% 6,820 3.95% 172,776 100.00%
2013 130,831 74.29% 26,606 15.11% 6,287 3.57% 5,361 3.04% 7,026 3.99% 176,111 100.00%
2014 134,137 74.67% 26,118 14.54% 6,361 3.54% 5,795 3.23% 7,238 4.03% 179,649 100.00%
2015 137,495 75.01% 25,640 13.99% 6,436 3.51% 6,263 3.42% 7,456 4.07% 183,291 100.00%
2016 140,906 75.33% 25,170 13.46% 6,512 3.48% 6,770 3.62% 7,681 4.11% 187,039 100.00%
2017 144,370 75.63% 24,709 12.94% 6,589 3.45% 7,317 3.83% 7,913 4.14% 190,898 100.00%
2018 147,887 75.89% 24,257 12.45% 6,667 3.42% 7,909 4.06% 8,151 4.18% 194,871 100.00%
2019 151,548 76.14% 23,812 11.96% 6,745 3.39% 8,549 4.29% 8,397 4.22% 199,051 100.00%
2020 155,279 76.35% 23,376 11.49% 6,825 3.36% 9,240 4.54% 8,650 4.25% 203,369 100.00%
2021 159,080 76.54% 22,948 11.04% 6,905 3.32% 9,987 4.81% 8,911 4.29% 207,831 100.00%
2022 162,953 76.70% 22,528 10.60% 6,986 3.29% 10,795 5.08% 9,180 4.32% 212,441 100.00%
2023 166,899 76.84% 22,115 10.18% 7,069 3.25% 11,668 5.37% 9,457 4.35% 217,207 100.00%
2024 170,919 76.94% 21,710 9.77% 7,152 3.22% 12,611 5.68% 9,742 4.39% 222,134 100.00%
2025 175,015 77.02% 21,312 9.38% 7,236 3.18% 13,631 6.00% 10,035 4.42% 227,230 100.00%
2026 179,186 77.07% 20,922 9.00% 7,322 3.15% 14,733 6.34% 10,338 4.45% 232,501 100.00%
2027 183,434 77.09% 20,539 8.63% 7,408 3.11% 15,924 6.69% 10,650 4.48% 237,954 100.00%
2028 187,758 77.08% 20,162 8.28% 7,495 3.08% 17,212 7.07% 10,971 4.50% 243,599 100.00%
AAGR 2008‐2028 2.43% ‐1.79% 1.20% 8.49% 3.20% 2.12%
Change 2008‐2028 61.58% ‐30.38% 27.05% 409.99% 87.86% 51.99%
FAA Aerospace AAGR 2007‐2010 N/A‐Remainder ‐1.50% 1.40% 12.20% 4.90% N/A
FAA Aerospace AAGR 2010‐2020 N/A‐Remainder ‐1.80% 1.20% 8.10% 3.00% N/A
Source: The LPA Group Incorporated, January 2009.

Final 3‐52 01/18/2011 St. Lucie County International Airport Master Plan Update
Critical Aircraft
Determination of the critical aircraft is fundamental in developing an airport’s design
criteria in addition to identification of the airport reference code (ARC). According to
Airport Improvement Program Handbook, Order 5100.38C – June 28, 2005, Pages 56-57,
FAA Order 5090.3C, Field Formulation of NPIAS, and FAA AC 150/5325-4B, Runway Length Requirements for Airport Design, ‘More than one critical aircraft (most demanding)
may control the design of any specific airport’s different facility features, such as runway
length, strength of paved areas, or lateral separations in airfield layout. In some cases there
may be more than one critical aircraft. For instance, pavement strength and layout are
frequently dependent upon different aircraft. Section 3.4: Airport dimensional standards
(such as runway length, width, separation standards, surface gradients, etc.) should be
selected which are appropriate for the critical aircraft that will make substantial use of the
airport in the planning period. Substantial use means either 500 or more itinerant
operations or scheduled service. The critical aircraft may be a single aircraft or a composite
of the most demanding characteristics of several aircraft. The critical aircraft (or composite
aircraft) is used to identify the appropriate ARC for airport design criteria as contained in
AC 150/5300-13.’ Further, the critical aircraft reference code is that which represents the
lowest maximum allowable crosswind.
According to FPR Air Traffic Control records, 2007 FAA approved Airport Layout Plan, and
information provided by existing tenants identified that the existing critical aircraft at FPR
as the Gulfstream II, ARC C-III. However, based upon growth of high-tech businesses
within Treasure Coast Region as well as continued growth in both fractional ownership and
corporate demand for long-range jet aircraft, it is anticipated that a more demanding
airplane or family of airplanes may become the critical aircraft which would drive short
(five-years) and long-term facility requirements. Identification of the future critical aircraft
or family of aircraft is analyzed in detail within Chapter 4, Demand/Capacity and Facility Requirements.
3.9 Peak Hour Forecasts Annual projections generally provide a good overview of the activity at an airport, but may
not reflect operational characteristics of a facility. As such, peak forecasts are developed
based on the fact that annual demand is typically not equally distributed throughout the
entire year. In many cases, facility requirements are not driven by annual demand, but
rather by capacity shortfalls and delays experienced during peak times.
Peak month operations were determined by evaluating historic monthly activity that was
recorded by the FAA Air Traffic Activity System (ATADS) database. An analysis of the
activity between the years 2000 and 2008 revealed that March has most commonly been the
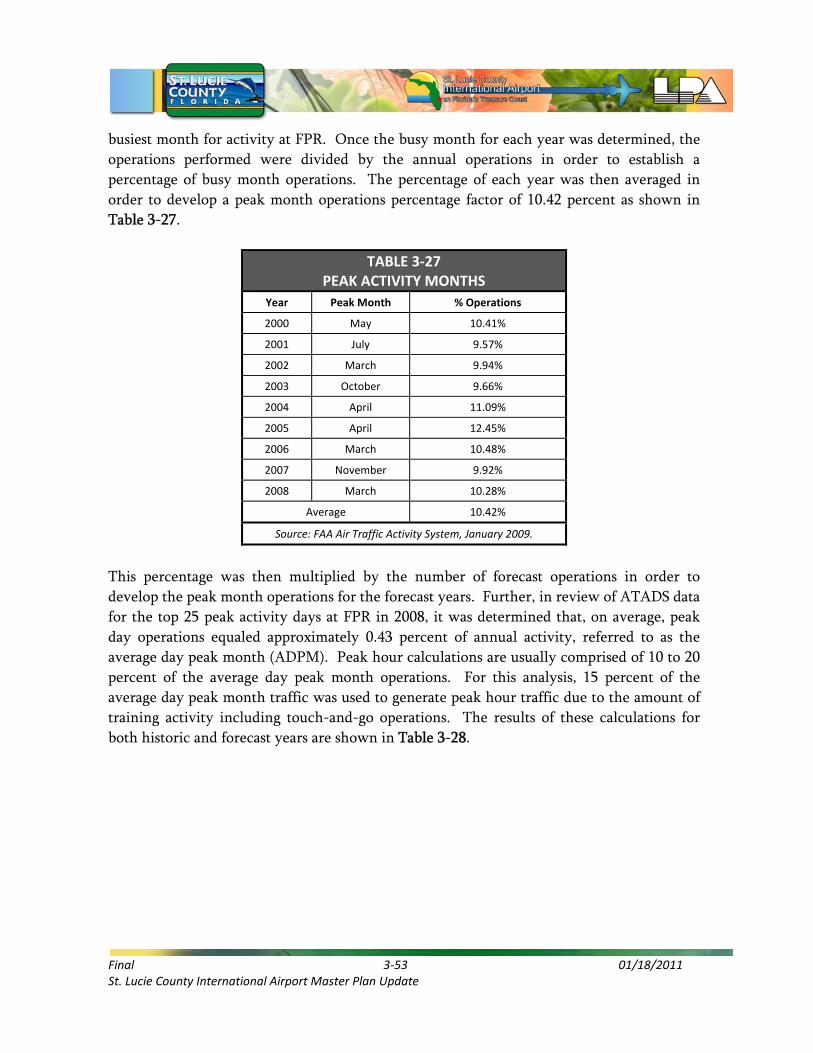
Final 3‐53 01/18/2011 St. Lucie County International Airport Master Plan Update
busiest month for activity at FPR. Once the busy month for each year was determined, the
operations performed were divided by the annual operations in order to establish a
percentage of busy month operations. The percentage of each year was then averaged in
order to develop a peak month operations percentage factor of 10.42 percent as shown in
Table 3-27.
TABLE 3‐27 PEAK ACTIVITY MONTHS
Year Peak Month % Operations
2000 May 10.41%
2001 July 9.57%
2002 March 9.94%
2003 October 9.66%
2004 April 11.09%
2005 April 12.45%
2006 March 10.48%
2007 November 9.92%
2008 March 10.28%
Average 10.42%
Source: FAA Air Traffic Activity System, January 2009.
This percentage was then multiplied by the number of forecast operations in order to
develop the peak month operations for the forecast years. Further, in review of ATADS data
for the top 25 peak activity days at FPR in 2008, it was determined that, on average, peak
day operations equaled approximately 0.43 percent of annual activity, referred to as the
average day peak month (ADPM). Peak hour calculations are usually comprised of 10 to 20
percent of the average day peak month operations. For this analysis, 15 percent of the
average day peak month traffic was used to generate peak hour traffic due to the amount of
training activity including touch-and-go operations. The results of these calculations for
both historic and forecast years are shown in Table 3-28.

Final 3‐54 01/18/2011 St. Lucie County International Airport Master Plan Update
TABLE 3‐28 PEAK HOUR OPERATIONS BREAKDOWN
Year Total
Operations Peak Month
ADPM Peak Hour
% Itinerant
Itinerant Peak Hour Operations
% Local Local Peak
Hour Operations
2008 160,277 16,704 691 104 54.04% 56 45.96% 48
2009 163,280 17,017 704 106 53.89% 57 46.11% 49
2010 166,363 17,338 717 108 53.74% 58 46.26% 50
2011 169,528 17,668 731 110 53.59% 59 46.41% 51
2012 172,776 18,006 745 112 53.43% 60 46.57% 52
2013 176,111 18,354 759 114 53.28% 61 46.72% 53
2014 179,649 18,723 775 116 53.13% 62 46.87% 54
2015 183,291 19,102 790 119 52.98% 63 47.02% 56
2016 187,039 19,493 806 121 52.83% 64 47.17% 57
2017 190,898 19,895 823 123 52.67% 65 47.33% 58
2018 194,871 20,309 840 126 52.52% 66 47.48% 60
2019 199,051 20,745 858 129 52.37% 67 47.63% 61
2020 203,369 21,195 877 132 52.22% 69 47.78% 63
2021 207,831 21,660 896 134 52.06% 70 47.94% 64
2022 212,441 22,140 916 137 51.91% 71 48.09% 66
2023 217,207 22,637 937 140 51.76% 73 48.24% 68
2024 222,134 23,150 958 144 51.61% 74 48.39% 70
2025 227,230 23,681 980 147 51.46% 76 48.54% 71
2026 232,501 24,231 1,002 150 51.46% 77 48.54% 73
2027 237,954 24,799 1,026 154 51.46% 79 48.54% 75
2028 243,599 25,387 1,050 158 51.46% 81 48.54% 76
AAGR 2008‐2028 2.12% 2.12% 2.12% 2.12% 1.87% 2.40%
Change 2008‐2028 51.99% 51.99% 51.99% 51.99% 44.71% 60.54%
3.10 Summary In summary, the data and methods used to forecast aviation demand for FPR are consistent
with those used by the FAA and other airports located within the State of Florida. The
forecasts presented in this study, as shown in Table 3-29, are considered to accurately reflect
the activity anticipated at FPR through 2028, provided that facilities necessary to
accommodate this demand are made available. Overall, the current activity at FPR is
expected to show moderate growth throughout the forecast period.
On March 27, 2009, St. Lucie County International Airport management received FAA
approval of the twenty-year aviation activity forecasts presented in this report. A copy of
the approval letter is provided in Appendix H of this report.

Final 3‐55 01/18/2011 St. Lucie County International Airport Master Plan Update
TABLE 3‐29 AIRPORT PLANNING FORECASTS
FORECAST LEVELS AND GROWTH RATES
St. Lucie County International Airport, Fort Pierce, Florida
Base Year: 2008
Source: The LPA Group Incorporate, 2009 Average Annual Compound Growth Rates
Base Yr. Level
Base Yr. + 1yr.
Base Yr. + 5yrs.
Base Yr. + 10yrs.
Base Yr. + 15yrs.
Base Yr. + 20yrs.
Base yr. to +1
Base yr. to +5
Base yr. to +10
Base yr. to +15
Base yr. to +20
OPERATIONS
Itinerant Operations:
Air Carrier 0 0 0 0 0 0 NA NA NA NA NA
Air Taxi 953 978 1,088 1,244 1,421 1,623 2.70% 2.70% 2.70% 2.70% 2.70%
GA 85,566 86,916 92,650 101,009 110,909 123,625 1.58% 1.60% 1.67% 1.74% 1.86%
Military 96 96 96 96 96 96 0.00% 0.00% 0.00% 0.00% 0.00%
Total Itinerant Operations 86,616 87,991 93,835 102,349 112,427 125,345 1.59% 1.61% 1.68% 1.75% 1.87%
Local Operations:
GA 73,400 75,028 82,014 92,261 104,519 117,993 2.22% 2.24% 2.31% 2.38% 2.40%
Military 261 261 261 261 261 261 0.00% 0.00% 0.00% 0.00% 0.00%
Total Local Operations 73,662 75,290 82,276 92,522 104,780 118,254 2.21% 2.24% 2.31% 2.38% 2.40%
TOTAL OPERATIONS 160,277 163,280 176,111 194,871 217,207 243,599 1.87% 1.90% 1.97% 2.05% 2.12%
Instrument Operations 24,261 24,770 26,918 29,865 33,136 36,764 2.10% 2.10% 2.10% 2.10% 2.10%
Peak Hour Operations 104 106 114 126 140 158 1.87% 1.90% 1.97% 2.05% 2.12%
BASED AIRCRAFT
Single‐Engine Piston 122 125 137 155 175 199 2.16% 2.34% 2.42% 2.45% 2.47%
Multi‐Engine Piston 59 59 59 59 59 59 0.00% 0.00% 0.00% 0.00% 0.00%
Turboprop 12 12 13 14 15 17 1.50% 1.60% 1.64% 1.65% 1.66%
Jet 14 15 20 26 34 46 8.94% 7.02% 6.39% 6.18% 6.08%
Helicopter 4 4 5 6 7 8 5.28% 3.91% 3.46% 3.31% 3.24%
TOTAL BASED AIRCRAFT 211 215 233 260 291 327 2.03% 2.04% 2.10% 2.16% 2.22%
OPERATIONAL FACTORS
Total GA Operations Per Based Aircraft (OPBA)
760 758 754 750 747 744 ‐0.15% ‐0.14% ‐0.12% ‐0.11% ‐0.10%
Local GA Operations Per Based Aircraft
349 350 352 356 360 361 0.18% 0.19% 0.20% 0.21% 0.17%

Final 3‐56 01/18/2011 St. Lucie County International Airport Master Plan Update
This page intentionally left blank.