
Chapter 3: Concurrent Engineering and Information...
38
Chapter 3: Concurrent Engineering and Information System for Product Development Product and process technology is rapidly evolving to overcome the challenges of global competition. Customers are placing more emphasis on quality and reliability, at the same time looking for more good value. Time to market or speed to market is becoming a key paradigm of world-class manufacturing. To respond to this dynamic and challenging environment, manufacturers are implementing concurrent engineering concepts to reduce design cycle time and increase product value. While design for manufacturability (DFM) is core part of concurrent engineering, its concepts are based on the entire product life cycle from concept development through use and disposal. Different approaches for concurrent design of product and process is explained in the first part of this chapter. Cost and time impact of DFM concepts and different process planning approaches are detailed in the later part of this chapter. CE system for product and process design is presented with the need for an object-oriented database management system to represent this information. Finally, data base application and Group Technolog (GT) in the context of data mining and decision support systems are explained in the last part of this chapter. 3.1 Concurrent Engineering Concurrent engineering is based on the concept of integration of design of products, manufacturing and support process. It is different from the traditional way of assessing manufacturability of the product after it has been designed, and then making appropriate changes to the product to enhance its producibility. This approach increase the design cycle time, increases the product development cost, and may not result in the optimum way to produce the product. Instead, manufacturability has to be considered 47
Transcript of Chapter 3: Concurrent Engineering and Information...

Chapter 3: Concurrent Engineering and
Information System for Product Development
Product and process technology is rapidly evolving to overcome the
challenges of global competition. Customers are placing more emphasis on
quality and reliability, at the same time looking for more good value. Time
to market or speed to market is becoming a key paradigm of world-class
manufacturing. To respond to this dynamic and challenging environment,
manufacturers are implementing concurrent engineering concepts to reduce
design cycle time and increase product value. While design for
manufacturability (DFM) is core part of concurrent engineering, its
concepts are based on the entire product life cycle from concept
development through use and disposal.
Different approaches for concurrent design of product and process is
explained in the first part of this chapter. Cost and time impact of DFM
concepts and different process planning approaches are detailed in the later
part of this chapter. CE system for product and process design is presented
with the need for an object-oriented database management system to
represent this information. Finally, data base application and Group
Technolog (GT) in the context of data mining and decision support systems
are explained in the last part of this chapter.
3.1 Concurrent Engineering
Concurrent engineering is based on the concept of integration of design of
products, manufacturing and support process. It is different from the
traditional way of assessing manufacturability of the product after it has
been designed, and then making appropriate changes to the product to
enhance its producibility. This approach increase the design cycle time,
increases the product development cost, and may not result in the optimum
way to produce the product. Instead, manufacturability has to be considered
47
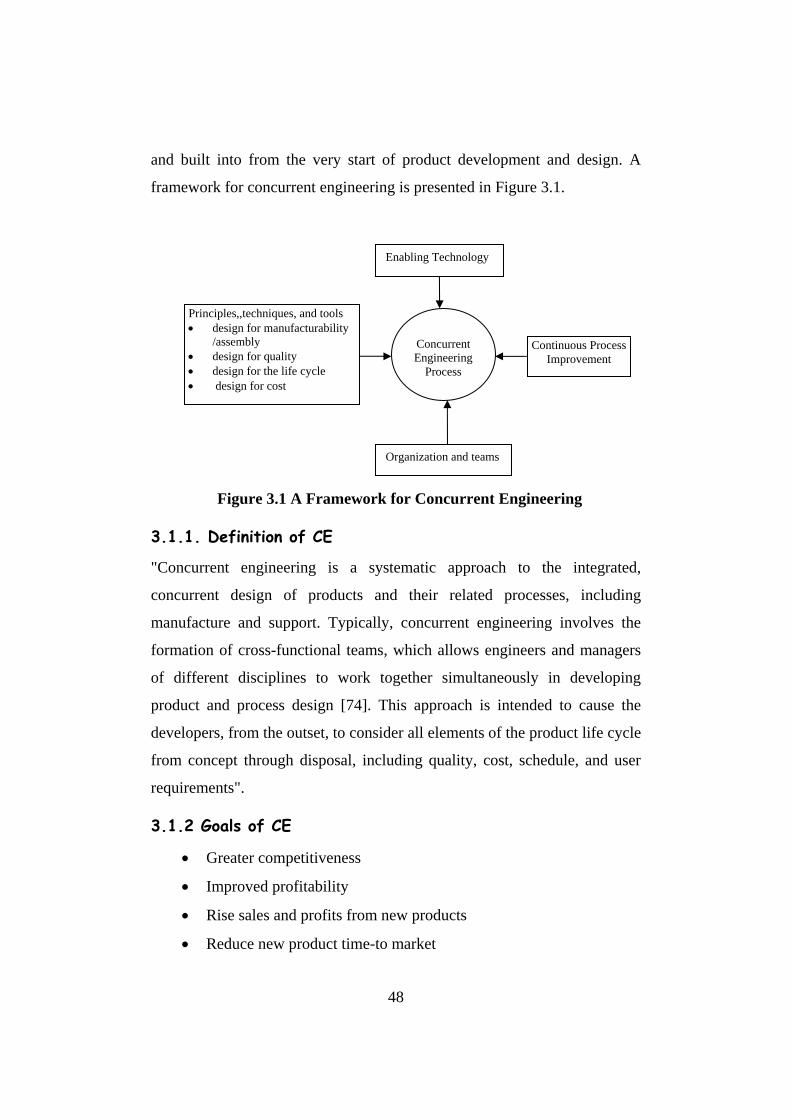
and built into from the very start of product development and design. A
framework for concurrent engineering is presented in Figure 3.1.
Concurrent Engineering
Process
Enabling Technology
Continuous Process Improvement
Principles,,techniques, and tools • design for manufacturability
/assembly • design for quality • design for the life cycle • design for cost
Organization and teams
Figure 3.1 A Framework for Concurrent Engineering
3.1.1. Definition of CE
"Concurrent engineering is a systematic approach to the integrated,
concurrent design of products and their related processes, including
manufacture and support. Typically, concurrent engineering involves the
formation of cross-functional teams, which allows engineers and managers
of different disciplines to work together simultaneously in developing
product and process design [74]. This approach is intended to cause the
developers, from the outset, to consider all elements of the product life cycle
from concept through disposal, including quality, cost, schedule, and user
requirements".
3.1.2 Goals of CE
• Greater competitiveness
• Improved profitability
• Rise sales and profits from new products
• Reduce new product time-to market
48
• Reduce human and capital costs
• Maintain or increase product quality
• Leverage knowledge and experience
• Close integration between departments and promotion of team
spirit
3.1.3 Scope of CE
• Implement process changes within 1-2 years
• Involve people with stakes in new products
• Focus on business process improvements
3.2 Systems Engineering Based Approach for Product and Process Concurrent Design
Design of the product and the process have to be integrated to assure
optimum process is used for manufacturing of the product. This additional
consideration is also needed to ensure integration of the design of the
product [74].
3.2.1 Product Upstream Design
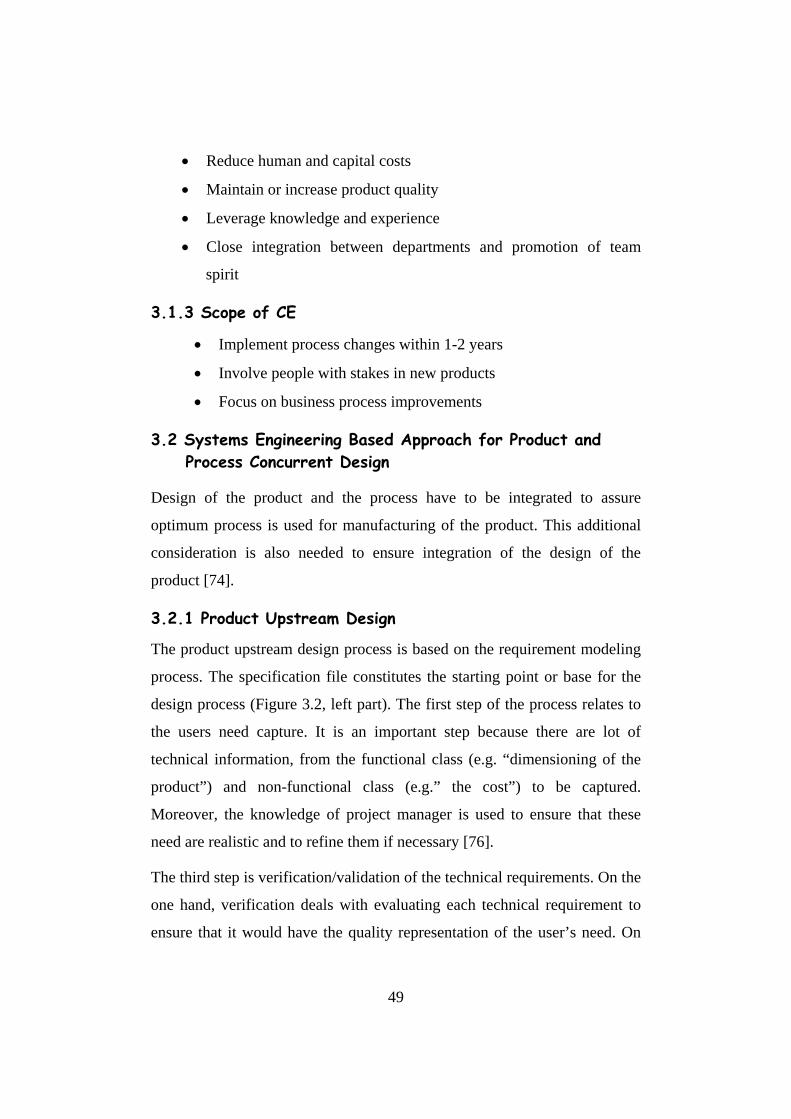
The product upstream design process is based on the requirement modeling
process. The specification file constitutes the starting point or base for the
design process (Figure 3.2, left part). The first step of the process relates to
the users need capture. It is an important step because there are lot of
technical information, from the functional class (e.g. “dimensioning of the
product”) and non-functional class (e.g.” the cost”) to be captured.
Moreover, the knowledge of project manager is used to ensure that these
need are realistic and to refine them if necessary [76].
The third step is verification/validation of the technical requirements. On the
one hand, verification deals with evaluating each technical requirement to
ensure that it would have the quality representation of the user’s need. On
49
the other hand, it has to be ensured that there is no contradiction among the
expressed requirements. Validation is based on the stakeholder needs, which
led to requirement description. The task here is to ensure that each
stakeholder needs have been taken into consideration.
The technical requirements verification / validation failure results in return
to the requirements analysis step. At the end of this step, product design
process is achieved and the product design file is transferred to the
manufacturing process upstream design, which will analyse it. This process
responds either by a continuation development acceptance or by a
modification request. The second situation is associated with a technology
modification request or with a non-conformity problem. This implies a new
capture of the users needs.
Figure 3.2 Product (on left) and (on right) Process Upstream Co-design [76]
3.2.2 Process Upstream Design
This design process is based on the inputs from the requirement modeling
process (Figure 3.2, right part). The product design process, starts with the
stakeholder needs capture. In addition to the stakeholder needs, this step has
to take into account the information transmitted by the product design
50
process, by the way of the product design file. This set of needs is analysed
and refined and is passed on to the next step.
In the requirements analysis also ensures feasibility of the needs. This
activity is relies on the experience feedback. A set of system technical
requirements is then made available.
The verification/validation step can lead to conclusion that some technical
requirements do not satisfy the initial needs. In that case, a new iteration is
carried out within the design process, as an internal feedback. When these
iterations end, the result of this step is transferred to product design process.
The outcomes are, the product associated to the design file proposed is
feasible, or it is feasible with some compromise of realisation, or it is not
feasible. The product design process will work till the product is realisable
and it is possible to continue the development of the process design. The
virtual prototyping step can be then started. The objective of this is to obtain
the best knowledge of the manufacturing process, before its actual
realisation.
3.2.3 Product and Process Co-design
Concurrent design consists of binding the two design processes as suggested
in Figure 3.2. The product design process is a “major” part of the design
movement, which provides a design file expressing a set of technical
requirements that the process design task would have to take into
consideration. The process design task considers the following:
1. The product design file containing the description of a feasible product,
which is then passed to the next level.
2. If product detailed in the design file is not feasible, and then the
upstream design processes will have to be reactivated for fixing new
technical requirements.
3. If the product is feasible with some minor modifications, the product
51
design team checks the acceptability of these modifications for meeting
the stakeholder needs and give a new product design file with more
precise design information.
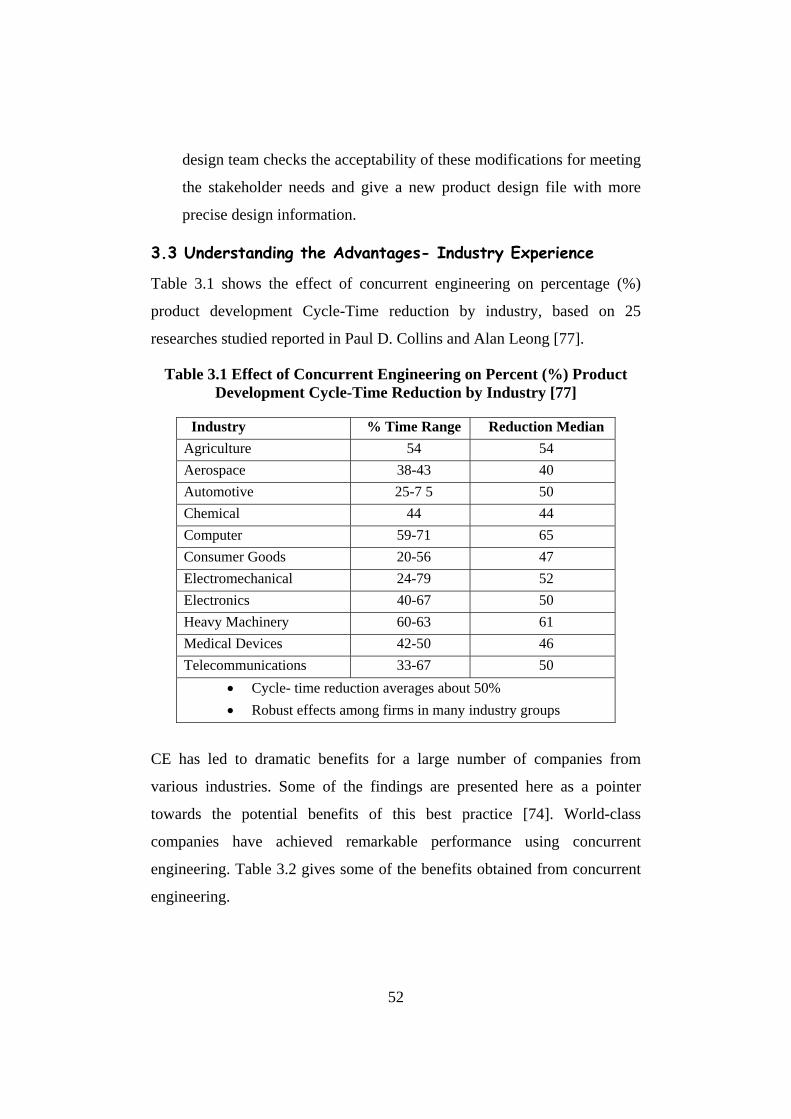
3.3 Understanding the Advantages- Industry Experience
Table 3.1 shows the effect of concurrent engineering on percentage (%)
product development Cycle-Time reduction by industry, based on 25
researches studied reported in Paul D. Collins and Alan Leong [77].
Table 3.1 Effect of Concurrent Engineering on Percent (%) Product Development Cycle-Time Reduction by Industry [77]
Industry % Time Range Reduction Median Agriculture 54 54 Aerospace 38-43 40 Automotive 25-7 5 50 Chemical 44 44 Computer 59-71 65 Consumer Goods 20-56 47 Electromechanical 24-79 52 Electronics 40-67 50 Heavy Machinery 60-63 61 Medical Devices 42-50 46 Telecommunications 33-67 50
• Cycle- time reduction averages about 50% • Robust effects among firms in many industry groups
CE has led to dramatic benefits for a large number of companies from
various industries. Some of the findings are presented here as a pointer
towards the potential benefits of this best practice [74]. World-class
companies have achieved remarkable performance using concurrent
engineering. Table 3.2 gives some of the benefits obtained from concurrent
engineering.
52
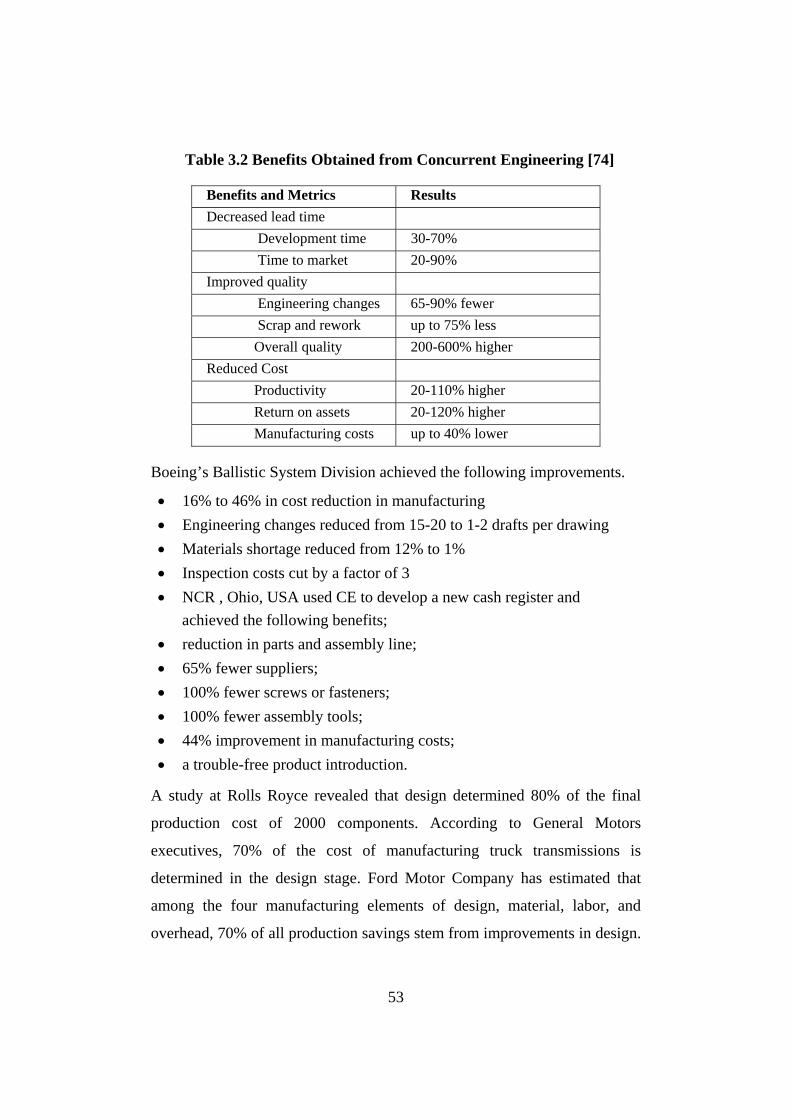
Table 3.2 Benefits Obtained from Concurrent Engineering [74]
Benefits and Metrics Results Decreased lead time Development time 30-70% Time to market 20-90% Improved quality Engineering changes 65-90% fewer Scrap and rework up to 75% less Overall quality 200-600% higher Reduced Cost Productivity 20-110% higher Return on assets 20-120% higher Manufacturing costs up to 40% lower
Boeing’s Ballistic System Division achieved the following improvements.
• 16% to 46% in cost reduction in manufacturing • Engineering changes reduced from 15-20 to 1-2 drafts per drawing • Materials shortage reduced from 12% to 1% • Inspection costs cut by a factor of 3 • NCR , Ohio, USA used CE to develop a new cash register and
achieved the following benefits; • reduction in parts and assembly line; • 65% fewer suppliers; • 100% fewer screws or fasteners; • 100% fewer assembly tools; • 44% improvement in manufacturing costs; • a trouble-free product introduction.
A study at Rolls Royce revealed that design determined 80% of the final
production cost of 2000 components. According to General Motors
executives, 70% of the cost of manufacturing truck transmissions is
determined in the design stage. Ford Motor Company has estimated that
among the four manufacturing elements of design, material, labor, and
overhead, 70% of all production savings stem from improvements in design.
53

A study revealed that product design is responsible for only 5% of a
product’s cost; it can however determine 75% or more of all manufacturing
costs and 80% of a product’s quality and performance. Another study shows
that 70% of the life cycle cost of a product is determined at the design stage
[Figure 3.3]. The life cycle cost here refers to cost of materials,
manufacture, use, repair, and disposal of a product [78, 79].
5
50
35 30
70
20
5 50
1020304050607080
DESIGN MATERIAL LABOUR OVER HEAD
PRODUCT COST
LIFE CYCLE COST
Figure 3.3 Product Cost Vs Life Cycle Cost
3.4 Traditional Versus Concurrent Design
Competition in the marketplace forces machine tool manufacturing firms to
continuously-generate new (and more attractive) product designs while
maintaining high quality, low costs and short lead-times [7]. Traditionally,
decisions on these issues were taken in a serial pattern. First, a product
design was selected from a set of feasible designs, driven primarily by
marketing objectives and engineering constraints. The chosen design was
then transferred to the production planning function that developed an
appropriate manufacturing plan. Such plans were guided primarily by
operational objectives (e.g., cost minimization, capacity utilization, load
balancing, etc.). Finally, the product design and the production plan
decisions became constraints for the logistics function that determined the
supply sources. This serial pattern is known to generate solutions that suffer
54

from two major deficiencies [45].
Figure 3.4 Sequential and Concurrent Development of New Product[5]
First, it is slow because parallel processing opportunities are often missed.
Second, it leads to sub-optimal solutions, because each stage can make, at
best, sequential locally optimal choices. Concurrent engineering (CE) is a
paradigm aimed at eliminating such flaws. CE dictates that product and
process decisions are made in parallel as much as possible, that production
considerations to be incorporated into the early stages of product design. CE
concept leads to a fundamental tradeoff. On one hand, it reduces the need
for re-design and re-work (thus reducing development time) and increases
the chances for smoother production (thus helping to minimize cost and
55

improve quality). Figure 3.4 shows process in sequential and concurrent
development in a machine tool manufacturing company [5, 8].
3.5 DFM and Concurrent Engineering
Generally, concurrent engineering (and DFM) is accomplished through a
iterative “spiral” design process (shown in Figure 3.5) in which marketing
experts, designers, manufacturing engineers, and other personnel jump back
and forth between identification of customer needs, design of the product,
and assessment of manufacturing issues [34,37].
Barriers to effective DFM and concurrent engineering occur when the
people performing marketing, design, and manufacturing cannot
communicate or share knowledge. For example, when designers lack
detailed knowledge of the current manufacturing practices and the
manufacturing engineers are not available to provide this assessment, the
designers may not be able to do sufficient manufacturing assessments of
their designs. The result may be commitment to a design that is
unnecessarily expensive to manufacture.
Before the industrial revolution, the salesperson, designer, and craftsperson
were often the same person. This person had a detailed understanding of the
customer’s needs: how the design would meet those needs, and how it
would be made. Concurrent engineering naturally occurred within that
person’s head. However, as industries have grown in size and complexity,
marketing, design, and manufacturing departments have evolved into
separate departments, each with their own specialized knowledge. While
this makes the streamlined creation of complex products possible, it has also
increased the knowledge and communication barriers between these areas.
The goal behind many DFX tools is to supply designers with manufacturing,
quality, environmental impact, or other product life cycle knowledge that is
otherwise inaccessible. Various ways in which these methods may be
56
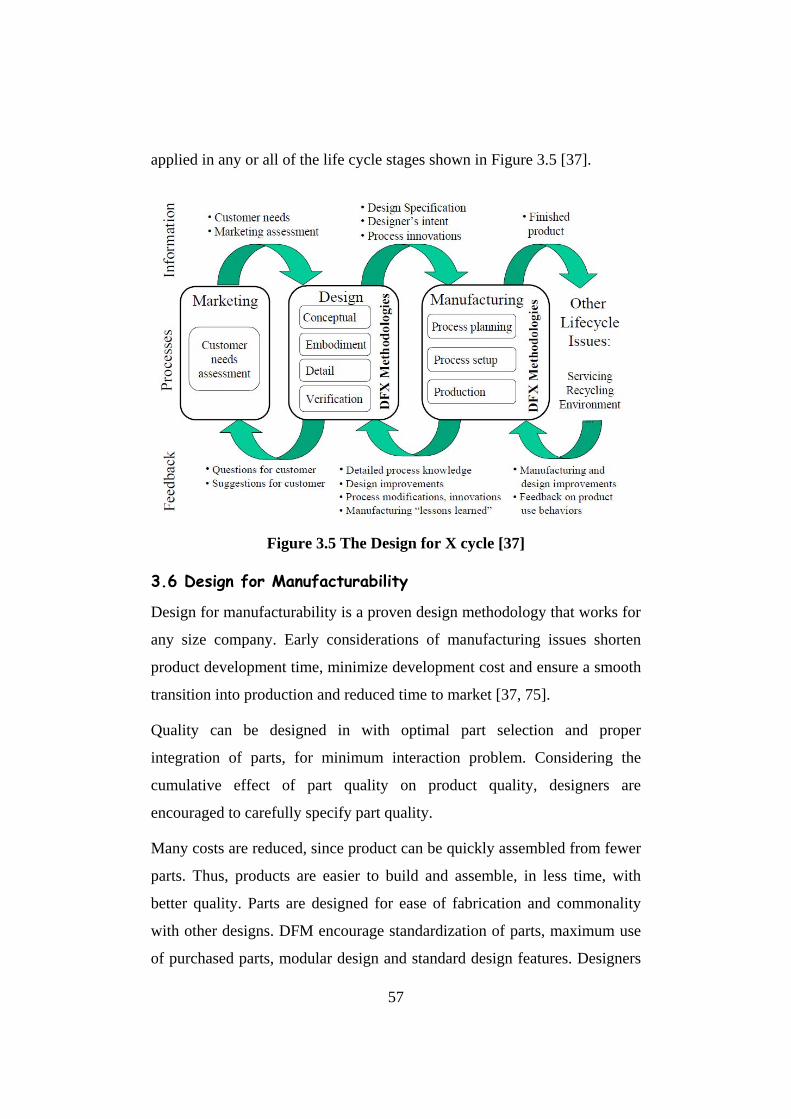
applied in any or all of the life cycle stages shown in Figure 3.5 [37].
Figure 3.5 The Design for X cycle [37]
3.6 Design for Manufacturability
Design for manufacturability is a proven design methodology that works for
any size company. Early considerations of manufacturing issues shorten
product development time, minimize development cost and ensure a smooth
transition into production and reduced time to market [37, 75].
Quality can be designed in with optimal part selection and proper
integration of parts, for minimum interaction problem. Considering the
cumulative effect of part quality on product quality, designers are
encouraged to carefully specify part quality.
Many costs are reduced, since product can be quickly assembled from fewer
parts. Thus, products are easier to build and assemble, in less time, with
better quality. Parts are designed for ease of fabrication and commonality
with other designs. DFM encourage standardization of parts, maximum use
of purchased parts, modular design and standard design features. Designers
57
will save time and money by not having to “reinvent the wheel”. The result
is a broader product line that is responsive to customer needs.
Companies that have applied DFM have realized substantial benefits. Cost
and time to market are often cut in half, with significant improvement in
quality, reliability, serviceability, product line breadth, delivery, customer
acceptance and general competitive posture.
Understand basic DFM/A Principles
Develop company specific guidelines and train designers
Get manufacturers and suppliers involved early
Utilize DFM/A analysis tools and matrices
Embed design guidelines in design automation systems
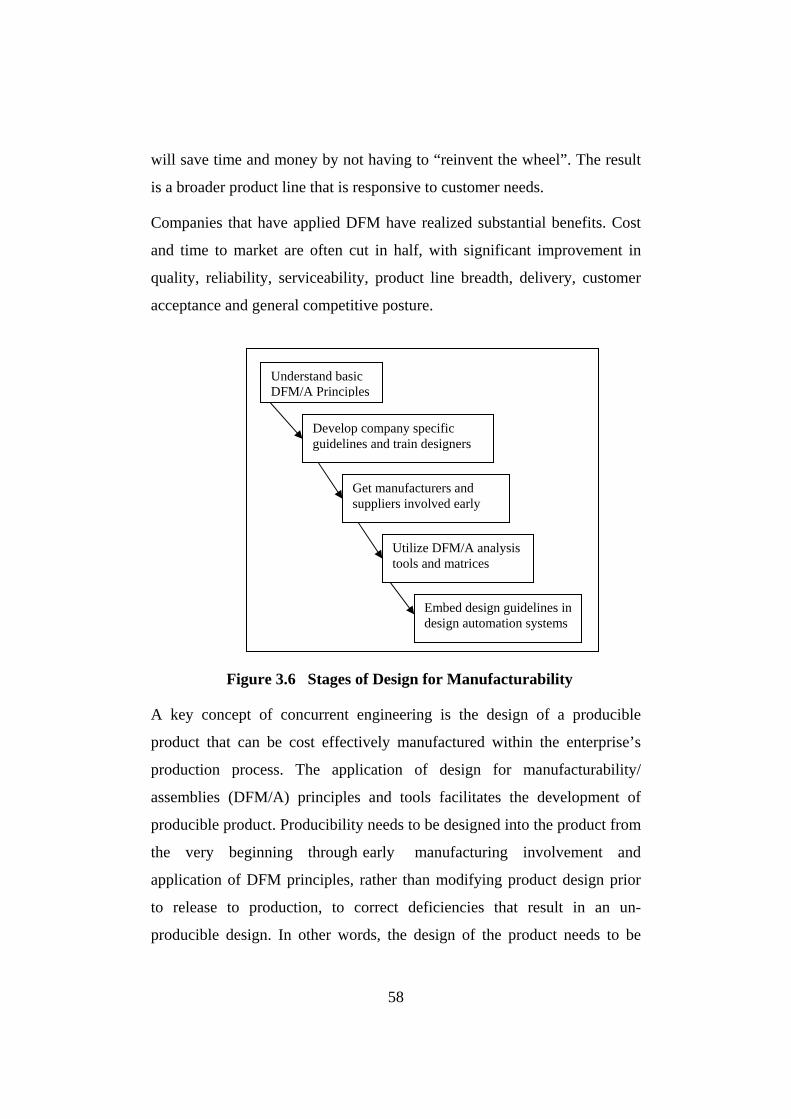
Figure 3.6 Stages of Design for Manufacturability
A key concept of concurrent engineering is the design of a producible
product that can be cost effectively manufactured within the enterprise’s
production process. The application of design for manufacturability/
assemblies (DFM/A) principles and tools facilitates the development of
producible product. Producibility needs to be designed into the product from
the very beginning through early manufacturing involvement and
application of DFM principles, rather than modifying product design prior
to release to production, to correct deficiencies that result in an un-
producible design. In other words, the design of the product needs to be
58
integrated with the design of the manufacturing process. There is a series of
evolutionary stages that an organization will typically take to incorporate
DFM/ A concepts [37, 75]. These stages are shown in Figure 3.6.
3.6.1 Benefits of DFM
DFM can increase profits both by increasing revenue and by lowering costs.
The principle of considering all goals and constraints early can produce a
better product, in addition to a more manufacturable one. Further, the
product will enter the market place earlier, because an inherently simpler
product is designed right the first time, without the introduction of any
problem, delays and change orders. Having a better product that enters the
market sooner can have a substantial effect on sales. Sales and market share
projections can quantify this potential.
The other source of increased profits is cost reduction. It should be
emphasized that any cost saving go straight to the bottom line as profit.
1. Assembly cost saving. 2. Part fabrication cost saving. 3. Work-in-process Inventory saving 4. Market flexibility and delivery 5. Finished goods inventory saving. 6. Material overhead savings 7. Machinery utilization savings 8. Floor space savings 9. Quality cost savings 10. Development cost savings 11. Product sooner to market. 12. Superior product design
3.6.2 The Early Effects of Design
By the time a product has been designed, only about 8 % of the total product
budget has been spent. However, by that point, the design has determined
80% of the lifetime cost of the product. (See Figure 3.7). The design
determines the manufacturability, and that determines a significant part of
the introduction and production cost, of 80 % of the product. Once this cost
is locked in, it is very hard for manufacturing to remove it. Cost reduction
programs should start with product design, because it has the most influence
over the design’s overall cost.
59

Figure 3.7 Product Cost Vs Time
3.6.3 DFM Versus Design Time
Designers may also be tempted to think that considering all these constraints
will delay the completion of the design. However, it really takes no more
time (may be even less time), because thinking about all the constraints at
once will steer the designer more quickly to the optimal design.
Table 3.3 Cost of Engineering Changes [75]
Time of design Change Cost $
During Design 1,000 During Design Testing 10,000 During Process Planning 100,000 During Test Production 1,000,000
During Final Production 10,000,000
The net result of not considering manufacturability early is a design, which
will not easily incorporate DFM principles later. In order to make such a
design manufacturable, it may be necessary to make changes in the design.
The cost of changes rises drastically as the product progresses towards
production. Table 3.3 shows how the cost for each change escalates during
60
the development of major electronic product [75]. A very expensive and
time-consuming way to implement DFM is through engineering change
orders (ECO’s). Thus, spending a little time early on DFM saves a lot of
time later by avoiding changes and redesigns.
3.7 Understanding Manufacturing
Designers should know the process that will be used to build what they
design. No one would be impressed with recipes created by someone who
never cooked. Similarly, designer should be familiar with all the processes
they are specifying. This is the only way they can choose the right process,
specify the right tolerance, utilize existing factory process, minimize setup
changes, and assure smooth product introduction. All of these will minimize
costs.
3.7.1 Process Capability
Process capability is the repeatability and consistency of a manufacturing
process, relative to the customer requirements in terms of specification
limits of a product parameter. This measure is used to objectively measure
the degree to which your process is meeting or is not meeting the
requirements [15, 80]. Capability indices have been developed to
graphically portray that measure. Capability indices let you place the
distribution of your process in relation to the product specification limits.
Capability indices are to be used to determine whether the process, given its
natural variation, is capable of meeting established specifications. It is also a
measure of the manufacturability of the product with the given processes.
Capability indices can be used to compare the product/process matches and
identify the poorest match (lowest capability). The poorest matches then can
be targeted on a priority basis for improvement.
The Figure 3.8 shows a series of sample distributions that fall inside of and
outside of the specification limit [80]. This is an example of an unstable, and
61
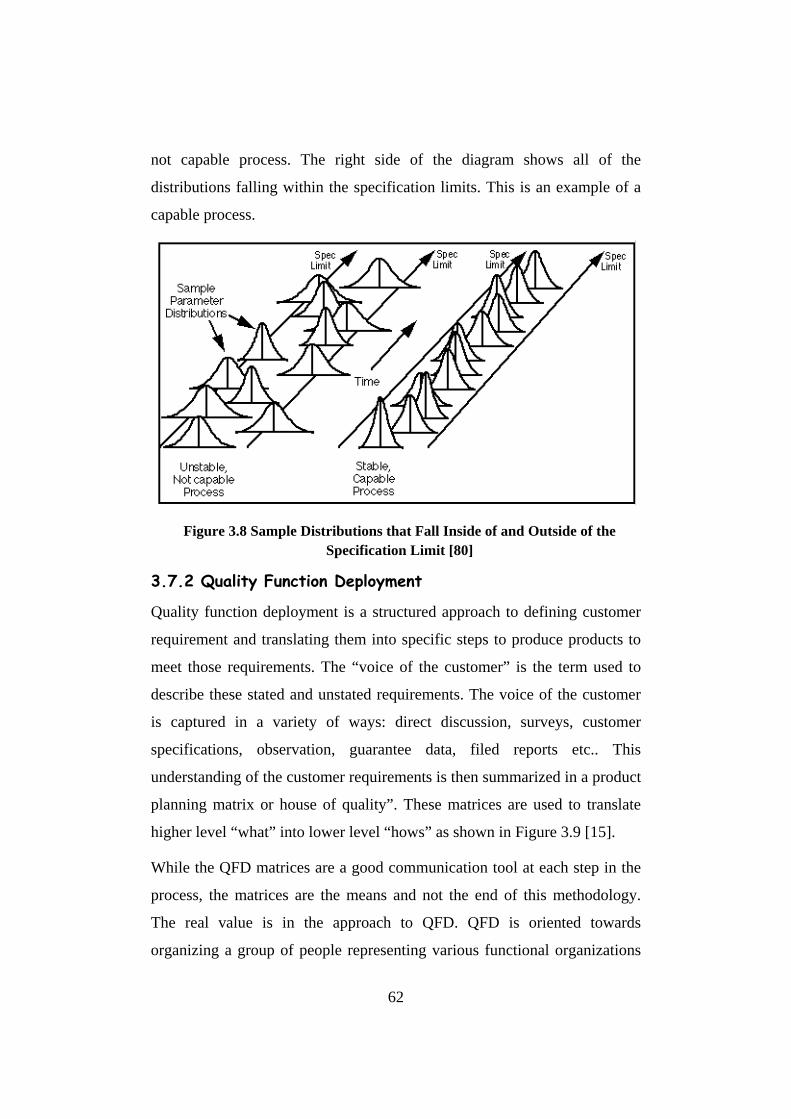
not capable process. The right side of the diagram shows all of the
distributions falling within the specification limits. This is an example of a
capable process.
Figure 3.8 Sample Distributions that Fall Inside of and Outside of the Specification Limit [80]
3.7.2 Quality Function Deployment
Quality function deployment is a structured approach to defining customer
requirement and translating them into specific steps to produce products to
meet those requirements. The “voice of the customer” is the term used to
describe these stated and unstated requirements. The voice of the customer
is captured in a variety of ways: direct discussion, surveys, customer
specifications, observation, guarantee data, filed reports etc.. This
understanding of the customer requirements is then summarized in a product
planning matrix or house of quality”. These matrices are used to translate
higher level “what” into lower level “hows” as shown in Figure 3.9 [15].
While the QFD matrices are a good communication tool at each step in the
process, the matrices are the means and not the end of this methodology.
The real value is in the approach to QFD. QFD is oriented towards
organizing a group of people representing various functional organizations
62

that are involved in product development, marketing, design engineering,
quality assurance, manufacturing/manufacturing engineering, finance,
product support etc.
Product Planning matrix Deployment matrix Process planning matrix Process/Quality
Trade off
How What
Vs Hows
How much
Why
What
How What
Vs Hows
How much
What
How What
Vs Hows
How much
What How
What Vs
Hows
How much
What
Figure 3.9 Quality Function Deployment (QFD) [15] Active involvement of these departments can lead to balanced consideration
of the requirements or “what” at each stage of this translation process and
provide a mechanism to communicate hidden knowledge – knowledge that
is known by one individual or department but may not otherwise be
communicated through the organization. As a result, QFD is an effective
communication and quality-planning tool.
63

One of the common issues with many companies is that they have not
understood what QFD really is or what it can do for them. If one explores
the common issues companies face with new product development, one can
better understand how QFD can fit into the development process to address
the following issues:
1. Current and future customer needs are not adequately understood. 2. The competitive situation is not understood nor adequately considered. 3. Inadequate attention is paid to developing a product strategy and value
proposition. 4. Product requirements and specifications are not carefully balanced
against needs and implications. 5. Insufficient attention is given to developing collaboration and
teamwork. 6. In the rush to develop a new product, inadequate attention is given to
developing and evaluating concept alternatives. 7. Critical characteristics, process requirements and quality controls are
not effectively linked.
3.7.3 Design for Cost
Product costs are a major consideration in the development of most
products. Marketing will generally intend that a new product be targeted for
a particular price point, or the product will be proposed to a customer for
development based on a quoted product cost. This projected product cost
may also include an allocation of the estimated cost (budget) for the
development effort. These target costs are provided to the design team as
part of the product specification. Techniques such as quality function
deployment may also include target costs as part of the product-planning
matrix. Cost targets are essential information to help a product development
team understand what it needs to accomplish, that is, design to cost.
With a larger, more complicated product/system that may involve multiple
product development team, these target cost need to be allocated to different
64
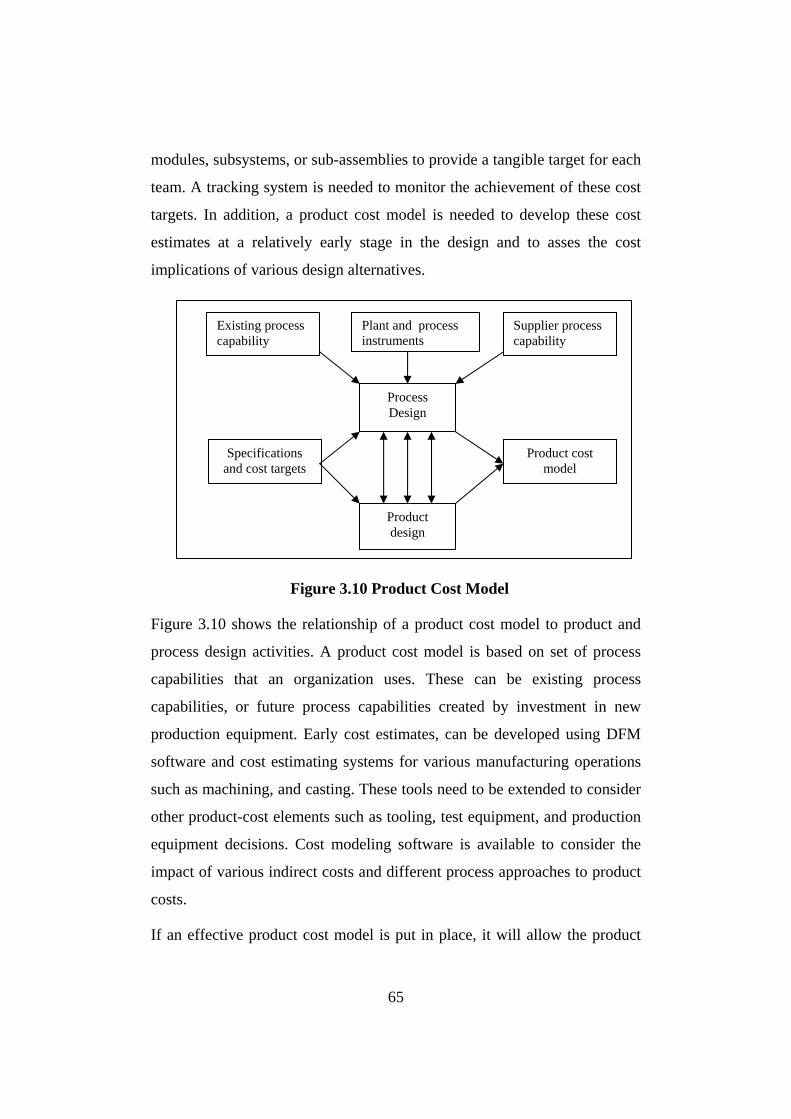
modules, subsystems, or sub-assemblies to provide a tangible target for each
team. A tracking system is needed to monitor the achievement of these cost
targets. In addition, a product cost model is needed to develop these cost
estimates at a relatively early stage in the design and to asses the cost
implications of various design alternatives.
Existing process capability
Plant and process instruments
Product design
Specifications and cost targets
Product cost model
Process Design
Supplier process capability
Figure 3.10 Product Cost Model
Figure 3.10 shows the relationship of a product cost model to product and
process design activities. A product cost model is based on set of process
capabilities that an organization uses. These can be existing process
capabilities, or future process capabilities created by investment in new
production equipment. Early cost estimates, can be developed using DFM
software and cost estimating systems for various manufacturing operations
such as machining, and casting. These tools need to be extended to consider
other product-cost elements such as tooling, test equipment, and production
equipment decisions. Cost modeling software is available to consider the
impact of various indirect costs and different process approaches to product
costs.
If an effective product cost model is put in place, it will allow the product
65
development team to integrate and summaries the results of many detailed
design decisions, and evaluate the effects of different product and process
design alternatives. The result will be a projection of product cost, which
can be compared to cost target and used to monitor the achievement of
design-to-cost objectives.
3.8 Basic Process Planning Systems
Since the first CAPP system was developed in the early 1960's, there has
been a proliferation of development that leads to various CAPP systems,
from research and industrial prototypes to company and commercial
packages, being tailored to different planning problems and offering a
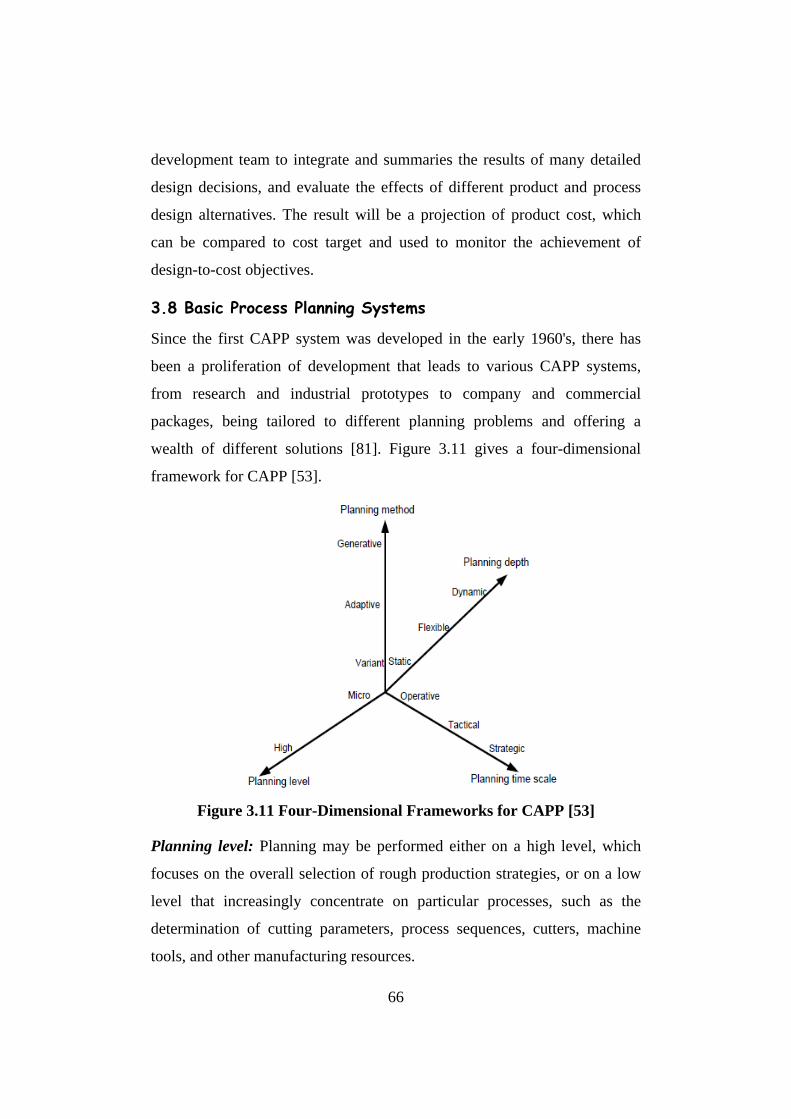
wealth of different solutions [81]. Figure 3.11 gives a four-dimensional
framework for CAPP [53].
Figure 3.11 Four-Dimensional Frameworks for CAPP [53]
Planning level: Planning may be performed either on a high level, which
focuses on the overall selection of rough production strategies, or on a low
level that increasingly concentrate on particular processes, such as the
determination of cutting parameters, process sequences, cutters, machine
tools, and other manufacturing resources.
66
Planning time scale: The planning time scale can range from short-term
planning of a certain production to long-term development of the entire
production facilities. Short-term planning is more concerned with
manufacturing operations at the shop-floor level, for example, processes,
process sequences, and manufacturing resource utilization. Medium-scale
planning is based on cost, quality, and process capability, while long-term
planning is carried out at the company level to control the total production
activities of a manufacturing company. The material planning, production
technology, machine cell layout, and production system capability are
considered here.
Planning methods: Variant and generative approaches are two basic
approaches of the decision-making strategies. Some systems use hybrid
decision-making strategies, which utilize both variant and generative
approaches.
Planning depth: The generated plans can be treated as fixed or variable
according the shop-floor scheduling systems. If a system uses static
planning, the plans cannot be modified after being generated. For flexible
planning, rough plans without actual manufacturing resources are created
off-line. The shop-floor schedulers carry out the final detailed on-line
planning and the choice of manufacturing resources. Dynamic planning can
change results during the manufacture of parts according to the dynamic
state of manufacturing systems.
At present, there are two general approaches to computer-aided process
planning variant and generative; each one is associated with specific
planning techniques. These two approaches are discussed in brief.
3.8.1 Variant Process Planning (VPP)
The variant approach, which marks the beginning of CAPP systems, is
basically a computerized database-retrieval approach. It is based on group
67
technology, classifying and coding parts for the purpose of segregating these
parts into family groups [48]. Standard process plans are stored for each part
family. The plans for new parts are derived by the modification of the
standard process plans of part families. It follows the principle that similar
parts require similar plans. Therefore, the process requires a human operator
to classify part, input part information, retrieves a similar process plan from
a database (which contains the previous process plans) and edit the plan to
produce a new variation of the pre-existing process plan. Planning for a new
part involves retrieving of an existing plan and modification. In some
variant systems, parts are grouped into a number of part families,
characterized by similarities in manufacturing methods and thus related to
group technology.
3.8.2 Generative Process Planning (GPP)
The generative approach is used to automatically generated plans based on
the analysis of part geometry, material and other factors that may influence
the manufacturing decisions [48]. The need for a part description suitable
for automated process planning led to the use of CAD models, mostly with a
user’s interaction for selecting the features of interest and providing data for
planning. The use of knowledge-based systems and artificial intelligence
techniques were the next major development in the direction of generative
process planning. A good combination of algorithmic procedures and
heuristics are essential for obtaining a good process plan.
3.9 Some New Approaches
In the last two decades, a lot of research work has been done in different
research areas in CAPP. These works can be categorized based on the types
of part involved, such as prismatic part, cylindrical parts, sheet metal,
foundry and assembly systems [59]. Besides this broad classification,
research works can also be categorized based on geometric modelling
techniques. Some new ideas are briefly presented here.
68

3.9.1 Feature-Based and Solid Model Based Process Planning
Solid Model-based process planning uses solid modelling package to design
a 3D part. In feature-based process planning systems a part is designed with
design-oriented manufacturing feature or a feature extraction/feature
recognition system is used to identify part feature and their attributes from
the CAD file.
In the prototype Feature Based Automated Process Planning (FBAPP)
system features are recognized from the removable volume point of view
rather than from the part design point of view. The entire process in FBAPP
is naturally closer to the thinking of a human process planner.
Interactive and feature blackboard based CAPP is a new approach that
complies with the traditional process planning. Human process planner gets
familiar with the system very quickly [82]. Plans can be edited manually or
completed using knowledge base systems. The architecture of Black board
system can be seen as a number of people sitting in front of a blackboard.
These people are independent specialists, working together to solve a
problem, using the blackboard for developing the solution. Problem solving
begins when the problem and initial data are written on the blackboard,
looking for an opportunity to apply their expertise to develop the solution.
When a specialist finds sufficient information to contribute, he records the
information on the blackboard, solves a part of the problem and makes new
information available for other experts. This process continues until the
problem has been solved.
3.9.2 Object Oriented Process Planning
A lot of research work is done for the application of object-oriented
approach to different problems [59, 60]. Object oriented process planning is
a logical way for representing real world components within a
manufacturing system. The developer identifies a set of system objects from
the problem domain and expresses the operation of the system as an
69
interaction between these objects. The behaviour of an object is defined by
what an object is capable of doing. The use of Object Oriented Design or
Object Oriented Programming for developing a process planning system
provides a tool for addressing the complexity of process planning and the
capability to incrementally augment functionality, and as the system
matures, the developers can further create a complete manufacturing
planning system. Object oriented systems are more flexible in terms of
making changes and handling evolution of the system over time. This
technique is an efficient means for the representation of the planning
knowledge and a means of organizing and encapsulating the functionality of
the system with the data it manipulates. This modularity results in a design
that can be extended to include additional functionality and address other
processes. The design also expands on traditional piece part planning by
extending the part model to support planning for end products composed of
multiple parts and subassemblies.
3.10 A New Wave of Database Applications
One important growth area for database applications is decision support
including data warehousing and data mining. Data mining is the process of
discovering hidden patterns and relationships in data by using advanced
statistical analysis and modeling techniques. Data mining uses discovery-
based approaches in which pattern-matching and other algorithms are
employed to determine the key relationships in the data. Methods used for
data mining include discovering association rules, clustering and
classification. Another area of interest is Time Series Analysis. Time series
analysis performs data analysis for time-related data in databases and data
warehouses. The types of analysis include similarity analysis, periodicity
analysis, sequential pattern analysis, and trend and deviation analysis.
3.10.1 Data Models
Before the first DBMS was developed, programs accessed data from flat
70
files. These did not allow representation of logical data relationships or
enforcement of data integrity. Data modeling has developed over successive
generations since the 1960s to provide applications with more powerful data
storage features. In this section, we will look at the differences between data
models, concentrating on the relational model and the object model and
explain the suitability of object oriented database model for our work.
Generally speaking, data models have evolved in three generations. The
early generation data models tend to refuse to completely go-away. After
all, companies often have made significant investments in databases, or
have critical data dependent on them. Even some first-generation products
are still in use and supported by their vendors [22, 66].
3.10.1.1 First Generation
The emergence of computer systems in the 1960s led to the development of
the hierarchical and network data models, which are usually referred to as
the first-generation data models [83].
3.10.1.2 Second Generation: The Relational Model
The relational model has been the most widely used and commercially
successful way of modeling data. Its characteristics are very different from
the earlier models. To begin, data entities are represented by simple tabular
structures, known as relations. Primary keys and foreign keys define entity
relationships and data integrity. The design of a relational database is based
on the idea of normalization, the process of removing redundant data from
your tables in order to improve storage efficiency, data integrity, and
scalability.
3.10.1.3 Third Generation: “Post-Relational” Models
The third-generation models, first proposed in the 1980s, were a response to
the problems that often arise when marrying an object-oriented system to a
relational database. They are sometimes described as “post-relational,”
71

although it is more realistic to consider them as co-existing with the
relational model and providing additional options for developers. Unlike the
second generation, where the relational model was universally adopted, with
some proprietary variations, the object-oriented third generation has evolved
in two distinct directions, namely, object data model and object-relational
model [83].
3.10.2 Information Modeling Using Object-Oriented Database Management Systems Object-oriented model is becoming more and increasingly popular because
it can represent complicated connections as well as represent data and data
processing in a consistent way [83]. Process integration was the driving
force that inspired the development of object-oriented database systems. A
primary characteristic of objected-oriented applications is the ability to
efficiently manage very complex information.
An object-oriented database management system (OODBMS) provides a
storage place for objects in a multi-user client/server environment. Object-
oriented model is becoming increasingly popular because it can totally
represent complicated connections as well as represent data and data
processing in a consistent way [66, 83]. Figure 3.12 gives the details of the
database models transition. Figure 3.13 gives the difference in data storage
in RDBMS and ODBMS.
An integrated knowledge- based information system has been implemented
using the object-oriented database management system that supports
Structured Query Language (SQL) in the IPPPIS. The information about an
artifact design, processes, resources, time, and cost structure is stored in the
database. The preliminary process planning system starts with reading the
artifact information from the artifact database, including artifact name, main
shape, shape complexity, symmetry, secondary positive features, secondary
negative features, material, maximum size, weight, tolerance, surface
72

condition and production volume. Then, the selection of primary
manufacturing processes follows. This system automatically selects
candidate primary manufacturing processes based on manufacturing
knowledge. Next is the selection of: manufacturing resource (machine, die,
mold, and tool for machining); estimating manufacturing time and cost; and
then selection of the best primary manufacturing processes according to
estimated manufacturing cost.
Hierarchical Data Model
Network Data Model
Relational Data Model
ER Data Model
Semantic Data Model
Object-Oriented DM Object-Relational DM
Figure 3.12 Database models transition.
Figure 3.13 Data Storage in RDBMS and ODBMS
73
3.11 Need for Object-Oriented Database Management Systems
Process integration was the driving force that inspired the development of
object-oriented database systems. A primary characteristic of objected-
oriented applications is the ability to efficiently manage very complex
information. With applications becoming more complex and users becoming
more demanding, this type of database is becoming more necessary. One of
the areas, which are impacting for the need of efficient and flexible object-
oriented database systems, is in the systems for Computer Aided Design
(CAD), Computer Aided Software Engineering (CASE). These applications
require databases that can handle very complex data that can develop
smoothly and can provide the high-performance required by interactive
systems. With these requirements in mind it is not surprising that the CAD,
CASE, Computer Aided Manufacturing (CAM) areas are specifically being
targeted by object-oriented database vendors. Factory and office
automation are other areas where object-oriented database technology is
also very valuable. Object-oriented database systems can provide solutions
for intricate problems and put them within the reach of users. Object
oriented database provides a unifying paradigm for the development of
database from data model.
Object-oriented databases can store more types of data and access this data
much faster than relational databases. Another big advantage of an object-
oriented database over a relational database is that you can save
unstructured data, such as video clips, audio clips, photographs, and
documents, more efficiently. The object-oriented database often returns
results more quickly than the same query within a relational database.
Perhaps the most significant characteristic of object-oriented database
technology is that it combines object-oriented programming with database
technology to provide an integrated application development system [60].
74
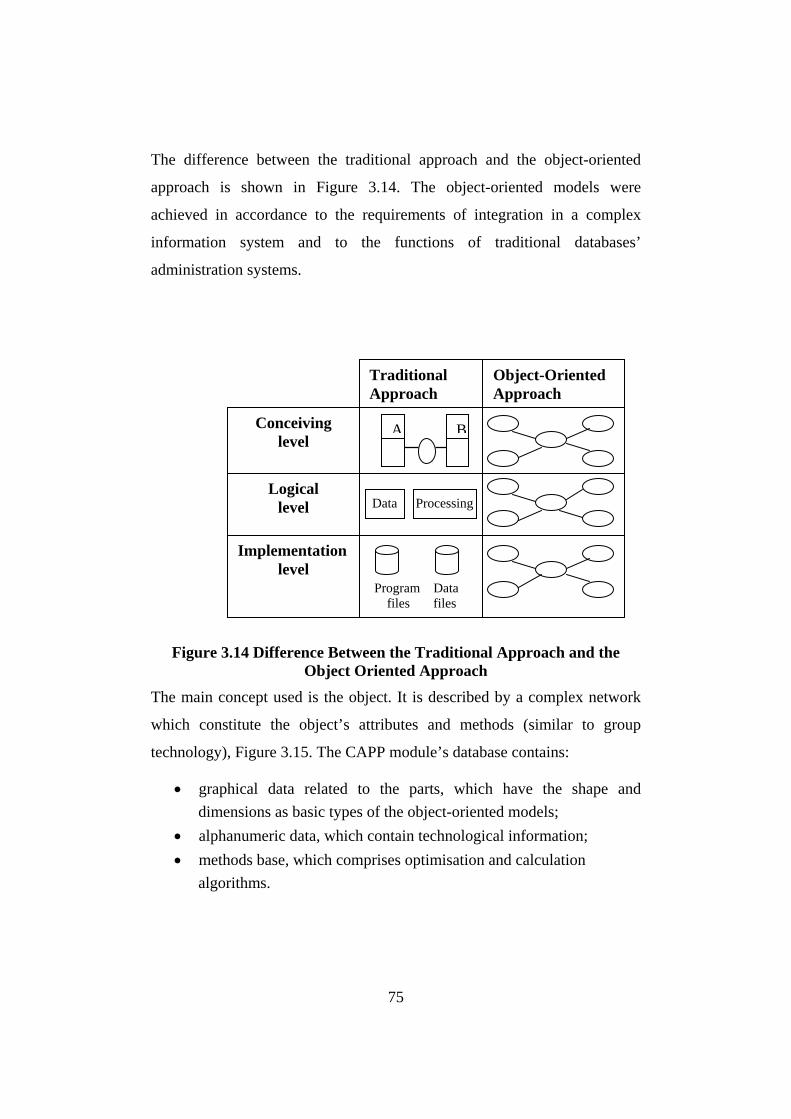
The difference between the traditional approach and the object-oriented
approach is shown in Figure 3.14. The object-oriented models were
achieved in accordance to the requirements of integration in a complex
information system and to the functions of traditional databases’
administration systems.
Program Data files files
Traditional Approach
Conceiving level
Logical level
Implementation level
A B
Data Processing
Object-Oriented Approach
Figure 3.14 Difference Between the Traditional Approach and the Object Oriented Approach
The main concept used is the object. It is described by a complex network
which constitute the object’s attributes and methods (similar to group
technology), Figure 3.15. The CAPP module’s database contains:
• graphical data related to the parts, which have the shape and dimensions as basic types of the object-oriented models;
• alphanumeric data, which contain technological information; • methods base, which comprises optimisation and calculation
algorithms.
75

Figure 3.15 Object’s Attributes and Methods
3.12 Data Mining and the IPPPIS
The need for automated analysis and discovery tools for extracting useful
knowledge from huge amounts of raw data suggests that Knowledge
Discovery in Databases (KDD) and data mining methodologies may become
extremely important tools in realizing the above objectives. Data mining is
primarily used in retail business. Applications to design and manufacturing
are still underutilized and infrequently used on a large scale. Data Mining is
often defined as the process of extracting valid, previously unknown,
comprehensible information from large databases in order to improve and
optimize business decisions. Some researchers use the term KDD to denote
the entire process of turning low-level data into high-level knowledge [70].
Data mining techniques are at the core of the data mining process and can
have different goals depending on the intended outcome of the overall data
mining process [60]. Most data mining goals fall under the following main
76
categories:
* Data Processing * Verification * Regression
* Classification * Clustering * Association
* Sequential Pattern Analysis * Model Visualization * Deviation
Analysis
Although data mining algorithms are at the core of the data mining process,
they constitute just one-step that usually takes about 15% to 25% of the
overall effort in the overall data mining process. A collaborative effort of
domain expert(s) (e.g., designer, production manager), data expert(s) (e.g.,
IT professionals) and data mining expert(s) is essential for the success of the
data mining integration within design and manufacturing environments. A
successful implementation of the data mining process often includes the
following important stages. The first step involves understanding the
application domain to which the data mining is applied and the goals and
tasks of the data mining process; e.g., understanding the factors that might
affect the yield of a Silicon wafer in the semiconductor industry. The second
step includes selecting, integrating, and checking the target data set that may
be stored in various databases and computer-aided systems (such as CAD,
CAM, MRP or ERP).
3.12.1 Data Mining in Product Design and Development
The integration of data mining to design and manufacturing to be based on
goals and capabilities of data mining as well as goals and weaknesses of
current design and manufacturing environments. To broaden the
understanding of how data mining can overcome a variety of problems in
design and manufacturing a wide range of activities within manufacturing
companies are considered.
During the product design and development, process data mining can be
used in order to determine relationships among “internal” factors at each
stage and “external” factors at consecutive and previous stages. Following
77
are some examples of how data mining can be utilised.
• Data mining can be used to extract patterns from customer needs, to learn interrelationships between customer needs and design specifications, and to group products based on functional similarity for the purpose of benchmarking, modular design, and mass customization.
• At the concept design stage, data mining can support concept
selection by: dynamic indexing and retrieval of design information
in knowledge bases (e.g., patents and benchmarking products);
clustering of design cases for design reuse, extracting design
knowledge for supporting knowledge based systems; extracting
guidelines and rules for design-for-X (manufacturability, assembly,
economics, environment); and exploring interactively conceptual
designs by visualizing relationships in large product development
databases.
• During system-level design, data mining can aid in extracting the relationships between product architecture, product portfolio, and customer needs data.
• At the detailed design stage, data mining can support material selection and cost evaluation systems.
• During product development planning, data mining can be beneficial to activities, such as: the prediction of product development time and cost; effectiveness of cross-functional teams; and exploration of trade-offs between overlapping activities and coordination costs. Data mining can be used for identifying dependencies among design tasks, which can be used to develop an effective product development plan.
3.12.2 SQL and Data Mining
The large amount of data, which was generated and collected during daily
operations and which contain hundreds of attributes, needs to be
simultaneously considered in order to accurately model the system's
78

behavior. It is the abundance of data, however, that has impeded the ability
to extract useful knowledge. Moreover, the large amount of data in many
design and manufacturing databases make it impractical to manually analyse
valuable decision-making information. This complexity calls for new
techniques and tools that can intelligently and (semi)automatically turn low-
level data into high-level and useful knowledge [70].
Data access uses a high-level nonprocedural language (SQL). This makes
relational databases better for ad- hoc querying. If the data you require is in
the database, you will almost certainly be able to write a SQL query that
retrieves it, though it may involve joining many tables to get the data [83].
An application will not be written in SQL itself. That is because SQL is a
declarative language, not a programming language. It is not computationally
complete, so you cannot write a full program with it. Its job is to express
queries and perform some manipulation of the data in the database. As a
result, either SQL is used at an interactive prompt or appears as strings
embedded within another language. Of course, many relational database
systems have the ability to use stored procedures, which are program
modules that exist within the DBMS. Even though these are within the
DBMS, they still need to combine SQL with another language, such as
Oracle’s PL/SQL [84].
3.13 Group Technology and Classification Systems
Group technology principles may be applied to any conceivable entity
ranging from manufactured parts and capital equipment to decision
processes and human characteristics [85]. GT aims to take advantage of
similarities that exist among items, and to increase effectiveness by:
1. allowing similar, recurring activities to be conducted together (e .g . part family scheduling);
2. standardizing similar activities to control activity proliferation and better utilize resources (e.g. control over new designs) ;
79
3. supporting convenient information retrieval so that historical information is accessible and usable (e.g., retrieval and modification of an old process plan to suit a newly designed part released to manufacturing)
A part family is a collection of similar parts that share specific design
and/or manufacturing characteristics, identified for a well-defined purpose.
All parts in a family may require similar treatment and handling methods,
and efficiencies are achieved by processing the parts together.
Manufacturing efficiencies are gained from reduced set-up times, part
family scheduling, improved process control, standardized process plans,
standardized instructions, group layouts, higher quality, and in general,
increased learning. Product design advantages are gained when design
engineers retrieve existing drawings to support new products and when
features are standardized to prevent part proliferation [38].
Three structures used in classification and coding schemes are given below.
• Hierarchical structure: known as a mono-code, in which the interpretation of each successive symbol depends on the value of the preceding symbols
• Chain-type structure: known as a polycode, in which the interpretation of each symbol in the sequence is always the same; it does not depend on the value of preceding symbols
• Mixed-mode structure: which is a hybrid of the two previous codes.
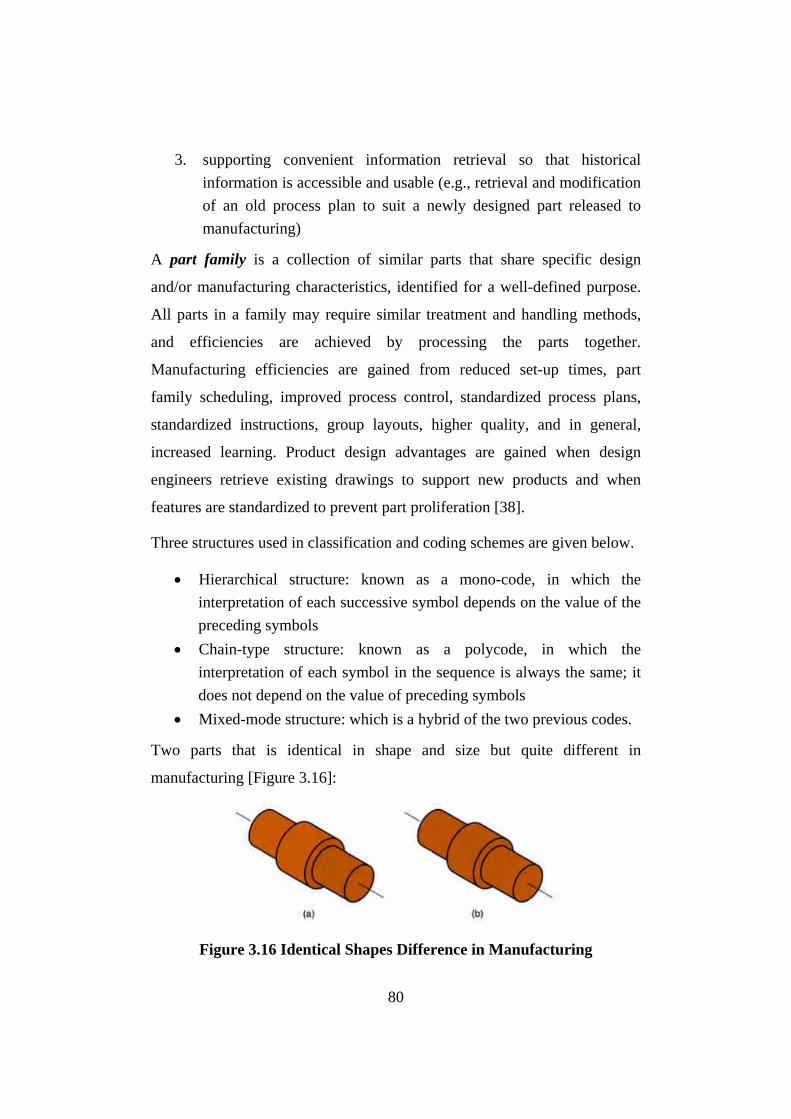
Two parts that is identical in shape and size but quite different in
manufacturing [Figure 3.16]:
Figure 3.16 Identical Shapes Difference in Manufacturing
80

(a) 1,000,000 units/yr, tolerance = ±0.010 inch, 1015 CR steel, nickel plate
(b) 100/yr, tolerance = ±0.001 inch, 18-8 stainless steel
As an example, Figure: 3.17 show ten parts that are different in size and
shape, but quite similar in terms of manufacturing. All parts are machined
from cylindrical stock by turning; some parts require drilling and/or milling.
Figure 3.17 Identical Shape Parts Grouped
Three types of activities are necessary for applying group technology:
1. determination of critical part attributes that represent the criteria for part family membership
2. allocation of parts to established families ; and 3. retrieval of part family members and related information
Classification and coding systems can assist in these tasks by providing a
structure for the classification of parts into groups based on selected part
attributes, and by assigning a code to each part. This code aids information
retrieval for that part. A code is a string of alphanumeric characters which,
when interpreted, provides information about that part. This is in contrast to
a part number, whose purpose is item identification, not description.
Although so called `significant part numbers' contain some meaningful
information about parts, these are not considered `codes' for the purpose of
this study [85].
81

The process of coding a part is preceded by the classification of the part,
which is the determination, for each critical attribute, of the class to which
the part belongs. Each such class is represented by a code identifier. For
example, design attributes for a wooden bookshelf might be the number of
shelves, shelf width and depth, and color of the stain. On the other hand,
manufacturing attributes might be, how the wood is cut, how the shelf is
assembled, and the methods for actually staining the shelf. The process of
coding and classification may be manual or computer-assisted with
interactive expert system like queries from the computer.
Part families can be determined by using codes. At first, part-family
application objectives must be determined. Part families for design
applications often rely on quite different part attributes than those for
manufacturing applications; hence, the reasons for generating part families
must be made clear. Once the objectives are determined, relevant part
family attributes are identified, and codes that correspond to these attributes
are specified. The database of coded part is then used to retrieve part family
members.
3.14 Existing GT Classification and Coding Systems
Many commercial and non-proprietary coding systems are in existence. The
non-proprietary Opitz system, developed in the 1960s in West Germany, is
perhaps the best known. It is applicable to both machined and non-machined
parts, and has been widely used in Europe. The Brisch Birn system was
developed in the UK over 40 years ago. This `system' is actually a coding
shell customized to a particular firm's coding needs.
Recent commercial coding systems take advantage of the databases, which
are made possible by today's advanced computing technology. Rather than
storing strings of symbols that represent classes into which an item falls,
these databases capture the exact dimensions or attributes of a particular
82

item. Often, this information is structured as a relational database, which
may be accessed using a `natural language' interface (despite the fact that
these modern systems do not always use coded data).
Some of the important systems
• Opitz classification system –the University of Aachen in Germany, nonproprietary, Chain type.
• Brisch System –(Brisch-Birn Inc.) • CODE (Manufacturing Data System, Inc.) • CUTPLAN (Metcut Associates) • DCLASS (Brigham Young University) • MultiClass (OIR: Organization for Industrial Research), hierarchical
or decision-tree coding structure • Part Analog System (Lovelace, Lawrence & Co., Inc.)
Rather than employing a commercial system, firms may choose to combine
a (perhaps existing) company database with a database organization and
extraction tool to achieve GT intents. New CAD software which can support
direct `classification' from CAD databases via graphical attributes of the
part raises an interesting issue to what degree is the classification task
minimized due to this automation of the data capture process. CAD
capabilities do greatly reduce data capture and maintenance costs. On the
other hand, problems arise regarding appropriate graphical standards and
attributes, and potential limitations on data capture to only design (not
manufacturing or other) attributes. This is a relevant technical research area.
3.15 Conclusion
In this chapter, we have seen how concurrent design of product and process
can help the organization. A comparison of traditional design with the
concurrent design is done, with the discussion on benefits of the CE in
manufacturing environment. How CE concepts will benefit the organisation
to achieve DFM is explained. It has been discussed how DFM will help the
organisation to come up with product with higher quality with lesser design
83
time and cost. Process planning is having an important role to play in the
concurrent design of a product and process. Different approaches used for
process planning was explained further in this chapter. Object oriented
database, which is popularly used as a tool for the information modeling
application was explained with the details of SQL. Use of SQL for data
mining applications in decision support systems is explained further. Group
technology and classification systems were explained with its advantages in
the last part of this chapter.
Linking the design and process planning with suitable method is an
important point to be addressed in this research. Hence, a discussion on the
above topic was done in this chapter to give better understanding on the
information requirement in the developed system, in the design and process-
planning domain. The next chapter will give details on the information
content and codification of this domain knowledge.
84


