CHAPTER 3 CO-OCCURRENCE
12
443 CHAPTER 3 CO-OCCURRENCE Co-occurrence mapping is a technique that involves several map layers, each layer high-lighting a different set of features. These map layers are then overlaid to make one combined map. This combined map can then be used to see where different features co-occur. The map is labeled with a color gradient, making the areas with a greater number of co-occurrences darker, and an area with fewer co-occurrences lighter. For example, if a co-occurrence map was examining the co-occurrence of unfragmented lands, wetlands, and threatened and endangered species habitat, the areas that contained all three of these features would be the darkest, and the areas that contained none of these features would be the lightest. If it is desired, one or more layers can be weighted so they appear darker on the final map. To do this work, we examined co-occurrence methodologies of several New Hampshire land conservation organizations. This included the Introduction to Co- Occurrence and Build-out Analyses by the University of New Hampshire Cooperative Extension (2004), several GIS conservation planning projects completed by the Society for the Protection of New Hampshire Forests (2005), and A Land Conservation Plan for the Ashuelot River Watershed completed by The Nature Conservancy, New Hampshire (2004). Following this study, the students in the Third Year project used co-occurrence maps to help ASLPT identify regional conservation priorities. Since ASLPT has adopted the New Hampshire Everlasting initiative, the students used the five main goals of the initiative to create five separate map layers. The five layers created were unfragmented lands (forests), water resources, ecologically important lands, agriculture, and scenic resources. These five layers were then overlaid to form a final, unweighted co-occurrence map. The students then met with ASLPT to discuss the possibilities for weighting the map. ASLPT decided that the map should be weighted, and discussed with the students how they felt it should be weighted. Final maps were then created using ASLPT’s input.
Transcript of CHAPTER 3 CO-OCCURRENCE

443
CHAPTER 3 CO-OCCURRENCE Co-occurrence mapping is a technique that involves several map layers, each layer high-lighting a different set of features. These map layers are then overlaid to make one combined map. This combined map can then be used to see where different features co-occur. The map is labeled with a color gradient, making the areas with a greater number of co-occurrences darker, and an area with fewer co-occurrences lighter. For example, if a co-occurrence map was examining the co-occurrence of unfragmented lands, wetlands, and threatened and endangered species habitat, the areas that contained all three of these features would be the darkest, and the areas that contained none of these features would be the lightest. If it is desired, one or more layers can be weighted so they appear darker on the final map. To do this work, we examined co-occurrence methodologies of several New Hampshire land conservation organizations. This included the Introduction to Co-Occurrence and Build-out Analyses by the University of New Hampshire Cooperative Extension (2004), several GIS conservation planning projects completed by the Society for the Protection of New Hampshire Forests (2005), and A Land Conservation Plan for the Ashuelot River Watershed completed by The Nature Conservancy, New Hampshire (2004). Following this study, the students in the Third Year project used co-occurrence maps to help ASLPT identify regional conservation priorities. Since ASLPT has adopted the New Hampshire Everlasting initiative, the students used the five main goals of the initiative to create five separate map layers. The five layers created were unfragmented lands (forests), water resources, ecologically important lands, agriculture, and scenic resources. These five layers were then overlaid to form a final, unweighted co-occurrence map. The students then met with ASLPT to discuss the possibilities for weighting the map. ASLPT decided that the map should be weighted, and discussed with the students how they felt it should be weighted. Final maps were then created using ASLPT’s input.

444
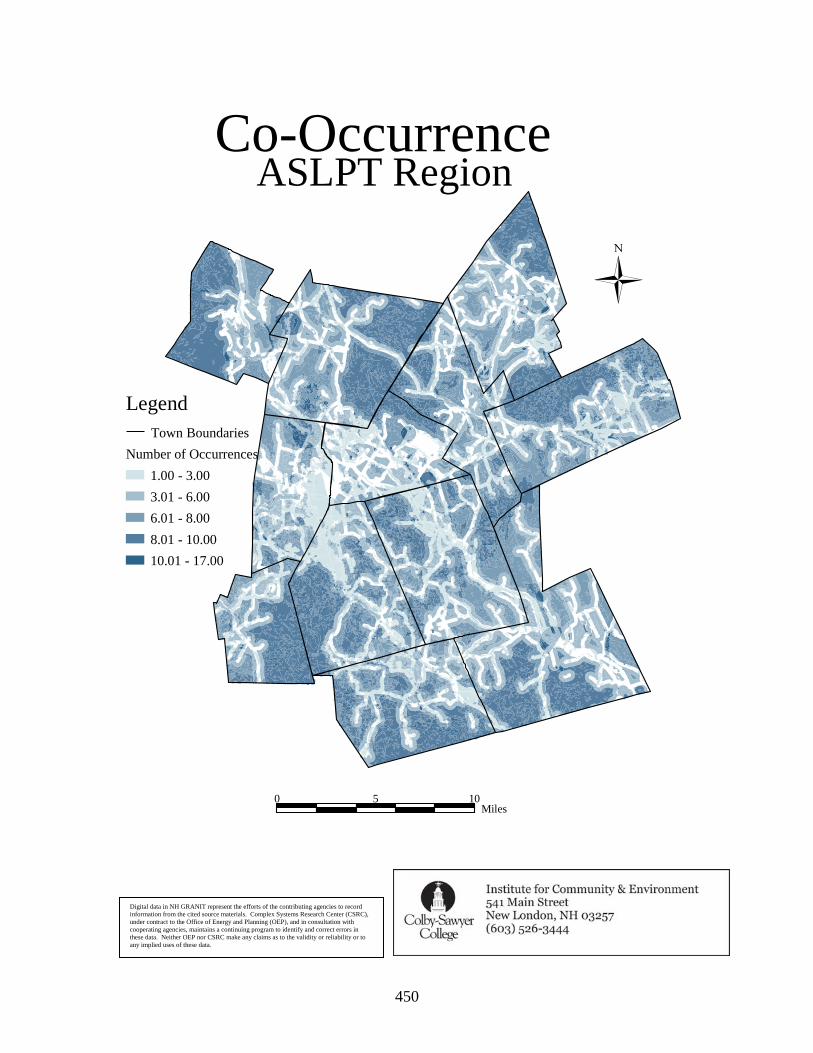
The co-occurrence map is made up of the following maps; Public Drinking Resources, Ecologically Important Lands, Unfragmented Lands, Agricultural Lands, and Scenic Views. All of the maps that comprise the final co-occurrence map were assigned values (between 1and 5) developed in consultation with the Ausbon Sargent Land Preservation Trust. The first map we used was Public Drinking Resources. This map combines public water supplies and facilities, favorable gravel well analysis sites, buffered third order and higher streams, and wellhead protection areas. Any time one of these variables occurred, a value of 4 was assigned. The second map that we used was Ecologically Important Lands. This map is comprised of forest continuity index (FCI), interior habitat, steep and south facing slopes, and corridors. We overlaid each map and then calculated a co-occurrence value to find out which areas were the most important ecological lands and then gave the best ecological land a 5 and then each one after that 4 all the way to 1, with a 1 being the lowest value for ecological lands. The third map that we used was unfragmented lands which showed us the areas in the region that had large unfragmented parcels, which is a good approximation for forest lands. This map was rated such that the largest parcels received a 5, smaller parcels received a 4, 3 or 2 depending on their size, and the smallest parcels received a one. The fourth map that we used was a map of agricultural lands that was developed by the students and representatives from each of the towns. Because of the scarcity of agricultural land in the region, all agricultural lands were given a 5. The fifth and final map that we used was scenic views. Scenic views were identified by town representatives. As there is a wide range in defining what is “scenic,” all scenic views were weighted as a 1. These five maps were combined to create an overall co-occurrence map. Co-occurrence values were then calculated to identify regional conservation priorities.

445
LegendNumber of Occurrences
1234Town Boundaries
Public Drinking ResourcesASLPT Region
0 105Miles
Digital data in NH GRANIT represent the efforts of the contributing agencies to record information from the cited source materials. Complex Systems Research Center (CSRC), under contract to the Office of Energy and Planning (OEP), and in consultation with cooperating agencies, maintains a continuing program to identify and correct errors in these data. Neither OEP nor CSRC make any claims as to the validity or reliability or to any implied uses of these data.

446
ASLPT RegionEcologically Important Lands Composite
LegendNumber of Occurrences
1 - 34 - 56 - 78 - 910 - 13Town Boundaries
0 105Miles
Digital data in NH GRANIT represent the efforts of the contributing agencies to record information from the cited source materials. Complex Systems Research Center (CSRC), under contract to the Office of Energy and Planning (OEP), and in consultation with cooperating agencies, maintains a continuing program to identify and correct errors in these data. Neither OEP nor CSRC make any claims as to the validity or reliability or to any implied uses of these data.

447
Unfragmented LandsASLPT Region
LegendUnfragmented Lands (Acres)
1-1920-99100-499500-2500>2,500(Undeveloped)
Lakes and PondsTown Boundaries
Conserved Lands
0 105Miles
Digital data in NH GRANIT represent the efforts of the contributing agencies to record information from the cited source materials. Complex Systems Research Center (CSRC), under contract to the Office of Energy and Planning (OEP), and in consultation with cooperating agencies, maintains a continuing program to identify and correct errors in these data. Neither OEP nor CSRC make any claims as to the validity or reliability or to any implied uses of these data.

448
§̈¦I-89
§̈¦1-89
tu11
tu31
tu4
tu103A
tu103B
tu103
tu114
tu103
tu114
tu114
tu4A
0 105Miles
Agricultural LandsASLPT Region
LegendAgricultureHighwaysMajor RoadsTown Boundaries
Digital data in NH GRANIT represent the efforts of the contributing agencies to record information from the cited source materials. Complex Systems Research Center (CSRC), under contract to the Office of Energy and Planning (OEP), and in consultation with cooperating agencies, maintains a continuing program to identify and correct errors in these data. Neither OEP nor CSRC make any claims as to the validity or reliability or to any implied uses of these data.

449
!
! !
!!!
!
!!
!
!!!!
!
!
!
!
!
!
!
!
!
!
! !!
!
!
!!!
!
!
!
!
!
!
!!
!!
!
!
!
!!
!
!
!
!
!
!
!
!
!
!
!
! !
!
!
!
!
!
!
!
!!
!
!
!
!
!
!
!!
ASLPT Region
Scenic Views
0 105Miles
Legend
Elevation (Feet)
! Scenic Views
Visibility of Views
Town Boundaries
HighwaysRoadsRivers and StreamsLakes and Ponds
350 - 650651 - 950951 - 1,2501,251 - 1,5001,501 - 1,8001,801 - 2,1002,101 - 2,3502,351 - 2,6502,651 - 2,950
Digital data in NH GRANIT represent the efforts of the contributing agencies to record information from the cited source materials. Complex Systems Research Center (CSRC), under contract to the Office of Energy and Planning (OEP), and in consultation with cooperating agencies, maintains a continuing program to identify and correct errors in these data. Neither OEP nor CSRC make any claims as to the validity or reliability or to any implied uses of these data.
450
LegendTown Boundaries
Number of Occurrences1.00 - 3.003.01 - 6.006.01 - 8.008.01 - 10.0010.01 - 17.00
Co-OccurrenceASLPT Region
0 105Miles
Digital data in NH GRANIT represent the efforts of the contributing agencies to record information from the cited source materials. Complex Systems Research Center (CSRC), under contract to the Office of Energy and Planning (OEP), and in consultation with cooperating agencies, maintains a continuing program to identify and correct errors in these data. Neither OEP nor CSRC make any claims as to the validity or reliability or to any implied uses of these data.

451
CONSERVATION PRIORITIES
This map shows the areas that were found to have the highest priority for conservation. Upon analyzing the co-occurrence map, the class identified the five areas with the highest value according to the co-occurrence ranking system. The highest value denotes the highest number of occurrences in that location. For identification purposes a black circle was placed around each of these areas.
The first area that was located, with a value of 17, is in the mideastern area of Warner. This parcel has a high ecologically important lands value, is the location of an agricultural land, has a high unfragmented land value, and has a high ranking for public drinking water. This location is in an area of Warner where not much land is conserved.
The second location that was identified is also in Warner. This location is almost directly in the center of the town. The area has a high value for ecologically important land, is the location of an agricultural land, and is in a large parcel of unfragmented land. This area directly borders the Kumin parcel, an area of 107 acres that is already conserved. This could extend this conserved area.
The third area is located in southeastern New London. The location has a moderately high ecologically important lands value, is the location of an agricultural area, has a moderate unfragmented lands value, has a high value for public drinking water, and is the location of a scenic view. The location is close to three other small conserved lands and extends almost into Sutton.
The fourth priority area is located in the town of Andover. It is in the eastern part of the town, just slightly north of the center. This location has a high ecologically important land value, is the location of an agricultural land, has a high unfragmented lands value, and is the location of three overlapping scenic views. The area is located very close to a number of other small parcels with higher co-occurrence values. It would also open up the northeastern corner of the town to conservation.
The final conservation priority is located in the southern part of Grantham, slightly east of the center of the town. This area has a high ecologically important lands value, is the location of an agricultural land, and has a high value for unfragmented lands. There is only a small amount of Grantham that is currently conserved, just 10% of the town. The conservation of this parcel would add to the conservation coverage in the town.
These five conservation priorities have the highest values that were revealed in the co-occurrence mapping, but they are not presented in ranked order of priority above. Because they have the highest co-occurrence values, they are the areas that we feel are the most important specific conservation priorities that are recommended for conservation efforts in the region. Linking Lands Linking lands describes the concept of connecting conserved parcels in the region. Areas that are highlighted with purple circles on the linking lands map might be linked together to be even more valuable as ecologically important lands. Their co-occurrence values are not as high as the areas selected for conservation priorities, however, they are

452
too important to overlook. These areas are in the next tier of co-occurrence values, and given that they are near each other, it makes sense to expand conservation boundaries to link the parcels. The linking lands highlighted are as follows:
• Bradford: Town Forest and Low State Forest • Goshen/Newbury: Sunapee and Pillsbury State Parks • Grantham: Town Forest and Flewelling Parcel • Springfield/Grantham: McDaniels Marsh • Sutton/Newbury: King Hill Reservation, Wadleigh State Park, and the
Audubon/Hay Reserve • Warner: Mink Hills Area
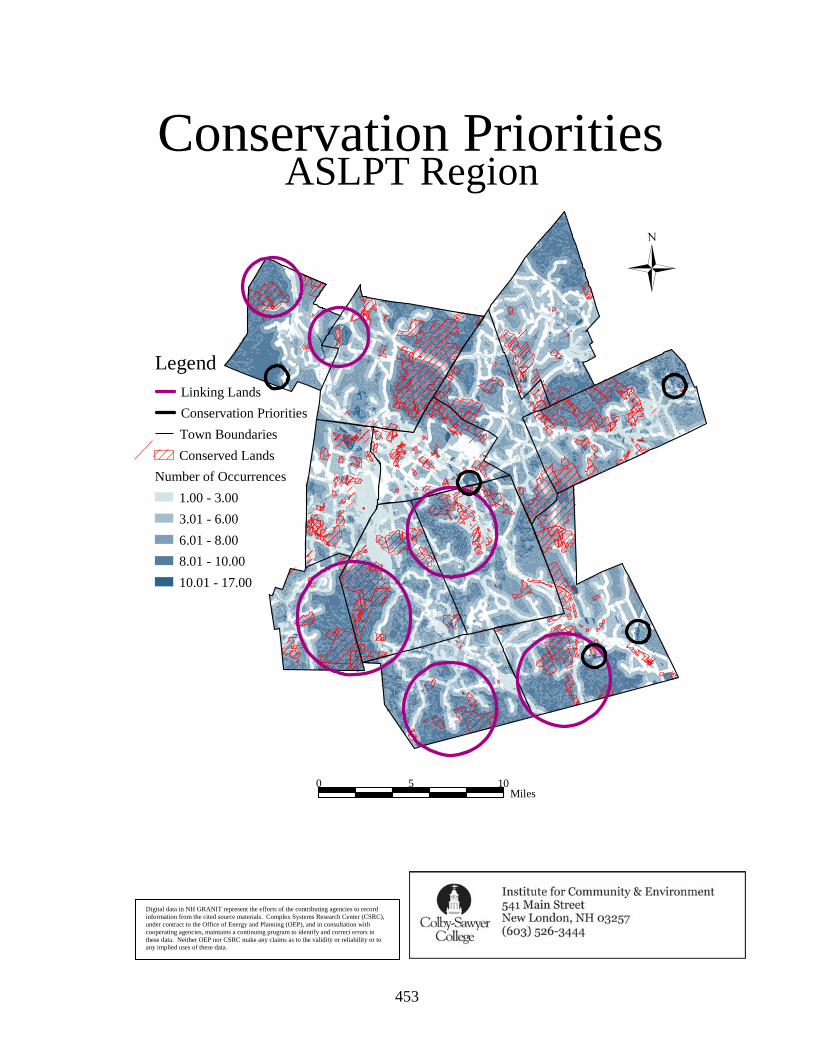
453
Legend
Linking LandsConservation PrioritiesTown BoundariesConserved Lands
Number of Occurrences1.00 - 3.003.01 - 6.006.01 - 8.008.01 - 10.0010.01 - 17.00
Conservation PrioritiesASLPT Region
0 105Miles
Digital data in NH GRANIT represent the efforts of the contributing agencies to record information from the cited source materials. Complex Systems Research Center (CSRC), under contract to the Office of Energy and Planning (OEP), and in consultation with cooperating agencies, maintains a continuing program to identify and correct errors in these data. Neither OEP nor CSRC make any claims as to the validity or reliability or to any implied uses of these data.

454
Sources Cited
Deely, Anne. “Introduction to Co-Occurrence and Build-out Analyses”. University of New Hampshire Cooperative Extension. November 2004. "GIS Conservation Planning Projects." The Society for the Protection of New Hampshire Forests. 2004. The Society for the Protection of New Hampshire Forests. April 2005 <http://spnhf.org/research/recent-mapping-projects.asp>. Zankel, Mark. "A Land Conservation Plan for the Ashuelot River Watershed." The Nature Conservancy. July 2004. The Nature Conservancy. April 2005 <http://nature.org/wherewework/northamerica/states/newhampshire/news/news15 43.html>.