
CHAPTER 3 AVIATION ACTIVITY FORECASTS 3... · and aircraft maintenance/repair/ overhaul (MRO)...
24
CECIL FIELD MASTER PLAN UPDATE CHAPTER 3 FORECASTS 3-1 FINAL CHAPTER 3 AVIATION ACTIVITY FORECASTS 3.1 INTRODUCTION The development of aviation activity projections is one of the most important steps in the master planning process because these projections will serve as the basis for identifying future facility needs. Generally, aviation forecasts assume an unconstrained demand for aviation services; thus, projections are made based upon the expected need and not upon whether or not the airport can actually provide the necessary facilities to support the projected demand. This is done to clearly identify the potential aviation demand at a particular airport. Later phases in a master plan assess how well or in what timeframe an airport could provide facilities to meet this projected demand. The Federal Aviation Administration (FAA) has provided guidance on preparing aviation activity forecasts in Advisory Circular (AC) 150/5070-6A Airport Master Plans, FAA Order 5090.3C National Plan of Integrated Airport Systems (NPIAS), and a FAA report (dated July 2001) entitled “Forecasting Aviation Activity by Airport.” Since forecasting is not an exact science and is highly dependent on the validity of base year and historical data, this FAA guidance recommends that forecasts for an airport should be: • Realistic • Based on the latest available data • Reflect the current conditions at the airport • Supported by information in the study • Able to provide an adequate justification for the airport planning and development. Additionally, this guidance lists the required forecasts that should be developed and suggests various methods and data sources to utilize in those efforts. It also reflects the need to consider the local, regional, state, and national factors in each projection. To aid in forecast development for this study, socioeconomic and national aviation trends were reviewed to identify those that were relevant to the air service market at Cecil Field. Additionally, activity forecasts developed in past planning studies and by state and national aviation agencies were collected for comparison. In developing projections of future aviation activity at Cecil Field, it is important to note that the airport has not yet reached its operational maturity as a general aviation (GA) facility. Since the airport was opened to the public in 1999, the operational nature of the facility has continued to change and is, in fact, still in a transition period. Over the last five years, tenants have filled the existing hangars left by the military. Current tenant activities include pilot and mechanic training; national security operations; aircraft manufacturing; and aircraft maintenance/repair/ overhaul (MRO) services. To date, there has been limited GA development on the airport, not due to a lack of demand in the Jacksonville area, but rather from the lack of available space along the northwest flight line. To open other areas adjacent to the airfield for further development will require a significant fiscal investment to develop the initial infrastructure. However, it is expected that Cecil Field will mature into a very active executive level GA facility over the planning period. The Airport will also continue to experience additional industrial development and activity. In addition, it is important to note that the operational activity at Cecil Field is not reflective of the traditional GA airport. The major difference is related to the various tenants, which includes some military units, other governmental agencies, aircraft manufacturers and aircraft maintenance operators. Some of the tenant activity represents traditional military operations whereas others would more accurately be classified as air carrier, commuter or GA operations depending upon the aircraft’s size and type. Airport staff discussed the classification of the tenant activity with FAA representatives through written correspondence. According to the FAA response, the basis for classification of operations to be used to justify further airport developments is whether or not the aircraft operator pays fuel taxes. These fuel taxes flow into the Airport and Airway Trust Fund, which was established by the Airport and Airway Revenue Act of 1970. Monies from the Trust Fund are used by the FAA to finance airport developments. Table 3-1 summarizes the various activities conducted by tenants as well as others and describes how these operations will be counted throughout this forecast discussion.
Transcript of CHAPTER 3 AVIATION ACTIVITY FORECASTS 3... · and aircraft maintenance/repair/ overhaul (MRO)...
CECIL FIELD MASTER PLAN UPDATE
CHAPTER 3 FORECASTS 3-1 FINAL
CHAPTER 3
AVIATION ACTIVITY FORECASTS
3.1 INTRODUCTION The development of aviation activity projections is one of the most important steps in the master planning process because these projections will serve as the basis for identifying future facility needs. Generally, aviation forecasts assume an unconstrained demand for aviation services; thus, projections are made based upon the expected need and not upon whether or not the airport can actually provide the necessary facilities to support the projected demand. This is done to clearly identify the potential aviation demand at a particular airport. Later phases in a master plan assess how well or in what timeframe an airport could provide facilities to meet this projected demand.
The Federal Aviation Administration (FAA) has provided guidance on preparing aviation activity forecasts in Advisory Circular (AC) 150/5070-6A Airport Master Plans, FAA Order 5090.3C National Plan of Integrated Airport Systems (NPIAS), and a FAA report (dated July 2001) entitled “Forecasting Aviation Activity by Airport.” Since forecasting is not an exact science and is highly dependent on the validity of base year and historical data, this FAA guidance recommends that forecasts for an airport should be:
• Realistic
• Based on the latest available data
• Reflect the current conditions at the airport
• Supported by information in the study
• Able to provide an adequate justification for the airport planning and development.
Additionally, this guidance lists the required forecasts that should be developed and suggests various methods and data sources to utilize in those efforts. It also reflects the need to consider the local, regional, state, and national factors in each projection.
To aid in forecast development for this study, socioeconomic and national aviation trends were reviewed to identify those that were relevant to the air service market at Cecil Field. Additionally, activity forecasts developed in past planning studies and by state and national aviation agencies were collected for comparison.
In developing projections of future aviation activity at Cecil Field, it is important to note that the airport has not yet reached its operational maturity as a general aviation (GA) facility. Since the airport was opened to the public in 1999, the operational nature of the facility has continued to change and is, in fact, still in a transition period. Over the last five years, tenants have filled the existing hangars left by the military. Current tenant activities include pilot and mechanic training; national security operations; aircraft manufacturing; and aircraft maintenance/repair/ overhaul (MRO) services. To date, there has been limited GA development on the airport, not due to a lack of demand in the Jacksonville area, but rather from the lack of available space along the northwest flight line. To open other areas adjacent to the airfield for further development will require a significant fiscal investment to develop the initial infrastructure. However, it is expected that Cecil Field will mature into a very active executive level GA facility over the planning period. The Airport will also continue to experience additional industrial development and activity.
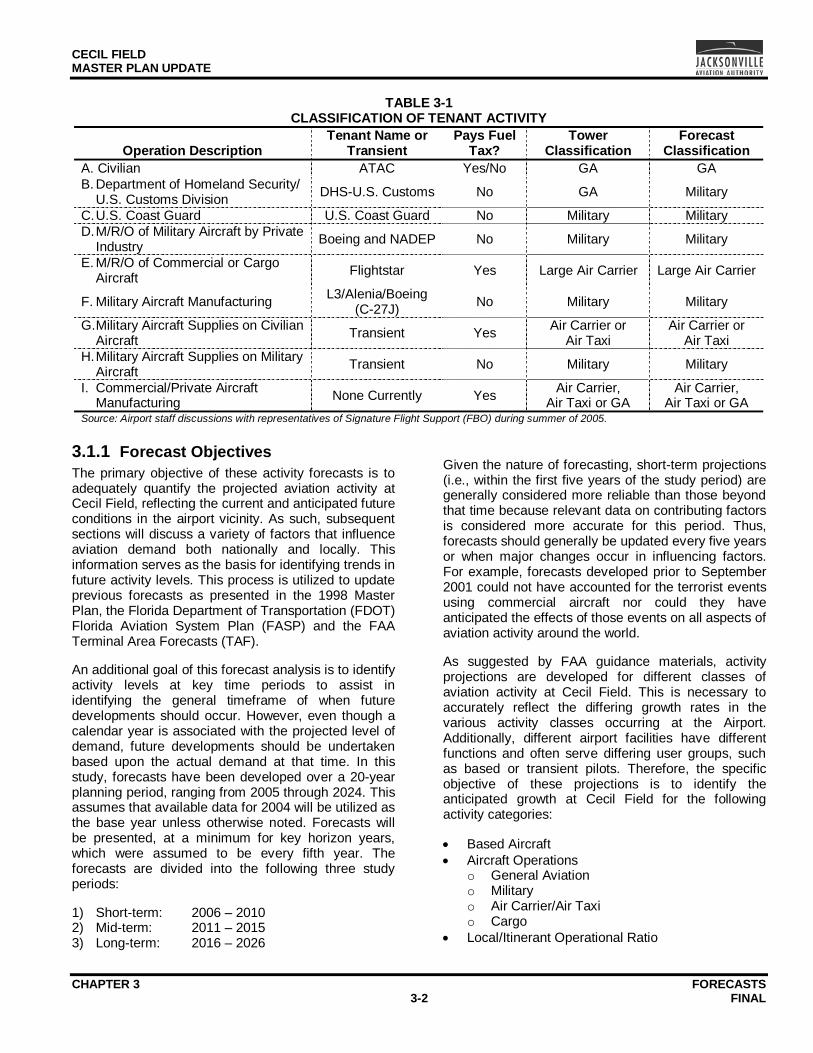
In addition, it is important to note that the operational activity at Cecil Field is not reflective of the traditional GA airport. The major difference is related to the various tenants, which includes some military units, other governmental agencies, aircraft manufacturers and aircraft maintenance operators. Some of the tenant activity represents traditional military operations whereas others would more accurately be classified as air carrier, commuter or GA operations depending upon the aircraft’s size and type. Airport staff discussed the classification of the tenant activity with FAA representatives through written correspondence. According to the FAA response, the basis for classification of operations to be used to justify further airport developments is whether or not the aircraft operator pays fuel taxes. These fuel taxes flow into the Airport and Airway Trust Fund, which was established by the Airport and Airway Revenue Act of 1970. Monies from the Trust Fund are used by the FAA to finance airport developments. Table 3-1 summarizes the various activities conducted by tenants as well as others and describes how these operations will be counted throughout this forecast discussion.
CECIL FIELD MASTER PLAN UPDATE
CHAPTER 3 FORECASTS 3-2 FINAL
TABLE 3-1 CLASSIFICATION OF TENANT ACTIVITY
Operation Description Tenant Name or
Transient Pays Fuel
Tax? Tower
Classification Forecast
Classification A. Civilian ATAC Yes/No GA GA B. Department of Homeland Security/
U.S. Customs Division DHS-U.S. Customs No GA Military
C. U.S. Coast Guard U.S. Coast Guard No Military Military D. M/R/O of Military Aircraft by Private
Industry Boeing and NADEP No Military Military
E. M/R/O of Commercial or Cargo Aircraft Flightstar Yes Large Air Carrier Large Air Carrier
F. Military Aircraft Manufacturing L3/Alenia/Boeing (C-27J) No Military Military
G. Military Aircraft Supplies on Civilian Aircraft Transient Yes Air Carrier or
Air Taxi Air Carrier or
Air Taxi H. Military Aircraft Supplies on Military
Aircraft Transient No Military Military
I. Commercial/Private Aircraft Manufacturing None Currently Yes Air Carrier,
Air Taxi or GA Air Carrier,
Air Taxi or GA Source: Airport staff discussions with representatives of Signature Flight Support (FBO) during summer of 2005.
3.1.1 Forecast Objectives The primary objective of these activity forecasts is to adequately quantify the projected aviation activity at Cecil Field, reflecting the current and anticipated future conditions in the airport vicinity. As such, subsequent sections will discuss a variety of factors that influence aviation demand both nationally and locally. This information serves as the basis for identifying trends in future activity levels. This process is utilized to update previous forecasts as presented in the 1998 Master Plan, the Florida Department of Transportation (FDOT) Florida Aviation System Plan (FASP) and the FAA Terminal Area Forecasts (TAF).
An additional goal of this forecast analysis is to identify activity levels at key time periods to assist in identifying the general timeframe of when future developments should occur. However, even though a calendar year is associated with the projected level of demand, future developments should be undertaken based upon the actual demand at that time. In this study, forecasts have been developed over a 20-year planning period, ranging from 2005 through 2024. This assumes that available data for 2004 will be utilized as the base year unless otherwise noted. Forecasts will be presented, at a minimum for key horizon years, which were assumed to be every fifth year. The forecasts are divided into the following three study periods:
1) Short-term: 2006 – 2010 2) Mid-term: 2011 – 2015 3) Long-term: 2016 – 2026
Given the nature of forecasting, short-term projections (i.e., within the first five years of the study period) are generally considered more reliable than those beyond that time because relevant data on contributing factors is considered more accurate for this period. Thus, forecasts should generally be updated every five years or when major changes occur in influencing factors. For example, forecasts developed prior to September 2001 could not have accounted for the terrorist events using commercial aircraft nor could they have anticipated the effects of those events on all aspects of aviation activity around the world.
As suggested by FAA guidance materials, activity projections are developed for different classes of aviation activity at Cecil Field. This is necessary to accurately reflect the differing growth rates in the various activity classes occurring at the Airport. Additionally, different airport facilities have different functions and often serve differing user groups, such as based or transient pilots. Therefore, the specific objective of these projections is to identify the anticipated growth at Cecil Field for the following activity categories:
• Based Aircraft • Aircraft Operations
o General Aviation o Military o Air Carrier/Air Taxi o Cargo
• Local/Itinerant Operational Ratio
CECIL FIELD MASTER PLAN UPDATE
CHAPTER 3 FORECASTS 3-3 FINAL
• Instrument Activity • Fleet Mixes
o Based Aircraft o Operational
• Peak Hour Activity
3.1.2 Methodologies The development of aviation forecasts entails the use of multiple forecast methodologies. The method chosen for a specific projection is dependent upon the activity being forecast, the availability of historical data, and a variety of existing local and national factors. For example, if local and national factors have not changed much over time, forecasts can be accurately developed utilizing historical growth trends. However, if major events have occurred changing the local or national socioeconomic climate, a forecast based solely on historical trends might not be appropriate.
In the July 2001 FAA report discussing forecasting aviation activity at an airport versus a regional or statewide system, several forecasting methodologies are suggested for use. Of these methods, the three techniques used most often for projecting aviation activity are:
• Regression Techniques: These methods involve linking the value being forecast to several influencing factors that can be quantified. One drawback of this technique is the need to have a large number of data points to ensure that a good correlation can be made. In the aviation field, these techniques are often used to link aviation activity to socioeconomic factors, such as population and income levels.
• Trend Techniques: These methods utilize past growth rates to project future demand levels. For example, the historical growth rate for based aircraft could be used to predict future based aircraft levels.
• Share Techniques: In aviation forecasts, these techniques utilize a comparison of local aviation activity to activity at the regional, state, or national level. One example of this technique is to use the historical based aircraft as a percentage of the national aircraft fleet to project the future number of based aircraft utilizing FAA projections of the national aircraft fleet.
The forecasts presented later in this discussion rely on these and other general techniques as well as a more subjective application of factors that may affect future aviation activity at the airport.
3.2 MARKET TRENDS Aviation activity at Cecil Field is influenced by both national and local factors. Some of these factors are general in nature, such as socioeconomic trends, whereas other factors are primarily associated with the aviation sector. The background information presented in this section is relatively broad in nature and not always easily quantifiable; as such, more specific information is provided as necessary under the individual presentations of activity forecasts. The following subsections discuss the key indicators that will serve as the basis for the activity projections presented in later sections.
3.2.1 National Socioeconomic Trends Over the last several years, national socioeconomic levels have fluctuated significantly with short-term highs and lows. For example, in early 2001, the United States was beginning to experience a mild recession. This 2001 economic downturn was worsened by several events, including the September 2001 terrorist attacks and the subsequent Iraqi war. More recently, economic indicators remain mixed, with some signs of positive economic growth spurred by low interest rates, but negative impacts being felt in many industries related to historically high fuel prices in 2004.
However, even though recent national economic conditions remain mixed, the overall outlook is positive according to information in the FAA Aerospace Forecasts for 2004-2015. Generally, over longer time periods, economic trends usually cycle through highs and lows, while continuing to experience overall positive growth over the long term. Socioeconomic information for these FAA forecasts was prepared using information from federal agencies and a private economic forecasting firm.
A review of this information showed that the overall U.S. population is expected to grow at 0.8% annually. Growth is expected in all regions of the United States, but the southern Atlantic region is expected to see higher growth than other areas. The FAA Aerospace Forecasts 2004-2015 attributes this growth to the relocation of business activity to the region from other parts of the country. The national labor force is expected to increase 1.0% annually with individual wages increasing due to the growth in more technical jobs. The Gross Domestic Product (GDP), which serves as an indicator of overall economic health, was projected to increase for the short-term period at 4.0% with long-term growth estimated at 3.3% annually.
CECIL FIELD MASTER PLAN UPDATE
CHAPTER 3 FORECASTS 3-4 FINAL
More recent statistics available from the U.S. Department of Labor reflect the overall economic growth in the U.S. For example, since September 2003, job creation has been positive with an estimated 2.5 million new jobs being created. Also, unemployment rates have continued to remain around 5.4%; while not an all-time low, this unemployment rate is a positive indication of national economic growth.
3.2.2 National General Aviation Trends As previously mentioned, future activity at Cecil Field is anticipated to be reflective of an executive level GA airport. This would include a higher percentage of activity by high-end GA users, especially those operating multi-engine piston and turbojet aircraft. Many executive level GA airports also support limited cargo/freight and/or passenger charter activity. Additionally, existing aviation activities at the Airport, including MRO services, aircraft manufacturing, and various governmental activities, would just as likely experience some growth over the planning period. Several national trends in the aviation sector are expected to influence these activities at Cecil Field and are discussed in the following sections.
3.2.2.1 Aircraft Production Trends In the early 1990s, manufacturers of GA aircraft were closing their operations or limiting future aircraft development due to a sharp rise in liability costs. The General Aviation Revitalization Act of 1994 (GARA) was enacted to remove most liability, except in limited circumstances, from aircraft manufacturers for aircraft accidents. Since its passage, GARA has indeed helped to increase the overall demand for GA aircraft and services. This is supported by aircraft deliveries and the continued development of aircraft models.
A review of GA aircraft deliveries since 2000, as reported by the General Aircraft Manufacturers Association, showed that approximately 2,500 new GA aircraft are delivered annually for civil use in the U.S. Between 2000 and 2003, 69% of these delivered aircraft were piston models. Single-engine aircraft accounted for 93% of the piston deliveries. Turbine aircraft made up 21% of overall aircraft deliveries in this four-year period. Turbojet aircraft production outpaced that of turboprop aircraft by a ratio of 2:1.
A review of available GA aircraft models shows that in addition to making continued upgrades to existing aircraft models, several manufacturers have introduced new GA aircraft since the mid-1990s. Raytheon has continued to improve many of the Beechcraft models it acquired in the early 1980s,
including the Bonanza and Baron models as well as producing updated versions of King Air aircraft. Additionally, Raytheon has added the Premier I and Hawker Horizon to its line of jet aircraft. Cessna has continued to improve upon traditional single-engine models (such as the Skyhawk, Skylane, and Stationair) as well as having added several new jet models (Citation X, CJ1, CJ2, CJ3, Mustang and Sovereign). The New Piper Aircraft corporation has introduced the turbine engine Malibu Meridian and Piper 6X models and have upgraded older models, such as the Saratoga and Seneca.
Additionally, several turbojet manufacturers, including new entrants in this market sector, are developing smaller jet aircraft models. These very light jets are relatively inexpensive when compared to other jet aircraft. This lower price should open up the jet market to a wider range of users. These aircraft, such as the Eclipse 500, Adams 700, or Diamond D-JET, are expected to cost approximately $1 million or less, which is about 25% of the cost of many current small business jet aircraft.
In 2000, to support the operations of these very light jets, NASA initiated a research project in partnership with the FAA and various state aviation associations. This project, called Small Aircraft Transportation System (SATS), has focused on development of new air traffic monitoring systems to enhance operations by noncommercial aircraft during flight. The primary purpose of SATS was to develop a system of equipment that would allow for several aircraft to conduct operations simultaneously at airports without radar or air traffic control services. Some of the newer technology used by SATS include:
• On-board computing • Advanced flight controls • Automated air traffic separation and sequencing
technologies • “Highway in the Sky” displays The outcome of SATS would be an increase in access to more communities without creating undue demands on the existing air traffic control network. Additionally, the SATS technology would support operations during any weather conditions without airports having to be equipped with traditional instrument landing systems. This multi-faceted system should expand enroute procedures to meet this goal while at the same time maintaining a safe and affordable transportation system. A final demonstration of the SATS developments was scheduled for June 2005. This demonstration was a success and it is anticipated that SATS might be fully deployed by 2015.
CECIL FIELD MASTER PLAN UPDATE
CHAPTER 3 FORECASTS 3-5 FINAL
A new aircraft category–light sport aircraft–was included in the 2004 Aerospace Forecasts. This category will encompass new aircraft models entering the market in 2004 as well as some existing ultralight aircraft, which are not currently tracked by the FAA. Over time, the FAA should have a more accurate accounting of the actual number of these ultralight aircraft. These light sport aircraft are expected to be used almost exclusively for recreational use.
3.2.2.2 Security Regulation Impacts Several more recent events have created influences on the GA market. The most dramatic impacts relate to the terrorist events of September 11, 2001 (9/11). Security procedures and regulations have increased substantially in an effort to prevent the use of aircraft by terrorists in the future. These have had both positive and negative effects on the GA market. For example, increased security screening requirements have lengthened travel times and added to the “frustration factor” for commercial passengers, prompting more business and high-end leisure travelers to utilize GA services, including charter, timeshare (such as NetJet), or fractional ownership programs. Negative impacts relate to additional flight restrictions in some parts of the country as well as creating a more in depth screening process for some groups of potential flight students.
3.2.2.3 Projected National Aviation Trends
The FAA Aerospace Forecasts 2004-2015 includes a projection of the national aviation market, which takes into account the majority of the previously discussed factors. These forecasts present a “cautiously optimistic” view of future aviation growth in the United States. The FAA predicted a return to pre-9/11 levels somewhat sooner than previous Aerospace Forecasts. For commercial passenger service, they show these levels returning by 2005, whereas aircraft operations were predicted to increase more rapidly reaching pre-9/11 levels by 2004. The FAA Aerospace Forecasts 2006-2017 states that Commercial aviation demand and activity exceeded pre-9/11 levels in 2005. For the GA sector, the FAA projected moderate growth in both the number of aircraft (1.2% annually) and in their utilization rates (1.3% annually).
According to information presented in the 2004 Aerospace Forecasts, some segments of the GA fleet will remain stagnant thru 2015 while others are expected to see substantial growth. One GA sector with a projected limited growth rate of 0.3% annually between 2004 and 2015 is single-engine piston aircraft. The FAA bases this low growth rate on the retirement of older aircraft from the active fleet almost
equaling the acquisition rate for new single-engine piston aircraft. However, piston aircraft will remain the largest aircraft group in the active GA fleet. The turbine-powered aircraft fleet is expected to see the highest growth rate in the GA market, with the number of turbojet aircraft projected to increase by almost 5% annually. Much of the growth in the turbojet category can be attributed to growth in fractional ownership programs and to new jet models at the lower end of the market.
The 2004 Aerospace Forecasts also include projections of operations at towered airports. For many types of activity, future growth rates are given separately for FAA operated control towers and FAA contract towers. For example, itinerant GA activity at FAA towers is expected to increase at an average annual rate of 1.2% whereas at airports with FAA contract towers the expected growth rate is 2.5% annually. A second example is instrument operations, for which the FAA Aerospace Forecasts 2004-2015 project a compounded average annual growth rate of 2.1% at both FAA operated and FAA contract towers.
3.2.3 Local Factors An overview of socioeconomic conditions in the Jacksonville area was included in Chapter 1 of this report. In general, the Jacksonville area is one of the fastest growing Florida metropolitan areas. This growth can be attributed to the vibrant business community and the high quality of life experienced in the region. The previous discussion also included projections of several indicators that are routinely used in projecting aviation activity. For ease of reference, a brief summary of these factors is given below:
• Population: Annual growth of 1.56%, which keeps pace with the statewide growth rate of 1.57%
• Per Capita Income: Annual growth of 4.43%, which is slightly below that of Florida’s rate (4.51%)
• Unemployment Rates: Annual decrease of 0.45%, which is slightly faster than the state decrease of 0.37%
In addition to the socioeconomic growth in the Jacksonville area, other local factors will have a positive impact on future activity levels at Cecil Field. For example, several road improvements are currently planned that should enhance access to Cecil Field. The first project involves widening Branan Field-Chaffee Road north to Interstate 10 as well as improving the interchange network. FDOT District 2 currently has plans to initiate this project in the 2006-
CECIL FIELD MASTER PLAN UPDATE
CHAPTER 3 FORECASTS 3-6 FINAL
2007 timeframe. The second, the southern connector through Clay County to Interstate 95, will provide a more direct route between the airport and the northern portion of St. Johns County.
It is the intent of the Jacksonville Aviation Authority (JAA) to apply for and then maintain a Federal Aviation Regulations (FAR) Part 139 operating certificate. Once approved, unscheduled (i.e., charter) air carrier operations with aircraft holding more than 31 passengers will be able to operate at Cecil Field. An air carrier is defined in the Code of Federal Regulations, Title 14, Chapter 1, Part 1 to include “any a person who undertakes directly by lease, or other arrangement, to engage in air transportation.” These operations are actually counted under both the “Air Carrier” (aircraft over 30 seats) and “Air Taxi” (aircraft under 30 seats) categories used by air traffic personnel. This will open up a market segment that is currently limited at Cecil Field.
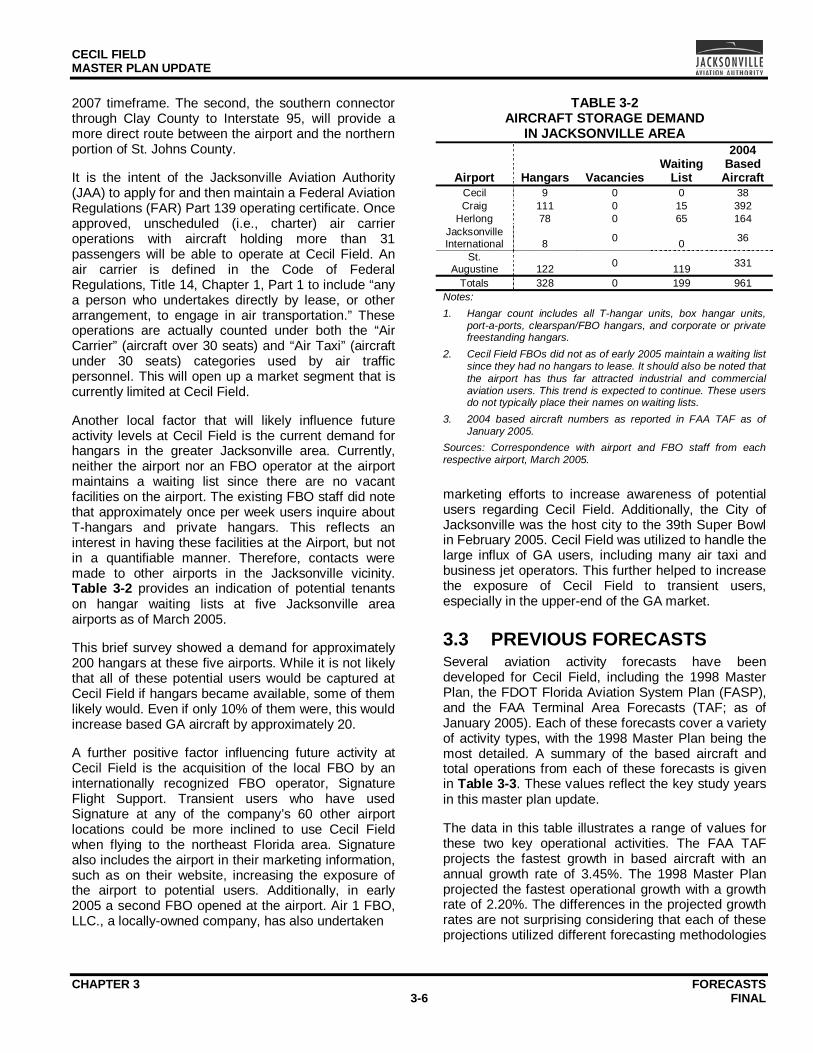
Another local factor that will likely influence future activity levels at Cecil Field is the current demand for hangars in the greater Jacksonville area. Currently, neither the airport nor an FBO operator at the airport maintains a waiting list since there are no vacant facilities on the airport. The existing FBO staff did note that approximately once per week users inquire about T-hangars and private hangars. This reflects an interest in having these facilities at the Airport, but not in a quantifiable manner. Therefore, contacts were made to other airports in the Jacksonville vicinity. Table 3-2 provides an indication of potential tenants on hangar waiting lists at five Jacksonville area airports as of March 2005.
This brief survey showed a demand for approximately 200 hangars at these five airports. While it is not likely that all of these potential users would be captured at Cecil Field if hangars became available, some of them likely would. Even if only 10% of them were, this would increase based GA aircraft by approximately 20.
A further positive factor influencing future activity at Cecil Field is the acquisition of the local FBO by an internationally recognized FBO operator, Signature Flight Support. Transient users who have used Signature at any of the company’s 60 other airport locations could be more inclined to use Cecil Field when flying to the northeast Florida area. Signature also includes the airport in their marketing information, such as on their website, increasing the exposure of the airport to potential users. Additionally, in early 2005 a second FBO opened at the airport. Air 1 FBO, LLC., a locally-owned company, has also undertaken
TABLE 3-2 AIRCRAFT STORAGE DEMAND
IN JACKSONVILLE AREA
Airport Hangars Vacancies Waiting
List
2004 Based
Aircraft Cecil 9 0 0 38 Craig 111 0 15 392
Herlong 78 0 65 164 Jacksonville International 8 0 0 36
St. Augustine 122 0 119 331
Totals 328 0 199 961 Notes: 1. Hangar count includes all T-hangar units, box hangar units,
port-a-ports, clearspan/FBO hangars, and corporate or private freestanding hangars.
2. Cecil Field FBOs did not as of early 2005 maintain a waiting list since they had no hangars to lease. It should also be noted that the airport has thus far attracted industrial and commercial aviation users. This trend is expected to continue. These users do not typically place their names on waiting lists.
3. 2004 based aircraft numbers as reported in FAA TAF as of January 2005.
Sources: Correspondence with airport and FBO staff from each respective airport, March 2005.
marketing efforts to increase awareness of potential users regarding Cecil Field. Additionally, the City of Jacksonville was the host city to the 39th Super Bowl in February 2005. Cecil Field was utilized to handle the large influx of GA users, including many air taxi and business jet operators. This further helped to increase the exposure of Cecil Field to transient users, especially in the upper-end of the GA market.
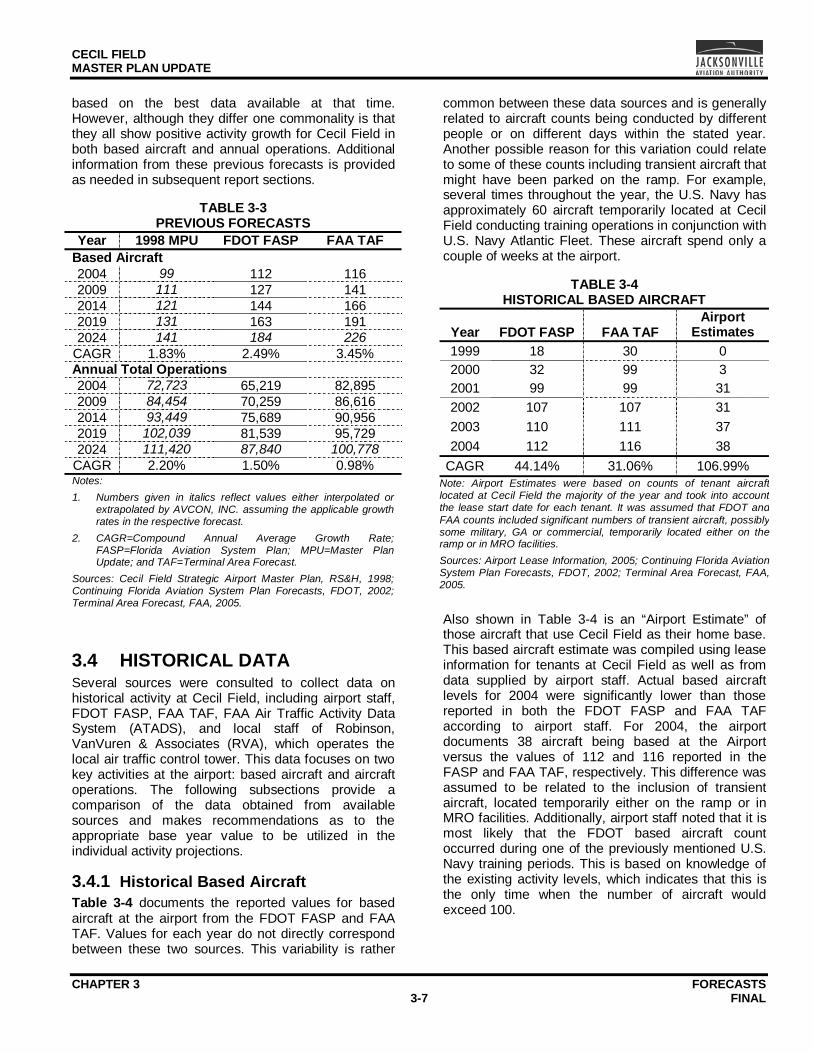
3.3 PREVIOUS FORECASTS Several aviation activity forecasts have been developed for Cecil Field, including the 1998 Master Plan, the FDOT Florida Aviation System Plan (FASP), and the FAA Terminal Area Forecasts (TAF; as of January 2005). Each of these forecasts cover a variety of activity types, with the 1998 Master Plan being the most detailed. A summary of the based aircraft and total operations from each of these forecasts is given in Table 3-3. These values reflect the key study years in this master plan update.
The data in this table illustrates a range of values for these two key operational activities. The FAA TAF projects the fastest growth in based aircraft with an annual growth rate of 3.45%. The 1998 Master Plan projected the fastest operational growth with a growth rate of 2.20%. The differences in the projected growth rates are not surprising considering that each of these projections utilized different forecasting methodologies
CECIL FIELD MASTER PLAN UPDATE
CHAPTER 3 FORECASTS 3-7 FINAL
based on the best data available at that time. However, although they differ one commonality is that they all show positive activity growth for Cecil Field in both based aircraft and annual operations. Additional information from these previous forecasts is provided as needed in subsequent report sections.
TABLE 3-3 PREVIOUS FORECASTS
Year 1998 MPU FDOT FASP FAA TAF Based Aircraft 2004 99 112 116 2009 111 127 141 2014 121 144 166 2019 131 163 191 2024 141 184 226
CAGR 1.83% 2.49% 3.45% Annual Total Operations 2004 72,723 65,219 82,895 2009 84,454 70,259 86,616 2014 93,449 75,689 90,956 2019 102,039 81,539 95,729 2024 111,420 87,840 100,778
CAGR 2.20% 1.50% 0.98% Notes: 1. Numbers given in italics reflect values either interpolated or
extrapolated by AVCON, INC. assuming the applicable growth rates in the respective forecast.
2. CAGR=Compound Annual Average Growth Rate; FASP=Florida Aviation System Plan; MPU=Master Plan Update; and TAF=Terminal Area Forecast.
Sources: Cecil Field Strategic Airport Master Plan, RS&H, 1998; Continuing Florida Aviation System Plan Forecasts, FDOT, 2002; Terminal Area Forecast, FAA, 2005.
3.4 HISTORICAL DATA Several sources were consulted to collect data on historical activity at Cecil Field, including airport staff, FDOT FASP, FAA TAF, FAA Air Traffic Activity Data System (ATADS), and local staff of Robinson, VanVuren & Associates (RVA), which operates the local air traffic control tower. This data focuses on two key activities at the airport: based aircraft and aircraft operations. The following subsections provide a comparison of the data obtained from available sources and makes recommendations as to the appropriate base year value to be utilized in the individual activity projections.
3.4.1 Historical Based Aircraft Table 3-4 documents the reported values for based aircraft at the airport from the FDOT FASP and FAA TAF. Values for each year do not directly correspond between these two sources. This variability is rather
common between these data sources and is generally related to aircraft counts being conducted by different people or on different days within the stated year. Another possible reason for this variation could relate to some of these counts including transient aircraft that might have been parked on the ramp. For example, several times throughout the year, the U.S. Navy has approximately 60 aircraft temporarily located at Cecil Field conducting training operations in conjunction with U.S. Navy Atlantic Fleet. These aircraft spend only a couple of weeks at the airport.
TABLE 3-4 HISTORICAL BASED AIRCRAFT
Year FDOT FASP FAA TAF Airport
Estimates 1999 18 30 0 2000 32 99 3 2001 99 99 31 2002 107 107 31 2003 110 111 37 2004 112 116 38
CAGR 44.14% 31.06% 106.99% Note: Airport Estimates were based on counts of tenant aircraftlocated at Cecil Field the majority of the year and took into accountthe lease start date for each tenant. It was assumed that FDOT and FAA counts included significant numbers of transient aircraft, possiblysome military, GA or commercial, temporarily located either on theramp or in MRO facilities. Sources: Airport Lease Information, 2005; Continuing Florida AviationSystem Plan Forecasts, FDOT, 2002; Terminal Area Forecast, FAA, 2005.
Also shown in Table 3-4 is an “Airport Estimate” of those aircraft that use Cecil Field as their home base. This based aircraft estimate was compiled using lease information for tenants at Cecil Field as well as from data supplied by airport staff. Actual based aircraft levels for 2004 were significantly lower than those reported in both the FDOT FASP and FAA TAF according to airport staff. For 2004, the airport documents 38 aircraft being based at the Airport versus the values of 112 and 116 reported in the FASP and FAA TAF, respectively. This difference was assumed to be related to the inclusion of transient aircraft, located temporarily either on the ramp or in MRO facilities. Additionally, airport staff noted that it is most likely that the FDOT based aircraft count occurred during one of the previously mentioned U.S. Navy training periods. This is based on knowledge of the existing activity levels, which indicates that this is the only time when the number of aircraft would exceed 100.
CECIL FIELD MASTER PLAN UPDATE
CHAPTER 3 FORECASTS 3-8 FINAL
Upon further investigation, the difference between these values relates to whether or not the aircraft located at Cecil Field for MRO services should be included in the annual based aircraft value. It is generally accepted that a based aircraft is one that is located at the subject airport for at least 60% of a given year. At Cecil Field, many of the tenants have aircraft at their facilities for MRO services. These aircraft do not spend a majority of the year at Cecil Field and therefore are not included in the airport’s annual counts of based aircraft. However, it should be noted that MRO operators have a storage capacity for well over 100 aircraft. Thus, a 2004 value of 38 will be used as the starting value in the based aircraft projections developed in this study. This inconsistency
in reporting of historical based aircraft will limit the usefulness of the reported historical data for trend-based forecasting methods.
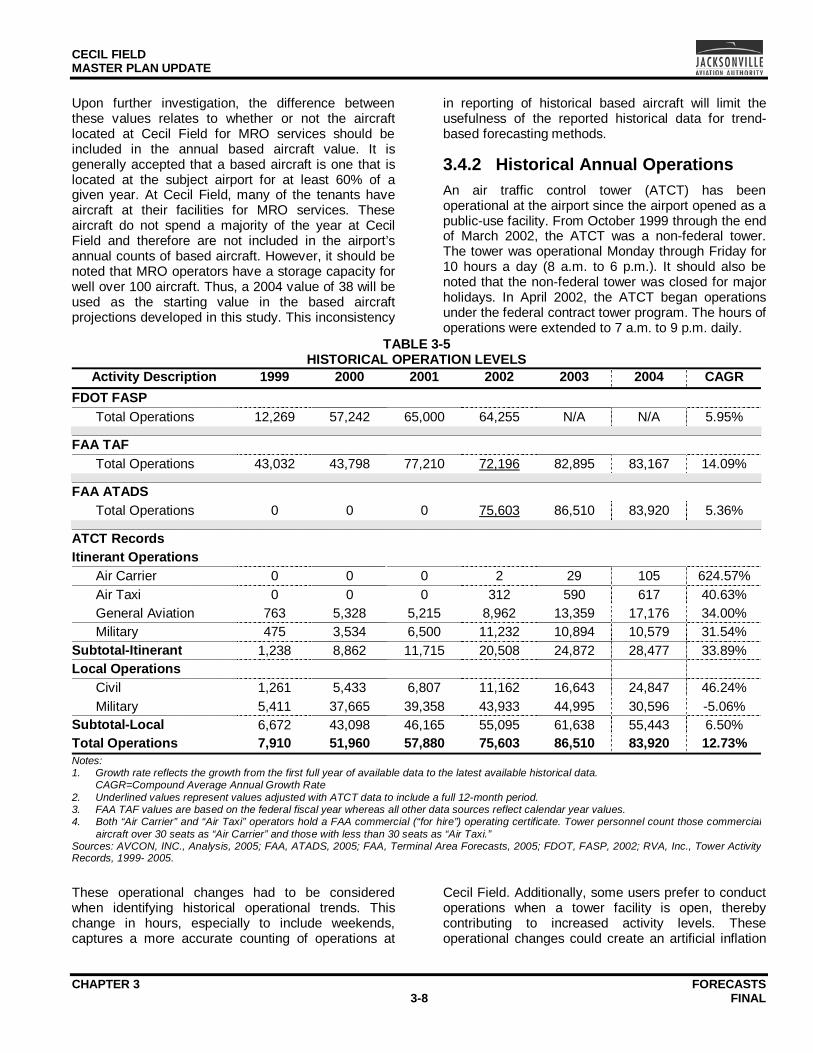
3.4.2 Historical Annual Operations An air traffic control tower (ATCT) has been operational at the airport since the airport opened as a public-use facility. From October 1999 through the end of March 2002, the ATCT was a non-federal tower. The tower was operational Monday through Friday for 10 hours a day (8 a.m. to 6 p.m.). It should also be noted that the non-federal tower was closed for major holidays. In April 2002, the ATCT began operations under the federal contract tower program. The hours of operations were extended to 7 a.m. to 9 p.m. daily.
TABLE 3-5 HISTORICAL OPERATION LEVELS
Activity Description 1999 2000 2001 2002 2003 2004 CAGR FDOT FASP
Total Operations 12,269 57,242 65,000 64,255 N/A N/A 5.95%
FAA TAF Total Operations 43,032 43,798 77,210 72,196 82,895 83,167 14.09%
FAA ATADS Total Operations 0 0 0 75,603 86,510 83,920 5.36%
ATCT Records Itinerant Operations
Air Carrier 0 0 0 2 29 105 624.57% Air Taxi 0 0 0 312 590 617 40.63% General Aviation 763 5,328 5,215 8,962 13,359 17,176 34.00% Military 475 3,534 6,500 11,232 10,894 10,579 31.54%
Subtotal-Itinerant 1,238 8,862 11,715 20,508 24,872 28,477 33.89% Local Operations
Civil 1,261 5,433 6,807 11,162 16,643 24,847 46.24% Military 5,411 37,665 39,358 43,933 44,995 30,596 -5.06%
Subtotal-Local 6,672 43,098 46,165 55,095 61,638 55,443 6.50% Total Operations 7,910 51,960 57,880 75,603 86,510 83,920 12.73% Notes: 1. Growth rate reflects the growth from the first full year of available data to the latest available historical data. CAGR=Compound Average Annual Growth Rate 2. Underlined values represent values adjusted with ATCT data to include a full 12-month period. 3. FAA TAF values are based on the federal fiscal year whereas all other data sources reflect calendar year values. 4. Both “Air Carrier” and “Air Taxi” operators hold a FAA commercial (“for hire”) operating certificate. Tower personnel count those commercial
aircraft over 30 seats as “Air Carrier” and those with less than 30 seats as “Air Taxi.” Sources: AVCON, INC., Analysis, 2005; FAA, ATADS, 2005; FAA, Terminal Area Forecasts, 2005; FDOT, FASP, 2002; RVA, Inc., Tower ActivityRecords, 1999- 2005.
These operational changes had to be considered when identifying historical operational trends. This change in hours, especially to include weekends, captures a more accurate counting of operations at
Cecil Field. Additionally, some users prefer to conduct operations when a tower facility is open, thereby contributing to increased activity levels. These operational changes could create an artificial inflation
CECIL FIELD MASTER PLAN UPDATE
CHAPTER 3 FORECASTS 3-9 FINAL
in the recorded number of total annual operations if appropriate adjustments are not made.
Table 3-5 shows the annual total operations from all available sources. This data includes those operations conducted under instrument conditions. It should be noted that the FDOT FASP, FAA ATADS, and ATCT records reflect the calendar year whereas FAA TAF reflect the federal fiscal year.
Additionally, this table provides a detailed breakout by activity type as reported on monthly ATCT activity reports. This data shows the continual increase in GA activity over the historical period. Also, this data reflects that local activity dominates over itinerant activity. Since 2002, limited air carrier and air taxi operations have occurred at Cecil Field. The compounded average annual growth rates shown in the table are much higher than industry standards, reflecting the emerging maturation of the airport. Further analysis of these trends will be discussed in later report sections.
A review of this annual operations data identified several differences between the various sources. The FDOT FASP historical data reflects estimated values collected during the annual inspection visits by a FDOT representative. These estimations include not only recorded ATCT operations, but also, an estimate of activity during the periods the ATCT is closed. The variations of the FAA TAF values from the other data sources relate almost entirely to the differences in
totaling the data over the federal fiscal year instead of the calendar year.
Adjustments were made to the 2002 values reported in the FAA TAF (39,229) and the FAA ATADS (57,377) databases. These reported values do not account for the months during which the tower was operated as a nonfederal facility. The FAA TAF data represented only those operations conducted between March and September 2002. Thus, the first six months of the fiscal year were not accounted for. This could be related to the fact that the FAA TAF values for towered airports are collected directly from the FAA ATADS which only contains data from FAA and federal contract towers. Similarly, the FAA ATADS data does not reflect operations at Cecil Field when the tower was operated as a nonfederal facility. Considering the variability in these data types, the actual monthly ATCT records were determined to be the most complete source of aircraft operational activity.
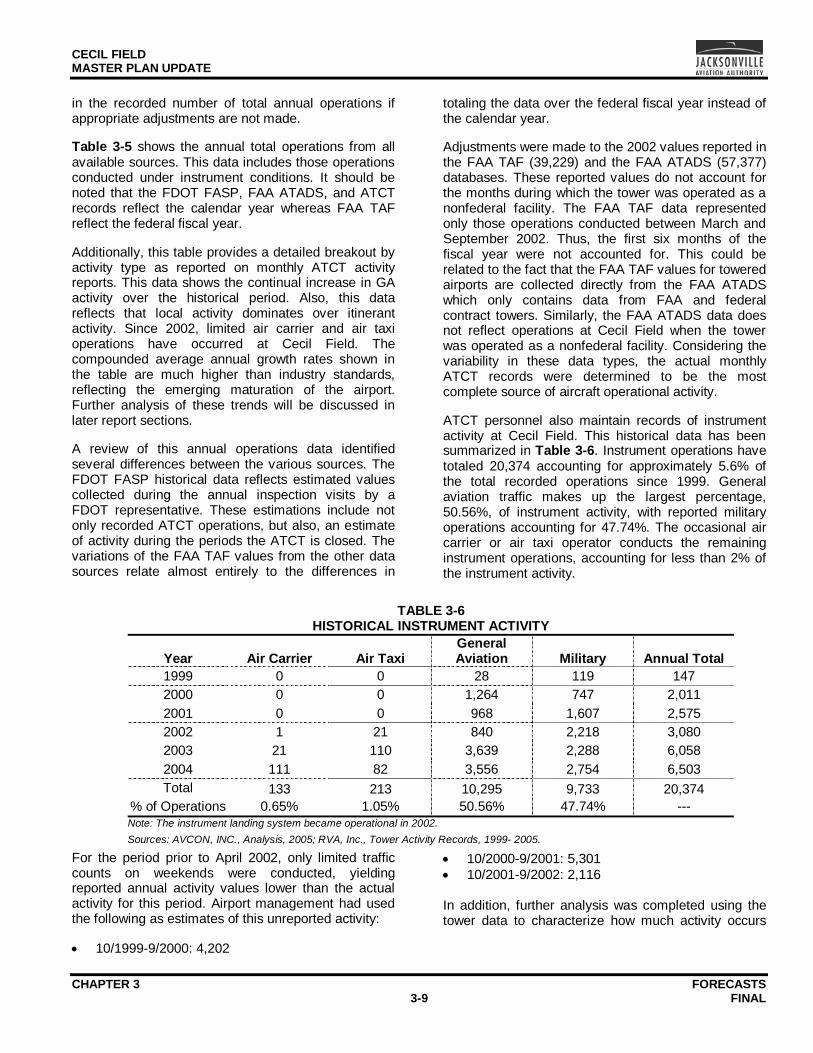
ATCT personnel also maintain records of instrument activity at Cecil Field. This historical data has been summarized in Table 3-6. Instrument operations have totaled 20,374 accounting for approximately 5.6% of the total recorded operations since 1999. General aviation traffic makes up the largest percentage, 50.56%, of instrument activity, with reported military operations accounting for 47.74%. The occasional air carrier or air taxi operator conducts the remaining instrument operations, accounting for less than 2% of the instrument activity.
TABLE 3-6
HISTORICAL INSTRUMENT ACTIVITY
Year Air Carrier Air Taxi General Aviation Military Annual Total
1999 0 0 28 119 147 2000 0 0 1,264 747 2,011 2001 0 0 968 1,607 2,575 2002 1 21 840 2,218 3,080 2003 21 110 3,639 2,288 6,058 2004 111 82 3,556 2,754 6,503 Total 133 213 10,295 9,733 20,374
% of Operations 0.65% 1.05% 50.56% 47.74% --- Note: The instrument landing system became operational in 2002. Sources: AVCON, INC., Analysis, 2005; RVA, Inc., Tower Activity Records, 1999- 2005.
For the period prior to April 2002, only limited traffic counts on weekends were conducted, yielding reported annual activity values lower than the actual activity for this period. Airport management had used the following as estimates of this unreported activity:
• 10/1999-9/2000: 4,202
• 10/2000-9/2001: 5,301 • 10/2001-9/2002: 2,116 In addition, further analysis was completed using the tower data to characterize how much activity occurs
CECIL FIELD MASTER PLAN UPDATE
CHAPTER 3 FORECASTS 3-10 FINAL
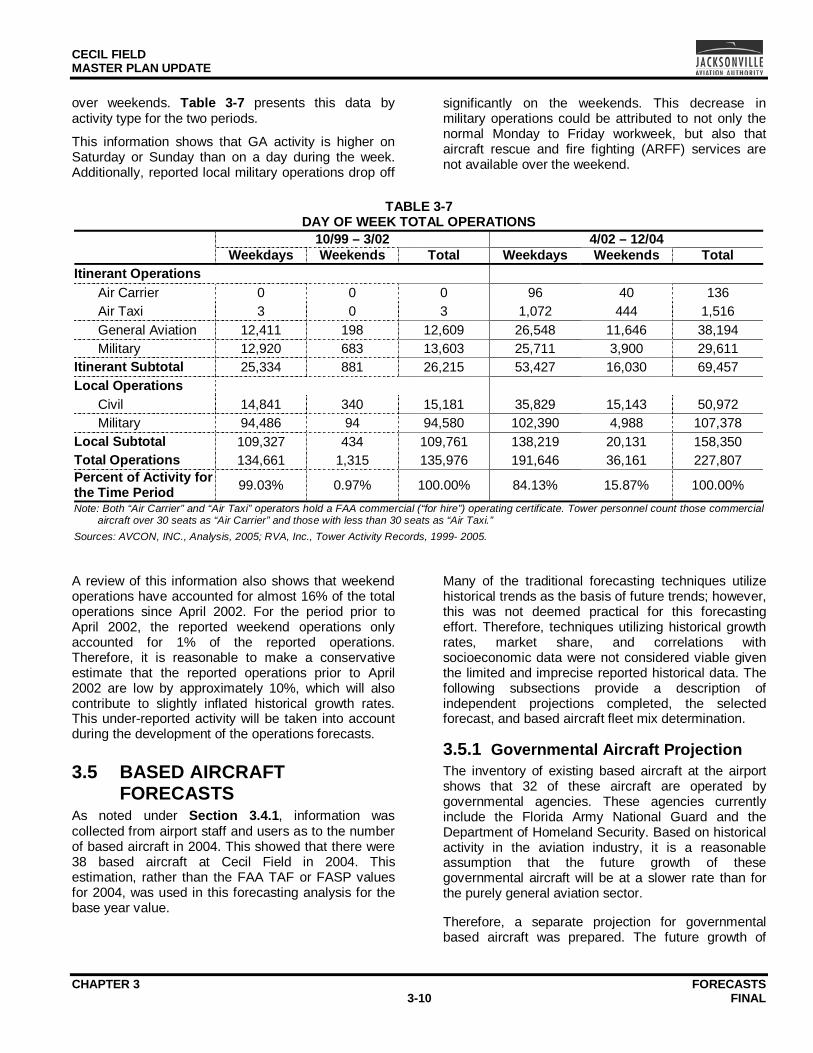
over weekends. Table 3-7 presents this data by activity type for the two periods.
This information shows that GA activity is higher on Saturday or Sunday than on a day during the week. Additionally, reported local military operations drop off
significantly on the weekends. This decrease in military operations could be attributed to not only the normal Monday to Friday workweek, but also that aircraft rescue and fire fighting (ARFF) services are not available over the weekend.
TABLE 3-7
DAY OF WEEK TOTAL OPERATIONS 10/99 – 3/02 4/02 – 12/04
Weekdays Weekends Total Weekdays Weekends Total Itinerant Operations
Air Carrier 0 0 0 96 40 136 Air Taxi 3 0 3 1,072 444 1,516 General Aviation 12,411 198 12,609 26,548 11,646 38,194 Military 12,920 683 13,603 25,711 3,900 29,611
Itinerant Subtotal 25,334 881 26,215 53,427 16,030 69,457 Local Operations
Civil 14,841 340 15,181 35,829 15,143 50,972 Military 94,486 94 94,580 102,390 4,988 107,378
Local Subtotal 109,327 434 109,761 138,219 20,131 158,350 Total Operations 134,661 1,315 135,976 191,646 36,161 227,807 Percent of Activity for the Time Period 99.03% 0.97% 100.00% 84.13% 15.87% 100.00%
Note: Both “Air Carrier” and “Air Taxi” operators hold a FAA commercial (“for hire”) operating certificate. Tower personnel count those commercialaircraft over 30 seats as “Air Carrier” and those with less than 30 seats as “Air Taxi.”
Sources: AVCON, INC., Analysis, 2005; RVA, Inc., Tower Activity Records, 1999- 2005.
A review of this information also shows that weekend operations have accounted for almost 16% of the total operations since April 2002. For the period prior to April 2002, the reported weekend operations only accounted for 1% of the reported operations. Therefore, it is reasonable to make a conservative estimate that the reported operations prior to April 2002 are low by approximately 10%, which will also contribute to slightly inflated historical growth rates. This under-reported activity will be taken into account during the development of the operations forecasts.
3.5 BASED AIRCRAFT FORECASTS
As noted under Section 3.4.1, information was collected from airport staff and users as to the number of based aircraft in 2004. This showed that there were 38 based aircraft at Cecil Field in 2004. This estimation, rather than the FAA TAF or FASP values for 2004, was used in this forecasting analysis for the base year value.
Many of the traditional forecasting techniques utilize historical trends as the basis of future trends; however, this was not deemed practical for this forecasting effort. Therefore, techniques utilizing historical growth rates, market share, and correlations with socioeconomic data were not considered viable given the limited and imprecise reported historical data. The following subsections provide a description of independent projections completed, the selected forecast, and based aircraft fleet mix determination.
3.5.1 Governmental Aircraft Projection The inventory of existing based aircraft at the airport shows that 32 of these aircraft are operated by governmental agencies. These agencies currently include the Florida Army National Guard and the Department of Homeland Security. Based on historical activity in the aviation industry, it is a reasonable assumption that the future growth of these governmental aircraft will be at a slower rate than for the purely general aviation sector.
Therefore, a separate projection for governmental based aircraft was prepared. The future growth of
CECIL FIELD MASTER PLAN UPDATE
CHAPTER 3 FORECASTS 3-11 FINAL
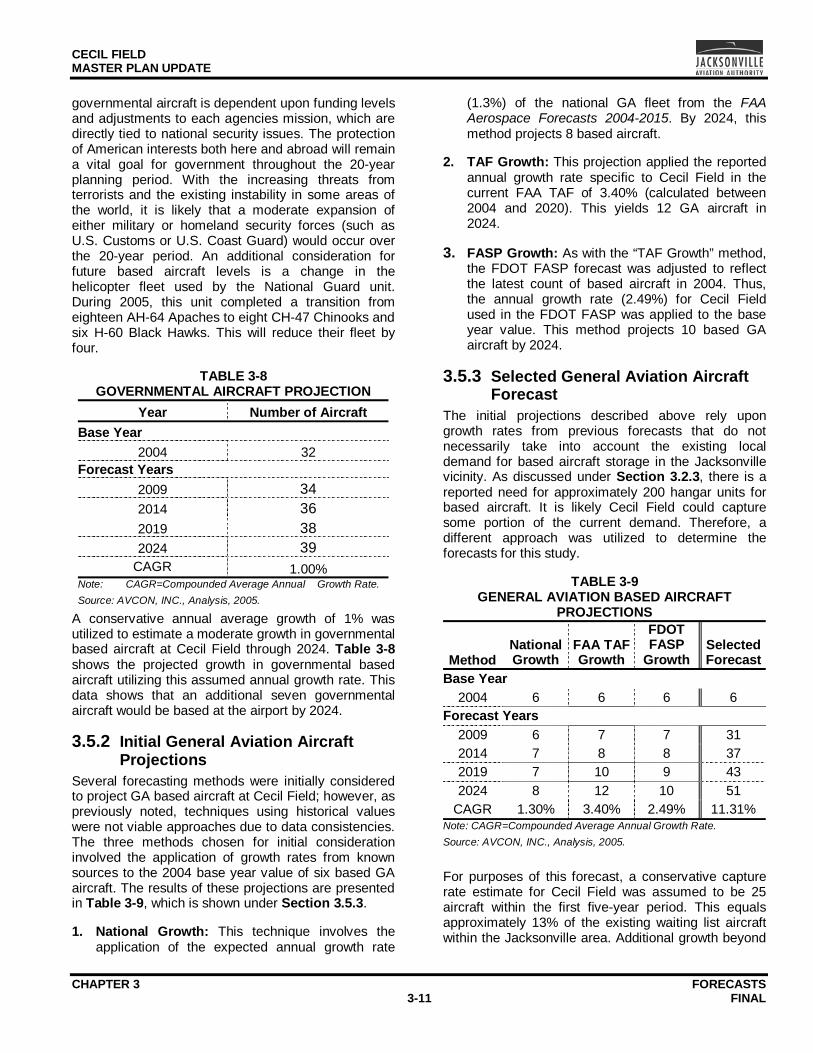
governmental aircraft is dependent upon funding levels and adjustments to each agencies mission, which are directly tied to national security issues. The protection of American interests both here and abroad will remain a vital goal for government throughout the 20-year planning period. With the increasing threats from terrorists and the existing instability in some areas of the world, it is likely that a moderate expansion of either military or homeland security forces (such as U.S. Customs or U.S. Coast Guard) would occur over the 20-year period. An additional consideration for future based aircraft levels is a change in the helicopter fleet used by the National Guard unit. During 2005, this unit completed a transition from eighteen AH-64 Apaches to eight CH-47 Chinooks and six H-60 Black Hawks. This will reduce their fleet by four.
TABLE 3-8 GOVERNMENTAL AIRCRAFT PROJECTION
Year Number of Aircraft Base Year
2004 32 Forecast Years
2009 34 2014 36 2019 38 2024 39
CAGR 1.00% Note: CAGR=Compounded Average Annual Growth Rate. Source: AVCON, INC., Analysis, 2005.
A conservative annual average growth of 1% was utilized to estimate a moderate growth in governmental based aircraft at Cecil Field through 2024. Table 3-8 shows the projected growth in governmental based aircraft utilizing this assumed annual growth rate. This data shows that an additional seven governmental aircraft would be based at the airport by 2024.
3.5.2 Initial General Aviation Aircraft Projections
Several forecasting methods were initially considered to project GA based aircraft at Cecil Field; however, as previously noted, techniques using historical values were not viable approaches due to data consistencies. The three methods chosen for initial consideration involved the application of growth rates from known sources to the 2004 base year value of six based GA aircraft. The results of these projections are presented in Table 3-9, which is shown under Section 3.5.3.
1. National Growth: This technique involves the application of the expected annual growth rate
(1.3%) of the national GA fleet from the FAA Aerospace Forecasts 2004-2015. By 2024, this method projects 8 based aircraft.
2. TAF Growth: This projection applied the reported annual growth rate specific to Cecil Field in the current FAA TAF of 3.40% (calculated between 2004 and 2020). This yields 12 GA aircraft in 2024.
3. FASP Growth: As with the “TAF Growth” method, the FDOT FASP forecast was adjusted to reflect the latest count of based aircraft in 2004. Thus, the annual growth rate (2.49%) for Cecil Field used in the FDOT FASP was applied to the base year value. This method projects 10 based GA aircraft by 2024.
3.5.3 Selected General Aviation Aircraft Forecast
The initial projections described above rely upon growth rates from previous forecasts that do not necessarily take into account the existing local demand for based aircraft storage in the Jacksonville vicinity. As discussed under Section 3.2.3, there is a reported need for approximately 200 hangar units for based aircraft. It is likely Cecil Field could capture some portion of the current demand. Therefore, a different approach was utilized to determine the forecasts for this study.
TABLE 3-9 GENERAL AVIATION BASED AIRCRAFT
PROJECTIONS
MethodNational Growth
FAA TAF Growth
FDOT FASP
Growth Selected Forecast
Base Year 2004 6 6 6 6
Forecast Years 2009 6 7 7 31 2014 7 8 8 37 2019 7 10 9 43 2024 8 12 10 51
CAGR 1.30% 3.40% 2.49% 11.31% Note: CAGR=Compounded Average Annual Growth Rate. Source: AVCON, INC., Analysis, 2005.
For purposes of this forecast, a conservative capture rate estimate for Cecil Field was assumed to be 25 aircraft within the first five-year period. This equals approximately 13% of the existing waiting list aircraft within the Jacksonville area. Additional growth beyond
CECIL FIELD MASTER PLAN UPDATE
CHAPTER 3 FORECASTS 3-12 FINAL
2009 was then assumed to occur at the FAA TAF growth rate, 3.40%. Table 3-9 presents this forecast results.
Overall, this forecast, which was determined to be the most appropriate considering national and local factors, yields the addition of 45 new GA aircraft by 2024. The overall annual growth rate for GA based aircraft from 2004 to 2024 was determined to be 11.31%, which might seem high, but is not unreasonable considering that the GA market sector at Cecil Field is still maturing.
The selected forecast represents a projection based upon linear growth patterns. However, future additions of based aircraft will likely occur in a more staggered pattern related to the development of hangars. Additionally, if certain commercial activities become located at the airport, such as a flight training school or as a headquarters location for a time-share aircraft operator (like NetJet), there might be a very large increase from one year to the next. This could lead to based aircraft numbers closer to those reported (refer to Table 3-3) by the FAA TAF and/ or FDOT FASP.
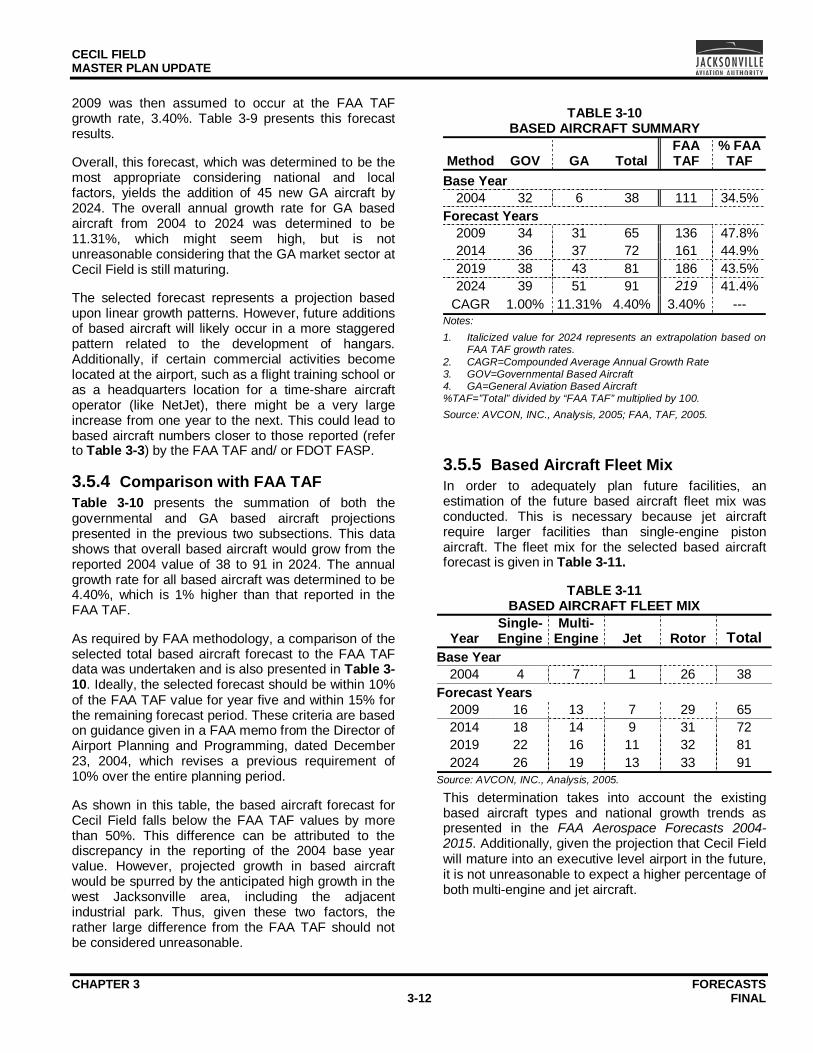
3.5.4 Comparison with FAA TAF Table 3-10 presents the summation of both the governmental and GA based aircraft projections presented in the previous two subsections. This data shows that overall based aircraft would grow from the reported 2004 value of 38 to 91 in 2024. The annual growth rate for all based aircraft was determined to be 4.40%, which is 1% higher than that reported in the FAA TAF.
As required by FAA methodology, a comparison of the selected total based aircraft forecast to the FAA TAF data was undertaken and is also presented in Table 3-10. Ideally, the selected forecast should be within 10% of the FAA TAF value for year five and within 15% for the remaining forecast period. These criteria are based on guidance given in a FAA memo from the Director of Airport Planning and Programming, dated December 23, 2004, which revises a previous requirement of 10% over the entire planning period.
As shown in this table, the based aircraft forecast for Cecil Field falls below the FAA TAF values by more than 50%. This difference can be attributed to the discrepancy in the reporting of the 2004 base year value. However, projected growth in based aircraft would be spurred by the anticipated high growth in the west Jacksonville area, including the adjacent industrial park. Thus, given these two factors, the rather large difference from the FAA TAF should not be considered unreasonable.
TABLE 3-10 BASED AIRCRAFT SUMMARY
Method GOV GA Total FAA TAF
% FAA TAF
Base Year 2004 32 6 38 111 34.5%
Forecast Years 2009 34 31 65 136 47.8% 2014 36 37 72 161 44.9% 2019 38 43 81 186 43.5% 2024 39 51 91 219 41.4%
CAGR 1.00% 11.31% 4.40% 3.40% --- Notes: 1. Italicized value for 2024 represents an extrapolation based on
FAA TAF growth rates. 2. CAGR=Compounded Average Annual Growth Rate 3. GOV=Governmental Based Aircraft 4. GA=General Aviation Based Aircraft %TAF=”Total” divided by “FAA TAF” multiplied by 100. Source: AVCON, INC., Analysis, 2005; FAA, TAF, 2005.
3.5.5 Based Aircraft Fleet Mix In order to adequately plan future facilities, an estimation of the future based aircraft fleet mix was conducted. This is necessary because jet aircraft require larger facilities than single-engine piston aircraft. The fleet mix for the selected based aircraft forecast is given in Table 3-11.
TABLE 3-11 BASED AIRCRAFT FLEET MIX
Year Single-Engine
Multi- Engine Jet Rotor Total
Base Year 2004 4 7 1 26 38
Forecast Years 2009 16 13 7 29 65 2014 18 14 9 31 72 2019 22 16 11 32 81 2024 26 19 13 33 91
Source: AVCON, INC., Analysis, 2005.
This determination takes into account the existing based aircraft types and national growth trends as presented in the FAA Aerospace Forecasts 2004-2015. Additionally, given the projection that Cecil Field will mature into an executive level airport in the future, it is not unreasonable to expect a higher percentage of both multi-engine and jet aircraft.
CECIL FIELD MASTER PLAN UPDATE
CHAPTER 3 FORECASTS 3-13 FINAL
3.6 MISCELLANEOUS OPERATIONS
As discussed under Section 3.1, there is an incongruity between how the tower counts some operations by users and whether or not those users pay fuels taxes into the Aviation Trust Fund. It is important for purposes of this planning study to account for users who do pay into the Aviation Trust Fund separately from those that do not. As such, those operations, which do not.
3.6.1 Miscellaneous Operations Forecasts
International flight training is included in this Miscellaneous Operations category because the users pay full fuel taxes. In the last quarter of 2003, a previous tenant began operations at Cecil Field. This company provided tactical flight training on a contract basis, primarily to U.S. approved foreign military units. Flight training was conducted in designated military air operations airspace located in the Jacksonville vicinity. A typical training scenario involved four sorties a day of two aircraft, yielding 16 operations per day. Training was generally conducted on weekdays. This previous tenant’s business was expected to grow over time, providing for an increase in annual operations. Therefore, it was estimated that this international training could reach 3,744 annual operations by 2024 assuming training was conducted for 90% of the year on weekdays only. Taking these items into account, a base year value of 2,080 was determined assuming that training occurred for approximately 50% the time in 2004.
Recently, a similar company, Airborne Tactical Advantage Company (ATAC), began training operations for the Navy. Although these operations are not for international training, the facilities and demand for international training is still in place today. It is reasonable to assume that these operations could take place over the 20 year planning period.
The last operations group in the Miscellaneous category relate to aircraft operations conducted by various tenants as a part of civilian MRO/manufacturing services. This group would also include aircraft conversions from one use to another (e.g., from passenger to cargo configurations. As of 2005, Flightstar was the only tenant performing MRO/manufacturing activities on civilian aircraft. Normally MRO/manufacturing activities involve only limited activities related to test flights and the transportation of the aircraft to and from the facility, airport representatives project activity levels of two or
three operations weekly in 2005, yielding an annual estimate of 260 operations for 2005. Projected growth for these activities in the short-term period was estimated to double to approximately five operations weekly in 2009. Beyond the short-term period, growth was estimated at a nominal 1% per year through 2024 to account for additional MRO/manufacturing operators.
Table 3-12 provides a summary of projected activity within this Miscellaneous Operations category. In 2004, it is estimated that approximately 2,080 operations occurred by various users in this category. By 2024, these activities could reach 4,348 annual operations. This operations category is projected to experience an average annual growth of 3.76% over the planning period, based upon the assumptions previously described for each activity within this category. In subsequent report sections, International Training operations will be accounted for under “GA” activity, whereas Civilian MRO/Manufacturing will be counted under the “Air Carrier” category.
TABLE 3-12 ANNUAL OPERATIONS FORECAST:
MISCELLANEOUS
Year International
Training Civilian MRO/ Manufacturing Total
Base Year 2004 2,080 0 2,080
Forecast Years 2009 2,496 520 3,016 2014 2,912 547 3,459 2019 3,328 574 3,902 2024 3,744 604 4,348
CAGR 2.98% 4.53% 3.76% Note: CAGR=Compounded Average Annual Growth Rate Source: AVCON, INC., Analysis, 2005.
3.7 MILITARY OPERATIONS Prior to its opening as a public-use facility, Cecil Field was a very active military base. The airport continues to experience significant military activity. This can be attributed to the fact that the airport is equipped with the necessary infrastructure (long runways, ATCT, VOR, and ILS) to support military activity as well as to the number of military installations in the general vicinity. Additionally, as presented in Section 3.1, activity by the DHS-U.S. Customs (estimated at 1,080 annually) and AeroGroup (refer to Section 3.6.1) are included under the military category by tower personnel. The following provides an overview of
CECIL FIELD MASTER PLAN UPDATE
CHAPTER 3 FORECASTS 3-14 FINAL
historical military activity conducted at Cecil Field and a projection for future annual military operations.
3.7.1 Historical Military Activity Military activity at the Airport primarily consists of operations by the Florida Army National Guard unit and transient military aircraft from military installations in the Jacksonville vicinity. Periodically, groups of U.S. Navy T-45 Goshawk’s are temporarily located at Cecil Field. These units, consisting of as many as 60 aircraft, generally fly to and from the Airport to practice landings and takeoffs on air carriers from the U.S. Navy’s Atlantic Fleet. These carrier training periods usually occur four or six times per year and last 10 to
14 days, accounting for approximately 2,600 operations each time.
Two data sources (the FAA TAF and ATCT records) were consulted to identify historical annual levels of military operations at Cecil Field. Table 3-13 provides a summary of this data. Additionally, the table shows an adjustment to the FAA TAF and ATCT values based on the classifications given in Table 3.1. Thus, appropriate adjustments were made to the historical data based upon the lease date of tenants. It should be noted that the reported values for 1999 reflect operations from October through December only and that the FAA TAF value for 2002 was adjusted with ATCT so that it would reflect 12 months of activity.
TABLE 3-13
ANNUAL OPERATIONS FORECAST: MILITARY Reported Values Adjusted Values
Year FAA TAF ATCT
Records FAA TAF ATCT
Records Independent Projection
Historical and Base Year 1999 30,817 5,886 30,817 5,886 --- 2000 33,131 41,199 33,131 41,199 --- 2001 53,739 45,858 53,739 45,858 --- 2002 54,883 55,165 54,883 55,165 --- 2003 55,190 55,889 54,430 55,129 55,129 2004 42,217 41,175 41,937 40,895 40,895
Historical (00-04) CAGR 6.25% -0.01% 6.07% -0.18% --- Forecast Years
2009 42,217 --- 41,521 --- 40,900 2014 42,217 --- 41,105 --- 40,900 2019 42,217 --- 40,689 --- 40,900 2024 42,217 --- 40,273 --- 40,900
Forecast CAGR 0.00% --- -0.20% --- 0.00% Notes: 1. FAA TAF values represent the federal fiscal year (October through September) whereas ATCT data represents calendar
year activity. 2. CAGR=Compounded Average Annual Growth Rate. Source: AVCON, INC., Analysis, 2005; FAA, TAF, 2005; and RVA, Inc., ATCT Records, 2005.
Military operations have fluctuated over the historical period. FAA TAF data from 1999 through 2004 shows military activity reached a high in 2003. The ATCT data shows that military operations have ranged from a low of 41,175 in 2004 to a high of 55,889 in 2003 o the adjusted values of 40,895 and 55,165, respectively. The operational fluctuations in 2002 through 2004 might be attributed to various units in the area preparing to be deployed to either Afghanistan or Iraq. In fact, a portion of the National Guard unit based at the Airport has been deployed over the last 18 to 24
months, which may account for a portion of the activity decrease observed in 2004. In the short-term, the fleet changes occurring for the National Guard unit (as discussed under Section 3.5.1) will also likely impact future activity levels.
3.7.2 Forecast of Military Activity Federal funding levels for military operations and U.S. foreign policy decisions are the primary factors affecting future military activity across the nation. Both of these issues impact how military units are deployed
CECIL FIELD MASTER PLAN UPDATE
CHAPTER 3 FORECASTS 3-15 FINAL
across the nation and even worldwide. Given the uncertain nature of these issues, changes in military activity levels are very difficult to anticipate. The FAA Aerospace Forecasts 2004-2015 and the FAA TAF generally show no growth in military operations.
Thus, the use of an average activity level appears appropriate as a projection of future military activity at Cecil Field. Historical data as reported by the ATCT, adjusted as previously discussed, was used as the basis for this determination. Since Cecil Field was not opened as a public-use facility for the full year of 1999, only historical data from 2000 through 2004 was used. The results of this exercise showed that on average approximately 47,800 annual military operations had been conducted at the airport over the five-year historical period. Due to the uncertainty associated with future federal policy decisions, neither an increase nor decrease could reasonably be identified for military operations levels. Therefore, the approximate adjusted value for 2004 of 44,900 was used throughout the planning period as shown in Table 3-13.
3.8 GENERAL AVIATION OPERATIONS
General aviation (GA) activity is anticipated to be the largest activity sector at Cecil Field over the 20-year planning period. This category includes any activity not considered “commercial” (which includes air carrier and air taxi operators) or “U.S. military” under FAA regulations. A commercial operation includes the carriage of passengers or goods for a fee. These commercial operators have to obtain the appropriate FAA operating certificate, under Title 14, Parts 119, 121, 125 or 135 of the U.S. Code of Federal Regulations. In ATCT counts and FAA TAF reports, GA would also include non-military, governmental operations, such as the DHS-U.S. Customs activity. The following provides a description of historical GA activity and presents several GA activity projections.
3.8.1 Historical Data As with other activity groups, several sources were consulted for records of historical annual GA operations as well as for previous activity forecasts. Table 3-14 provides data from three sources.
Values for GA-only operations were not available from the FDOT FASP. This statewide system plan only develops forecasts for two classifications: commercial and GA. Commercial operations relate to passenger and cargo service only. All other operations, including military and air taxi, are included under the broad
heading of “GA.” Therefore, the FDOT FASP could not be used for comparison in the current analysis.
Since 1999, GA operations have grown quite rapidly and have exceeded the 1998 MPU forecast operations through 2004. It should be noted that the FAA TAF value for 2002 was adjusted with monthly ATCT data to give a full 12 months of activity. The ATCT data shows a CAGR of 40.58% over this period, resulting from an additional 8 to 10 thousand additional GA operations each year since 2001. This significant growth in GA operations over the historical period is fairly typically of a new airport opening within a busy regional aviation system, such as the northeast Florida area.
TABLE 3-14 GA OPERATIONS: HISTORICAL &
EXISTING FORECASTS Year 1998 MPU FAA TAF ATCT Data
Historical and Base Year 1999 - 9,215 2,024 2000 27,000 10,667 10,761 2001 28,191 23,052 12,022 2002 29,434 17,102 20,124 2003 30,732 27,151 30,002 2004 32,087 40,187 42,023
Historical CAGR 4.41% 34.25% 40.58% Forecast Years
2009 42,782 44,471 Not Applicable
2014 57,043 48,895 Not Applicable
2019 70,780 53,759 Not Applicable
2024 76,058 59,202 Not Applicable
Forecast CAGR 4.41% 1.96% Not Applicable
Notes: 1. Values in italics represent forecast values, not actual historical
operations whereas underlined values represent values either interpolated or extrapolated from previous forecasts.
2. FAA TAF values represent the federal fiscal year (October through September) whereas other data sources represent calendar year activity.
3. ATCT data values for 2003 were adjusted to reflect the estimated operations conducted by DHS-US Customs, which were included in the Military Operations category.
4. Historical CAGR represents the period 2000 to 2004 except for the FAA TAF values that cover federal fiscal years 1999 through 2004.
5. CAGR=Compounded Average Annual Growth Rate. Sources: AVCON, INC., Analysis, 2005; FAA, TAF, 2005; FDOT, FASP, 2002; RS&H, Cecil Field Strategic Master Plan Update, 1998; RVA, Inc., ATCT Reports, 2005.
CECIL FIELD MASTER PLAN UPDATE
CHAPTER 3 FORECASTS 3-16 FINAL
As noted under Section 3.5, Cecil Field currently only has a few based GA aircraft. This low number is related to the lack of available GA hangar space. Therefore, it can be safely assumed that transient users conduct the majority of GA operations at the airport. This transient activity includes the full spectrum of GA aircraft, as noted by ATCT and FBO personnel. The percent of jet activity, consisting primarily of various Hawker, Citation and smaller Lear models, was considered higher than what is experienced at most other GA airports in the area. This is likely due to the available runway length and instrument approaches at Cecil Field.
Projected GA operations through 2024, as presented in the previous MPU and the FAA TAF, are also included in Table 3-14. The previous master plan relied on average activity levels at other northeast Florida airports as the basis for the GA operations forecast. A comparison of the 1998 MPU forecast with historical data shows that through 2004, GA traffic was slower than initially anticipated; however, GA operations surpassed the projected activity in 2004 by almost 10,000.
The FAA TAF projects much slower growth, 1.96% annually, of GA operations at Cecil Field. The projected activity in 2024 was estimated via extrapolation to be 59,202 operations since the most current edition of the FAA TAF projections stops at 2020.
3.8.2 Independent Projections Several methodologies were used to forecast future GA operations through 2024. Traditionally, forecasts developed in a master plan would rely quite heavily on historical trends at the facility. However, in the case of Cecil Field that was not possible for two reasons: 1) the previously discussed data reporting discrepancies and 2) the limited time the facility has been open for public use. Thus, forecasting methodologies relied heavily on FAA operations per based aircraft (OPBA) methodology and the use of growth rates from projections of national and statewide trends.
Additionally, per the classifications in Section 3.1, some adjustments were necessary to account for DHS-U.S. Customs operations and ATAC. For the independent projections relying on projected annual growth rates, the ATAC projection previously presented in Table 3-12 was added after the growth rate was applied to the base year value.
3.8.2.1 Base Year Value The accuracy of various forecasting methodologies is directly tied to the currency of the base year data. As
shown under Section 3.8.1, the annual GA operations increased by over 12,000 from 2003 to 2004. Since tower personnel stated that DHS-U.S. Customs operations are included in the GA category on ATCT reports, an adjustment of 1,800 was made to the ATCT value for 2004 since those operations were already accounted for under the Military category (refer to Section 3.7). This gave a base year 2004 value of 40,223. Therefore, for those forecasting methods employing an established growth rate to project future activity levels, the growth rate was applied to this base year value. For other methods, the 2004 value generated by those techniques was compared to the actual value to test the applicability of the technique to activity at Cecil Field.
3.8.2.2 OPBA-Historical A standard forecasting methodology is to estimate operations utilizing a ratio of operations per based aircraft (OPBA). At some airports, this ratio remains fairly constant. Annual OPBA values for Cecil Field were calculated using the estimated based aircraft values (see Table 3-4) and the GA-only operations data as reported by the ATCT.
The historical GA-only OPBA ranged from a low of 388 to a high of 3,587. The wide range is reflective of the current lack of GA aircraft storage facilities and of the emerging nature of Cecil Field. These annual values from 2000 through 2004 were averaged to yield a GA-only OPBA value of approximately 1,300.
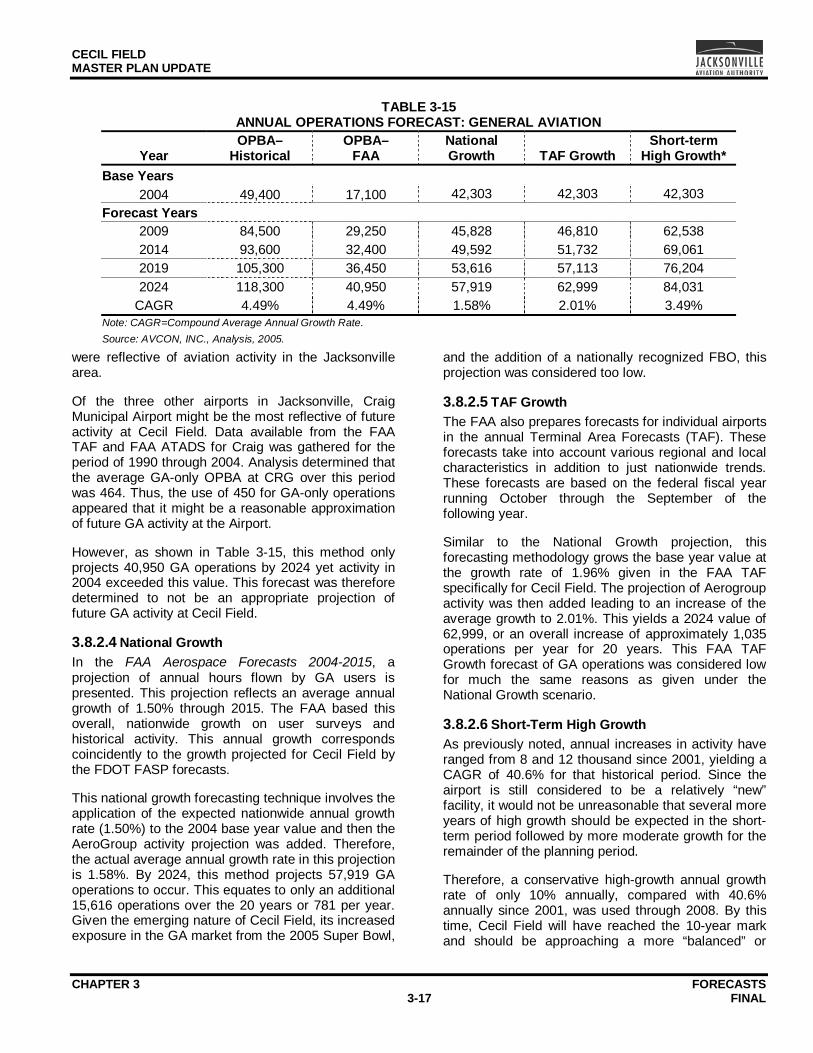
This OPBA was then used in conjunction with the forecast based aircraft to project future activity levels, as given in Table 3-15. This method estimates GA operations in 2004 at 49,400, which exceeds the actual value of 40,223. By 2024, GA operations were projected to increase to 118,300. This methodology was considered to give projected annual GA operations higher than should be expected because as based aircraft numbers grow the OPBA value should decrease. More time is needed for this value to stabilize prior to using it as the basis of activity projections.
3.8.2.3 OPBA-FAA Order 5090.3C In FAA Order 5090.3C, National Plan of Integrated Airport System, it is stated that for busy GA reliever airports, the OPBA is usually around 450, but that it could be as high as 750 if the airport experienced higher levels of itinerant activity. These values given by the FAA reflect operations conducted by all users, not just GA traffic. Since Cecil Field’s historical GA-only OPBA presented in the previous subsection was not deemed usable, GA activity at a similar airport in the area was studied to determine if the FAA values
CECIL FIELD MASTER PLAN UPDATE
CHAPTER 3 FORECASTS 3-17 FINAL
were reflective of aviation activity in the Jacksonville area.
Of the three other airports in Jacksonville, Craig Municipal Airport might be the most reflective of future activity at Cecil Field. Data available from the FAA TAF and FAA ATADS for Craig was gathered for the period of 1990 through 2004. Analysis determined that the average GA-only OPBA at CRG over this period was 464. Thus, the use of 450 for GA-only operations appeared that it might be a reasonable approximation of future GA activity at the Airport.
However, as shown in Table 3-15, this method only projects 40,950 GA operations by 2024 yet activity in 2004 exceeded this value. This forecast was therefore determined to not be an appropriate projection of future GA activity at Cecil Field.
3.8.2.4 National Growth In the FAA Aerospace Forecasts 2004-2015, a projection of annual hours flown by GA users is presented. This projection reflects an average annual growth of 1.50% through 2015. The FAA based this overall, nationwide growth on user surveys and historical activity. This annual growth corresponds coincidently to the growth projected for Cecil Field by the FDOT FASP forecasts.
This national growth forecasting technique involves the application of the expected nationwide annual growth rate (1.50%) to the 2004 base year value and then the AeroGroup activity projection was added. Therefore, the actual average annual growth rate in this projection is 1.58%. By 2024, this method projects 57,919 GA operations to occur. This equates to only an additional 15,616 operations over the 20 years or 781 per year. Given the emerging nature of Cecil Field, its increased exposure in the GA market from the 2005 Super Bowl,
and the addition of a nationally recognized FBO, this projection was considered too low.
3.8.2.5 TAF Growth The FAA also prepares forecasts for individual airports in the annual Terminal Area Forecasts (TAF). These forecasts take into account various regional and local characteristics in addition to just nationwide trends. These forecasts are based on the federal fiscal year running October through the September of the following year.
Similar to the National Growth projection, this forecasting methodology grows the base year value at the growth rate of 1.96% given in the FAA TAF specifically for Cecil Field. The projection of Aerogroup activity was then added leading to an increase of the average growth to 2.01%. This yields a 2024 value of 62,999, or an overall increase of approximately 1,035 operations per year for 20 years. This FAA TAF Growth forecast of GA operations was considered low for much the same reasons as given under the National Growth scenario.
3.8.2.6 Short-Term High Growth As previously noted, annual increases in activity have ranged from 8 and 12 thousand since 2001, yielding a CAGR of 40.6% for that historical period. Since the airport is still considered to be a relatively “new” facility, it would not be unreasonable that several more years of high growth should be expected in the short-term period followed by more moderate growth for the remainder of the planning period.
Therefore, a conservative high-growth annual growth rate of only 10% annually, compared with 40.6% annually since 2001, was used through 2008. By this time, Cecil Field will have reached the 10-year mark and should be approaching a more “balanced” or
TABLE 3-15 ANNUAL OPERATIONS FORECAST: GENERAL AVIATION
Year OPBA–
Historical OPBA–
FAA National Growth TAF Growth
Short-term High Growth*
Base Years 2004 49,400 17,100 42,303 42,303 42,303
Forecast Years 2009 84,500 29,250 45,828 46,810 62,538 2014 93,600 32,400 49,592 51,732 69,061 2019 105,300 36,450 53,616 57,113 76,204 2024 118,300 40,950 57,919 62,999 84,031
CAGR 4.49% 4.49% 1.58% 2.01% 3.49% Note: CAGR=Compound Average Annual Growth Rate. Source: AVCON, INC., Analysis, 2005.
CECIL FIELD MASTER PLAN UPDATE
CHAPTER 3 FORECASTS 3-18 FINAL
“mature” state. The FAA TAF growth rate, 1.96%, was used to project growth from 2010 to 2024. As shown in Table 3-15, this methodology leads to almost double the annual number of GA operations by the 20-year mark and gives an average annual growth of 3.49% between 2004 and 2024.
3.8.2.7 Selected GA Operations Forecast In selecting the most applicable of these operations projections, various factors were considered, including the most recent annual activity level, the available infrastructure, the positive economic conditions in the area, and the future growth of the adjacent industrial park, Cecil Commerce Center. Therefore, the “Short-term High-Growth” projection, as given in Table 3-15, was selected as the preferred forecast for use in this master plan update.
3.9 AIR CARRIER/AIR TAXI FORECASTS
An aircraft operator must be certified by the FAA to carry passengers and/or cargo on a “for hire” basis. This can occur on a regularly scheduled or as needed basis. Air traffic personnel count activity by these operators in either the “Air Carrier” or “Air Taxi” category. Generally, aircraft with more than 30 seats are reported in ATCT in the Air Carrier classification; all others are reported under Air Taxi operations.
Cecil Field does not have nor is it expected that it would have regularly scheduled passenger service throughout the planning period. However, the airport does experience some limited air carrier and air taxi activities. These activities are mostly related to charter passenger and cargo activity. Additionally, tower personnel have noted some training activity by air carrier users. This section describes the potential increase in these operations related to cargo and other “for hire” activities at Cecil Field.
3.9.1 Air Cargo Activity In previous planning studies related to Cecil Field, the potential for regular cargo activity was considered. Although to date this activity has not yet been realized, it remains a goal of the Aviation Authority to support this activity should the opportunity present itself. Since historical data was not available from which to base activity forecasts, estimations were developed based on the previous forecast and the general characteristics of the surrounding area as well as current national trends in the cargo industry. Brief summaries of the prior forecasts, a synopsis of recent national air cargo trends, and the selected air cargo projections are presented in the following subsections.
3.9.1.1 Previous Forecasts The 1997 Northeast Florida Aviation System Plan and Cecil Field Feasibility Study (Feasibility Study) presented several potential scenarios to project cargo activity as described below:
• Domestic Air/Ground Terminal: This scenario assumed that current JIA shippers would relocate and that JAA would change their policy to support this shift. There is no local support for this option at this time.
• Domestic Mini-hub: This projection assumed the initiation of a mini-hub by one of the major all-cargo carriers, presumed to be DHL because other operators have sufficient activity levels at other Florida airports. This situation is probably no longer realistic given that DHL and ABX merged.
• International Alternative Gateway: This development alternative assumes the initiation of cargo transport activity to/from Europe, Latin America, or the Caribbean. Under this scenario, activities at the port could be coordinated to maximize the profitability of this all-cargo activity.
• Expedited Trucking Hub/Container Freight Station: This option would involve the development of a truck freight center on or adjacent to airport property, but would not involve any air cargo activity.
The 1997 Feasibility Study projected future activity considering national trends at the time. Each forecast also involved the identification of an aircraft fleet mix based upon the projected tonnage. Table 3-16 shows the annual tonnage and operations for the Mini-hub and International Gateway forecasts.
The 1998 MPU also projected all-cargo activity. This previous study took a different approach by assuming that any cargo activity would be related to business activity on airport property and in the adjacent industrial park. Thus, any freight would be to meet the on-time demand of a “niche” market, such as aircraft MRO services. Annual enplaned tonnage was estimated to start at 2,000 tons in 2000 and grow to 10,000 tons by 2020. Table 3-16 shows the values for this master plan’s key study years.
For both of these previous forecasts, operations were estimated by assuming the fleet mix of jet and turboprop aircraft. The enplaned tonnage was distributed based upon the cargo capacity of the aircraft. For example, for the International Gateway projection, all flights were assumed to be on jet aircraft
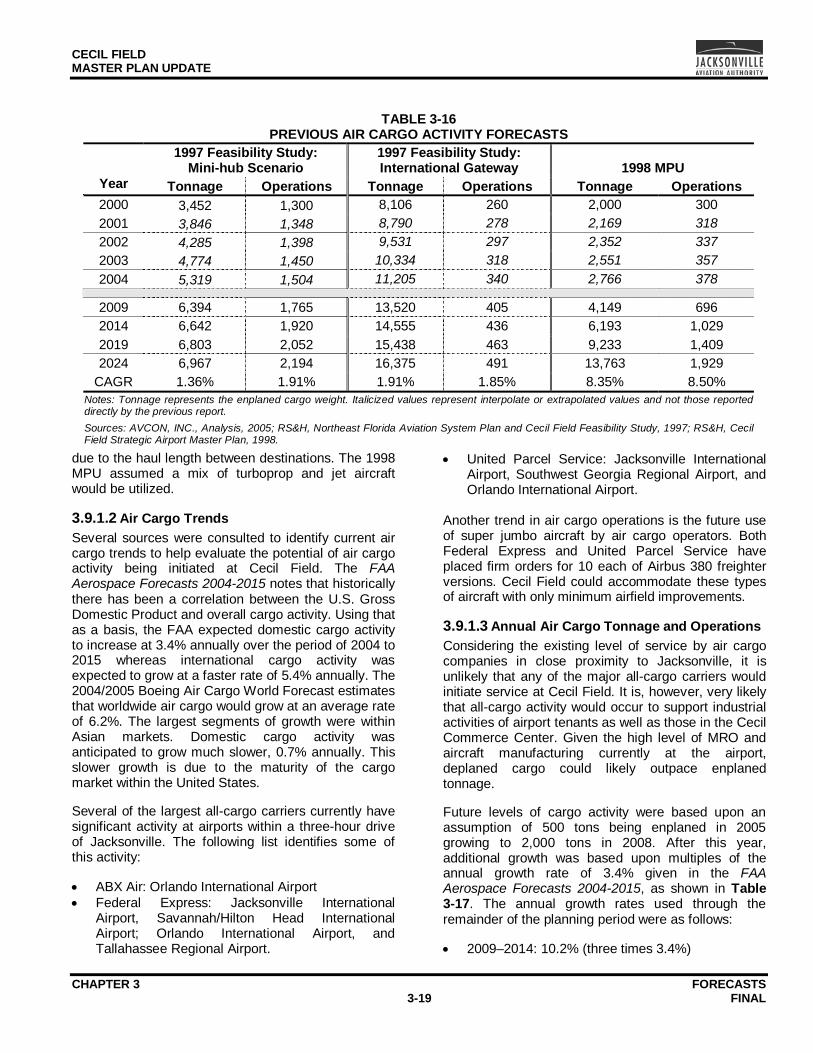
CECIL FIELD MASTER PLAN UPDATE
CHAPTER 3 FORECASTS 3-19 FINAL
TABLE 3-16
PREVIOUS AIR CARGO ACTIVITY FORECASTS 1997 Feasibility Study:
Mini-hub Scenario 1997 Feasibility Study: International Gateway 1998 MPU
Year Tonnage Operations Tonnage Operations Tonnage Operations 2000 3,452 1,300 8,106 260 2,000 300 2001 3,846 1,348 8,790 278 2,169 318 2002 4,285 1,398 9,531 297 2,352 337 2003 4,774 1,450 10,334 318 2,551 357 2004 5,319 1,504 11,205 340 2,766 378
2009 6,394 1,765 13,520 405 4,149 696 2014 6,642 1,920 14,555 436 6,193 1,029 2019 6,803 2,052 15,438 463 9,233 1,409 2024 6,967 2,194 16,375 491 13,763 1,929
CAGR 1.36% 1.91% 1.91% 1.85% 8.35% 8.50% Notes: Tonnage represents the enplaned cargo weight. Italicized values represent interpolate or extrapolated values and not those reported directly by the previous report. Sources: AVCON, INC., Analysis, 2005; RS&H, Northeast Florida Aviation System Plan and Cecil Field Feasibility Study, 1997; RS&H, Cecil Field Strategic Airport Master Plan, 1998.
due to the haul length between destinations. The 1998 MPU assumed a mix of turboprop and jet aircraft would be utilized.
3.9.1.2 Air Cargo Trends Several sources were consulted to identify current air cargo trends to help evaluate the potential of air cargo activity being initiated at Cecil Field. The FAA Aerospace Forecasts 2004-2015 notes that historically there has been a correlation between the U.S. Gross Domestic Product and overall cargo activity. Using that as a basis, the FAA expected domestic cargo activity to increase at 3.4% annually over the period of 2004 to 2015 whereas international cargo activity was expected to grow at a faster rate of 5.4% annually. The 2004/2005 Boeing Air Cargo World Forecast estimates that worldwide air cargo would grow at an average rate of 6.2%. The largest segments of growth were within Asian markets. Domestic cargo activity was anticipated to grow much slower, 0.7% annually. This slower growth is due to the maturity of the cargo market within the United States.
Several of the largest all-cargo carriers currently have significant activity at airports within a three-hour drive of Jacksonville. The following list identifies some of this activity:
• ABX Air: Orlando International Airport • Federal Express: Jacksonville International
Airport, Savannah/Hilton Head International Airport; Orlando International Airport, and Tallahassee Regional Airport.
• United Parcel Service: Jacksonville International Airport, Southwest Georgia Regional Airport, and Orlando International Airport.
Another trend in air cargo operations is the future use of super jumbo aircraft by air cargo operators. Both Federal Express and United Parcel Service have placed firm orders for 10 each of Airbus 380 freighter versions. Cecil Field could accommodate these types of aircraft with only minimum airfield improvements.
3.9.1.3 Annual Air Cargo Tonnage and Operations Considering the existing level of service by air cargo companies in close proximity to Jacksonville, it is unlikely that any of the major all-cargo carriers would initiate service at Cecil Field. It is, however, very likely that all-cargo activity would occur to support industrial activities of airport tenants as well as those in the Cecil Commerce Center. Given the high level of MRO and aircraft manufacturing currently at the airport, deplaned cargo could likely outpace enplaned tonnage.
Future levels of cargo activity were based upon an assumption of 500 tons being enplaned in 2005 growing to 2,000 tons in 2008. After this year, additional growth was based upon multiples of the annual growth rate of 3.4% given in the FAA Aerospace Forecasts 2004-2015, as shown in Table 3-17. The annual growth rates used through the remainder of the planning period were as follows:
• 2009–2014: 10.2% (three times 3.4%)
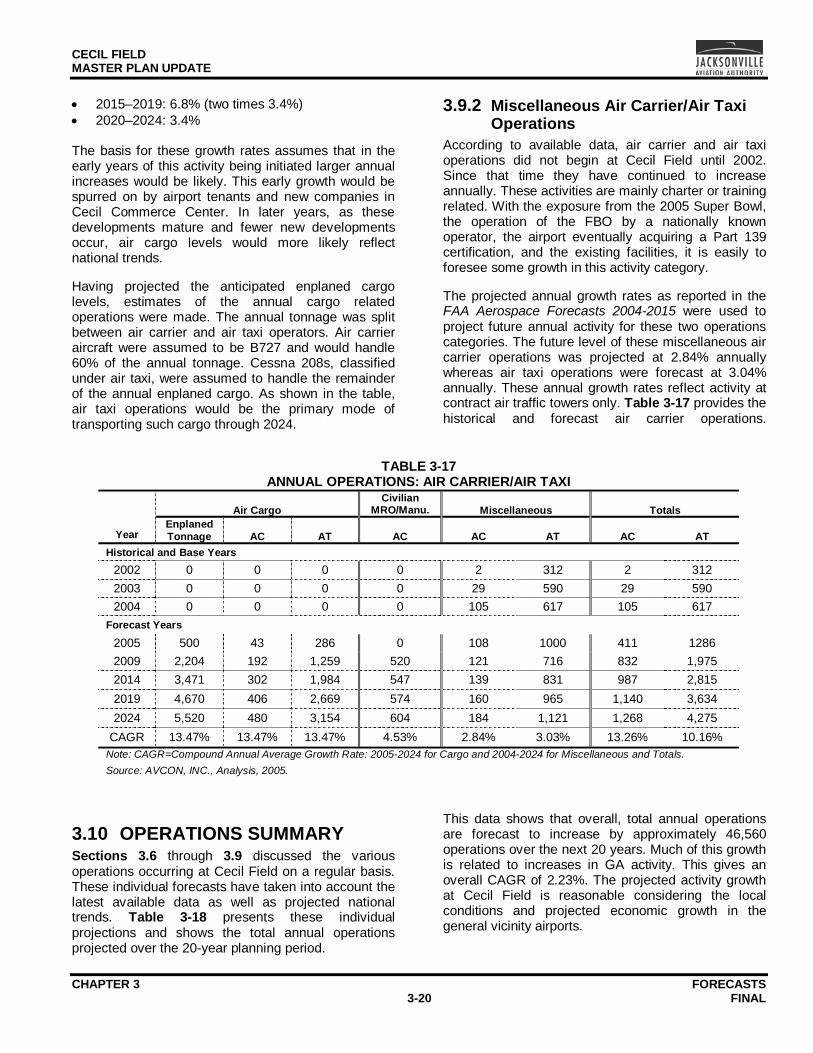
CECIL FIELD MASTER PLAN UPDATE
CHAPTER 3 FORECASTS 3-20 FINAL
• 2015–2019: 6.8% (two times 3.4%) • 2020–2024: 3.4% The basis for these growth rates assumes that in the early years of this activity being initiated larger annual increases would be likely. This early growth would be spurred on by airport tenants and new companies in Cecil Commerce Center. In later years, as these developments mature and fewer new developments occur, air cargo levels would more likely reflect national trends.
Having projected the anticipated enplaned cargo levels, estimates of the annual cargo related operations were made. The annual tonnage was split between air carrier and air taxi operators. Air carrier aircraft were assumed to be B727 and would handle 60% of the annual tonnage. Cessna 208s, classified under air taxi, were assumed to handle the remainder of the annual enplaned cargo. As shown in the table, air taxi operations would be the primary mode of transporting such cargo through 2024.
3.9.2 Miscellaneous Air Carrier/Air Taxi Operations
According to available data, air carrier and air taxi operations did not begin at Cecil Field until 2002. Since that time they have continued to increase annually. These activities are mainly charter or training related. With the exposure from the 2005 Super Bowl, the operation of the FBO by a nationally known operator, the airport eventually acquiring a Part 139 certification, and the existing facilities, it is easily to foresee some growth in this activity category.
The projected annual growth rates as reported in the FAA Aerospace Forecasts 2004-2015 were used to project future annual activity for these two operations categories. The future level of these miscellaneous air carrier operations was projected at 2.84% annually whereas air taxi operations were forecast at 3.04% annually. These annual growth rates reflect activity at contract air traffic towers only. Table 3-17 provides the historical and forecast air carrier operations.
TABLE 3-17
ANNUAL OPERATIONS: AIR CARRIER/AIR TAXI
Air Cargo Civilian
MRO/Manu. Miscellaneous Totals
Year Enplaned Tonnage AC AT AC AC AT AC AT
Historical and Base Years 2002 0 0 0 0 2 312 2 312 2003 0 0 0 0 29 590 29 590 2004 0 0 0 0 105 617 105 617
Forecast Years
2005 500 43 286 0 108 1000 411 1286 2009 2,204 192 1,259 520 121 716 832 1,975 2014 3,471 302 1,984 547 139 831 987 2,815 2019 4,670 406 2,669 574 160 965 1,140 3,634 2024 5,520 480 3,154 604 184 1,121 1,268 4,275
CAGR 13.47% 13.47% 13.47% 4.53% 2.84% 3.03% 13.26% 10.16% Note: CAGR=Compound Annual Average Growth Rate: 2005-2024 for Cargo and 2004-2024 for Miscellaneous and Totals. Source: AVCON, INC., Analysis, 2005.
3.10 OPERATIONS SUMMARY Sections 3.6 through 3.9 discussed the various operations occurring at Cecil Field on a regular basis. These individual forecasts have taken into account the latest available data as well as projected national trends. Table 3-18 presents these individual projections and shows the total annual operations projected over the 20-year planning period.
This data shows that overall, total annual operations are forecast to increase by approximately 46,560 operations over the next 20 years. Much of this growth is related to increases in GA activity. This gives an overall CAGR of 2.23%. The projected activity growth at Cecil Field is reasonable considering the local conditions and projected economic growth in the general vicinity airports.
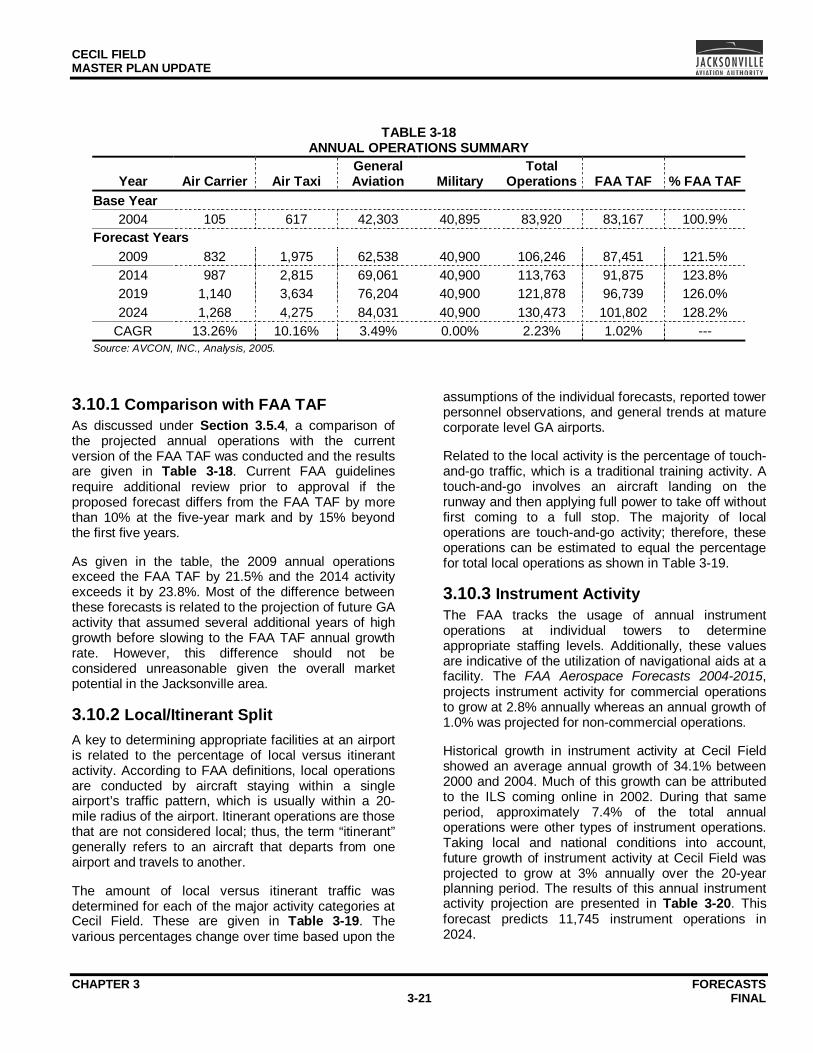
CECIL FIELD MASTER PLAN UPDATE
CHAPTER 3 FORECASTS 3-21 FINAL
3.10.1 Comparison with FAA TAF As discussed under Section 3.5.4, a comparison of the projected annual operations with the current version of the FAA TAF was conducted and the results are given in Table 3-18. Current FAA guidelines require additional review prior to approval if the proposed forecast differs from the FAA TAF by more than 10% at the five-year mark and by 15% beyond the first five years.
As given in the table, the 2009 annual operations exceed the FAA TAF by 21.5% and the 2014 activity exceeds it by 23.8%. Most of the difference between these forecasts is related to the projection of future GA activity that assumed several additional years of high growth before slowing to the FAA TAF annual growth rate. However, this difference should not be considered unreasonable given the overall market potential in the Jacksonville area.
3.10.2 Local/Itinerant Split A key to determining appropriate facilities at an airport is related to the percentage of local versus itinerant activity. According to FAA definitions, local operations are conducted by aircraft staying within a single airport’s traffic pattern, which is usually within a 20-mile radius of the airport. Itinerant operations are those that are not considered local; thus, the term “itinerant” generally refers to an aircraft that departs from one airport and travels to another.
The amount of local versus itinerant traffic was determined for each of the major activity categories at Cecil Field. These are given in Table 3-19. The various percentages change over time based upon the
assumptions of the individual forecasts, reported tower personnel observations, and general trends at mature corporate level GA airports.
Related to the local activity is the percentage of touch-and-go traffic, which is a traditional training activity. A touch-and-go involves an aircraft landing on the runway and then applying full power to take off without first coming to a full stop. The majority of local operations are touch-and-go activity; therefore, these operations can be estimated to equal the percentage for total local operations as shown in Table 3-19.
3.10.3 Instrument Activity The FAA tracks the usage of annual instrument operations at individual towers to determine appropriate staffing levels. Additionally, these values are indicative of the utilization of navigational aids at a facility. The FAA Aerospace Forecasts 2004-2015, projects instrument activity for commercial operations to grow at 2.8% annually whereas an annual growth of 1.0% was projected for non-commercial operations.
Historical growth in instrument activity at Cecil Field showed an average annual growth of 34.1% between 2000 and 2004. Much of this growth can be attributed to the ILS coming online in 2002. During that same period, approximately 7.4% of the total annual operations were other types of instrument operations. Taking local and national conditions into account, future growth of instrument activity at Cecil Field was projected to grow at 3% annually over the 20-year planning period. The results of this annual instrument activity projection are presented in Table 3-20. This forecast predicts 11,745 instrument operations in 2024.
TABLE 3-18
ANNUAL OPERATIONS SUMMARY
Year Air Carrier Air Taxi General Aviation Military
Total Operations FAA TAF % FAA TAF
Base Year 2004 105 617 42,303 40,895 83,920 83,167 100.9%
Forecast Years 2009 832 1,975 62,538 40,900 106,246 87,451 121.5% 2014 987 2,815 69,061 40,900 113,763 91,875 123.8% 2019 1,140 3,634 76,204 40,900 121,878 96,739 126.0% 2024 1,268 4,275 84,031 40,900 130,473 101,802 128.2%
CAGR 13.26% 10.16% 3.49% 0.00% 2.23% 1.02% --- Source: AVCON, INC., Analysis, 2005.
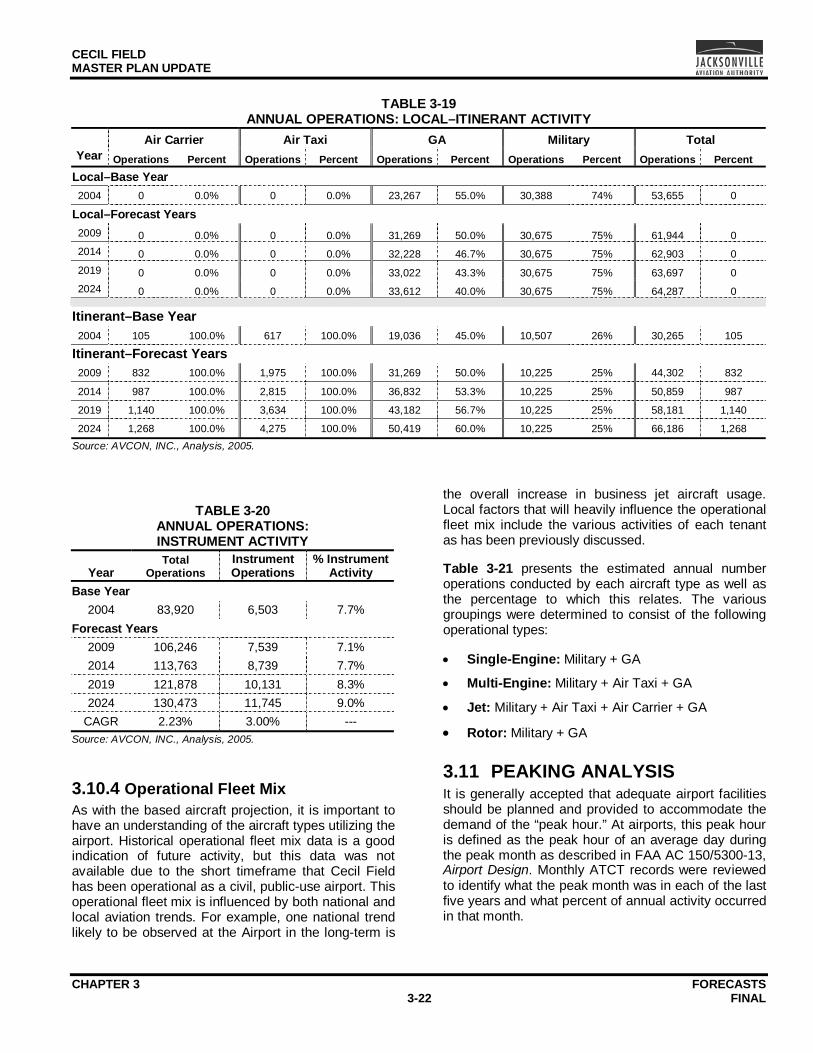
CECIL FIELD MASTER PLAN UPDATE
CHAPTER 3 FORECASTS 3-22 FINAL
TABLE 3-19 ANNUAL OPERATIONS: LOCAL–ITINERANT ACTIVITY
Air Carrier Air Taxi GA Military Total Year Operations Percent Operations Percent Operations Percent Operations Percent Operations Percent
Local–Base Year 2004 0 0.0% 0 0.0% 23,267 55.0% 30,388 74% 53,655 0
Local–Forecast Years 2009 0 0.0% 0 0.0% 31,269 50.0% 30,675 75% 61,944 0 2014 0 0.0% 0 0.0% 32,228 46.7% 30,675 75% 62,903 0 2019 0 0.0% 0 0.0% 33,022 43.3% 30,675 75% 63,697 0 2024 0 0.0% 0 0.0% 33,612 40.0% 30,675 75% 64,287 0
Itinerant–Base Year 2004 105 100.0% 617 100.0% 19,036 45.0% 10,507 26% 30,265 105
Itinerant–Forecast Years 2009 832 100.0% 1,975 100.0% 31,269 50.0% 10,225 25% 44,302 832
2014 987 100.0% 2,815 100.0% 36,832 53.3% 10,225 25% 50,859 987
2019 1,140 100.0% 3,634 100.0% 43,182 56.7% 10,225 25% 58,181 1,140
2024 1,268 100.0% 4,275 100.0% 50,419 60.0% 10,225 25% 66,186 1,268 Source: AVCON, INC., Analysis, 2005.
3.10.4 Operational Fleet Mix As with the based aircraft projection, it is important to have an understanding of the aircraft types utilizing the airport. Historical operational fleet mix data is a good indication of future activity, but this data was not available due to the short timeframe that Cecil Field has been operational as a civil, public-use airport. This operational fleet mix is influenced by both national and local aviation trends. For example, one national trend likely to be observed at the Airport in the long-term is
the overall increase in business jet aircraft usage. Local factors that will heavily influence the operational fleet mix include the various activities of each tenant as has been previously discussed.
Table 3-21 presents the estimated annual number operations conducted by each aircraft type as well as the percentage to which this relates. The various groupings were determined to consist of the following operational types:
• Single-Engine: Military + GA
• Multi-Engine: Military + Air Taxi + GA
• Jet: Military + Air Taxi + Air Carrier + GA
• Rotor: Military + GA
3.11 PEAKING ANALYSIS It is generally accepted that adequate airport facilities should be planned and provided to accommodate the demand of the “peak hour.” At airports, this peak hour is defined as the peak hour of an average day during the peak month as described in FAA AC 150/5300-13, Airport Design. Monthly ATCT records were reviewed to identify what the peak month was in each of the last five years and what percent of annual activity occurred in that month.
TABLE 3-20 ANNUAL OPERATIONS: INSTRUMENT ACTIVITY
Year Total
Operations Instrument Operations
% Instrument Activity
Base Year 2004 83,920 6,503 7.7%
Forecast Years 2009 106,246 7,539 7.1% 2014 113,763 8,739 7.7% 2019 121,878 10,131 8.3% 2024 130,473 11,745 9.0%
CAGR 2.23% 3.00% --- Source: AVCON, INC., Analysis, 2005.
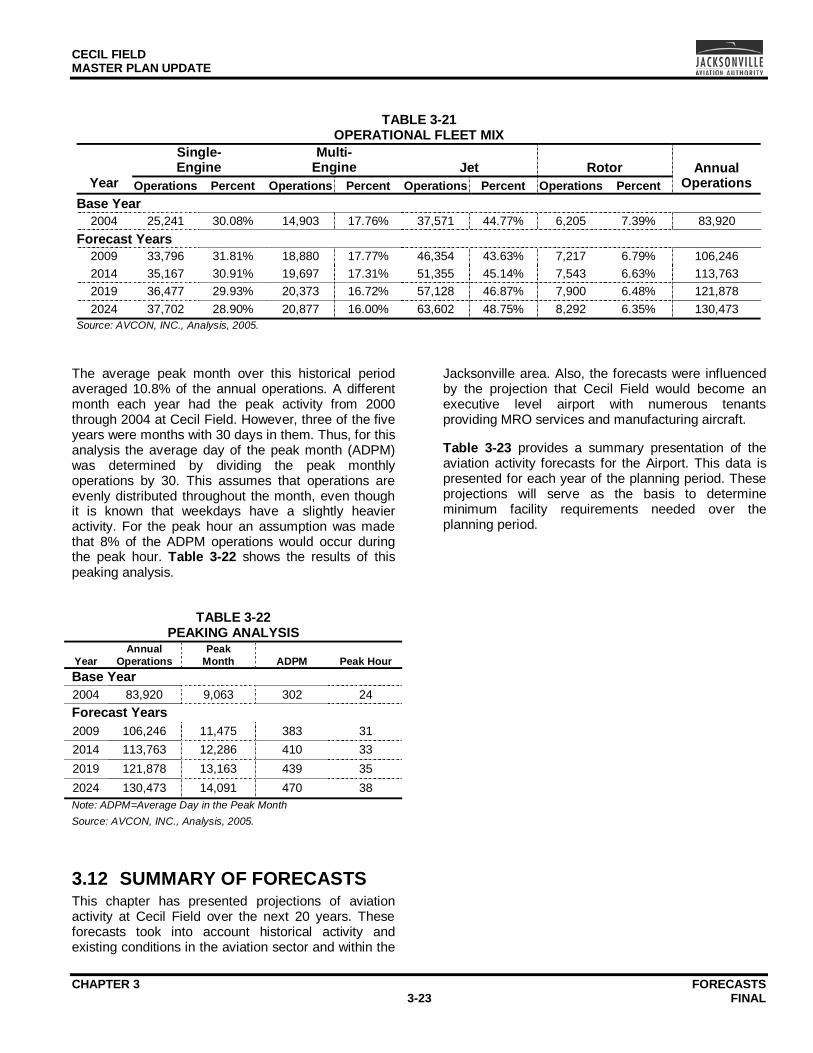
CECIL FIELD MASTER PLAN UPDATE
CHAPTER 3 FORECASTS 3-23 FINAL
TABLE 3-21
OPERATIONAL FLEET MIX Single- Engine
Multi- Engine Jet Rotor
Year Operations Percent Operations Percent Operations Percent Operations Percent Annual
Operations Base Year
2004 25,241 30.08% 14,903 17.76% 37,571 44.77% 6,205 7.39% 83,920 Forecast Years
2009 33,796 31.81% 18,880 17.77% 46,354 43.63% 7,217 6.79% 106,246 2014 35,167 30.91% 19,697 17.31% 51,355 45.14% 7,543 6.63% 113,763 2019 36,477 29.93% 20,373 16.72% 57,128 46.87% 7,900 6.48% 121,878 2024 37,702 28.90% 20,877 16.00% 63,602 48.75% 8,292 6.35% 130,473
Source: AVCON, INC., Analysis, 2005.
The average peak month over this historical period averaged 10.8% of the annual operations. A different month each year had the peak activity from 2000 through 2004 at Cecil Field. However, three of the five years were months with 30 days in them. Thus, for this analysis the average day of the peak month (ADPM) was determined by dividing the peak monthly operations by 30. This assumes that operations are evenly distributed throughout the month, even though it is known that weekdays have a slightly heavier activity. For the peak hour an assumption was made that 8% of the ADPM operations would occur during the peak hour. Table 3-22 shows the results of this peaking analysis.
TABLE 3-22
PEAKING ANALYSIS
Year Annual
Operations Peak
Month ADPM Peak Hour Base Year 2004 83,920 9,063 302 24 Forecast Years 2009 106,246 11,475 383 31 2014 113,763 12,286 410 33 2019 121,878 13,163 439 35 2024 130,473 14,091 470 38 Note: ADPM=Average Day in the Peak Month Source: AVCON, INC., Analysis, 2005.
3.12 SUMMARY OF FORECASTS This chapter has presented projections of aviation activity at Cecil Field over the next 20 years. These forecasts took into account historical activity and existing conditions in the aviation sector and within the
Jacksonville area. Also, the forecasts were influenced by the projection that Cecil Field would become an executive level airport with numerous tenants providing MRO services and manufacturing aircraft.
Table 3-23 provides a summary presentation of the aviation activity forecasts for the Airport. This data is presented for each year of the planning period. These projections will serve as the basis to determine minimum facility requirements needed over the planning period.
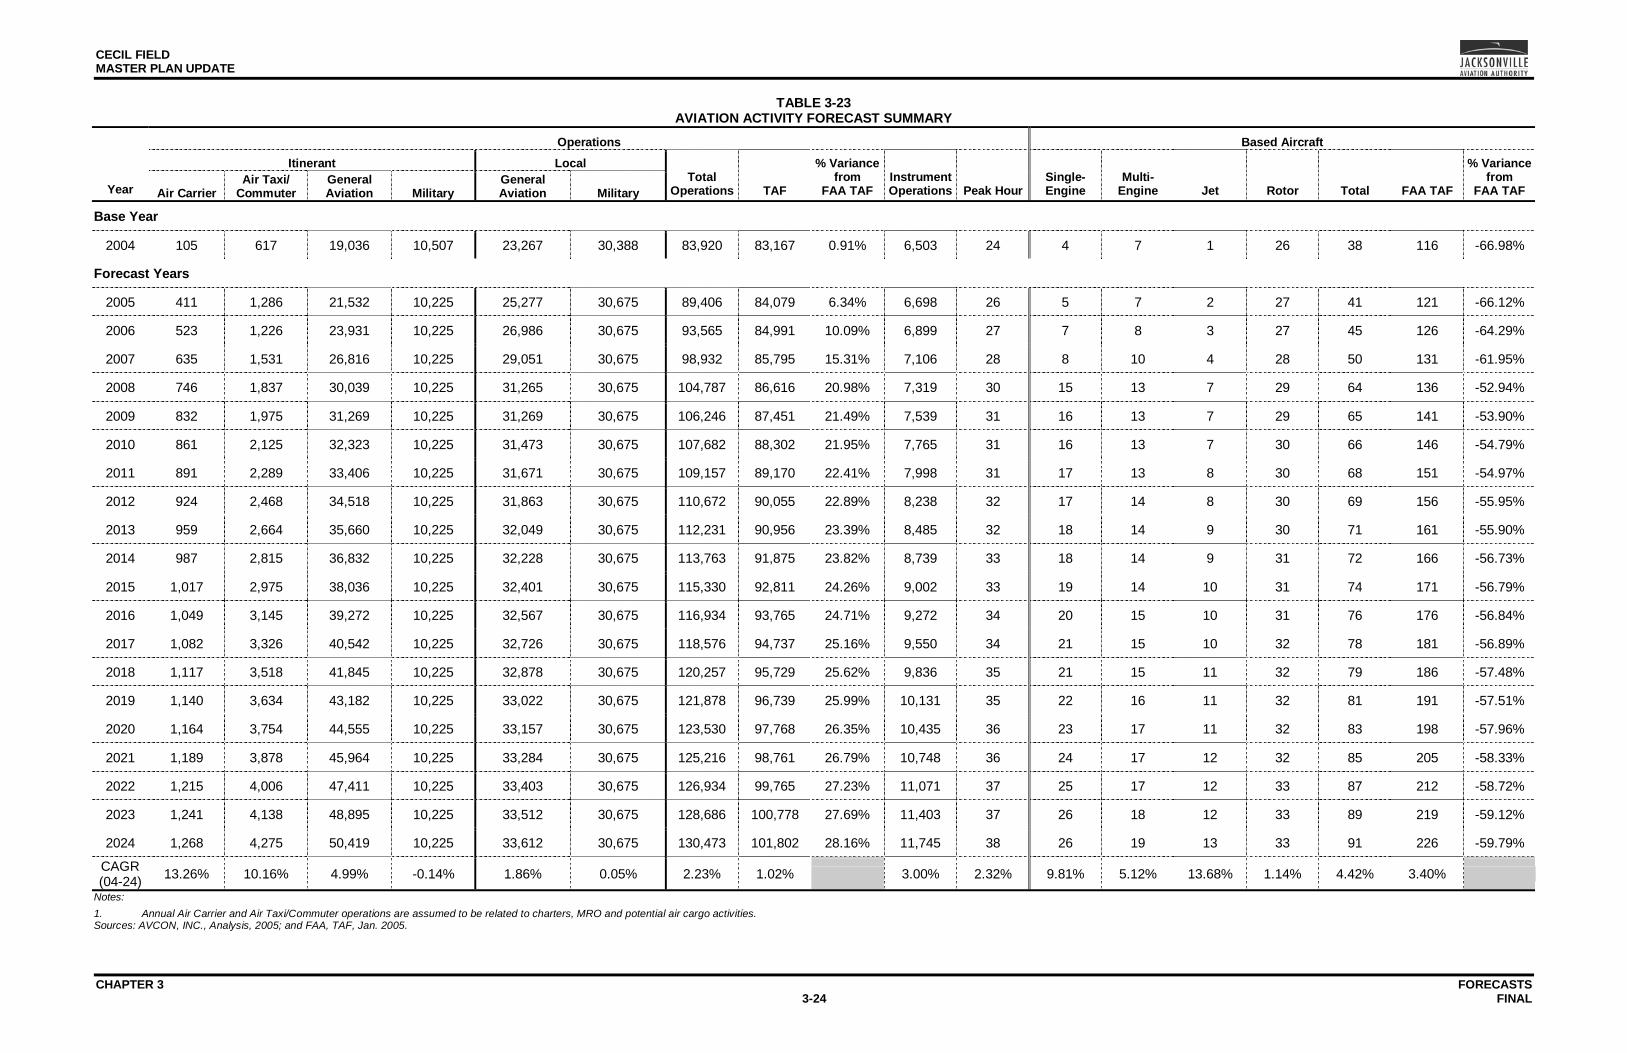
CECIL FIELD MASTER PLAN UPDATE
CHAPTER 3 FORECASTS 3-24 FINAL
TABLE 3-23 AVIATION ACTIVITY FORECAST SUMMARY
Operations Based Aircraft
Itinerant Local
Year Air Carrier Air Taxi/
Commuter General Aviation Military
General Aviation Military
Total Operations TAF
% Variance from
FAA TAF Instrument Operations Peak Hour
Single-Engine
Multi-Engine Jet Rotor Total FAA TAF
% Variance from
FAA TAF
Base Year
2004 105 617 19,036 10,507 23,267 30,388 83,920 83,167 0.91% 6,503 24 4 7 1 26 38 116 -66.98%
Forecast Years
2005 411 1,286 21,532 10,225 25,277 30,675 89,406 84,079 6.34% 6,698 26 5 7 2 27 41 121 -66.12%
2006 523 1,226 23,931 10,225 26,986 30,675 93,565 84,991 10.09% 6,899 27 7 8 3 27 45 126 -64.29%
2007 635 1,531 26,816 10,225 29,051 30,675 98,932 85,795 15.31% 7,106 28 8 10 4 28 50 131 -61.95%
2008 746 1,837 30,039 10,225 31,265 30,675 104,787 86,616 20.98% 7,319 30 15 13 7 29 64 136 -52.94%
2009 832 1,975 31,269 10,225 31,269 30,675 106,246 87,451 21.49% 7,539 31 16 13 7 29 65 141 -53.90%
2010 861 2,125 32,323 10,225 31,473 30,675 107,682 88,302 21.95% 7,765 31 16 13 7 30 66 146 -54.79%
2011 891 2,289 33,406 10,225 31,671 30,675 109,157 89,170 22.41% 7,998 31 17 13 8 30 68 151 -54.97%
2012 924 2,468 34,518 10,225 31,863 30,675 110,672 90,055 22.89% 8,238 32 17 14 8 30 69 156 -55.95%
2013 959 2,664 35,660 10,225 32,049 30,675 112,231 90,956 23.39% 8,485 32 18 14 9 30 71 161 -55.90%
2014 987 2,815 36,832 10,225 32,228 30,675 113,763 91,875 23.82% 8,739 33 18 14 9 31 72 166 -56.73%
2015 1,017 2,975 38,036 10,225 32,401 30,675 115,330 92,811 24.26% 9,002 33 19 14 10 31 74 171 -56.79%
2016 1,049 3,145 39,272 10,225 32,567 30,675 116,934 93,765 24.71% 9,272 34 20 15 10 31 76 176 -56.84%
2017 1,082 3,326 40,542 10,225 32,726 30,675 118,576 94,737 25.16% 9,550 34 21 15 10 32 78 181 -56.89%
2018 1,117 3,518 41,845 10,225 32,878 30,675 120,257 95,729 25.62% 9,836 35 21 15 11 32 79 186 -57.48%
2019 1,140 3,634 43,182 10,225 33,022 30,675 121,878 96,739 25.99% 10,131 35 22 16 11 32 81 191 -57.51%
2020 1,164 3,754 44,555 10,225 33,157 30,675 123,530 97,768 26.35% 10,435 36 23 17 11 32 83 198 -57.96%
2021 1,189 3,878 45,964 10,225 33,284 30,675 125,216 98,761 26.79% 10,748 36 24 17 12 32 85 205 -58.33%
2022 1,215 4,006 47,411 10,225 33,403 30,675 126,934 99,765 27.23% 11,071 37 25 17 12 33 87 212 -58.72%
2023 1,241 4,138 48,895 10,225 33,512 30,675 128,686 100,778 27.69% 11,403 37 26 18 12 33 89 219 -59.12%
2024 1,268 4,275 50,419 10,225 33,612 30,675 130,473 101,802 28.16% 11,745 38 26 19 13 33 91 226 -59.79%
CAGR (04-24) 13.26% 10.16% 4.99% -0.14% 1.86% 0.05% 2.23% 1.02% 3.00% 2.32% 9.81% 5.12% 13.68% 1.14% 4.42% 3.40%
Notes: 1. Annual Air Carrier and Air Taxi/Commuter operations are assumed to be related to charters, MRO and potential air cargo activities. Sources: AVCON, INC., Analysis, 2005; and FAA, TAF, Jan. 2005.