chapter 3 · PDF filechapter 3 chapter 3 Australia’s inflation as a contemporary...
22
chapter 3 111 chapter 3 Australia’s inflation as a contemporary economic issue Australia’s inflation as a contemporary economic issue Interest rate rises can slow the rate of inflation. 3.1 Definition of inflation Inflation is normally seen as an economic illness that attacks our material living stand- ards. It refers to a rise in the general level of prices paid for goods and services over a period of time (usually between one year and the next). We do not talk of inflation simply because the price of one particular thing, such as icy poles, goes up. Instead, it describes a situation where price rises for a wide range of goods and services out- weigh price falls. Hyperinflation is an extreme situation where prices rise very quickly, perhaps by more than 50 per cent a month. By contrast, deflation is a term describing generally falling prices. This too can undermine living standards. Inflation is more likely to occur during a period of strong economic activity, especially when there is a boom. Here, there are widespread shortages of goods and services and the economy is running beyond its productive capacity. By contrast, deflation is normally associ- ated with a severe recession or depression when the level of economic activity is very weak, unemployment is high, and there has generally been overproduction of goods and services. Inflation is not something new. There are numerous examples of inflation stretching back at least to 400 BC during the Roman Empire, Medieval Europe in the 1500s and 1600s, the United States during the 1860s Civil War, Germany in 1923, Hungary in 1945–46. More recently, in Zimbabwe in 2008, inflation rose to 231 million per cent. Inflation refers to a rise in the general level of prices paid for goods and services over a period of time. Hyperinflation is an extreme situation where prices rise very quickly. Deflation is a term describing generally falling prices over a period of time. It can happen in recessions. UNCORRECTED PAGE PROOFS
Transcript of chapter 3 · PDF filechapter 3 chapter 3 Australia’s inflation as a contemporary...

chapter 3
111chapter 3 Australia’s inflation as a contemporary economic issue
australia’s infl ation as a contemporary economic issue
c03Australia’sInfl ationAsAContemporaryEconomicIssue 111 September 4, 2014 12:46 PM
Interest rate rises can slow the rate of infl ation.
3.1 Definition of inflationInfl ation is normally seen as an economic illness that attacks our material living stand-ards. It refers to a rise in the general level of prices paid for goods and services over a period of time (usually between one year and the next). We do not talk of infl ation simply because the price of one particular thing, such as icy poles, goes up. Instead, it describes a situation where price rises for a wide range of goods and services out-weigh price falls. Hyperinfl ation is an extreme situation where prices rise very quickly, perhaps by more than 50 per cent a month. By contrast, defl ation is a term describing generally falling prices. This too can undermine living standards.
Infl ation is more likely to occur during a period of strong economic activity, especially when there is a boom. Here, there are widespread shortages of goods and services and the economy is running beyond its productive capacity. By contrast, defl ation is normally associ-ated with a severe recession or depression when the level of economic activity is very weak, unemployment is high, and there has generally been overproduction of goods and services.
Infl ation is not something new. There are numerous examples of infl ation stretching back at least to 400 BC during the Roman Empire, Medieval Europe in the 1500s and 1600s, the United States during the 1860s Civil War, Germany in 1923, Hungary in 1945–46. More recently, in Zimbabwe in 2008, infl ation rose to 231 million per cent.
Infl ation refers to a rise in the general level of prices paid for goods and services over a period of time.
Hyperinfl ation is an extreme situation where prices rise very quickly.
Defl ation is a term describing generally falling prices over a period of time. It can happen in recessions.U
NC
OR
RE
CTE
D P
AG
E P
RO
OFS

112 economics down under book 1
c03Australia’sInfl ationAsAContemporaryEconomicIssue 112 September 4, 2014 12:46 PM
FIGURE 3.1 Infl ation refers to generally rising prices charged for goods and services, which reduces the purchasing power of money. Hyperinfl ation still exists in some countries. Hyperinfl ation was experienced in Zimbabwe after the productive capacity of the country declined due to civil war and confi scation of white-owned farmland. This Zimbabwe note was worth fi fty trillion dollars. In 2009, Zimbabwe abandoned its currency, instead using currency from other countries.
Here in Australia, the worst instances of infl ation were in:• 1918–19 after World War I• 1950–52 during the Korean War boom• 1973–77 following the fi rst global oil crisis• 1979–83 due to rapid wage rises and other pressures that pushed prices up• 2000–01 when the GST was introduced, oil prices rose sharply and the A$ fell.
Fortunately, for most of the period between the 1990s and 2013–14, Australia’s infl a-tion rate has been relatively slow.
Try applied economic exercise 1, p. 124
Try a report on an investigation 1, p. 126
3.2 Measurement of inflationIn Australia, the ABS calculates the infl ation rate every quarter (i.e. every three months) by means of the consumer price index (CPI). The CPI measures the average change in the retail price of a basket of local and imported goods and services that represent a high proportion of expenditure by metropolitan households.
Features of the CPI as a measure of inflationThe CPI has several important features:• The regimen or basket of goods and services surveyed. Only the important types of
consumer goods and services are actually included in the basket or regimen surveyed by the ABS. This amounts to about 100 000 household items broken down into eleven major categories. These categories include:– food (e.g. fruit and vegetables, meat and other supplies purchased from supermar-
kets and other outlets)– clothing and footwear (e.g. shoes, jeans, tops)– housing (e.g. rental accommodation)– household contents and services (e.g. appliances, furniture, repairs)– transport (e.g. cars, petrol, fares on public transport)– recreation (e.g. sporting events, cinema tickets)– fi nancial and insurance services (e.g. bank fees and charges)– communication (e.g. phone charges, internet costs)– alcohol and tobacco (e.g. beer, wine, spirits)– health (e.g. private health insurance)– education (school fees).
• The prices surveyed. The ABS surveys the prices for the items included in the regimen. It does this at a representative range of retail outlets (e.g. supermarkets, department stores, takeaway food outlets, chemists and providers of services including power, water and gas) located in Australia’s eight capital cities.
• The weighting of items in the regimen. Items that are included in the CPI regimen are weighted according to their relative importance in typical household budgets. The
1 What is meant by the term inflation?
2 How is deflation different from inflation?
3 Give some historical examples of countries experiencing hyperinflation.
The consumer price index (CPI) measures the average change in the retail price of a basket of local and imported consumer goods and services that represent a high proportion of spending by metropolitan households.
The regimen refers to the selection of items making up the ‘basket’ of goods and services included in the CPI.
Weighting of items in the CPI refl ects the relative importance assigned to each particular good or service included in the ‘basket’ or regimen, refl ecting the spending patterns of typical households.
UN
CO
RR
EC
TED
PA
GE
PR
OO
FS

113chapter 3 Australia’s inflation as a contemporary economic issue
c03Australia’sInflationAsAContemporaryEconomicIssue 113 September 4, 2014 12:46 PM
weights reflect the cost of the item and its frequency of purchase. They are also revised, usually every five years, to allow for changes in the pattern of household spending.
• The base year used for comparisons. In order to establish whether the basket of retail prices is generally going up or down over a period of time, a starting or base year is selected against which other years can be compared. The total price of the weighted basket of items in this base year is given a value equal to 100 index points. For Australia, the current base year is 2011–12 (i.e. 2011–12 = 100 index points). Because of inflation, the CPI reached 102.8 points by June 2013 (the fourth quarter of the financial year 2012–13). Put another way, the selected basket of goods and services cost 2.8 per cent more in June 2013 than in the base year of 2011–12. Table 3.1 shows you how to calculate the annual inflation rate using the actual CPI.
FIGURE 3.2 The CPI measures changes in the prices of a representative shopping ‘basket’ of consumer goods and services that is weighted according to the relative importance of items making up the regimen. Items include not just food, but also transport, housing, insurance, health, education, clothing and entertainment.
TablE 3.1 Using the CPI to calculate Australia’s annual inflation rate (June on June)
Year (taken June on June)
CPI (at June each year.
2011–12 = base year = 100 index points) Calculation of Australia’s annual inflation rate (percentage)
2010–11 99.2 N.A.
2011–12 100.4 Annual inflation rate =
Number of index points rise in the CPI for 2011–12 on the level in 2010–11 × 100
CPI in 2010–11
=1.2 × 100
99.2
=120
99.2
= 1.21%
2012–13 102.8 Annual inflation rate =
Number of index points rise in the CPI for 2012–13 on the level in 2011–12 × 100
CPI in 2011–12
=2.4 × 100
100.4
=240
100.4
= 2.3%
Source: Data for the June CPI was derived from ABS 6401.0, Table 1.
The base year for the CPI is the year against which price or cost of the basket of consumer goods and services is compared.
UN
CO
RR
EC
TED
PA
GE
PR
OO
FS

114 economics down under book 1
c03Australia’sInflationAsAContemporaryEconomicIssue 114 September 4, 2014 12:46 PM
limitations of the CPI as a measure of inflationWhile the CPI is a useful indicator of the general direction of changes in retail prices, it does have some weaknesses. For instance:• the regimen or basket does not measure changes in the price of all types of goods and
services in all parts of Australia, only a sample of items in the eight capital cities, thereby ignoring price changes in other cities, towns and rural areas
• the problems caused by the need to alter the regimen as a result of some products in the basket becoming less relevant, new products becoming very popular (for example, computers) and by quality improvements (for example, cars with air bags and ABS brakes) that make goods more expensive, even when there has been no inflation
• the weighting process for each item in the regimen may not necessarily fully reflect the actual tastes or spending patterns of all households. The weighting of items within the regimen only reflects averages.
Try applied economic exercise 2, p. 124
Try analysis of statistical evidence, p. 125
Try a report on an investigation 2, p. 126
3.3 Inflation trends in australia and overseas
One of the Australian government’s key economic aims is to achieve the goal of low inflation (also called stability of the currency). This is defined by the Reserve Bank of Australia (RBA) as a desirable situation where inflation is slow and general prices are rising by an average of around 2–3 per cent a year over the duration of the business cycle. Rates in excess of this government target would undermine various aspects of the economy’s performance (e.g. it could weaken equity in the distribution of income, undermine our international competi-tiveness in trade and ultimately erode our material living standards), while even lower infla-tion than this 2–3 per cent per year target could mean that the rate of economic growth is too slow, resources are lying idle and part of Australia’s productive capacity is being wasted.
General trends in australia’s inflationAlthough Australia’s inflation rate averaged 3.0 per cent a year between 2000–01 and 2013–14, figure 3.3 (below) indicates cyclical variations from year to year.
FIGURE 3.3 Trends in Australia’s inflation rate (annual percentage change in CPI — June on June)
Source: Data derived from ABS 6401.0.
20
00
–01
20
01
–02
20
02
–03
20
03
–04
20
04
–05
20
05
–06
20
06
–07
20
07
–08
20
08
–09
20
09
–10
20
10
–11
20
11
–12
20
12
–13
Year
Changes in Australia’s rate of in�ation (annual percentage change in the CPI,June on June)
Ann
ual p
erce
ntag
e ch
ange
in C
PI
0
1
2
3
4
5
6
72
01
3–1
4
20
14
–15
20
15
–16
6.0
2.9 3.0 2.82.5
4.04.5
2.11.4
1.1
2.3
3.13.5
The government’s (or more precisely, the RBA’s)goal of low in�ation is an average rise in the CPI ofaround 2–3 per cent a year over the economic cycle.
• Inflation strengthened in the late 1990s to peak in an inflationary spike in 2000–01. This corresponded with the introduction of the GST, the depreciation of the A$ and sharply rising oil prices.
• There was moderately slow inflation between 2001–02 and 2004–05, with rates within the RBA’s acceptable inflation goal of 2–3 per cent.
1 What is the consumer price index or CPI?
2 Explain each of the following features of Australia’s CPI:a the regimenb weightingc base year.
3 List and outline three important weaknesses or limitations of the CPI statistics.
4 Hypothetically, if a country’s CPI was equal to 200 index points in 2011–12 and rose to 230 points in 2012–13, calculate the annual percentage rate of inflation, showing your working.
UN
CO
RR
EC
TED
PA
GE
PR
OO
FS

115chapter 3 Australia’s inflation as a contemporary economic issue
c03Australia’sInflationAsAContemporaryEconomicIssue 115 September 4, 2014 12:46 PM
• Between 2005–06 and 2007–08, inflation was generally higher and averaged over 3.5 per cent annually, just above the RBA target. Here, inflationary pressures generally reflected an economy that was operating near its productive capacity.
• More recently since 2008–09, average inflation slowed to 2.8 per cent, due to the ongoing effects of the global financial crisis (GFC) and the ensuing slowdown. The ABS also provides other information about inflation. For instance, it reveals in
which capital city (e.g. Perth or Melbourne) prices rose least and what categories of goods and services (e.g. food or transportation) rose most rapidly.
International comparisons of inflationIt is interesting to make international comparisons of inflation rates, both recently and in the past.
Historical comparisons of inflationSome of the highest daily and monthly rates of inflation recorded in history are shown in table 3.2.
TablE 3.2 Historical examples of high inflation rates in selected countries
Country (and month when inflation was highest)
Highest monthly inflation rate recorded
(percentage)Average daily inflation
rate (percentage)
Average time (hours or days) taken for prices to double
Hungary (July 1946) 1.30 × 10¹⁶ 195.0 15.6 hours
Zimbabwe (November 2008) 79 600 000 000 98.0 24.7 hours
Yugoslavia (January 1994) 313 000 000 64.6 1.4 days
Germany (October 1923) 29 500 20.9 3.7 days
Greece (November 1944) 11 300 17.1 4.5 days
China (May 1949) 4 210 13.4 5.6 days
Source: Data derived from article ‘RIP Zimbabwe Dollar’ by Steve H. Hanke, 5 February 2009, Cato Institute.
Hyperinflation, as shown in these examples, impacts badly on people’s wellbeing and living standards. Imagine what happens to the purchasing power of money and incomes in the space of just a few hours or days. How would you cope? Would money have any use and what would be the alternative? What would happen to living standards?
Recent international comparisons of inflationFortunately, in most countries, inflation is slower and under control. This is shown by figure 3.4 below.
89
94
Australia
USA
Japan
UK
2009–10 2010–11 2011–12(base year)
2012–13 2013–14 2014–15
Indonesia
International comparisons of in�ation (CPI base year is2011–12 = 100 points)
Year
Leve
l of
CP
I (i
ndex
poi
nts)
99
104
109
FIGURE 3.4 International comparisons of the change in inflation using the consumer price index (CPI)
Sources: Data derived from ABS 6401.0 Table 9.
Note: The annual rate of inflation is shown in brackets.
Country 2009–10 2010–11 2011–12 (base year) 2012–13 2013–14 2014–15 2015–16
Australia 95.9 (1.9%) 98.3 (2.5%) 100 (1.7%) 101.4 (1.4%)
USA 94.2 (1.4%) 96.8 (2.8%) 100 (3.4%) 101.5 (1.4%)
Japan 99.9 (−1.9%) 99.9 (0.0%) 100 (0.1%) 99.6 (−0.4%)
UK 90.0 (4.0%) 95 (5.6%) 100 (5.3%) 103.3 (3.3%)
Indonesia 89.6 (3.7%) 95.7 (6.8%) 100 (4.5%) 104.7 (4.7%)
Source: Data derived from ABS, 6401.0, Tables 9 and 10.
UN
CO
RR
EC
TED
PA
GE
PR
OO
FS

116 economics down under book 1
c03Australia’sInflationAsAContemporaryEconomicIssue 116 September 4, 2014 12:46 PM
Notice that the base year or starting level of prices in figure 3.4 is 2011–12. Here, the CPIs in all countries equalled 100 index points. Clearly, Australia has been more successful than Indonesia in keeping inflation down, but has not done as well as the UK or US. As shown, Japan actually experienced a time of deflation (i.e. falling prices in 2012–13 where the CPI even dropped below 100 points on those in the base year, 2011–12), as has occurred in some other countries since the global financial crisis and recession in 2008–09.
As we shall soon see, it is important to maintain low inflation in Australia in order to protect the purchasing power of our incomes, and to strengthen our international competitiveness and trade by helping us keep the prices of our exports of goods and services below those for similar items overseas.
Try a folio of annotated media commentaries, p. 127
Try a class debate, p. 126
3.4 Causes or factors affecting australia’s inflation rate
Figure 3.3 (p. 112) shows that there was considerable variation in Australia’s inflation rate between 2000–01 and 2012–13 due to both domestic (i.e. local within Australia) and international events. Indeed, there are two main types of factor that can affect Australia’s inflation rate.1. Excessively strong demand-side conditions can cause demand inflation.2. Less favourable supply-side developments can cause cost inflation.
Let us take a closer look at these factors.
Strong aggregate demand factors can cause demand inflationDemand-side factors influence the level of AD in the economy. If these become excessively strong, there will be too much spending chasing too few Australian-made goods and ser-
vices. Put another way, AD (i.e. C + I + G + X − M) will run ahead of produc-tive capacity or aggregate supply (AS). When national spending runs ahead of production, widespread shortages of goods and ser-vices will appear as unsold stocks run out because firms cannot access extra resources in order to lift total output. As a result, the general price level will rise. This is called demand inflation. It is typical of a boom situation where the economy is stretched to its limit.
Thinking back to the five-sector circular flow model (see p. 69), strong demand-side factors can
FIGURE 3.5 It is not just important to consider Australia’s inflation rate, but we should also compare our rate against that of overseas countries, since to survive, local businesses need to remain competitive.
1 Define what is meant by the Australian government’s (RBA’s) goal of low inflation.
2 To what extent has Australia actually achieved this goal of low inflation in the last few years?
3 How does Australia’s inflation rate compare with those of overseas countries such as the US and Japan?
4 Why is it important for Australia to achieve a low inflation rate in comparison to overseas?
FIGURE 3.6 Experience has shown that Australia’s inflation rate can accelerate and take off if there are excessively strong levels of aggregate demand, and/or rising production costs and other unfavourable aggregate supply conditions.
Demand-side factors are the influences (e.g. consumer confidence) on the level of spending and economic activity. Changes in these factors might cause demand, and hence inflation, to become stronger or weaker.
Demand inflation occurs in booms when there is too much spending or AD chasing too few goods and services, leading to widespread shortages and hence generally rising prices. Here national spending outstrips production.U
NC
OR
RE
CTE
D P
AG
E P
RO
OFS

117chapter 3 Australia’s inflation as a contemporary economic issue
c03Australia’sInflationAsAContemporaryEconomicIssue 117 September 4, 2014 12:46 PM
cause AD to become excessive (i.e. flow 3) and create demand inflation. This could be the result of the following:• greater consumer confidence about future income and employment causes households
to reduce saving and increase spending• stronger business confidence about rising sales and profits means that firms are keen to
expand, and lift their investment in new plant and equipment• a rapid growth in household income stimulates private consumption spending• good economic conditions among our major trading partners in Asia, North America
and Europe usually means that they purchase more of our exports• relatively low interest rates on credit encourage more household and business bor-
rowing that is used to finance private consumption and investment expenditure• an expansionary budget (i.e. perhaps a budget deficit) involving lower tax rates and
higher government spending that boosts overall expenditure.Australia has often experienced bursts of demand inflation. For instance, demand
inflation occurred during the Korean War boom (early 1950s), the late 1980s, between 2005 and mid-2008 and to a lesser extent, during 2010–11. By contrast, demand infla-tion will gradually disappear if demand-side conditions weaken and there is a period of slower growth in spending (e.g. 2008–09), or perhaps a recession (for example, 1990–93, 2008–09, 2010–11 and 2012–13). This is because the sudden collapse of expenditure and retail sales results in overproduction and rising stocks of unsold goods and services. In order to clear stock and excess output, firms discount or cut prices to attract extra buyers. Demand inflation disappears.
less favourable aggregate supply factors can cause cost inflationEven if there was no demand inflation, prices may still rise due to cost inflation. As illustrated in figure 3.7 below, cost inflation can occur when rising production costs cause firms to put up their final selling prices in order to protect their profit margins.
Original production costs includingwages, interest, taxes, charges,imported and local materials
purchased by �rms
Original pro�t margin before therise in a �rm’s production costs
Pro�t margin is protected because�rms lifted their �nal selling price.
Cost in�ation
Rising production costs due tohigher wages, interest rates, cost of
materials, taxes and governmentcharges, or due to lower ef�ciency,
falling exchange rate or weakermarket competition
Original �nal sellingprice before cost in�ation
New higher �nal sellingprice due to cost in�ation
FIGURE 3.7 How rising production costs cause cost inflation
The most common adverse supply-side factors that cause rising production costs or cost inflation include the following.• Increased wages paid to workers (e.g. following a rise in the minimum wage as in 2013
and 2014 or perhaps under new enterprise wage agreements) add to cost pressures, accelerating inflation
• Reduced labour productivity or efficiency in production (e.g. due to outdated equip-ment, poor work practices, strikes, industrial unrest, lack of motivation, inadequate education or skills, and absence of the ‘work ethic’) adds to cost inflation
• Weak competition between producers of goods and services in a market (e.g. due to price fixing or collusion, tariff protection, existence of monopolies and oligopolies) reduces efficiency and thus adds to cost pressures
• Higher interest rates paid to banks on credit that was borrowed to finance the purchase of new plant and equipment (e.g. 2005–08, 2009–11) increase production costs for firms
Cost inflation occurs when it costs firms more to produce goods and services. Higher production costs in wages or raw materials are often passed onto consumers as higher prices so that businesses can protect their profit margins.
Supply-side factors are influences affecting a firm’s level of efficiency, production costs, profitability and availability of resources. These factors might have either favourable or unfavourable impacts on levels of production and prices.U
NC
OR
RE
CTE
D P
AG
E P
RO
OFS
118 economics down under book 1
c03Australia’sInflationAsAContemporaryEconomicIssue 118 September 4, 2014 12:46 PM
• Rises in government taxes (e.g. com-pany tax, payroll tax on workers’ wages, indirect excise taxes on ciga-rettes for instance) and increased util-ities and other charges (e.g. for water, property rates, superannuation con-tributions on behalf of workers) add to cost inflation pressures
• Increased cost of locally supplied raw materials, equipment and services (e.g. power, telecommunications, transport, banking) make it more expensive to produce goods and services in Australia, adding to cost pressures
• Increased cost of imported raw mate-rials and equipment (e.g. following a weaker exchange rate for the A$ as in mid to late 2008, higher inflation rates overseas) can make local production costs dearer
• Severe climatic conditions (e.g. drought 2004–10 and 2012–14 in Western Queensland, floods 2010–11 and 2013, and fires 2009–10) can cause higher production costs and prices, and limit the production or supply of fruit, vegetables and meat
• Rising oil or energy prices (e.g. due to international conflict and tensions, strong global levels of economic activity) can make the production of goods and services and their transportation dearer, thereby adding to cost inflation pressures (e.g. 2007–08, 2012–13–14).Unlike demand inflation (which can only occur when there is full employment and the
economy is in a boom and extended beyond its productive capacity), elements of cost inflation can occur in any economic situation, even when there is high unemployment. Even so, cost inflation more often occurs in a boom, alongside demand inflation. This is because wages and the cost of other resources rise when there is very low unemployment and no unused productive capacity (e.g. in the boom-like conditions, 2007–08).
In recent years, cost inflation has been kept in check by some favourable supply-side factors including ongoing tariff cuts, reasonable worker productivity, a mostly stronger Australian dollar or exchange rate that makes imports cheaper, the promotion of strong competition in markets to keep prices down, and other microeconomic efficiency poli-cies introduced by the Australian government. In addition, some cost inflation pres-sures temporarily eased following the onset of the global recession in 2008–09 due to slower rises in wages, lower interest rates on borrowed credit and cheaper raw mate-rials. However, since then and during 2010–11 and 2013–14, some costs (e.g. imported goods, oil) have again started to rise.
Try applied economic exercises 3, 4, p. 124
Try essay 1, p. 126
3.5 The importance of avoiding rapid inflation
Inflation affects people differently. Although some individuals benefit, most people suffer when prices rise. The exact effects of high inflation especially depend on how inflation changes your purchasing power or real income (i.e. money income received in the hand after allowing for the effects of rising prices). If your disposable money income rises faster than prices or the inflation rate, you will enjoy greater purchasing power, higher real income and better material living standards. However, if money income rises more slowly than the inflation rate, real income falls along with living standards. Let us take a closer look why it is important for the Australian government to avoid high inflation and achieve a low inflation rate of perhaps around 2 to 3 per cent average rise per year.
1 Giving examples, define aggregate demand-side factors. How might these factors cause Australia’s inflation rate to rise?
2 What is demand inflation?3 Giving examples, define
aggregate supply-side factors. How might these factors cause Australia’s inflation rate to rise?
4 Define cost inflation.
Real income refers to the purchasing power of wages after taking inflation or rising prices into account. Inflation generally lowers our purchasing power or real incomes, and cuts living standards.
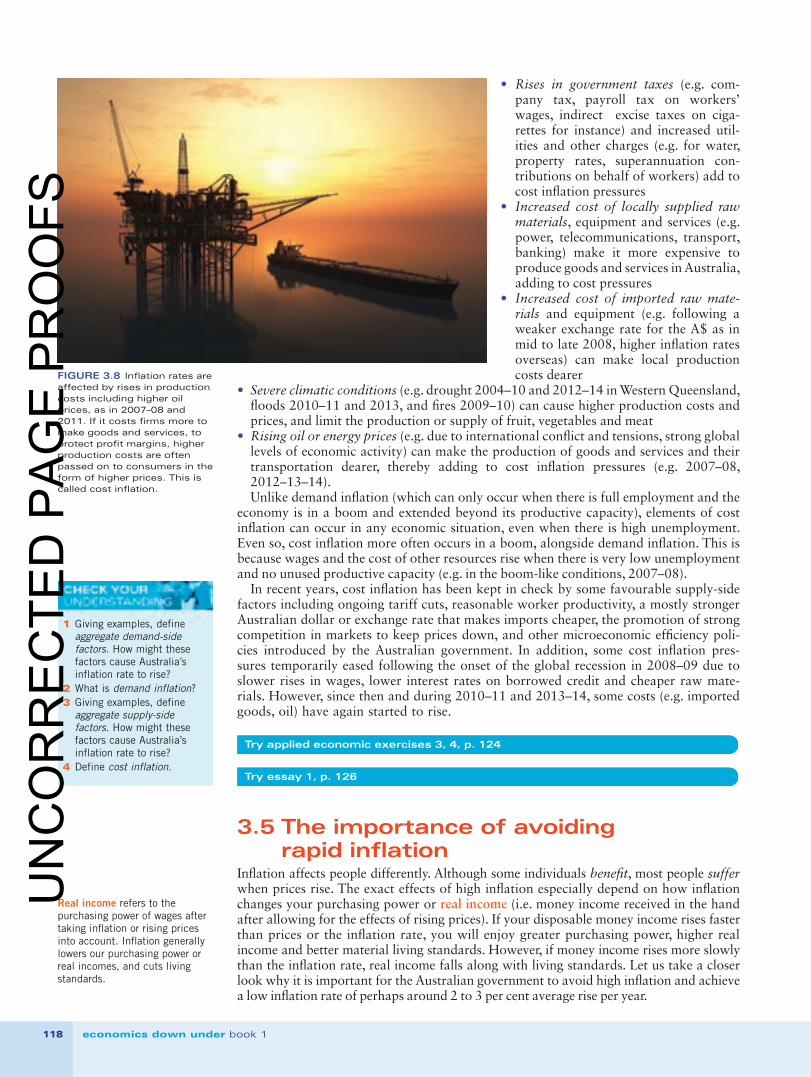
FIGURE 3.8 Inflation rates are affected by rises in production costs including higher oil prices, as in 2007–08 and 2011. If it costs firms more to make goods and services, to protect profit margins, higher production costs are often passed on to consumers in the form of higher prices. This is called cost inflation.
UN
CO
RR
EC
TED
PA
GE
PR
OO
FS

119chapter 3 Australia’s inflation as a contemporary economic issue
c03Australia’sInflationAsAContemporaryEconomicIssue 119 September 4, 2014 12:46 PM
How inflation affects the incomes and purchasing power of individuals and familiesGenerally, most low- and middle-income earners suffer when there is inflation. Their living standards fall. This is because, for many, rises in wages tend to lag behind rises in general prices. This applies to people whose incomes are fixed or fairly stable. Fixed income earners include some retirees who have invested their savings for a fixed term at a relatively low interest rate, members of weak unions who are in a poor bargaining position, workers in depressed industries where profits are low, some exporters who find they can no longer compete and, to an extent, welfare recipients whose cash benefits lag behind rising prices. Their purchasing power and material living standards are often reduced by rising prices. This is especially noticeable when it comes to buying assets, such as a house. Typically, real estate or property prices rise faster than other prices, making it even less affordable for ordinary families. In addition, when there is inflation, rising interest rates on home loans place home ownership out of the reach of many lower- and middle-income families. Overall, it is better for a nation to avoid inflation.
Of course, there are some individuals who actually gain from inflation. Often these people are speculators in shares or property who can make bigger capital gains by buying assets when they are cheap and selling them when they are dearer following price rises. Another group with the ability to protect themselves from inflation due to their bargaining position, are skilled workers in very efficient industries, or those industries dominated by monopolies and protected by high tariffs. Individuals who are members of a strong union operating in key industries may also be able to ensure that their wages and purchasing power keep pace with inflation.
How inflation affects businessesAs mentioned, inflation can have devastating effects on some businesses, eroding Australia’s material living standards. Exporters often find they become less competitive abroad. They have to pay rising production costs due to domestic inflation, yet the prices they are paid by foreign buyers often remain fairly steady. In addition, local import-competing firms can find it difficult to survive and earn good profits. They cannot lift their selling price due to compe-tition from imports, yet rising production costs squeeze their profit margins.
There are three main categories of business that may do better than others during periods of high inflation. 1. Those that import goods and services from low inflation countries find that their sales
are strong (provided that the exchange rate does not fall too much, making imports more expensive).
2. Monopoly firms (i.e. one supplier who is a price maker) selling an essential product where there is weak competition from imports (i.e. due to tariff protection, geo-graphic isolation) find that they can get away with large price rises.
3. Firms involved in shares and property often do well because their businesses boom, thanks to the activities of speculators.
How inflation affects the governmentGovernment budgets or finances can both win and lose from inflation. They gain only because inflation tends to cause their tax revenue to grow faster. For instance, rising prices cause the revenue collected from indirect tax (i.e. taxes representing a certain proportion of the price of most goods or services) to increase. Also, inflation sometimes tends to boost company profits and, thus, firms may need to pay more in company tax. In addition, inflation often causes some people to earn higher incomes moving them into higher tax brackets. This is called bracket creep. This is another way that the gov-ernment can collect more revenue during periods of inflation.
Despite these gains, governments find that inflation usually raises the cost of their budget outlays. Due to inflation, community goods and services purchased by the gov-ernment (e.g. building roads, paying wages to public servants) become more expen-sive. In addition, many welfare benefits are adjusted or indexed so they are directly
FIGURE 3.9 Australia’s CPI inflation rate is affected by changes in the price of many items making up the basket or regimen of goods and services, including housing, fuel, medical, education, food and utility bills. When prices race ahead of the rise in wages, purchasing power is reduced and living standards depressed.
Fixed income earners are those individuals whose incomes (e.g. wages, government welfare benefits, interest from some investments) remain steady and fail to keep up with rising prices so that their purchasing power decreases.
Tax revenue is money collected by the government; for example, from wage and salary earners, companies making profits and from the sale of goods and services. This money is then available to the government to provide services for the community.
Bracket creep occurs when inflation causes a rise in peoples’ incomes that pushes them up into higher tax brackets where they pay a higher tax rate expressed as a percentage of their income.
Outlays are the expenses or costs paid by the government in providing public goods and services, and welfare benefits.
Indexed or indexation refers to the linking of wages or welfare benefits to the rate of inflation so that the purchasing power is maintained when prices rise.
UN
CO
RR
EC
TED
PA
GE
PR
OO
FS

120 economics down under book 1
c03Australia’sInflationAsAContemporaryEconomicIssue 120 September 4, 2014 12:46 PM
linked to the rate of inflation. This means that rising prices tend to increase the cost of some areas of government outlays on welfare.
Demand inflation also causes the government to introduce policies that are designed to put the brakes on economic activity. Strategies such as higher interest rates and increases in tax rates relative to cuts in government outlays are called contractionary policies because they slow AD, GDP and employment. By contrast, different policies are
needed if there is cost inflation. Here the government may use cost-cutting microeconomic efficiency reforms.
Other economic reasons for maintaining a low inflation environmentHigh inflation rates usually damage a nation’s economic performance, ultimately undermining our living standards. There are three reasons for this.1. Inflation tends to slow economic growth and cause
unemployment. Inflation can eventually slow national production and cause unemployment to rise. This is because it can undermine consumer and business confi-dence, eventually weakening private consumption and investment spending, and slowing AD. In turn, when AD slows, GDP and employment are likely to fall. In addition, because inflation often causes interest rates (i.e. the price or cost of credit) to rise, it can slow pri-vate consumption (C) and investment (I) spending or AD, GDP and employment. Again living standards are reduced.
2. Inflation weakens our international trading position. Inflation often weakens our international trade balance (i.e. the difference between the value of exports and the value of imports). It can make our exports more costly and less attractive to overseas buyers. This tends to lower export incomes. At the same time, cheaper imports become relatively more appealing to us here in Australia. The net effect of this is that Australia may end up with a trade deficit (i.e. the value of exports is less than the value of imports) and a weaker currency or exchange rate.
3. Inflation leads to greater income inequality. Inflation can cause income and wealth to be divided or shared more unevenly between individuals than before, since it causes some people to gain and others to lose purchasing power.
Because inflation can cause so much damage to the economy, many economists believe that the goal of low inflation (i.e. keeping price rises to an average RBA target rate of around 2–3 per cent a year) is, perhaps, the most important economic goal for improving material living standards.
Try applied economic exercise 5, p. 125
3.6 australian government policies to help achieve the goal of low inflation
As previously mentioned, one of the federal government’s (or, more precisely, the Reserve Bank’s) most important economic aims is the goal of low inflation because this improves material living standards. Nowadays, this means keeping inflation to an annual average of around 2–3 per cent over the duration of the economic or business cycle.
Let us briefly examine the two main types of government economic policies that may be used to help pursue the goal of low inflation.1. Aggregate demand policies can be used to control demand inflation.2. Aggregate supply policies can be used to control cost inflation.
FIGURE 3.10 Inflation makes living expensive and basic goods and services become less affordable for ordinary people, lowering their living standards. This is one key reason why it is so important to maintain a low inflation environment in Australia.
Trade deficit occurs when the value of a country’s exports is less than the value of its imports, measured over a period of time, such as three months or a year.
1 Clearly explain how high rates of inflation are likely to affect each of the following:a the purchasing power
of different types of individuals and families
b businessesc the levels of government
taxation receipts and government outlays
d the general economyi the rate of economic
growthii the trade balance
iii the distribution of income.
UN
CO
RR
EC
TED
PA
GE
PR
OO
FS

121chapter 3 Australia’s inflation as a contemporary economic issue
c03Australia’sInflationAsAContemporaryEconomicIssue 121 September 4, 2014 12:46 PM
Using aggregate demand policies to slow demand inflationIn cases where demand inflation becomes severe, the federal government might use contractionary monetary and budgetary measures as aggregate demand-side policies to help slow excess levels of spending or aggregate demand (AD).
Contractionary monetary policy involving higher interest rates Monetary policy mainly involves the Reserve Bank of Australia (RBA) changing interest rates as a way of affecting the level of national spending or AD and economic activity. Interest rates are simply what banks pay on savings or charge on credit. Contractionary monetary policy uses higher interest rates to wind back excess spending (such as in 2002–08 and, to a lesser extent, 2009–10), remove shortages of goods and services, and slow demand inflation. In turn, higher credit costs on loans to households and busi-nesses will discourage private consumption (C) and investment (I) spending, thereby slowing AD and economic activity. Furthermore, the attraction of higher interest rates may even encourage people to save more, again slowing spending, reducing widespread shortages of goods and services, and easing demand inflation.
Contractionary budgetary policy involving higher taxes and reduced government outlays Budgetary policy involves annual changes by the treasurer in government receipts (revenue) relative to government outlays (expenses). When there is a switch in direction towards contractionary budget surpluses (e.g. 2002–08 or perhaps 2016–17), these help to slow spending by raising revenue collected from personal and company taxes (i.e. to reduce consumption and investment), and cutting government outlays and purchases. Such measures work to reduce demand inflation by slowing private consumption (C), investment (I), government spending (G) and hence AD. With weaker spending, unsold stocks start to rise, widespread shortages disappear and demand inflation stops.
Using aggregate supply policies to slow cost inflationWhen inflationary pressures are caused by rising production costs, the government must use microeconomic or aggregate supply-side policies. These are cost-cutting, efficiency-promoting measures. They help Australia produce more output from the same or fewer resources or inputs, and might include the following policies.
Reducing tariff protection to help cut production costsCritics of high tariffs claim that they cause business inefficiency by weakening the level of competition from imports. Adopting the idea of free trade and cutting the general rate of tariffs to only 5 per cent since 1996 has forced manufacturing firms to find ways of lowering their production costs through changing the way they organise their operations. Additionally, in 2000, 2005 and 2010, special tariff rates for the car, textile, clothing and footwear industries were reduced, with some further cuts planned for 2015. Lower tariffs encourage firms to accelerate structural change, lift efficiency and reduce their production costs. In addition, the cost of imports of some business equip-ment and materials becomes cheaper, again contributing to lower production costs for many local businesses, allowing them to sell profitably at lower prices. Australian con-sumers then also benefit from cheaper prices.
Reform of the labour market to help cut wage costsSome economics commentators have noted that over the years, Australia’s centralised system for setting minimum wages has led to higher and more rapid rises in labour costs. This caused inflation to be faster than would otherwise occur in a more com-petitive or freer labour market. With this in mind, 1991 saw labour market reforms involving the introduction of enterprise bargaining or workplace agreements negotiated between employees and their boss on a firm-by-firm basis. The process has acceler-ated so that by 2012, over 85 per cent of Australia’s workers were covered by enter-prise agreements. Unfortunately, this change has meant that Australian wage levels have become less uniform (since they are decentralised and set on a firm-by-firm basis). However, the big benefit of these workplace agreements is that wage rises are used as the incentive for workers to lift their productivity or efficiency. As shown by the
Aggregate demand-side policies, including budgetary and monetary policies, are government measures designed to slow or accelerate the levels of spending or aggregate demand and economic activity. They are often applied in a countercyclical way to improve economic stability. For example, policies are used to try to slow spending during an inflationary upswing so the economy does not overheat.
Contractionary monetary policy refers to rises in interest rates set by the RBA designed to help slow AD during an inflationary upswing or boom.
Government receipts are government income from various sources such as taxes. Being a leakage in the economy, these slow AD.
Government outlays are the expenses of the government or how the money raised from taxes is used to pay for welfare, education, defence and health. Being an injection in the economy, these add to AD.
Contractionary budget surplus is when the value of budget tax and other receipts exceeds the value of government budget spending and other outlays. This can be used to help slow AD during an inflationary upswing or boom.
Aggregate supply-side policies are government cost-cutting, efficiency-promoting measures used to slow cost inflation and increase a nation’s productive capacity.
Minimum wages are set by Fair Work Australia and represent the lowest legal level of pay.
Labour costs include wages paid to staff involved in the production of goods and services.
Labour market reforms are government changes to the wage system including the shift towards enterprise agreements. These are designed to help lift worker productivity.
Enterprise bargaining (or workplace agreements) is a system where wages and working conditions are negotiated between employees and their boss on a firm-by-firm basis.
Productivity relates to the level of efficiency or the output gained from a given quantity of inputs of resources including labour.
UN
CO
RR
EC
TED
PA
GE
PR
OO
FS

122 economics down under book 1
c03Australia’sInflationAsAContemporaryEconomicIssue 122 September 4, 2014 12:46 PM
following example, if 2.5 per cent more output is produced per hour worked, modest wage rises of 2 per cent do not add to inflation since labour unit costs of production are actually 0.5 per cent lower. In this case, wage rises are non-inflationary.
Hypothetical example of how greater labour efficiency using performance-based enterprise agreements can mean higher wages and yet lower production costs and inflation.
Annual increase in production per worker per hour (encouraged by offers of higher pay) = 2.5%
Annual rise in the wage paid = 2.0%
Annual change in wage costs per unit produced (as a production cost) = −0.5%
Indeed, as seen between 1992 and 2002, the use of enterprise bargaining seemed to greatly improve Australia’s labour efficiency and check cost inflation. However, during the period 2004–05 and 2010–11, average rises in labour productivity slowed, adding to inflationary pressures at that time.
Encouraging skilled migration to help slow wage costsUnfortunately, wage costs in Australia are generally high and, for many firms, represent around 70 per cent of overall production costs. To some extent, our high labour costs (especially for skilled workers) are the result of shortages or limited supply of labour. Over recent decades, this lack of labour has been caused by two things: our ageing popula-tion (where there is a larger percentage of the population that is retired and in older age groups) and a relatively low birth rate. One way to solve labour shortages fairly quickly is to encourage immigration. Indeed, in recent years to 2014, the federal government’s immigration target has averaged around 190 000 per year, of whom around 70 per cent were regarded as skilled migrants. What this means is that our
labour shortages are reduced and the skills of the labour force increased. Overall, this policy tends to slow wage costs and may help ease inflationary pressures.
Encouraging education and training to lift efficiency and reduce costsSkilled and educated workers are more productive and efficient than those who are unskilled. In turn, higher efficiency or GDP produced per hour worked, helps to lower labour costs and relieve inflationary pressures. With this in mind, recent federal govern-ments to 2013–14 have increased budget outlays on workplace training and education through the schools building program and the ‘education revolution’, increased funding for vocational education and training (VET), and provided financial encouragement for young people to take up apprenticeships and for employers to take on apprentices.
National infrastructure projects to help reduce production costsNational infrastructure involves the construction of important roads, railways, power and water grids, port facilities and communication systems that are used by businesses to help produce other goods and services. In the last five to ten years, the federal government (sometimes in partnership with private firms) has announced many new infrastructure projects including key rail links, national highways and, of course, the National Broad-band Network (NBN). Improved rail and road transport infrastructure will help to lift efficiency, reduce travel times and lower production costs for firms, while the NBN should also help to improve the speed of telecommunications and hopefully reduce cost pressures. By slowing cost pressures, a low inflation environment should be promoted.
Competition policy to lower production costsThere are many monopolies and oligopolies operating in some Australian industries. This means there is only weak competition between firms in the setting of prices. In addition, collusion or price fixing between companies reduces competition and efficiency, and adds to cost inflation. However, concern about this has caused the government to rely on the Australian Competition and Consumer Commission (ACCC) to try to promote greater competition. The Competition and Consumer Act 2010 (Cwlth) makes price fixing and price collusion between firms illegal. Punishments for such practices have been toughened
FIGURE 3.11 Wages are a major production cost for firms. Enterprise bargaining is a government policy that has been used to encourage staff to work harder and increase their level of efficiency or output per hour. This will help to reduce labour costs and ease inflationary pressures.
The immigration target is set by the federal government and involves determining a desirable level of migrants that will be allowed into the country each year in various categories including skilled, family reunification and humanitarian. It is a central feature of our immigration policy.
National infrastructure involves the provision of important roads, railways, power and water grids, port facilities and communication systems that are used by businesses to help produce other goods and services. It involves investment spending, usually by governments, but sometimes in partnership with private firms.
Price fixing refers to illegal collusion between supposedly rival firms, often involving strategies that increase prices above normal levels.
UN
CO
RR
EC
TED
PA
GE
PR
OO
FS

123chapter 3 Australia’s inflation as a contemporary economic issue
c03Australia’sInflationAsAContemporaryEconomicIssue 123 September 4, 2014 12:46 PM
and a close watch is kept on price rises in industries where competition is weak, through price surveillance. Company takeovers and mergers are also closely monitored to ensure that they do not limit rivalry between firms. Fiercer competition between businesses (such as pure competition, referred to on p. 18 of chapter 1) should check greed and help to reduce the prices charged by sellers of goods and services.
Reducing the rate of company tax to help lower production costsTaxes are a production cost for business and cause firms to charge more for their prod-ucts than would otherwise be the case. Prior to microeconomic reforms in the early 2000s, company tax rates were set at a high 36 per cent on every dollar of profit. Such rates added to cost inflation. However, following reforms in 2000–02, the government cut company tax to 30 per cent. Furthermore, in 2009–10, the Henry review of taxa-tion pointed out that the average rate of company tax in major OECD nations was around 28 per cent. With this in mind, the Australian government announced further tax reform involving cutting the rate of company tax for small businesses from 30 to 29 per cent. Unfortunately, this has not yet been implemented. During the 2013 elec-tion, Mr. Abbott announced that he would cut the rate to 28.5 per cent from July 2015. However, although not yet implemented, lower tax rates should lead to better after-tax profits, allowing firms to sell their goods and services more cheaply, easing inflationary pressures and helping to help make local firms even more competitive internationally.
Summary of policies to help slow inflationary pressuresThe federal government’s economic policies that are used to help slow demand and cost inflation are summarised in figure 3.12 below.
Contractionarymonetarypolicy involveshigher RBAinterest ratesto slowspending.
Contractionarybudgetarypolicy involvestax risesand lessgovernmentspending.
Reducedprotectionandlower tariffsstimulatecompetitionandef�ciency.
Government policies to promote the goal of low in�ation
(i.e. the Australian Government, through the RBA, tries to keep the average in�ation rate to around 2–3 per centover the duration of the economic cycle, since this is bene�cial for living standards).
Deregulate thelabour market–promotegreatercompetitionand ef�ciencyand keep wagecosts down.
Tax reform–lower companytax rates to cutbusiness costs,lift after-taxpro�ts andincreaseinvestment innew equipmentshould helplower costin�ation.
Encouragingimmigrationhelps easelabourshortagesand slowswage costs.
Competitionpolicy helpsto keeppricesdown byreducingcollusionbetweenrival �rms.
Nationalinfrastructure,projects helpcut productioncosts throughincreasedef�ciency.
Encouragingeducationand traininghelps liftworkerproductivityand slowcostpressures.
Contractionary macroeconomic or aggregatedemand-side policies to control demand in�ation
These policies try to reduce excess AD so that there areno longer widespread shortages of goods and services.
These policies try to reduce production costs, lift ef�ciency andgrow the economy’s productive capacity or aggregate supply.
Microeconomic ef�ciency reforms or aggregatesupply policies to control cost in�ation
FIGURE 3.12 Some Australian government policies to help lower inflation
• Try the multiple-choice test, pp. 122–3
• Try the terminology revision, p. 123
• Try applied economic exercise 6, p. 125
• Try essay 2, p. 126
• Try the economic simulation activity, p. 126
1 What are the two main branches of government economic policies that may be used to help slow the rate of inflation?
2 Explain how each of the following government economic policies might be used to slow rising demand inflation.a Monetary policyb Budgetary policy
3 Explain how any three of the following government aggregate supply policies might be used to slow cost inflation.a Tariff reductionsb Tax reformc Deregulation of the labour
marketd Deregulation of the
financial markete Reform of government
enterprises
Tax reform involves cutting the rate of various taxes to help increase the incentive to work hard, invest and expand business. This should lift efficiency and ease cost pressures.
UN
CO
RR
EC
TED
PA
GE
PR
OO
FS

SCHOOL ASSESSMENT TASKS AND LEARNING ACTIVITIES
124 economics down under book 1
c03Australia’sInfl ationAsAContemporaryEconomicIssue 124 September 4, 2014 12:46 PM
In order to satisfactorily complete VCE Economics Unit 1, Part 2, the teacher must decide whether the student has demonstrated the general achievement of the set of outcomes specifi ed for the unit, including key knowledge and key skills for outcome 2. The teacher’s decision should refl ect results from a selection of school-based assessment tasks. Generally, this assessment should take place as part of the normal teaching and learning program. In addition, most assessment will be completed in class under a limited time frame. With this in mind, teachers may select from an appropriate range of tasks provided on the following pages.
Multiple-choice test questions
Using the multiple-choice answer grid below, select the letter (A, B, C, D) that represents the most appropriate answer for each question by marking it with a tick (✓).
Answer grid
Question A B C D
1
2
3
4
5
6
7
8
9
10
11
12
13
14
15
16
Question 1Concerning infl ation, which statement is correct?A Infl ation is said to occur when the price of a particular good or
service goes up.B Infl ation is said to occur only if the prices of all goods and
services rise.C Infl ation is said to occur when most prices of goods and services
rise in a representative sample or basket.D Infl ation occurs when there is a widespread surplus of goods and
services.
Question 2Which of the following best defi nes the consumer price index (CPI)?A An index that measures changes in the price of all goods and
services purchased by households over a period of timeB An index that measures the price change of exported goods and
services against importsC An index that measures the average change in the prices of a
weighted and representative sample of locally-made goods and services purchased by households
D An index that measures the average change in a weighted and representative sample of locally-made and foreignmade goods and services purchased by metropolitan households, measured over a period of time
Question 3Regarding the data shown in table 3.3 about Australia’s infl ation rate for 2010–11, 2011–12 and 2012–13 as measured by the CPI, which statement is most correct? You may use a calculator if you wish.
TablE 3.3 Changes in Australia’s CPI
Year 2010–11 2011–12 2012–13
Annual CPI (2011–12 = 100 index points)
97.7 100.0 102.3
Source: Data derived from ABS 6401.0, Table 1.
A In 2011–12, the CPI rose by around 3.2 per cent.B In 2012–13, the CPI rose by around 2.3 per cent.C Since 1989–90, the CPI rose by 102.3 per cent.D The annual CPI rise for 2012–13 cannot be calculated from the
above data.
Question 4Which of the following is not the title of one of the 11 major categories of item in the CPI regimen?A FoodB RecreationC TransportationD Cost of holidays
Question 5Concerning the CPI, which statement is false?A Items that are important or frequently purchased are weighted
more heavily in the index.B The CPI in the base year is always equal to 100 index
points.C If the CPI was 110 points in one year and 120 the next year,
then the CPI rose by exactly 10 per cent.D The ABS surveys consumer prices at a representative range of
retail outlets in capital cities.
Question 6Examine the CPI data in table 3.4 (below) by capital city for 2011–12 (the base year) and 2012–13, before answering the question.
TablE 3.4 CPI changes by Australian capital city
Year Sydney Melbourne Brisbane Adelaide Perth Hobart Canberra DarwinAverage
(8 capitals)
2011–12 100.0 100.0 100.0 100.0 100.0 100.0 100.0 100.0 100.0
2012–13 102.6 102.2 102.0 102.1 102.2 101.2 101.9 103.1 102.3
Source: Data derived from ABS 6401.0, Table 1.
UN
CO
RR
EC
TED
PA
GE
PR
OO
FS

SCHOOL ASSESSMENT TASKS AND LEARNING ACTIVITIES
125chapter 3 Australia’s inflation as a contemporary economic issue
c03Australia’sInfl ationAsAContemporaryEconomicIssue 125 September 4, 2014 12:46 PM
Concerning the data, which statement is false?A Over the period, general consumer prices went up fastest in
Darwin.B Over the period, general consumer prices went up least in
Hobart.C Over the period, prices in Canberra went up faster than for the
average of the eight capital cities.D Over the period, Melbourne’s infl ation rate was 2.2 per cent.
Question 7Which of the following is not a limitation to the accuracy of the CPI as a measure of infl ation?A Not all prices and items purchased by households are included
and measured in the regimen.B The weights assigned to particular items may not be
representative of the importance of specifi c items for some households.
C Only the prices of locally-made goods and services are measured and the price changes of foreign goods are excluded.
D Increases and decreases in the quality of included items in the regimen may not always be refl ected by changes in prices.
Question 8From your knowledge, which statement about Australia’s infl ation rate over the past 10 or so years is incorrect?A Infl ation was fastest when employment was lowest.B Infl ation slowed in the near recession of 2008–09 following the
GFC.C Infl ation was within the government’s goal for low infl ation in
most years.D Infl ation tended to rise and fall with the level of economic
activity in Australia.
Question 9Concerning demand infl ation, which of the following is generally false?A Demand infl ation cannot occur in a recession.B Demand infl ation rises quickly, even when the economy has
unemployment and unused productive capacity.C Demand infl ation is a sign that there are general shortages of
goods and services caused by too much spending on too few locally-made goods and services.
D Demand infl ation may be caused by excessively strong demand-side conditions.
Question 10Which of the following would tend to have an effect on the level of demand infl ation that is different from that of the other three factors?A Consumer confi dence falls.B Incomes of households rise.C The government lifts personal tax rates.D There is a recession overseas among our major trading partners,
the United States and Japan.
Question 11Concerning cost infl ation, which statement is false?A Cost infl ation can occur either during booms or recessions.B Cost infl ation results from rising production costs that force fi rms
to lift prices to avoid a drop in profi ts.C Higher interest rates and dearer imports will not cause cost
infl ation.D Cost infl ation is worsened by increased ineffi ciency in production
and reduced worker productivity.
Question 12Which of the following statements has an effect on the rate of cost infl ation that is different from the other three factors?A Worker productivity falls and wages remain steady.B Tariffs are reduced to promote greater competition in local
markets for goods.C The government cuts the rate of company tax.D Higher savings result in lower interest rates for bank credit lent
to business fi rms.
Question 13Which statement is most correct? Infl ation will not normally be worsened by:A rises in wages equal to 10 per cent when worker productivity
rises at 12 per cent over the same period.B cuts in personal tax.C a fall or depreciation in the exchange rate for the A$ against the
US$.D stopping government supply-side policies or microeconomic
reforms.
Question 14Who would normally be hurt least by rapid infl ation in Australia?A Exporters selling swimwear in the United StatesB Importers buying cars from South KoreaC Retired people on fi xed incomes gained from their investments
and savingsD Workers in industries where effi ciency and profi t margins are lowest
Question 15Which of the following government economic policies would not help to lower demand infl ation?A Rises in interest rates by the RBAB Reductions in the rates of personal income taxC Lower tariffs on importsD Government encouragement of national savings and
superannuation contributions by workers for their retirement
Question 16Which of the following would not help lower cost infl ation in Australia?A Encouragement of enterprise bargaining and further labour
market reformsB Higher rates of company taxC Strengthening the powers of the ACCC to help promote greater
competition between fi rms in the setting of pricesD Allowing more foreign banks to compete in the fi nancial sector to
depress interest rates on credit lent to fi rms for expansion and the purchase of new equipment
Terminology revision
Briefl y and accurately write out defi nitions for each of the terms listed in table 3.5.ORWhy not try to construct your own crossword, word search or another puzzle, using terminology and facts relevant to income distribution?
TablE 3.5 Economics terms used in chapter 3
Australian Competition and Consumer Commission (ACCC)
enterprise bargaining or workplace agreements
macroeconomic or aggregate demand policies
base year fi nancial market deregulation
microeconomic or aggregate supply policies
consumer price index (CPI)
fi xed income earner price fi xing
cost infl ation goal of low infl ation purchasing power
costs of production hyperinfl ation real income
competition policy infl ation regimen
contractionary budgetary policy
immigration tariff
contractionary monetary policy
infrastructure tax reform
defl ation labour productivity weighting
demand infl ation labour market reforms
WeblinksUse the crossword weblink to help you create your puzzle.
UN
CO
RR
EC
TED
PA
GE
PR
OO
FS

SCHOOL ASSESSMENT TASKS AND LEARNING ACTIVITIES
126 economics down under book 1
c03Australia’sInfl ationAsAContemporaryEconomicIssue 126 September 4, 2014 12:46 PM
Applied economic exercises
Question 1A Explain the difference between infl ation and defl ation.B What is hyperinfl ation? Giving examples, explain how it would
affect material living standards.
Question 2A Complete the defi nitional sentence — the consumer price index
(CPI) measures . . .B Why are the price changes of some goods and services not
measured in the CPI?C Why are items making up the CPI basket weighted? Examine table 3.6 below showing the Australian CPI data for the annual percentage change by category, before attempting the questions that follow.D Which three of the 11 item categories contributed most to
Australia’s level of infl ation between 2007–08 and 2012–13? Explain.
E Which of the 11 categories of item helped to keep Australia’s overall infl ation rate lower between 2007–08 and 2013–14? Explain.
Question 3A Explain two important differences between demand infl ation and
cost infl ation.B How might very optimistic levels of consumer and business
confi dence in Australia cause infl ation to increase under certain economic conditions?
C If wages rise without at least an equal increase in worker productivity or effi ciency, why might this accelerate infl ation?
D Why might weak levels of competition from imports and the existence of local monopolies and oligopolies in industry cause infl ation to be higher than otherwise?
Question 4For each of the events listed in table 3.7, explain the likely effect on the level of infl ation, noting the type of infl ation that is affected by the event.
TablE 3.6 Annual percentage change in prices for the eleven categories of items making up Australia’s CPI
Year
Food & non-
alcoholic beverages
(%)
Clothing and
footwear (%)
Housing (%)
Furnishings, household equipment & services
(%)Transportation
(%)
Tobacco and
alcohol (%)
Health (%)
Education (%)
Recreation (%)
Communication (%)
Financial and
insurance (%)
All groups
(%)
2007–08
3.1 0.8 5.2 −1 4.6 3.8 4.5 4.2 1.4 0.4 6.2 3.4
2008–09
4.9 0.8 6 1.4 −0.9 5.5 5.1 4.9 1 0.7 2 3.1
2009–10
1.6 −0.3 5.8 2.3 0.7 4.9 4.8 5.6 0.4 0.3 −2.1 2.4
2010–11
3.7 −2 4.9 −0.1 2.2 9.8 4.7 5.8 −1.1 −0.1 3.2 3.1
2011–12
0.7 1.4 3.7 0.3 3.2 3.4 3.7 5.9 −0.5 1.1 4.2 2.4
2012–13
0.5 −0.5 4.9 0.8 1.1 3.9 6.9 5.9 −0.9 1.7 2.8 2.3
2013–14
2014–15
Source: Data derived from ABS, 6401.0 (table 4).
TablE 3.7 Events affecting Australia’s infl ation rate
Event affecting Australia’s infl ation rate Explanation of the effect of the event on infl ation
1. Low paid workers succeed in gaining a 4 per cent rise in minimum wage.
2. Oil prices more than double between their lowest point during the global recession, and early 2014.
3. The economy has full employment (around 4.5 to 5 per cent unemployment) and households get a tax cut (e.g. 2007–08).
4. Consumer confi dence collapses in the US, Japan and Europe (e.g. as in 2008–09–10–11).
5. The government continues to cut tariffs on cars and clothing (e.g. proposed for 2015).
6. There is a boom in China, dramatically lifting our exports when our unemployment rate reached monthly lows of 4.9 per cent (e.g. 2010–11).
7. The exchange rate for the A$ fell 16 per cent against the US$ (e.g. February 2013 and 2014).
8. Interest rates charged on bank loans to business rise from 8.8 to 10.7 per cent per annum (e.g. 2008–09 and mid-2011).
9. Local councils increase their property rates for businesses by 20 per cent.
10. There is a fall in the number of industries operating in markets controlled by oligopolies and monopolies.
UN
CO
RR
EC
TED
PA
GE
PR
OO
FS

SCHOOL ASSESSMENT TASKS AND LEARNING ACTIVITIES
127chapter 3 Australia’s inflation as a contemporary economic issue
c03Australia’sInfl ationAsAContemporaryEconomicIssue 127 September 4, 2014 12:46 PM
TablE 3.9 The effects of Australian government economic policies on the infl ation rate
Australian government economic policy
Explanation of how the policy is likely to affect infl ation
1. The federal government reduces the growth of government spending in the budget (e.g. 2010–14).
2. The RBA lifts interest rates from 4.25 to 7.25 per cent per annum (e.g. 2002–08).
3. The rate of company tax is cut from 30 to 28.5 per cent (e.g. originally proposed for July 2015).
4. The government encourages household saving through rises in compulsory superannuation and tax concessions for savers (e.g. 1992–2014).
5. Enterprise bargaining is encouraged, where wages rise only occur if there are increases in worker effi ciency (e.g. 1991–2014).
6. Tax concessions are available for fi rms who invest in new plant and equipment and who undertake R&D (e.g. 2000–14).
7. The government introduces a 10 per cent GST on the sale of most goods and services (e.g. July 2000).
8. The government deregulates the fi nancial sector and encourages foreign banks to operate and compete in Australia (e.g. especially 1982–99).
9. The government cuts the rates of personal income tax for some individuals (e.g. July 2007, 2009, 2010, 2012).
10. The government further reduces tariffs on imports (e.g. proposed for textiles in 2015).
Analysis of statistical evidence
Examine table 3.10 below showing the CPI for four countries, including Australia.A Which country had the most rapid infl ation rate over the period
2009–10 to 2012–13? Which country kept infl ation lowest over the period 2009–10 to 2012–13?
B Calculate the average annual infl ation rate (percentage) for each country for the period 2010–11 to 2012–13.
C Suggest two important economic theoretical reasons why the infl ation rates for countries differ.
Question 5Explain the effects on the purchasing power of incomes (and material living standards) for each of the individuals listed in table 3.8, if there was a 5 per cent annual infl ation rate in Australia, compared with a rate of only 2 per cent overseas.
TablE 3.8 How infl ation affects the purchasing power of different individuals
Individuals
Explanation of the effects of infl ation on the individual
1. Dave earns most of his income as an exporter, selling 90 per cent of his wool overseas in Japan and China.
2. Georgia runs a fashion boutique that sells imported skirts and swimwear.
3. Ho Chi and Jill are just married and borrow $200 000 to buy their fi rst home.
4. Dian works in the local textile mill making skirts for the local market.
5. Darrel runs an international tourist hotel in Surfers Paradise, Queensland.
6. Tan lent Alison $1000 interest free for one month in order for her to pay the rent.
7. Michelle and Ringo have four young children, are unemployed and on government welfare benefi ts.
8. Jenny’s occupations include real estate, antiques and share trading.
9. John is 80 years old and retired, but not eligible for the age pension because of his $590 000 in assets.
10. Belinda, a taxpayer, recently received a 10 per cent pay rise for the year.
Question 6A Defi ne what is meant by the government’s economic goal of low
infl ation.B In general terms, explain clearly how the government may use its
various policies to help slow demand and cost infl ation.C Explain how the government policies listed in table 3.9 are likely
to affect Australia’s infl ation rate, noting whether they are more successful in slowing demand infl ation or cost infl ation.
TablE 3.10 Infl ation in different countries (CPI)
Country 2009–10 2010–112011–12 (base year) 2012–13 2013–14 2014–15
Australia 95.9 98.3 100 101.4
USA 94.2 96.8 100 101.5
Japan 99.9 99.9 100 99.6
UK 90 95 100 103.3
Indonesia 89.6 95.7 100 104.7
Source: Data derived from ABS 6401.0 (Tables 9 and 10).
UN
CO
RR
EC
TED
PA
GE
PR
OO
FS

SCHOOL ASSESSMENT TASKS AND LEARNING ACTIVITIES
128 economics down under book 1
c03Australia’sInfl ationAsAContemporaryEconomicIssue 128 September 4, 2014 12:46 PM
An essay
Your task is to prepare a 400-word essay about one of the following topics.1. Examine the causes of infl ation.2. Outline the four best ways whereby the government can reduce
both cost and demand infl ation.
A class debate
After dividing into teams (one for the affi rmative and one for the negative), work with others to prepare a debate about the following topic: ‘That infl ation is now as dead as the dodo or the dinosaur’.
Economic simulation activity —role play and multimedia presentation
backgroundFairly regularly, the Board of Australia’s Reserve Bank meets to consider whether interest rates should be changed. Typically, rates are increased if the RBA thinks that infl ation will start to exceed the RBA’s 2–3 per cent target for low infl ation, and reduced if infl ation is not a threat. In making its decision, an infl ation checklist of recent trends in statistical indicators is examined. This list includes:• changes in the latest quarterly infl ation rate using the CPI• changes in private consumption and investment spending, along
with AD• changes in the growth rate of wages• changes in the exchange rate for the A$• changes in the level of overseas economic activity (for example
China, US and Japan).
The roles to playPretend that there is going to be a meeting of the RBA Board (of which you are a member) to consider whether there is a need to increase interest rates in the economy in order to combat recent changes in the infl ation rate. Divide the class into pairs of students, who will then need to conduct research about the latest trends in the above checklist of indicators. The task for each pair is to prepare a persuasive talk of around 3–4 minutes which will be presented at the round table meeting of the Board. Your presentation will argue either in favour of or against an immediate rise in interest rates. You may be able to use information technology to prepare a set of PowerPoint slides, or perhaps you may create some Excel graphs and place these on a display board to illustrate your speech.
A report on an investigation
Question 1: Infl ation investigationThe taskYou are asked to research the topic of infl ation using a variety of references, other than your textbook. In particular, you may like to fi nd out something about the following areas:• the history of infl ation (e.g. at various times in Germany,
Hungary, Zimbabwe or South America)• how different economists (e.g. Milton Friedman) have tried to
explain the causes of infl ation
• the effects of hyperinfl ation on households and businesses• what the policy cures for infl ation are, as suggested by some
economists.ReferencesA good place to start your research is on the internet or in your school or local library.• Try using internet search engines (e.g. Google) to look up
relevant and approved websites containing information about infl ation.
• Look up the Reserve Bank of Australia website for the latest statement about monetary policy or the Australian government’s recent budget papers.
• Use reference textbooks about economic theories explaining the causes of infl ation.
Presentation of your researchThere are many ways you could present your work:• a wall chart• a report• a presentation (e.g. PowerPoint slides, DVD)• an essay• a class talk.
Question 2: Tuckshop price indexThis exercise involves calculating a simple tuckshop price index measured over a two-year period. All the statistical data for completion is set out in table 3.11 (p. 127). You will notice that this table has three parts that need completion and covers two years. In addition, the tuckshop price index might use 2011 as the base year, has a regimen containing only four items and the weights given to each item remain the same over the two years.
Follow the step-by-step instructions to complete table 3.11.Step 1. To complete part 1 of table 3.11, calculate the weighted value of spending on each item in the regimen for each of the two years (e.g. 2014 and 2015). To provide an example only, the weighted value of a meat pie (i.e. the fi rst item in the regimen) in both years has been done for you, but using a hypothetical price. The actual prices to be used in these calculations for the two-year period need to be researched by you at your tuckshop.
Weighted value of a pie in each year = the price per pie for that year × the weighting given to pies
When you have completed calculating the weighted value of each item in each of the two years on the table, you then need to add up the total weighted value of the whole basket of tuckshop items for each of the years.
Step 2. Convert the total weighted value of the basket for each of the two years into an index whose value is not measured in terms of dollars and cents, but in terms of so many index points. To do this, the fi rst year (e.g. 2014) is selected as the base year. In other words, the total weighted value of the basket in the starting year measured in dollars and cents is equal to 100 index points. This acts as a yardstick to allow us to compare the weighted values of the basket in the following year. In order to calculate the level of the index the year after the base year (e.g. for 2015), the following approach is used:
Total weighted value ($) of thebasket in (e.g. 2015) 100
1×
Total weighted value ($) of thebasket in the base year (2014)
Tuckshop priceindex, e.g. 2015 =
FIGURE 3.13 Calculation for CPI
UN
CO
RR
EC
TED
PA
GE
PR
OO
FS

SCHOOL ASSESSMENT TASKS AND LEARNING ACTIVITIES
129chapter 3 Australia’s inflation as a contemporary economic issue
c03Australia’sInfl ationAsAContemporaryEconomicIssue 129 September 4, 2014 12:46 PM
Step 3. Using the price index you calculated in step 2 above, calculate the annual percentage increase in the tuckshop price index, e.g. between 2014 and 2015. The annual percentage rise in the price index is always equal to the increase in the index over and above the level of prices that existed in the base year — i.e. the increased level of the index, in 2015 against that in 2014. Try using the following approach.
Number of index pointsincrease in index betweentwo consecutive years(e.g. 2015 minus 2014) 100
1×
Level of index in the �rst of thetwo years selected (e.g. 2014)
Annual percentagerise in the tuckshopprice index(e.g. for 2015)
=
FIGURE 3.14 Calculating the increase in the index
Give two sound statistical reasons why this tuckshop price index may be a poor guide to the change in prices paid by students in Victorian schools over the two-year period (e.g. between 2014 and 2015).
A folio of annotated media commentaries using print or electronic materials
Collect any two newspaper articles about the issue of infl ation. For instance, they may report:• the latest trends• the causes of recent trends• the effects of infl ation• government policies to reduce infl ation. Annotate these articles where you identify, expand and discuss these major ideas. These extracts may come from various sources including print (i.e. newspapers and magazines) or the internet. Be sure to clearly indicate or footnote the source of this information.
View a DVD or program
To help strengthen your understanding of infl ation, view same of the following programs.1. Economic Australia — Infl ation (program 3), Australian
Broadcasting Corporation.2. The ascent of money — program 3, blowing bubbles (ABC 1,
11 June 2009).
TablE 3.11 The tuckshop price index for completion — e.g. 2014 to 2015
Part of the table RegimenThe weight given
to item in regimen
Base year (e.g. 2014 = base year = 100 points) Next Year (e.g. 2015)
Price per unit or item
($)
Weighted value ($)
Price per unit ($)
Weighted value ($)
1 Pie and sauceCan of CokeTwistiesCherry Ripe
5632
3.00.....................
15.00...........................
3.50.....................
17.50...........................
Total weighted value of spending on the regimen
Total weighted cost of basket in e.g. 2011 = $.........
Total weighted cost of basket in e.g. 2012 = $.........
2 Tuckshop price index (show your working)
Base year = 100 index points(i.e. because this is the base year for the index and always equals 100)
Cost of basket in e.g. 2015×
100
Cost of basket in e.g. 2014 1
= ........ Index points
3 Annual percentage rise in the tuckshop price index between 2014 and 2015
Base year — not applicable(i.e. because this is the base or fi rst year — there is no year against which to compare the data)
Points increase in index×
100
Index in e.g. 2014 is 100 1
= ........ % rise
UN
CO
RR
EC
TED
PA
GE
PR
OO
FS

CHAPTER 3
130 economics down under book 1
c03Australia’sInfl ationAsAContemporaryEconomicIssue 130 September 4, 2014 12:46 PM
SUMMARY
Defi nition of infl ation• Infl ation generally erodes our living standards. It refers to a situation where most
prices for goods and services are rising. • Hyperinfl ation is where prices rise very quickly, out of control. • Defl ation is when prices are generally falling. Infl ation is not a new problem
(e.g. American Civil War, Germany 1923, Hungary 1946 and Zimbabwe 2008).
Measurement of infl ation• Infl ation is measured quarterly by the ABS using the consumer price index (CPI). • The CPI indicates the average change in the retail prices of a wide range of locally-
made and imported goods and services purchased by metropolitan households. • The CPI comprises a regimen or basket where items are weighted. Comparisons of
price changes are made against prices of the basket of items in the base year (currently 1989–90).
Recent trends in australia’s infl ation• The Australian government strives to achieve the goal of low infl ation where
general prices increase by an average of around 2–3 per cent a year over the business cycle.
• Achieving this goal helps to strengthen material living standards. • Overall between 2000–01 and 2013–14, prices were fairly stable, rising by just over 3
per cent a year despite accelerating infl ation in 2000–01, 2005–08 (prior to the global recession 2008–09), and again in 2009–10–11.
• Due to quite strong economic growth and limited spare productive capacity until late 2008, and again in 2010–11, Australia’s infl ation was higher than in some of our over-seas competitors.
Factors affecting or causes of australia’s infl ation• Infl ation has two main causes.
1. Demand infl ation. During a boom, demand-side factors or conditions are strong (e.g. high levels of consumer and business confi dence, rises in disposable income, booming economic conditions overseas, tax cuts, lower interest rates, or rises in government spending). These can cause excessive levels of AD or spending on locally-made production, resulting in widespread shortages of goods and services if there is little unused productive capacity (so production cannot grow). These short-ages can lead to demand infl ation (e.g. late 1980s, 2005–08 and to a lesser extent between 2009 and 2011).
2. Cost infl ation. Cost infl ation can occur at any time, in booms and even in recessions. It can result from rising production costs or adverse supply-side conditions (e.g. higher wages, rises in interest rates and taxes, lower worker effi ciency and a weaker A$, drought and increased oil prices). Higher costs force fi rms to charge more for what they produce, to protect their profi t margins (e.g. the 1980s generally, 2006–08 and to a lesser extent in 2010–11).
Impacts and effects of infl ation• Infl ation impacts on people differently depending on how their purchasing power
is affected by rising prices — some may benefi t but most suffer reduced living standards.
• For instance, speculators, importers and local fi rms with a monopoly producing essen-tial goods and services often gain.
• By contrast exporters, fi xed income earners, ordinary families and workers in indus-tries facing strong competition lose because they often fi nd that general prices rise faster than wages so their real income falls.
Government policies to reduce infl ation• The government (and the RBA) seeks to achieve the target or goal of low infl ation,
where the CPI rises by an average of 2–3 per cent over the duration of the business cycle. Ultimately, this helps improve our material living standards.
UN
CO
RR
EC
TED
PA
GE
PR
OO
FS

131chapter 3 Australia’s inflation as a contemporary economic issue
c03Australia’sInfl ationAsAContemporaryEconomicIssue 131 September 4, 2014 12:46 PM
• The government may use two types of policies to help pursue the goal of low infl ation:1. Aggregate demand policies to slow demand infl ation. – If there is demand infl ation involving excess spending and general shortages of
goods and services, the government needs to apply the brakes and slow economic activity by contractionary macroeconomic budgetary policies (i.e. higher taxes and lower government spending) and/or contractionary RBA monetary policies (i.e. higher interest rates on savings and loans to fi rms and households) to slow AD.
– Lower spending removes widespread shortages of goods and services in the economy, easing demand infl ation pressures.
2. Aggregate supply policies to slow cost infl ation. – If there is cost infl ation caused by rising production costs and adverse supply-side
conditions, the government needs aggregate supply or microeconomic policies to raise effi ciency in production and cut costs.
– Aggregate supply or microeconomic effi ciency policies might include lower tariffs, improved effi ciency in government businesses through privatisation or corporati-sation, labour market deregulation involving enterprise agreements linking wages to effi ciency, fi nancial sector deregulation to stiffen competition and lower interest rates, cuts in company and other tax rates, competition policy involving the Com-petition and Consumer Act 2010 (Cwlth), prices surveillance and the ACCC, encouragement of national savings, and promotion of investment and business R&D.
UN
CO
RR
EC
TED
PA
GE
PR
OO
FS

CONCEPT MAP 3
132 economics down under book 1
c03Australia’sInfl ationAsAContemporaryEconomicIssue 132 September 4, 2014 12:46 PM
Australia’s infl ation as a contemporary economic issueFIGURE 3.15
• Inflation changes in a cyclical pattern with the level of economic growth or activity.• Accelerating inflation in the late 1990s rose to a 6 per cent peak in 2000–01.• Steadier inflation rates of 2–3 per cent existed between 2001–02 and 2004–05.• Increased inflation in 2005–08 and 2009–10–11 was due to strong economic activity and a lack of unused capacity.• Inflation slowed in 2008–09 (due to the global recession and the financial crisis) and again in 2011–12 and 2012–13.• Australia’s inflation rate has been faster than some overseas competitors like the UK and Japan.
In�ation as an economic issue
In�ation is measured using the consumer price index (CPI).
Trends in Australian and international in�ation
Factors affecting or causes of in�ation
Demand in�ation only occurs in booms: Cost in�ation occurs at any time:• Excessively strong demand-side factors include consumer and busines optimism, boom conditions overseas, excessive cuts in taxes or interest rates, and a falling A$.• Excess AD in an economy that is near its productive capacity can lead to widespread shortages of goods and services and thus demand inflation (e.g. 2005–08 and perhaps 2010–11).
• Less favourable supply-side factors that add to costs might include drought, rising oil prices, higher wages, increased interest rates on business borrowing, a weaker A$ and poor labour productivity and efficiency.• Higher production costs force firms to pass on these on to consumers as higher prices in order to protect their profit margins, leading to cost inflation (e.g. 2005–08 and 2010–11).
• Change in retail prices of local and foreign made goods and services purchased by metropolitan households• A regimen of consumer goods and services is selected.• Items are weighted according to their relative importance in typical household budgets.• Prices surveyed are a cross-section of retail outlets.• Prices are compared against a base year which equals 100 index points.
• Inflation is an economic problem or illness that hurts our living standards.• Inflation means generally rising prices.• Deflation is when prices generally fall.• Hyperinflation is when price rises are out of control.
Government policies used to promote the goal of low in�ation(i.e. an average increase in general prices of around 2–3 per cent a year over the economic cycle)
• These policies need to be applied in a contractionary way to slow AD and help neutralise or counteract the inflationary boom. Weaker AD removes shortages of goods and services, ending demand inflation.
• Contractionary monetary policies to slow AD and economic activity, involve the RBA increasing interest rates to encourage saving and discourage C + I spending based on borrowed credit (e.g. 2009–11).
• Contractionary budgetary policies to slow AD involve the Treasurer increasing tax revenues in the budget relative to the level of government spending on outlays (e.g. 2006–08, perhaps 2012–13).
• These policies involve microeconomic cost-cutting, efficiency-promoting reforms that boost productive capacity and AS (i.e. more output can be produced from same resources). If costs are reduced, firms can lower their selling prices against competitors and still make good profits, ending cost inflation.• Aggregate supply policies might include:
Macroeconomic or aggregate demand policies: Microeconomic or aggregate supply policies:
– cutting tariffs to lift efficiency (e.g. 2010)– labour market reforms to lift efficiency (e.g. 2010 and 2012)– cutting rates of company (e.g. promised for 2015) and personal (2010, 2012) tax to improve incentives and efficiency– promoting stiffer competition between rival firms through the ACCC– government spending on education and training– increase in immigration to ease labour shortages– increased spending on infrastructure.
UN
CO
RR
EC
TED
PA
GE
PR
OO
FS