Medical Ultrasonic Imaging: An Overview of Principles and Instrumentation

25.1
CHAPTER 25
INSTRUMENTATION DESIGN FORULTRASONIC IMAGING
Kai E. ThomeniusGE Corporate Research and Development,Schenectady, New York
25.1 INTRODUCTION 25.1 25.4 BEAM FORMATION 25.725.2 BASIC CONCEPTS 25.1 25.5 SIGNAL PROCESSING AND SCAN25.3 TYPICAL SYSTEM BLOCK CONVERSION 25.16
DIAGRAM 25.4 25.6 SUMMARY 25.16
The purpose of this chapter is to show how piezoelectric transduction, sound wave propagation, andinteraction with scattering targets are taken advantage of in image formation with an ultrasoundinstrument. These instruments have evolved over the last 40 years from relatively simple handmovedscanners built around an off-the-shelf oscilloscope to rather sophisticated imaging computers. Muchtechnology has been perfected during this evolution. For example, transducers have grown fromcircular single-element probes to precision arrays with more than 1000 elements. With better front-end electronics, the operating frequencies have increased as weaker echoes can be handled. As thegate counts of VLSI ASICs* have increased, the numbers of processing channels in array-basedsystems have risen. With the introduction of reasonably low cost high-speed (20 to 40 MHz) 8- to 12-bit analog-to-digital converters, digital beam formation has become the standard.
The organization of this chapter is based on the discussion of a block diagram of a generalizedultrasound system. Each component of the block diagram will be reviewed in considerable detail.Different design approaches for the various blocks will be reviewed and their advantages anddisadvantages discussed. Finally those areas of the block diagram that are targets of significant currentresearch are summarized.
Image formation in medical ultrasound is accomplished by a pulse-echo mechanism in which a thinultrasound beam is transmitted and the echoes generated by the interaction of that beam with
25.7 INTRODUCTION
25.2 BASIC CONCEPTS
25.2.1 Image Formation
* Very large-scale integration application-specific integrated circuits.
Downloaded from Digital Engineering Library @ McGraw-Hill (www.digitalengineeringlibrary.com)Copyright © 2004 The McGraw-Hill Companies. All rights reserved.
Any use is subject to the Terms of Use as given at the website.
Source: STANDARD HANDBOOK OF BIOMEDICAL ENGINEERING AND DESIGN

25.2 DESIGN OF MEDICAL DEVICES AND DIAGNOSTIC INSTRUMENTATION
scattering targets are received by a transducer or a set of transducer elements. The transmit andreceive processing used to create this beam is referred to as beam formation. Because of its centralrole in ultrasonic imaging, beam formation will be discussed in detail later on.
The strength of the received echoes is usually displayed as increased brightness on the screen(hence the name for the basic ultrasonic imaging mode, B-mode, with B for brightness). A two-dimensional data set is acquired as the transmitted beam is steered or its point of origin is moved todifferent locations on the transducer face. The data set that is acquired in this manner will have someset of orientations of the acoustic rays. The process of interpolating this data set to form a TV rasterimage is usually referred to as scan conversion. With Doppler signal processing, mean Doppler shiftsat each position in the image can be determined from as few as 4 to 12 repeated transmissions. Themagnitudes of these mean frequencies can be displayed in color superimposed on the B-mode imageand can be used to show areas with significant blood flow.
It may be useful to consider typical system operating parameters. The following table lists somephysical constants that help define the operating parameters of today’s systems:
Typical attenuation in tissue 0.5 dB/cm · MHz for one-way travelSpeed of sound in tissue 1540 m/s (or approximately 13 µs/cm for roundtrip
travel)
One of the challenges of ultrasonic imaging relates to that very high attenuation. To put this innumerical terms, a typical 5-MHz transducer is expected to penetrate about 10 cm. Thus, the signalleaving the transmitting transducer will undergo attenuation in the order of 25 dB before it reaches ascattering site. At that point, a small fraction of the energy will be reflected; let us say the reflectedecho will be another 30 dB down, and the return will bring about another 25 dB. Thus the entireattenuation has been about 80 dB. Needless to say, there is a strong need for careful low-noise designsfor ultrasound front ends.
The following table gives some of the typical system design parameters commonly used for B-mode imaging:
Transducer frequencies 2–15 MHzTransducer bandwidth 50–90% fractional bandwidthTypical depths of penetration 18 cm (abdominal imaging) 16 cm (cardiac imaging) 4 cm (small parts and peripheral vascular
imaging)Time to acquire one 20-cm acoustic ray ~ 260 µsPulse repetition frequency (PRF) 4 kHzTypical number of rays in an image 128–400Data acquisition frame rates 10–80 frames/s
Because of frequency-dependent attenuation, applications with greater penetration requirements usethe lower transducer frequencies. The instrument parameters have been selected or have evolved totheir current values as the manufacturers have optimized their instruments to the needs of the variousclinical applications. Given the compromises that have to be made, resolution of scanners is beenlimited, ranging from roughly 0.5 mm with 7- to 10-MHz transducers to about 2 to 4 mm with 2.5-to 3.5-MHz transducers. The penetration at which these resolutions can be achieved is about 3 cm forthe higher frequencies and 15 or more cm for the lower frequencies. Whether or not this performancecan be achieved on any given patient is dependent on factors such as uniformity of speed of sound,which is highly patient dependent (O’Donnell, 1988). The degree of and correction for sound speed
25.2.2 Physical Constants and Typical System Operating Parameters
Downloaded from Digital Engineering Library @ McGraw-Hill (www.digitalengineeringlibrary.com)Copyright © 2004 The McGraw-Hill Companies. All rights reserved.
Any use is subject to the Terms of Use as given at the website.
INSTRUMENTATION DESIGN FOR ULTRASONIC IMAGING

INSTRUMENTATION DESIGN FOR ULTRASONIC IMAGING 25.3
variations in ultrasound systems continues to receive much attention (for example, Fink, 1992; Flax,1988; Li, 1995; Nock, 1988; O’Donnell, 1988; Trahey, 1988; Zhu, 1993a and 1993b; Krishnan etal., 1996; Rigby, 2000; Silverstein, 2001).
B-mode imaging has found numerous uses in today’s clinic (Goldberg, 1990; Sarti, 1987). Some ofthese are:
Abdominal imaging Identification of tumors, cysts in liver, kidneysCardiology Valvular insufficiency (flail leaflet), myocardial
dyskinesis, septal defects, congenital malformations
Obstetrics Fetal growth, congenital malformationsPeripheral vasculature Extent of plaque, blood vessel tortuosity
Many of these diagnoses are based on relatively gross anatomical information that is available fromthe ultrasound image. In addition there is a large amount of additional information imparted to theechoes by the scattering process. Some of this information is displayed on B-mode images and is ofmajor value to the clinician. This information is critical to diagnoses such as diffuse disease processes,the identification of tumors, quality of myocardial dynamics, and so forth. It is for these reasons thesignal integrity and retention of maximum dynamic range is of key value in the image formationprocess.
Sales of ultrasound instruments are divided among the four areas listed above roughly as follows(source: Klein Biomedical Consultants):
Radiology 39%Cardiology 35%Obstetrics/gynecology 16%Peripheral vasculature 5%
This gives a rough idea of the level of utilization in the several areas; however, it also should be notedthat the marketplace is currently undergoing significant changes with the reform activity in healthcare. Also, there is much overlap between the segments. For example, many radiologists do performobstetric or peripheral vascular examinations and echocardiologists perform increasing amounts ofperipheral vascular work. In terms of instrumentation sales, these are believed to be approximately$2.5 billion in year 2000.
Ultrasonic instruments can be classified in many of different ways (Christensen, 1988). Among theseare:
Types of electronic beam steering: Phased arrays versus steering by element selec-tion
Clinical applications: See Sec. 25.2.3Nature of beam formation: Analog versus digitalPortability Console-based systems versus hand-helds
25.2.3 Clinical Applications
25.2.4 Classifications of Ultrasound Instruments
Downloaded from Digital Engineering Library @ McGraw-Hill (www.digitalengineeringlibrary.com)Copyright © 2004 The McGraw-Hill Companies. All rights reserved.
Any use is subject to the Terms of Use as given at the website.
INSTRUMENTATION DESIGN FOR ULTRASONIC IMAGING

25.4 DESIGN OF MEDICAL DEVICES AND DIAGNOSTIC INSTRUMENTATION
With respect to steering methods, the great majority of instruments (perhaps more than 95 percent)sold today are electronically (as opposed to mechanically) steered. Phased-array systems are dominantin echocardiographic applications where aperture size is limited by rib spacings, while the other beamsteering methods are more often used in radiologic and obstetric and gynecological examinations.The latter grouping is sometimes referred to as general imaging ultrasound. The shift to digital beamformation is accelerating, and most of the instruments sold have digital beam formers. This is trueeven for the lower-price points. Figure 25.1 shows a range of ultrasound scanners.
The block diagram in Fig. 25.2 shows the signal processing steps required for B-mode imageformation. The actual implementations vary considerably among manufacturers and the types ofsystems. For example, the grouping of functions might be different from one system to the next,depending on the choices made by the system designers; however, the basic functionality shown byeach block has to be there.
One point that the block diagram may not convey adequately is the degree of duplication offunctions in today’s systems For example, in systems with 128 processing channels, there will usuallybe 128 pulsers, 128 transmit/receive switches (T/R switches), and so forth. In such systems the use oflarge-scale integration and application specific integrated circuits (ASIC’s) is highly important for costand space reduction. For the most part, the block diagrams for digital and analog beam formers arequite similar, although there will usually be a large number of additional support circuitry requiredfor synchronization, interpolation, and decimation of the sampled waveforms, and so forth.
Depending on the particular system implementation, the full RF bandwidth will be retainedthrough the top part of the block diagram on a typical analog design. The class of heterodynedsystems performs frequency mixing at the beam former level, and the signal spectrum is shifted toeither an intermediate frequency or all the way to the baseband. With digital beam formers, A/Dconversion occurs after the variable gain stages. The digital beam former systems can be designedwith similar heterodyning approaches, although there are many different approaches to delaygeneration. In addition to the digital and analog forms of beam formers, it is also possible to usecharge-coupled devices for this purpose and these, in fact, are receiving considerable attention at thepresent time.
FIGURE 25.1 Range of ultrasound scanners. As can be seen the ultrasound scanners comein a range of physical sizes. (Courtesy of GE Medical Systems.)
25.3 TYPICAL SYSTEM BLOCK DIAGRAM
Downloaded from Digital Engineering Library @ McGraw-Hill (www.digitalengineeringlibrary.com)Copyright © 2004 The McGraw-Hill Companies. All rights reserved.
Any use is subject to the Terms of Use as given at the website.
INSTRUMENTATION DESIGN FOR ULTRASONIC IMAGING

INSTRUMENTATION DESIGN FOR ULTRASONIC IMAGING 25.5
The following paragraphs introduce and describe briefly the functions of the most important blocksin Fig. 25.2. The most important of these will receive greater attention in the remainder of thechapter.
The mode of transduction in ultrasound systems takes advantage of the piezoelectric characteristic ofcertain ceramics. There are several types of transducers currently in use, and the nature of processingof acoustic data is different among them. These differences are highlighted in later sections asappropriate.
The piezoceramics can be fabricated in a number of ways to perform B-mode imaging. In itssimplest form, the B-mode transducer is a circular single-element transducer with a fixed geometricfocus. To a large degree this type of a transducer has been replaced today by more sophisticatedmultielement transducers; however, there are still commercial systems where single-elementtransducers are used. The next more complicated designs are annular arrays, which are also circular
FIGURE 25.2 Block diagram of a typical ultrasound system. The blank circles represent points at which user control is intro-duced.
25.3.1 B-Mode Transducers
Downloaded from Digital Engineering Library @ McGraw-Hill (www.digitalengineeringlibrary.com)Copyright © 2004 The McGraw-Hill Companies. All rights reserved.
Any use is subject to the Terms of Use as given at the website.
INSTRUMENTATION DESIGN FOR ULTRASONIC IMAGING

25.6 DESIGN OF MEDICAL DEVICES AND DIAGNOSTIC INSTRUMENTATION
but, as the name implies, are composed of several (4 to 12) rings. These are the transducers mostoften used with mechanically steered systems (to be discussed later). Both the single-element andannular array transducers usually have a concave curved transmitting surface or an acoustic lens tofocus the acoustic energy at a given location. The next broad transducer category is that of lineararrays, which are built by dividing a piezoceramic strip into a large number of line-source-likeelements. The number of elements in such arrays can exceed 200, although 128 is a typical number.A variation of the linear arrays is curvilinear arrays which are built around a curved surface. Withlinear arrays, the acquired image is rectangular in shape, while with curvilinear arrays (and singleelement, annular arrays, and certain linear arrays), it is sector shaped. Both linear and curvilineararrays either have a lens or are curved to focus the ultrasound in the plane perpendicular to theimaging plane. With both of these types of arrays, focusing in the image plane is done electronically.Finally, in order to improve on slice thickness, some form of elevation focusing is being introducedinto today’s systems. This is realized by the use of multiple rows of elements which form a two-dimensional (2-D) array of elements. Arrays that are connected to form a symmetrical aperture aboutthe center line are sometimes referred to either as 1.25-D or 1.5-D arrays depending on whetherimproved slice thickness in the elevation direction is achieved by increasing the aperture size or byperforming electronic focusing with those rows of elements.
The transducer or transduction itself has received considerable attention from researchers becauseof its critical position in the signal processing sequence (Hunt, 1983). Much progress has been madein the areas of sensitivity, bandwidth, and the use of composite materials. Bandwidths of today’stransducers can exceed 80 percent of the center frequency. This gives the system designer additionalflexibility with the available imaging frequencies and allows the optimization of image quality amongthe various imaging modes as well as over a larger cross section of patients. There is some potentialof increasing the transmitted signal bandwidths to above 100 percent with a new class of transducersreferred to as single-crystal relaxors, about to be introduced into the marketplace.
This group of blocks is among the most critical from the analog signal-to-noise ratio point of view(Schafer and Lewin, 1984; Wells, 1977). The piezoceramic array elements are energized with thepulser, and the transduction occurs as has been described. With the newer generation of instruments,the excitation waveform is typically a short square-wave burst with one to three cycles. Earliergenerations (pre-Doppler) of instruments tended to use shock excitation with very wide bandwidths.The transducer element, with its limited bandwidth, filters this signal during both transmission andreception to a typical burst. The pulser voltages used vary considerably but values around 150 voltsare common. Use of a short burst (say with a bandwidth in the 30 to 50 percent range) can give thesystem designer the ability to move the frequency centroid within the limits of the transducer band-width. In some imaging modes such as B mode, the spatial-peak temporal-average intensity (Ispta, anFDA-regulated acoustic power output parameter) value tends to be low; however, the peak pressurestend to be high. This situation has suggested the use of coded excitation, or transmission of longercodes that can be detected without loss of axial resolution. In this manner the average acoustic poweroutput can be increased and greater penetration depth be realized.
The T/R switches are used to isolate the high voltages associated with pulsing from the verysensitive amplification stage(s) associated with the variable gain stage [or time gain compensation(TGC) amplifier]. Given the bandwidths available from today’s transducers (80 percent and more insome cases), the noise floor assuming a 50-Ω source impedance is in the area of few microvolts rms.With narrower bandwidths this can be lowered but some imaging performance will be lost. If the T/R switch can handle signals in the order of 1 volt, the dynamic range in the neighborhood of 100+dB may be achieved. It is a significant implementation challenge to have the noise floor reach thethermal noise levels associated with a source impedance; in practice there are a good number ofinterfering sources that compromise this. In addition, some processing steps such as the T/R switchingcause additional losses in the SNR.
25.3.2 Pulser, T/R Switch, Variable Gain Stage (or TGC Amplification)
Downloaded from Digital Engineering Library @ McGraw-Hill (www.digitalengineeringlibrary.com)Copyright © 2004 The McGraw-Hill Companies. All rights reserved.
Any use is subject to the Terms of Use as given at the website.
INSTRUMENTATION DESIGN FOR ULTRASONIC IMAGING

INSTRUMENTATION DESIGN FOR ULTRASONIC IMAGING 25.7
The TGC stages supply the gain required to compensate for the attenuation brought about by thepropagation of sound in tissue. During the echo reception time, which ranges from 40 to 240 µs, thegain of these amplifiers is swept over a range approaching 60 to 70 dB, depending on the clinicalexamination. The value of this gain at any depth is under user control with a set of slide pots oftenreferred to as the TGC slide pots. The dynamic range available from typical TGC amplifiers is in theorder of 60 dB. One can think of the TGC amplifiers as providing a dynamic range window into thetotal range available at the transducer. This is illustrated in Fig. 25.3.
FIGURE 25.3 Front-end block diagram with signal processing steps and corresponding dynamic ranges.
It is interesting to note that the commercial impact of multichannel ultrasound instruments is suchthat a special purpose TGC amplifier IC has been developed for this function by a major integratedcircuit manufacturer (Analog Devices in 1990).
Beam formation can be considered to be composed of two separate processes: beam steering andfocusing (Macovski, 1983). The implementation of these two functions may or may not be separated,depending on the system design. Focusing will be discussed first.
Analogously to optics, the spatial variation in system sensitivity can be modified by the action offocusing on the transmitted acoustic beam and, during reception, on its echoes. One can viewfocusing as the modification of the localized phases (or, more correctly for wideband systems, timeshifts) of the acoustic beam so as to cause constructive interference at desired locations. One simpleway to accomplish focusing is by curving the transducer element so as to form a phase front that,after traveling a defined distance, will cause the beam to add constructively at a desired focal point.With transducer arrays, the formation of the desired phase front during transmission can be accom-plished by electronically altering the sequence of excitation of the individual elements. Similarly,during reception, the signals from the array elements can be routed through delay lines of appropriatelengths so that echoes from specific locations will have constructive interference (Thurstone, 1973).These processes are shown schematically in Fig. 25.4.
As suggested by Fig. 25.4, the echoes from a point source will have a spherical wavefront. Thecenter elements of the array will receive these echoes at first while the outer elements will receivethem last. To compensate for this and to achieve constructive interference at the summer, the centerelements will be given the longest delays, as suggested by the length dimension of the delay lines.The calculation to determine the differential delays among the received echoes is straightforward.
An attractive formalism for expressing the array-based focusing in mathematical terms is due toTrahey (1988). The total transmitted pressure wave T(t) at a point p can be expressed as a sum of thecontributions from N array elements as follows:
25.4 BEAM FORMATION
25.4.1 Focusing
Downloaded from Digital Engineering Library @ McGraw-Hill (www.digitalengineeringlibrary.com)Copyright © 2004 The McGraw-Hill Companies. All rights reserved.
Any use is subject to the Terms of Use as given at the website.
INSTRUMENTATION DESIGN FOR ULTRASONIC IMAGING

25.8 DESIGN OF MEDICAL DEVICES AND DIAGNOSTIC INSTRUMENTATION
(25.1)
where AT(n) = pressure amplitude contribution of the nth element of the array at point p r(n) = distance from the nth element to the focus S(t) = waveshape of the pressure pulse generated by any given element of the array tT(n) = focusing time delay for element n shown as the length of delay lines in Fig. 25.4 c = speed of sound in the medium
Assuming that at location p there is a point target with reflectivity Wp, then the signal after the summerin Fig. 25.4 can be described by
(25.2)
where AT(n) = pressure amplitude contribution of the nth element to echoes from point p tR(t) = receive focusing delay for element n
and T(t) is given by Eq. (25.1). The remaining parameters of Eq. (25.2) were defined in Eq. (25.1).It should be noted that the AT(n) and AR(n) terms in Eq. (25.1) and (25.2) will, in general, bedifferent since the transmit and receive operation need not be symmetric. The terms include tissueattenuation, element sensitivity variation, and transmit or receive apodizations.
It might be useful at this point to discuss several methods by which the receive delays for eitherfocusing or beam steering are implemented. The previous paragraph refers to the use of delay linesfor this purpose. Analog delay lines are an older method, albeit a very cost-effective one. However,lumped-constant delay lines do suffer from several limitations. Among these is the limited bandwidthassociated with longer delay lines. Delays needed for focusing for most apertures are less than 0.5 µs;
FIGURE 25.4 Schematic of focusing during reception. The echoes from a point source (at 40 mm) are shownimpinging on a transducer array. The difference in the reception times is corrected by the delay lines. As anexample, the echo will be received first by the center elements. Hence, their delays are the longest.
Downloaded from Digital Engineering Library @ McGraw-Hill (www.digitalengineeringlibrary.com)Copyright © 2004 The McGraw-Hill Companies. All rights reserved.
Any use is subject to the Terms of Use as given at the website.
INSTRUMENTATION DESIGN FOR ULTRASONIC IMAGING

INSTRUMENTATION DESIGN FOR ULTRASONIC IMAGING 25.9
however, for phased-array beam steering (see below) they may be as long as 8 µs for largersapertures required for 2.5- to 3.5-MHz operation or up to 5 µs required for 5- to 7-MHz operation.Delay lines suitable for the latter case are relatively expensive. In addition, there are concerns aboutthe amplitude variations with tapped delay lines as different taps are selected, delay uniformity overa production lot, and delay variations with temperature. In response to these difficulties, there hasbeen a major migration to digital beam formation over the last 10 years (Thomenius, 1996).
An alternative method of introducing focusing delays for both analog and digital beam formers isby heterodyning (for example, Maslak, 1979). This is usually done in conjunction with mixing thereceived signal with a lower local oscillator frequency with the goal of moving the received energyto a different location on the frequency spectrum. If the phase of the local oscillator is variedappropriately for each of the array signals, the location of constructive interference can be placed ata desired location. The limitations of this are associated with the reduced bandwidth over which thedelay correction will be accurate and the reduced range of phase correction that is possible. Finally,as noted above, focusing (and beam steering) can be accomplished by relatively straightforwarddigital techniques in a digital beam former. A number of different methods of digital beam formerimplementation have been published in the sonar and ultrasound literature (Mucci, 1984; Steinberg,1992).
Figure 25.5 shows the formation of the focal region for a 20-mm-aperture circular transducerwith a geometric focal distance of 100 mm and excited with a CW signal of 3.0 MHz. At the lefthandside of the pressure profile, the rectangular section from -10 to 10 mm corresponds to the pressure atthe transducer aperture. In the near field, there are numerous peaks and valleys corresponding to
FIGURE 25.5 Spatial cross-sectional pressure distribution due to a circular transducer with a diameter of 20 mm, frequency of3.0 MHz, and a radius of curvature of 100 mm. The left-hand side corresponds to the transducer aperture. All spatial dimensionsare in millimeters; the x and y axes are not to scale. This pressure distribution was determined by the use of angular spectrumtechniques. (Schafer, 1989.)
Downloaded from Digital Engineering Library @ McGraw-Hill (www.digitalengineeringlibrary.com)Copyright © 2004 The McGraw-Hill Companies. All rights reserved.
Any use is subject to the Terms of Use as given at the website.
INSTRUMENTATION DESIGN FOR ULTRASONIC IMAGING

25.10 DESIGN OF MEDICAL DEVICES AND DIAGNOSTIC INSTRUMENTATION
areas where there is partial constructive and destructive interference. As one looks closer to the focalregion, these peaks and valleys grow in size as the areas of constructive and destructive interferencebecome larger. Finally, at the focal point the entire aperture contributes to the formation of the mainbeam.
One way of assessing the quality of a beam is to look at its beamwidth along the transducer axis.The 6- and 20-dB beamwidths are plotted on Fig. 25.6. It is important to recognize that thebeamwidths shown are those for a circular aperture. Because of the axial symmetry, the beamwidthsshown will be achieved in all the planes, i.e., in the imaging plane as well as plane perpendicular toit (this plane is often referred to as the elevation plane, from radar literature). This will not be the casewith rectangular transducers. With rectangular transducers, the focusing in the image plane is doneelectronically, i.e., in a manner similar to that for annular arrays. However, in the elevation plane, thefocusing in today’s systems is done either by a lens or by the curvature of the elements. In such casesthe focal location will be fixed and cannot be changed electronically. Remedying this limitation ofrectangular transducers is currently an active area of study. The introduction of the so-calledelevation focusing will be discussed in greater detail in a later chapter.
There is considerable diagnostic importance that has to be attached to the 20-dB and higherbeamwidths. Sometimes the performance at such levels is discussed as the contrast resolution of asystem. The wider the beam is, say at 40 dB below the peak value at a given depth, the moreunwanted echoes will be brought in by these sidelobes. Small cysts and blood vessels may becompletely filled in by such echoes. Also, if a pathological condition alters the backscatter strength ofa small region by a modest amount, this variation may become imperceptible because of the acousticenergy introduced by the sidelobes.
With array-type transducers, the timing of the excitation or the delays during reception can bevaried, thereby causing a change in the focal location. This is demonstrated in Fig. 25.7, where threedifferent 6-dB profiles are shown. During transmission, the user can select the focal location asdictated by the clinical study being performed. There are operating modes sometimes referred to ascomposite imaging modes in which the final image is a composite of the data acquired duringtransmission and reception from several distributed focal locations. Not only can one change thetransmit focal location but also the aperture size and transmit frequency between the transmissions.With this approach, one can achieve superior image uniformity at the expense of frame rate, whichwill be decreased by the number of transmissions along a single look angle.
FIGURE 25.6 The 6- and 20-dB beam contours for the beam generated by a 3.0-MHz, 19-mm-aperture, 100-mm-focus transducer undergoing CW excitation. Thex and y axes are to scale so that one can get a sense of the beam dimensions withrespect to the depth of penetration.
Downloaded from Digital Engineering Library @ McGraw-Hill (www.digitalengineeringlibrary.com)Copyright © 2004 The McGraw-Hill Companies. All rights reserved.
Any use is subject to the Terms of Use as given at the website.
INSTRUMENTATION DESIGN FOR ULTRASONIC IMAGING
INSTRUMENTATION DESIGN FOR ULTRASONIC IMAGING 25.11
During reception there is yet another possibility to improve the performance of the system. As thetransmitted wavefront travels away from the transducer, the delays introduced by the focusing can bevaried, thereby changing the receive focus with the location of the wavefront. This approach isreferred to as dynamic focusing and is now a standard feature of most systems. With analog delaylines, dynamic focusing is often implemented with tapped delay lines by changing the tap selection asthe required focal delays change. Implementation of dynamic focusing by this method does add anumber of challenges to the system designer, among which are the introduction of switching noise inthe case of analog delay lines.
There are a number of different methods of beam steering currently in use. These can be groupedinto three categories:
1. Mechanical2. Element selection3. Phased array
The major implication of the selection of the beam steering approach is in the cost of the instrument.Mechanically steered systems tend to be the simplest and hence the least expensive while the phasedarrays are the most expensive. Some imaging systems incorporate all three types; the great majorityof recent vintage scanners have the latter two types of beam steering. The following paragraphs willdiscuss the relevant features of each of the three types.
Mechanical Steering. The simplest method of beam steering is to use a mechanism to reorient atransducer (usually a circular aperture) to a predetermined set of orientations so as to capture therequired two-dimensional data set. This approach was dominant at first; however, in the last 15 years,electronically steered systems have become, by far, the most popular. Mechanical systems usually useeither a single-element transducer or an annular array transducer (Fig. 25.8). The former will have afixed focus while the latter does allow the focal point to be moved electronically. This will bediscussed more fully later.
FIGURE 25.7 Three 6-dB beam profiles for an array-type transducer. The radii ofcurvature for the three cases are 30, 50, and 80 mm.
25.4.2 Beam Steering
Downloaded from Digital Engineering Library @ McGraw-Hill (www.digitalengineeringlibrary.com)Copyright © 2004 The McGraw-Hill Companies. All rights reserved.
Any use is subject to the Terms of Use as given at the website.
INSTRUMENTATION DESIGN FOR ULTRASONIC IMAGING

25.12 DESIGN OF MEDICAL DEVICES AND DIAGNOSTIC INSTRUMENTATION
There are a number of very attractive aspects to mechanical systems. Among these are low costand the ability to focus the sound beam electronically in all planes. The low cost arises from therelatively low cost associated with the mechanisms used to move the transducer in comparison to themultielement transducer arrays and supporting electronics needed with electronic beam steering. Theability to focus the acoustic energy in all planes is a unique advantage, since most mechanicallysteered systems use either single-element or annular array type transducers. With the annular arrays,one has the capability to move the focus electronically in all planes, as opposed to the electronicallysteered arrays, which are usually rectangular in shape and will have electronic focusing in only oneplane. The number of transducer elements in an annular array is usually less than 12, typically 6 or8. With electronically steered arrays, the element count can go as high as 192 or more. As aconsequence, the costs tend to be higher.
With mechanical steering, one can vary the acoustic line density by changing the speed of rotationof the transducer. The system designer has the choice of maintaining a constant pulse repetitionfrequency but winding up with a variable line density or, by making the pulse repetition timing afunction of the location of the transducer at any point of the sweep and thereby achieving uniformline density. The best alternative may be to try to achieve a linear sweep with the transducer across thearea to be imaged at the same time that the transducer firing is kept as a function of the transducerangle. The last choice makes the challenges of scan conversion more tolerable.
Some of the drawbacks associated with mechanical steering involve the inertia associated with thetransducer, the mechanism, and the fluid within the nosepiece of the transducer. The inertiaintroduces limitations to the frame rate and clearly does not permit random access to look angles asneeded (the electronically steered approaches supply this capability). The ability to steer the beam atwill is important in several situations but most importantly in Doppler applications. Further, electronicbeam formation affords numerous advanced features to be implemented such as the acquisition ofmultiple lines simultaneously and elimination of the effects due to variations in speed of sound intissue.
Steering by Element Selection. Another relatively low cost beam-steering approach involves steeringof the beam by element selection. In this approach one doesn’t strictly steer the beam but ratherchanges the location of its origin, thereby achieving coverage over a two-dimensional tomographic
FIGURE 25.8 Sketch of a mechanically steered transducer. The transducer is isolated by anosepiece and bathes in a coupling fluid. Included in the sketch are the ray paths due to theradius of curvature. A motor or a motor drive (not shown) moves the transducer back andforth. Because of that motion, this design is sometimes referred to as a wobbler.
Downloaded from Digital Engineering Library @ McGraw-Hill (www.digitalengineeringlibrary.com)Copyright © 2004 The McGraw-Hill Companies. All rights reserved.
Any use is subject to the Terms of Use as given at the website.
INSTRUMENTATION DESIGN FOR ULTRASONIC IMAGING

INSTRUMENTATION DESIGN FOR ULTRASONIC IMAGING 25.13
slice. This method is applied with both linear and curvilinear arrays. Figure 25.9 shows the applica-tion in the case of curvilinear arrays. For this particular case, the two-dimensional image will be sectorshaped; with linear arrays, it will, of course, be rectangular. This is a relatively low cost approachsince aside from the multiplexing required for element selection, the electronics required to accom-plish beam formation are merely the focusing circuitry.
The line densities achievable with this mode of beam steering are not as variable as withmechanical steering, since it they will be dependent on element center-to-center spacing. There aremethods by which one can increase the achieved line density. Figure 25.9 shows an acquisitionapproach sometimes referred to as full stepping. The line density with full stepping will be equal tothe element density since the beam center will always be at the junction between two elements. It ispossible to change the sizes of the transmit and receive apertures and thereby change the transmit andreceive beam centers. This changes the effective location of the resultant beam and introduces thepossibility of an increased line density. Half- and even quarter-stepping schemes exist, although carehas to be taken that the resulting beam travels along the expected path.
Steering with Phased Arrays. The most complicated form of beam steering involves the use ofphased-array concepts derived from radar (for example, Steinberg, 1976; Thurstone, 1973;Thomenius, 1996). Most ultrasonic phased-array transducers have between 64 and 128 elements.Transmit beam steering in phased-array systems is achieved by adding an incremental delay to thefiring time of each of the array elements that is linearly related to the position of that element in thearray. Similarly, during reception the delay that is applied to each of the echoes received by the arrayelements is incremented or decremented by a position-dependent factor. This differential time delayt is given by
(25.3)
where xn is the location of the array element n and is the desired beam steering angle. Theapplication of such a delay increment during reception is illustrated in Figure 25.10. Since the beam
FIGURE 25.9 Steering by element selection for a curvilinear array. The beam will shift to a new location as the center ofthe active aperture is shifted over the entire array.
Downloaded from Digital Engineering Library @ McGraw-Hill (www.digitalengineeringlibrary.com)Copyright © 2004 The McGraw-Hill Companies. All rights reserved.
Any use is subject to the Terms of Use as given at the website.
INSTRUMENTATION DESIGN FOR ULTRASONIC IMAGING
25.14 DESIGN OF MEDICAL DEVICES AND DIAGNOSTIC INSTRUMENTATION
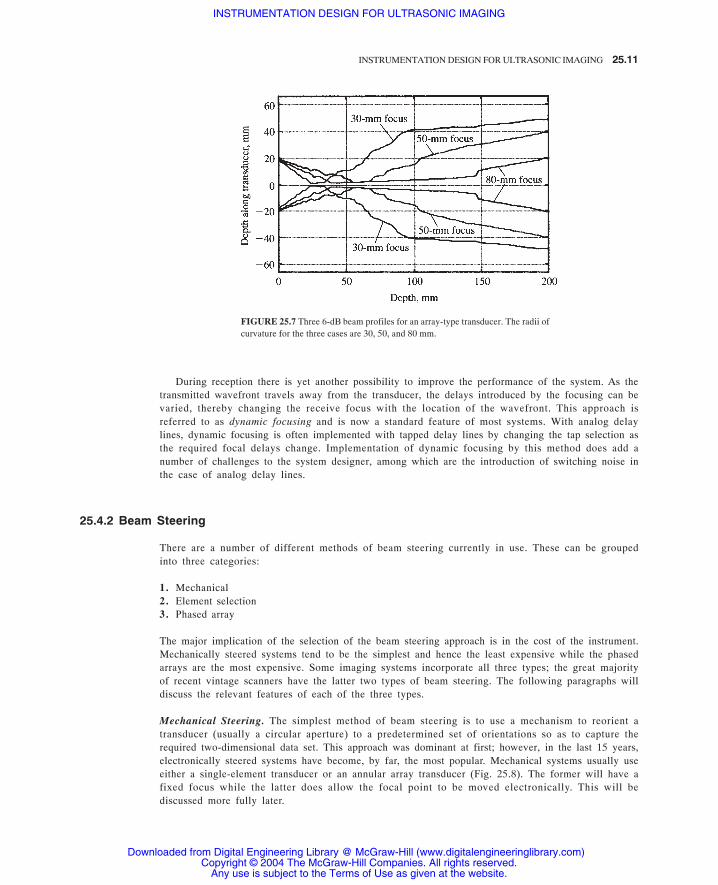
steering angle is such that the echoes will reach the array elements toward the bottom of the figurefirst, the longest delays will be imposed on the echoes from those elements. Since the wavefront islinear, the arrival times of the remaining echoes have a linear relationship, hence the linear decrementon the delays from one element to the next.
In addition to beam steering, one can combine focusing and beam steering delays in the sameprocess. This is illustrated in Figure 25.11. Echoes from a near-field point source (at 40 mm) areshown arriving at the array elements. The arrival times of the echoes have a nonlinear component so
FIGURE 25.10 Beam steering in a phased-array system during reception. A linearlyincreasing time delay differential is introduced for each of the delay lines to correctfor the linear time difference in the arrival times.
FIGURE 25.11 Schematic of beam steering and focusing during reception in a phasedarray type system. In addition to the focusing correction (also shown in Fig. 25.4),phased-array systems add a linearly increasing time shift to the receive delay lines toachieve constructive interference in the desired direction.
Downloaded from Digital Engineering Library @ McGraw-Hill (www.digitalengineeringlibrary.com)Copyright © 2004 The McGraw-Hill Companies. All rights reserved.
Any use is subject to the Terms of Use as given at the website.
INSTRUMENTATION DESIGN FOR ULTRASONIC IMAGING

INSTRUMENTATION DESIGN FOR ULTRASONIC IMAGING 25.15
the delay lines cannot compensate with a simple linear increment as in Figure 25.10. It can be showneasily that the differential time delay between channels can be determined from the law of cosines.
As the process of steering and focusing is repeated for a sequence of look angles, a sector-shapedimage data set is acquired. The line density available from phased-array scanners is not as restrictedas with curvilinear arrays, but some limitations exist in certain systems, due to the relatively large sizeof delay increments available in tapped delay lines. Heterodyned systems and digital beamformershave less limitations in this area.
All linear and curvilinear array systems have limitations or design constraints associated with theexistence of grating lobes, which are due to leakage of acoustic energy in unwanted angles. It turnsout that for certain larger center-to-center array element spacings, there will be constructiveinterference at look angles other than the main beam. This difficulty is particularly serious for thecase of phased-array systems because of the need for beam steering. It turns out that the grating lobesmove with the steering angle and can be brought into the visible region by the simple act of beamsteering.
Grating lobes can be completely avoided by keeping the center-to-center spacing at one-half thewavelength at the highest contemplated operating frequency. [It turns out this is completelyanalogous to the familiar sampling theorem, which states the temporal sampling has to occur at afrequency that is twice that of the highest spectral component of the signal being processed(Steinberg, 1976).] This has the drawback of forcing the use of a larger number of array elementsand their processing channels. This, and the expensive processing required for each channel, causesthe phased-array systems to be more expensive than the other types.
A recent development in the area of B-mode imaging is that of imaging of the harmonics generatedduring propagation of acoustic waves in tissue (Averkiou, 1997; Jiang, 1998). While all the discus-sion so far has assumed that the propagation of these waves is linear, this is actually not the case.There is a difference in the speed of sound in the compressional and rarefactional parts of the acousticpressure wave. As a consequence, the positive half of a propagating sine wave will move faster thanthe negative half; this results in the formation of harmonic energy. An image formed from suchharmonics will be superior to that from the fundamental part of the spectrum because of reducedreverberant energy and narrower main beam. The acceptance of this form of imaging has been sorapid that in certain clinical applications (e.g., echocardiology) harmonic imaging is the defaultoperating mode. From the point of view of beam former design, there is relatively little that needs tobe done differently other than developing the ability to transmit at a lower frequency while receivingat twice the transmit frequency.
The sequence of the processing steps between the beam former and the scan conversion is differentamong the various commercial systems but the goals of the steps remain the same. The beam formeroutput will be a wideband RF, an IF, or a complex baseband signal, which will usually be bandpassfiltered to reduce out-of-band noise contributions. In systems with very wideband processing, fre-quency diversity techniques (e.g., split spectrum processing) can be brought into play to try to reducethe impact of coherent interference or speckle.
With most of today’s systems, there is a logarithmic compression of the amplified signal afterbeam formation amplification. The goal of this is to emphasize the subtle gray level differencesbetween the scatterers from the various types of tissues and from diffuse disease conditions.
There are a number of ways that envelope detection has been implemented. In purely analogapproaches, simple full-wave rectification followed by a low-pass filtering has been shown to workquite well. It is also possible to digitize the RF signals earlier in the processing chain, perform the
25.4.3 Harmonic Imaging
25.4.4 Compression, Detection, and Signal Processing Steps
Downloaded from Digital Engineering Library @ McGraw-Hill (www.digitalengineeringlibrary.com)Copyright © 2004 The McGraw-Hill Companies. All rights reserved.
Any use is subject to the Terms of Use as given at the website.
INSTRUMENTATION DESIGN FOR ULTRASONIC IMAGING

25.16 DESIGN OF MEDICAL DEVICES AND DIAGNOSTIC INSTRUMENTATION
compression and detection processes digitally, and use quadrature detection to determine the signalenvelope.
As has been noted earlier, the image data are acquired on a polar coordinate grid for sector scanners(e.g., mechanically steered, curvilinear arrays, and phased-array systems) and in a rectangular gridfor linear arrays. It is clearly necessary to convert this image data into one of the standard TV rasterformats for easier viewing, recording, computer capture, etc. This is performed in a module in mostsystems referred to as the scan converter. The major function of the scan converter is that ofinterpolation from, say, a polar data grid to that of the video pixel space. Given the data ratesrequired, it is a challenging task but one that most commercial systems appear to have well undercontrol.
The early scan converters used several clever schemes to accomplish the required function. Forexample, with sector scanners, certain systems would modulate the A/D converter sampling rate bythe look angle of the beam former in such a way that every sample would fall onto a raster line. Oncethe acoustic frame was completed, and the data along each horizontal raster line was read out, simpleone-dimensional interpolation was performed (Park, 1984). The need for more sophisticatedprocessing brought about two-dimensional interpolation methods. Among the first in this area wereLarsen et al. (Larsen, 1980), whose approach involved the use of bilinear interpolation. With theLarsen et al. approach, the sampling rate along each scan line was held at a uniform value which washigh enough meet the sampling theorem requirements. With two axial samples along two adjacentacoustic lines, the echo strength values at each of the pixels enclosed by the acoustic samples weredetermined. This could be done by either (1) interpolating angularly new axial sample values alonga synthetic acoustic ray that traversed through the pixel in question and then performing an axialinterpolation along the synthetic ray or (2) interpolating a new axial sample along both real acousticrays and then performing the angular interpolation. This basic approach has become the most widelyused scan conversion method among the various manufacturers and seems to have stood the test oftime.
More recently, researchers have continued to study the scan conversion problem with differentapproaches. For example, Berkhoff et al. have evaluated “fast algorithms” for scan conversion, i.e.algorithms which might be executed by software as opposed to dedicated hardware. Given the rapidtrend to faster, more powerful, and cost-effective computers and their integration with ultrasoundsystems, it is likely that more of the scan conversion function will be done in software. Berkhoff etal. recommend two new algorithms which they compare with several conventional interpolators(Berkhoff, 1994). With the speed of computers improving at a steady pace, these approaches areincreasingly attractive (Chiang, 1997). In other work, with the cost of some of the hardwarecomponents such as A/D converters coming down, oversampling the acoustic line data may permitthe replacement of bilinear interpolation with simple linear interpolation (Richard and Arthur, 1994).Oversampling by a factor of two along with linear interpolation was found to be superior to bilinearinterpolation under certain specific circumstances. It is clear there is additional work in this area yet.
This chapter has reviewed the fundamentals of the design of ultrasound scanners with a particularfocus on the beam formation process. Different types of image data acquisition methods are de-scribed.
25.5 SIGNAL PROCESSING AND SCAN CONVERSION
25.6 SUMMARY
Downloaded from Digital Engineering Library @ McGraw-Hill (www.digitalengineeringlibrary.com)Copyright © 2004 The McGraw-Hill Companies. All rights reserved.
Any use is subject to the Terms of Use as given at the website.
INSTRUMENTATION DESIGN FOR ULTRASONIC IMAGING

INSTRUMENTATION DESIGN FOR ULTRASONIC IMAGING 25.17
Averkiou, M. A., Roundhill, D. N., and Powers, J. E., (1997), “A new imaging technique based on the nonlinear properties of
tissues,” IEEE Ultrasonics Symposium Proceedings, pp. 1561–1566.
Berkhoff, A. P., Huisman, H. J., Thijssen, J. M., Jacobs, E. M. G. P., and Roman, R. J. F. (1994), “Fast scan conversion algorithms
for displaying ultrasound sector images,” Ultrasonic Imaging, 16:87–108.
Chiang, A. M., and Broadstone, S. R. (1997), “Portable Ultrasound Imaging System,” U.S. Patent 5,590,658, issued January 7.
Christensen, D. A. (1988), Ultrasonic Bioinstrumentation, Chap. 6, John Wiley & Sons, New York.
Fink, M. (1992), “Time reversal of ultrasonic fields: Part I—Basic Principles,” IEEE Trans. Ultrason. Ferroelec. Freq. Contr.,
39:555–566.
Flax, S. W., and O’Donnell, M. (1988), “Phase aberration correction using signals from point reflectors and diffuse scatterers:
Basic principles,” IEEE Trans. Ultrason. Ferroelec. Freq. Contr., 35:758–767.
Goldberg, B. B., and Kurtz, A. B. (1990), Atlas of Ultrasound Measurements, Year Book Medical Publishers, Chicago.
Hunt, J. W., Arditi, M., and Foster, F. S. (1983), “Ultrasound transducers for pulse-echo medical imaging,” IEEE Trans. Biomed.
Eng., 30:453–481.
Jiang, P., Mao, Z., and Lazenby, J. (1998), “A New Tissue Harmonic Imaging Scheme with Better Fundamental Frequency Cancel-
lation and Higher Signal-To-Noise Ratio,” Proceedings, IEEE Ultrasonics Symposium.
Krishnan, S., Li, P.-C., O’Donnell, M. (1996), “Adaptive compensation of phase and magnitude aberrations,” IEEE Trans.
Ultrason. Ferroelect. Freq. Control, vol. 43, pp. 44–55, January.
Larsen, H. G., and Leavitt, S. C. (1980), “An image display algorithm for use in real-time sector scanners with digital scan
conversion,” IEEE Ultrasonics Symposium Proceedings, pp. 763–765.
Li, P.-C., and O’Donnell, M. (1995), “Phase aberration correction on two-dimensional conformal arrays,” IEEE Trans. Ultrason.
Ferroelec. Freq. Contr., 42:73–82.
Macovski, A. (1983), Medical Imaging Systems, chap. 10, Prentice-Hall, Englewood Cliffs, N.J.
Maslak, S. H., (1979), “Acoustic Imaging Apparatus,” U.S. Patent 4,140,022, issued February 20.
Mucci, R. A. (1984), “A comparison of efficient beamforming algorithms,” IEEE Trans. Ac., Speech, Sig. Proc., 32:548–558.
Nock, L., Trahey, G. E., and Smith, S. W. (1988), “Phase aberration correction in medical ultrasound using speckle brightness as
a quality factor,” J. Acoust. Soc. Am., 85:1819–1833.
O’Donnell, M. O., and Flax, S. W. (1988), “Phase aberration measurements in medical ultrasound: human studies,” Ultrasonic
Imaging, 10:1–11.
Park, S. B., and Lee, M. H. (1984), “A new scan conversion algorithm for real-time sector scanner,” IEEE Ultrasonics Symposium
Proceedings, pp: 723–727.
Richard, W. D., and Arthur, R. M. (1994) “Real-time ultrasonic scan conversion via linear interpolation of oversampled vectors,”
Ultrasonic Imaging, 16:109–123.
Rigby, K. W. (2000), “Real-time correction of beamforming time delay errors in abdominal ultrasound imaging,” Proc. SPIE,
3982:342–353.
Sarti, D. A. (1987), Diagnostic Ultrasound—Text and Cases, Year Book Medical Publishers, Chicago.
Schafer, M. E., Lewin, P. A. (1984), “The influence of front-end hardware on digital ultrasonic imaging,” IEEE Trans. Ultrason.
Ferroelec. Freq. Contr., 31:295–306.
Schafer, M. E., and Lewin, P. A. (1989), “Transducer characterization using the angular spectrum method,” J. Acoust. Soc. Amer.,
85:2202–2214.
Silverstein, S. D. (2001), “A Robust Auto-focusing Algorithm for Medical Ultrasound: Consistent Phase References from Scaled
Cross-correlation Functions,” IEEE Signal Processing Letters, 8(6): 177–179.
Steinberg, B. D. (1976), Principles of Aperture and Array System Design, Wiley, New York.
Steinberg, B. D. (1992), “Digital Beamforming in Ultrasound,” IEEE Trans, on Ultrasonics, Ferro., and Freq. Cont., 39(6):
716–721, November.
REFERENCES
Downloaded from Digital Engineering Library @ McGraw-Hill (www.digitalengineeringlibrary.com)Copyright © 2004 The McGraw-Hill Companies. All rights reserved.
Any use is subject to the Terms of Use as given at the website.
INSTRUMENTATION DESIGN FOR ULTRASONIC IMAGING
25.18 DESIGN OF MEDICAL DEVICES AND DIAGNOSTIC INSTRUMENTATION
Thomenius, K. E. (1996), “Evolution of Ultrasound Beamforming,” Proc. IEEE Ultrasonics Symposium, IEEE Cat. No.
96CH35993, pp. 1615–1622.
Thurstone, F. L., and von Ramm, O. T. (1973), “A new ultrasound imaging technique employing two-dimensional electronic beam
steering,” vol. 5 in Acoustical Holography, Booth Newell (ed.), pp. 249–259, Plenum Press, New York.
Trahey, G. E., and Smith, S. W. (1988), “Properties of acoustical speckle in the presence of phase aberration. Part I: first-order
statistics,” Ultrasonic Imaging, 10:12–28.
Wells, P. N. T. (1977), Biomedical Ultrasonics, Academic Press, San Diego.
Zhu, Q., and Steinberg, B. D. (1993a), “Wavefront amplitude distortion and image sidelobe levels: Part I—Theory and computer
simulations,” IEEE Trans. Ultrason. Ferroelec. Freq. Contr., 40:747–753.
Zhu, Q., and Steinberg, B. D. (1993b), “Wavefront amplitude distortion and image sidelobe levels: Part II—In vivo experiments,”
IEEE Trans. Ultrason. Ferroelec. Freq. Contr., 40:754–762.
Downloaded from Digital Engineering Library @ McGraw-Hill (www.digitalengineeringlibrary.com)Copyright © 2004 The McGraw-Hill Companies. All rights reserved.
Any use is subject to the Terms of Use as given at the website.
INSTRUMENTATION DESIGN FOR ULTRASONIC IMAGING