Chapter 24A DUnboyne Statistical Analysis
27
CHAPTER 24A DUNBOYNE STATISTICAL ANALYSIS 1 Chapter 24 A: Dunboyne Statistical Analysis The statistical analysis provided here is based on the institutional records provided to the Commission. The Commission compiled a database from the institutional records and analysed the information on a calendar year basis. In the narrative chapter, statistical information from other sources is described. These other sources are not directly comparable with the Commission’s analysis. For example, almost all the statistical information available from official publications is on an administrative year basis, that is, from 1 April to 31 March. This was the case until about 1980. However, as is clear from the analysis below, the statistical returns made to the Department of Health by the institution are broadly in line with the Commission’s analysis. Statistics from other reports, for example, inspection reports, often relate to a specific day or a non-standard period and so are not directly comparable. In general, the Commission is satisfied that there are no significant differences between its analysis and information from other sources. In a few cases where there are differences, attention is drawn to this in the narrative chapter. Admissions 0 20 40 60 80 100 120 140 160 1955 1956 1957 1958 1959 1960 1961 1962 1963 1964 1965 1966 1967 1968 1969 1970 1971 1972 1973 1974 1975 1976 1977 1978 1979 1980 1981 1982 1983 1984 1985 1986 1987 1988 1989 1990 Dunboyne Total Mothers Admitted per Year
Transcript of Chapter 24A DUnboyne Statistical Analysis

CHAPTER 24A DUNBOYNE STATISTICAL ANALYSIS
1
Chapter 24 A: Dunboyne Statistical Analysis
The statistical analysis provided here is based on the institutional records provided to
the Commission. The Commission compiled a database from the institutional
records and analysed the information on a calendar year basis. In the narrative
chapter, statistical information from other sources is described. These other sources
are not directly comparable with the Commission’s analysis. For example, almost all
the statistical information available from official publications is on an administrative
year basis, that is, from 1 April to 31 March. This was the case until about 1980.
However, as is clear from the analysis below, the statistical returns made to the
Department of Health by the institution are broadly in line with the Commission’s
analysis. Statistics from other reports, for example, inspection reports, often relate to
a specific day or a non-standard period and so are not directly comparable. In
general, the Commission is satisfied that there are no significant differences between
its analysis and information from other sources. In a few cases where there are
differences, attention is drawn to this in the narrative chapter.
Admissions
0
20
40
60
80
100
120
140
160
19
55
19
56
19
57
19
58
19
59
19
60
19
61
19
62
19
63
19
64
19
65
19
66
19
67
19
68
19
69
19
70
19
71
19
72
19
73
19
74
19
75
19
76
19
77
19
78
19
79
19
80
19
81
19
82
19
83
19
84
19
85
19
86
19
87
19
88
19
89
19
90
Dunboyne Total Mothers Admitted per Year

CHAPTER 24A DUNBOYNE STATISTICAL ANALYSIS
2
The Commission identified 3,156 women who were admitted to Dunboyne in the years 1955-
90 from the institutional records.1 Information relating to date of admission was available for
3,138 women (99.4% of admissions). In the years 1955-70, 606 women were admitted -
representing 19.3% of admissions. In the 1950s, 17 women on average were admitted
annually; this increased to 46 average annual admissions in the 1960s. A significant
increase in admissions was recorded in the 1970s peaking in 1973 and 1974; 144 women
were recorded in each year. Although admissions had decreased by 1980 - 113 women
were admitted that year - they increased steadily until 1986 when 143 women were
recorded. Average annual admissions in the late 1980s stood at 117 and 95 women were
recorded in 1990, its last full year in operation.
Analysis by decade shows that most admissions to Dunboyne were recorded in the 1980s
(40.34%) followed closely by the 1970s (39.42%); the 1960s (14.53%); the 1990s (3.03%)
and the 1950s (2.68%). Eight in every ten women admitted to Dunboyne entered the home
in the 1970s and 1980s.
1 Some admission registers relating to the late 1960s and early 1970s are not available, presumed missing from the
Dunboyne institutional records. As a result, the number of admissions identified by the Commission must be regarded as incomplete. Department of Health returns for this period suggest that the discrepancy may amount to 49 women. However, it was not possible to identify the extent of the discrepancy with any great accuracy.
84
456
1237 1266
95
0
200
400
600
800
1000
1200
1400
1600
1950 1960 1970 1980 1990
Dunboyne Total Mothers Admitted by Decade

CHAPTER 24A DUNBOYNE STATISTICAL ANALYSIS
3
Age on admission
Information relating to age on admission was available for 3,139 women (99.5% of
admissions).
The institutional records show that age on admission ranged from 12 to 45 years; the mode
of age on admission was 19 years. The average age on admission in the 1950s was 26
years. This declined to 20 years in the 1970s and 1980s and increased slightly to 21 years
in the 1990s.
Most women (70.5%) were aged between 18 and 29 years on admission; 23.5% were 17
years or younger and 6% were 30 years and older.
Over one in ten of all admissions to Dunboyne (11.7%) were aged between 12 and 16 years
and under the legal age of consent.
0
50
100
150
200
250
300
350
400
450
12 13 14 15 16 17 18 19 20 21 22 23 24 25 26 27 28 29 30 31 32 33 34 35 36 37 38 39 40 41 42 43 44 45
Dunboyne Mothers Age on Admission

CHAPTER 24A DUNBOYNE STATISTICAL ANALYSIS
4
Previous pregnancy
Information relating to previous pregnancy was available for 2,413 women (76.5% of
admissions).
The institutional records show that most women (82.5%) were admitted on their first
pregnancy; 12.6% were admitted on their second pregnancy and 4.9% on their third or
subsequent pregnancy. In the 1950s, over 63% of all admissions were women on their
second or subsequent pregnancy; by the 1980s this cohort represented a much reduced
7.3% of admissions. Conversely, women admitted on their first pregnancy represented
around 12% of admissions in the 1950s but made up over 81% of admissions in the 1980s.
Marital status
Information relating to marital status was available for 2,925 women (92.7% of admissions).
The institutional records show that most women (98.4%) were single. The remaining women
were recorded as married, separated or widowed.
82.5%
12.6%
4.9%
0.0% 10.0% 20.0% 30.0% 40.0% 50.0% 60.0% 70.0% 80.0% 90.0%
1st Pregnancy
2nd Pregnancy
3rd or subsequent Pregnancy
Dunboyne Mothers Previous Pregnancy
CHAPTER 24A DUNBOYNE STATISTICAL ANALYSIS
5
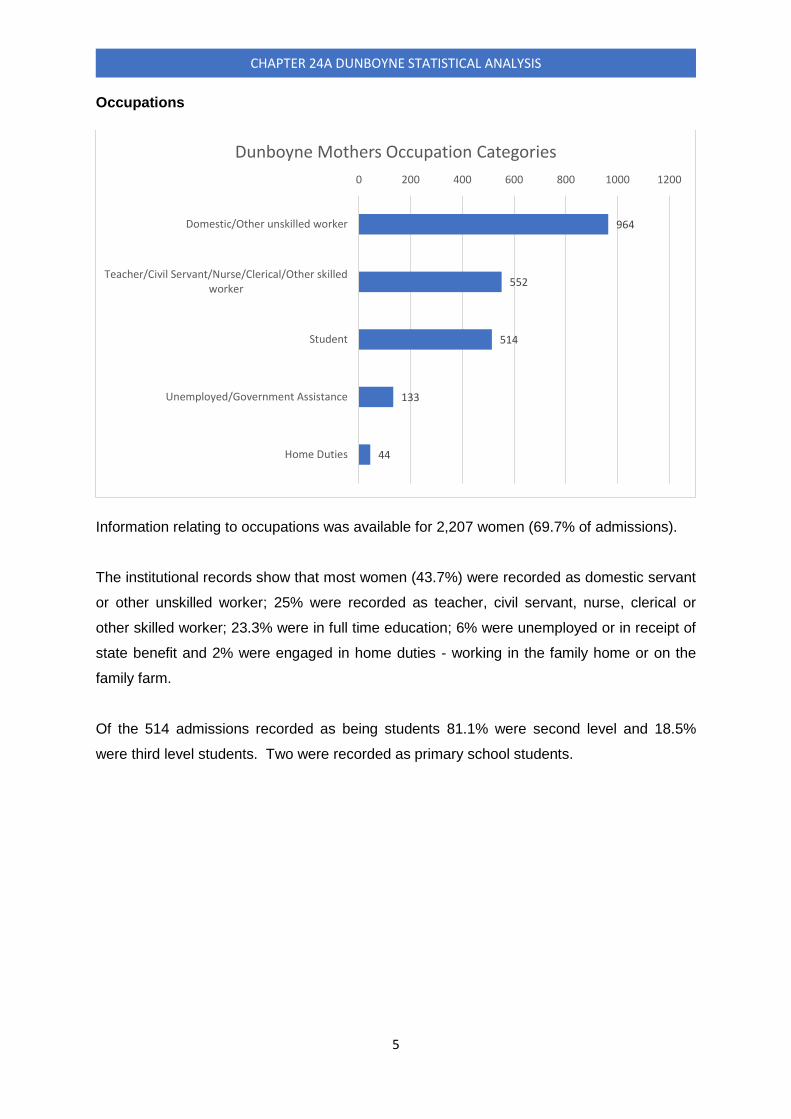
Occupations
Information relating to occupations was available for 2,207 women (69.7% of admissions).
The institutional records show that most women (43.7%) were recorded as domestic servant
or other unskilled worker; 25% were recorded as teacher, civil servant, nurse, clerical or
other skilled worker; 23.3% were in full time education; 6% were unemployed or in receipt of
state benefit and 2% were engaged in home duties - working in the family home or on the
family farm.
Of the 514 admissions recorded as being students 81.1% were second level and 18.5%
were third level students. Two were recorded as primary school students.
964
552
514
133
44
0 200 400 600 800 1000 1200
Domestic/Other unskilled worker
Teacher/Civil Servant/Nurse/Clerical/Other skilledworker
Student
Unemployed/Government Assistance
Home Duties
Dunboyne Mothers Occupation Categories

CHAPTER 24A DUNBOYNE STATISTICAL ANALYSIS
6
Previous address by county
Information relating to previous address by county was available for 3,082 women (97.7% of
admissions).
The institutional records show that most women (18.92%) gave Dublin as their address prior
to entry followed by Cork (10.19%); Meath (7.59%); Wexford (5%); Louth (4.96%);
Westmeath (4.67%); Limerick (4.15%); Cavan (4.06%); Galway (3.86%); Tipperary (3.44%);
Offaly (2.66%); Donegal (2.56%); Waterford (2.53%); Kildare (2.47%); Kilkenny (2.43%);
Mayo (2.3%); Wicklow (2.14%); Laois (2.14%) and Sligo (2.04%). The remaining 11.88% of
women combined gave addresses in Roscommon, Monaghan, Clare, Kerry, Carlow,
Longford, Leitrim, Antrim, Down, Fermanagh, Derry, Tyrone and Armagh.
18.92%
10.19%
7.59%
5.00%
4.96%
4.67%
4.15%
4.06%
3.86%
3.44%
2.66%
2.56%
2.53%
2.47%
2.43%
2.30%
2.14%
2.14%
2.04%
1.91%
1.82%
1.72%
1.65%
1.52%
1.17%
1.01%
0.45%
0.26%
0.13%
0.10%
0.06%
0.06%
0.00% 2.00% 4.00% 6.00% 8.00% 10.00% 12.00% 14.00% 16.00% 18.00% 20.00%
Dublin
Cork
Meath
Wexford
Louth
Westmeath
Limerick
Cavan
Galway
Tipperary
Offaly
Donegal
Waterford
Kildare
Kilkenny
Mayo
Wicklow
Laois
Sligo
Roscommon
Monaghan
Clare
Kerry
Carlow
Longford
Leitrim
Antrim
Down
Fermanagh
Derry
Tyrone
Armagh
Dunboyne Mothers Previous Address By County

CHAPTER 24A DUNBOYNE STATISTICAL ANALYSIS
7
Referral pathways
Information relating to referral pathways to Dunboyne was available for 3,036 women (96.2%
of admissions).
The institutional records show that most women (37.3%) were referred to the institution by
an adoption society - the majority by CPRSI.2 The second most frequent referral pathway
was local boards of assistance/health boards - 34.8% of women were referred by these
bodies. Voluntary organisations - mainly CURA - referred 13% of women to the home; 4.5%
were referred by a priest or nun; 2.9% by a friend of family member; 2% self-referred; 1.5%
2 The majority of referrals to Dunboyne from adoption societies (67%) were through CPRSI. Women were also referred by
St Anne’s Adoption Society; St Patrick’s Guild; St Clare’s Adoption Society; St Bridget’s Adoption Society; Ossory Adoption Society; The Rotunda Girls’ Aid Society and St Catherine’s Adoption Society.
37.3%
34.8%
13.0%
4.5%
2.9%
2.1%
2.0%
1.5%
1.0%
0.6%
0.1%
0.1%
0.0% 5.0% 10.0% 15.0% 20.0% 25.0% 30.0% 35.0% 40.0%
Adoption Society
Board of Assistance
Voluntary Organisation
Religious
Family Member/Friend
All Others Combined
Self-Referral
Social Worker
Magdalen Laundry
Other Institution
Matron County Home
Hospital
Dunboyne Mothers Referral Pathway

CHAPTER 24A DUNBOYNE STATISTICAL ANALYSIS
8
were referred by a social worker; 1% transferred from a Magdalen laundry; 0.8% transferred
from another institution, county home or hospital and the remaining 2.1% combined were
referred by other named individuals, via a nurse, doctor, guard or solicitor or transferred from
an industrial school or supported accommodation.
From the 1950s to the 1970s, referral via a board of assistance/health board was the most
frequent referral pathway; by the 1980s most women were referred by adoption societies. In
the 1950s, only one woman was referred by a priest or nun. In the 1980s, 40 women were
referred in this way. In the 1970s most women referred by a voluntary organisation were
referred by ALLY; in the 1980s most referrals from this sector were from CURA.

CHAPTER 24A DUNBOYNE STATISTICAL ANALYSIS
9
Occupancy
Information relating to average occupancy was available for 3,004 women (95.2% of
admissions).3
On opening, Dunboyne was deemed suitable to accommodate 22 and a maximum of 25
adults. The institutional records show that average occupancy in the years 1955-63 was
generally below maximum accommodation levels. Average occupancy in this period was
greatest in 1957; it may have been operating close to its maximum occupancy limit at that
time. However, Dunboyne did not experience the acute overcrowding which was a perennial
feature of other mother and baby homes. The premises were extended in 1963 and average
occupancy increased steadily from that year. The busiest period of its operation was 1973-
74 when 144 women were admitted in each of those years - average occupancy for those
years was 32 and 31 women respectively.
3 Records for 1969, 1970 and 1971 are incomplete. Average occupancy presented here is based on the
available records.
0
5
10
15
20
25
30
35
19
55
19
56
19
57
19
58
19
59
19
60
19
61
19
62
19
63
19
64
19
65
19
66
19
67
19
68
19
69
19
70
19
71
19
72
19
73
19
74
19
75
19
76
19
77
19
78
19
79
19
80
19
81
19
82
19
83
19
84
19
85
19
86
19
87
19
88
19
89
19
90
19
91
Dunboyne Average Occupancy per Year (Mothers)

CHAPTER 24A DUNBOYNE STATISTICAL ANALYSIS
10
Comparative analysis of admissions per year and average occupancy confirms that, in the
main, Dunboyne was not prone to overcrowding. Average occupancy exceeded annual
admissions on just two occasions - in 1957 and 1961. It should be stressed that the number
of admissions in these years was relatively small and that any overcrowding cited in the
historical record most probably meant having one or two extra women on the premises. The
addition of extra accommodation in 1963 appears to have solved the matter.
0
20
40
60
80
100
120
140
160
19
55
19
56
19
57
19
58
19
59
19
60
19
61
19
62
19
63
19
64
19
65
19
66
19
67
19
68
19
69
19
70
19
71
19
72
19
73
19
74
19
75
19
76
19
77
19
78
19
79
19
80
19
81
19
82
19
83
19
84
19
85
19
86
19
87
19
88
19
89
19
90
19
91
Dunboyne Comparison of Total Mothers Admitted per Year and Average Occupancy
Total Mothers Admitted Average Occupancy

CHAPTER 24A DUNBOYNE STATISTICAL ANALYSIS
11
The occupancy comparison chart shows a comparison between the occupancy recorded in
the Commission’s database (compiled from the institutional records) and returns sent to the
Department of Health by Dunboyne for the years 1957-69 inclusive. Temporary absences
from Dunboyne, which were frequent, are not recorded in the Commission’s database so this
may slightly inflate the Commission’s calculations regarding occupancy. It seems clear,
however, that the numbers forwarded by Dunboyne to the Department of Health are largely
in line with those recorded in the institutional records.
0
5
10
15
20
25
30
35
Dunboyne Occupancy Comparison
MBHCOI Occupancy DoH Occupancy

CHAPTER 24A DUNBOYNE STATISTICAL ANALYSIS
12
Length of stay
Information relating to length of stay was available for 3,004 women (95.2% of admissions).
The institutional records show that the average length of stay in Dunboyne declined from a
high of 582 days on average for women admitted in 1955 to 74 days on average for women
admitted in 1990. Some of the longest length of stays were recorded among women
admitted in 1957 and 1961 (437 and 446 days respectively) - this most likely contributed to
the relative overcrowding previously identified in Dunboyne in those two years.
Women admitted to Dunboyne in the 1950s spent 383 day on average there; women
admitted in the 1970s spent a much reduced 85 days on average there.
In the 1950s, women were admitted to Dunboyne 63 days on average before giving birth; by
the 1980s this had increased to 81 days on average before the birth.
0
100
200
300
400
500
600
19
55
19
56
19
57
19
58
19
59
19
60
19
61
19
62
19
63
19
64
19
65
19
66
19
67
19
68
19
69
19
70
19
71
19
72
19
73
19
74
19
75
19
76
19
77
19
78
19
79
19
80
19
81
19
82
19
83
19
84
19
85
19
86
19
87
19
88
19
89
19
90
Dunboyne Mothers Average Length of Stay in Days

CHAPTER 24A DUNBOYNE STATISTICAL ANALYSIS
13
In the 1950s, most women (52%) left Dunboyne within a year of giving birth. Of those,
17.4% left within 50 days; 18.8% within six months and 15.9% within twelve months. Of the
remaining women, 29% remained in the home for between one and two years after giving
birth and 18.8% remained there for periods of between 25 and 32 months.
1950 1960 1970 1980 1990
A: 50 days or less 12 115 775 661 46
B: 51-180 days 13 174 84 7 1
C: 181-365 days 11 38 4
D: 366-700 days 20 38 1 1
F: Over 700 days 13 13
0
100
200
300
400
500
600
700
800
900
Dunboyne Mothers Length of Stay After Birth

CHAPTER 24A DUNBOYNE STATISTICAL ANALYSIS
14
This pattern altered somewhat in the 1960s. In that decade 30.4% of women left within 50
days of giving birth and a further 46% left within six months. Just over 10% of women
remained in the home for between six months and one year and a further 10% remained
there for between 12 and 24 months. The percentage of woman who remained in the home
for over two years had reduced from 18.8% in the 1950s to 3.4% in the 1960s. The longest
recorded stay after birth in the 1960s was 32 months.
By the 1970s the pattern had altered significantly. By this time 89.7% of women had left
Dunboyne within 50 days of giving birth and 9.7% within six months. Just four women
remained in the home for between six and twelve months and one woman remained for 403
days.
In the 1980s, 98.8% of women left Dunboyne within 50 days of giving birth and most of the
others had left within three months. One woman remained in the home for a little over one
year. In the 1990s, all but one woman left the institution within 50 days of giving birth.
Place of birth
Information relating to place of birth was available for 2,773 women (87.9% of admissions).
88.5%
11.2%
0.3%
0.0% 10.0% 20.0% 30.0% 40.0% 50.0% 60.0% 70.0% 80.0% 90.0% 100.0%
Holles Street (N.M.H.)
Gave Birth Elsewhere
Dunboyne
Dunboyne Place of Birth
CHAPTER 24A DUNBOYNE STATISTICAL ANALYSIS
15
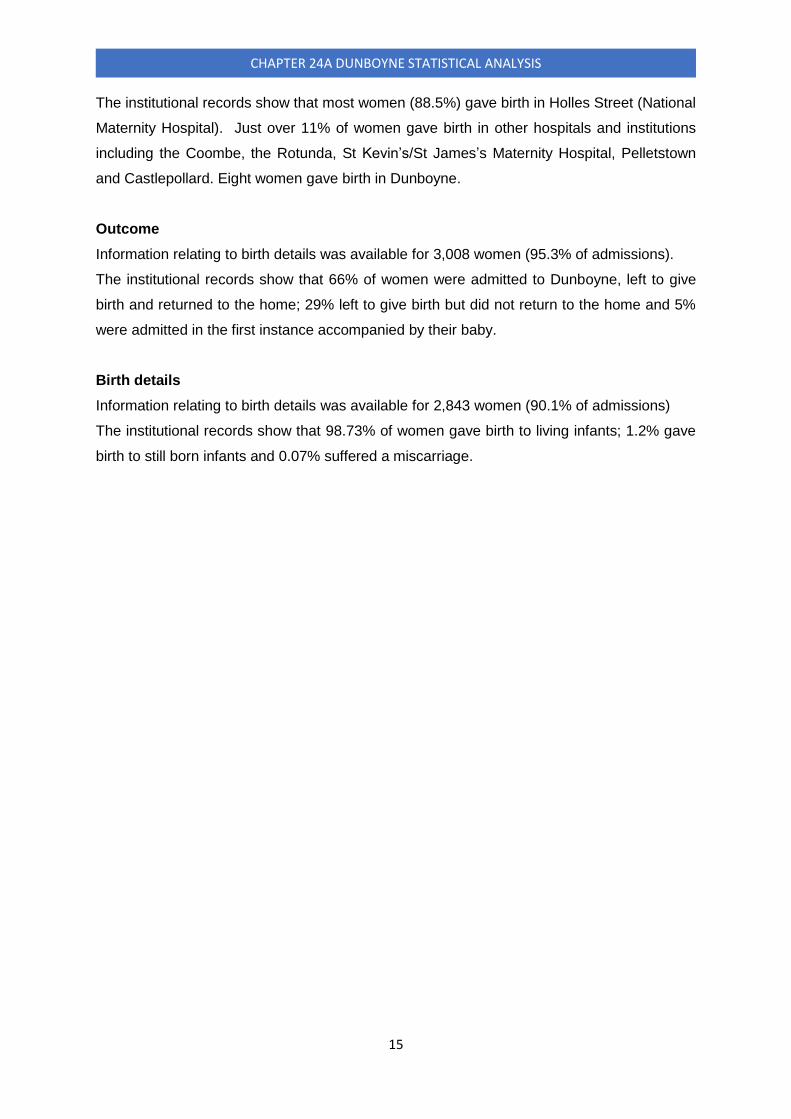
The institutional records show that most women (88.5%) gave birth in Holles Street (National
Maternity Hospital). Just over 11% of women gave birth in other hospitals and institutions
including the Coombe, the Rotunda, St Kevin’s/St James’s Maternity Hospital, Pelletstown
and Castlepollard. Eight women gave birth in Dunboyne.
Outcome
Information relating to birth details was available for 3,008 women (95.3% of admissions).
The institutional records show that 66% of women were admitted to Dunboyne, left to give
birth and returned to the home; 29% left to give birth but did not return to the home and 5%
were admitted in the first instance accompanied by their baby.
Birth details
Information relating to birth details was available for 2,843 women (90.1% of admissions)
The institutional records show that 98.73% of women gave birth to living infants; 1.2% gave
birth to still born infants and 0.07% suffered a miscarriage.
CHAPTER 24A DUNBOYNE STATISTICAL ANALYSIS
16
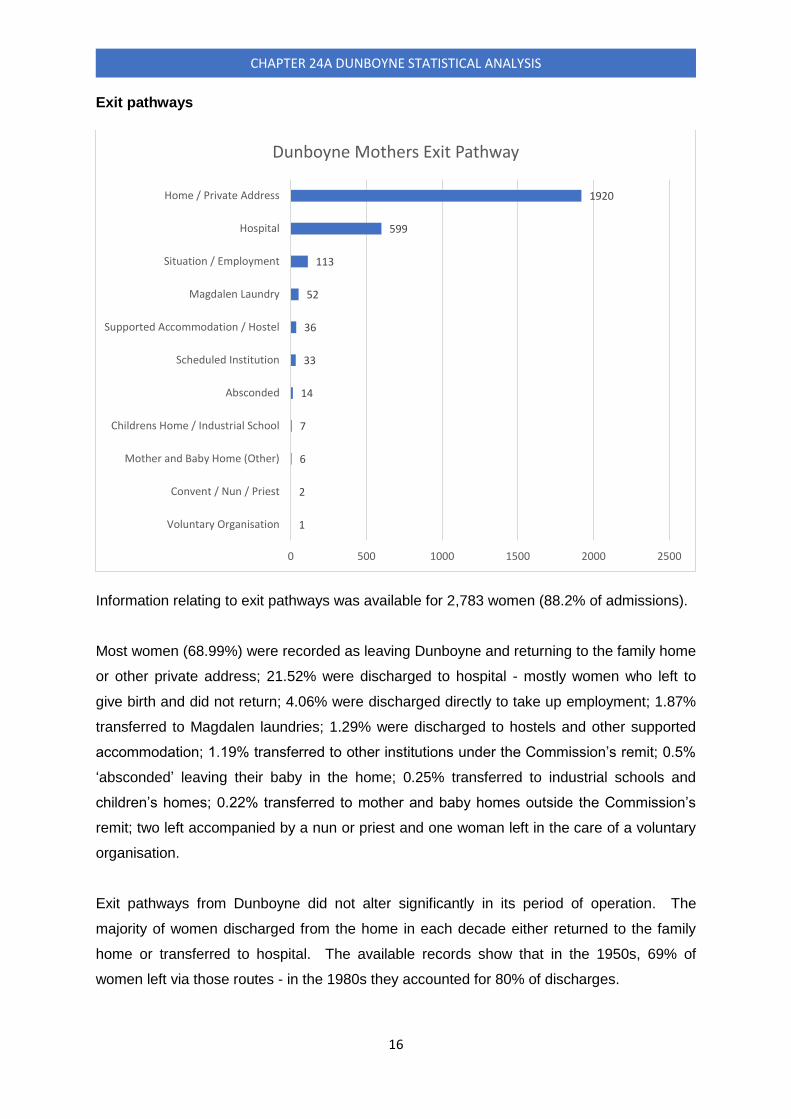
Exit pathways
Information relating to exit pathways was available for 2,783 women (88.2% of admissions).
Most women (68.99%) were recorded as leaving Dunboyne and returning to the family home
or other private address; 21.52% were discharged to hospital - mostly women who left to
give birth and did not return; 4.06% were discharged directly to take up employment; 1.87%
transferred to Magdalen laundries; 1.29% were discharged to hostels and other supported
accommodation; 1.19% transferred to other institutions under the Commission’s remit; 0.5%
‘absconded’ leaving their baby in the home; 0.25% transferred to industrial schools and
children’s homes; 0.22% transferred to mother and baby homes outside the Commission’s
remit; two left accompanied by a nun or priest and one woman left in the care of a voluntary
organisation.
Exit pathways from Dunboyne did not alter significantly in its period of operation. The
majority of women discharged from the home in each decade either returned to the family
home or transferred to hospital. The available records show that in the 1950s, 69% of
women left via those routes - in the 1980s they accounted for 80% of discharges.
1920
599
113
52
36
33
14
7
6
2
1
0 500 1000 1500 2000 2500
Home / Private Address
Hospital
Situation / Employment
Magdalen Laundry
Supported Accommodation / Hostel
Scheduled Institution
Absconded
Childrens Home / Industrial School
Mother and Baby Home (Other)
Convent / Nun / Priest
Voluntary Organisation
Dunboyne Mothers Exit Pathway

CHAPTER 24A DUNBOYNE STATISTICAL ANALYSIS
17
Child admissions
The Commission established that 1,148 children were admitted to Dunboyne in the years
1955-90.4
Information relating to date of admission was available for 1,098 children (95.6% of
admissions). In the period 1955-62, 15 children on average were admitted annually; 20
children were admitted in the years 1958 and 1960. Child admissions began to increase
steadily in 1963; extra accommodation had been added that year. Child admissions peaked
in 1971, when 80 admissions were recorded, and remained relatively high until 1976. A
steady decline in admissions was recorded thereafter falling from 66 in 1976 to 17 in 1980.
Admissions remained relatively low during the 1980s; during 1982-90 just two children on
average were admitted annually.
4 Some admission registers relating to the late 1960s and early 1970s are not available, presumed missing, from the
Dunboyne institutional records. As a result, the number of admissions identified by the Commission must be regarded as incomplete. Department of Health returns for this period suggest that the discrepancy may amount to 65 children. However, it was not possible to identify the extent of the discrepancy with any great accuracy.
0
10
20
30
40
50
60
70
80
90
19
55
19
56
19
57
19
58
19
59
19
60
19
61
19
62
19
63
19
64
19
65
19
66
19
67
19
68
19
69
19
70
19
71
19
72
19
73
19
74
19
75
19
76
19
77
19
78
19
79
19
80
19
81
19
82
19
83
19
84
19
85
19
86
19
87
19
90
Dunboyne Total Children Admitted per Year

CHAPTER 24A DUNBOYNE STATISTICAL ANALYSIS
18
Analysis by decade shows that most children (53.83%) were admitted in the 1970s followed
by the 1960s (34.97%); 1950s (6.74%); 1980s (4.37%) and the 1990s (0.09%).
In the 1950s, 88% of children born to women admitted to Dunboyne were subsequently
admitted to the home. This decreased to 84% in the 1960s, to 47.77% in the 1970s and to
3.79% in the 1980s. Although 95 women were admitted to Dunboyne in 1990 just one child
was admitted to the home that year.
74
384
591
48 1
0
100
200
300
400
500
600
700
1950 1960 1970 1980 1990
Dunboyne Total Children Admitted per Decade

CHAPTER 24A DUNBOYNE STATISTICAL ANALYSIS
19
The institutional records show that, of the 1,148 children admitted to Dunboyne, 98.9% were
admitted accompanied by their mothers; 0.6% were admitted with expectant women and
0.5% were admitted unaccompanied.
1135
7
6
0 200 400 600 800 1000 1200
Admitted with Mother
Sibling Admitted with Mother
Admitted Unaccompanied
Dunboyne Breakdown of Children Admitted

CHAPTER 24A DUNBOYNE STATISTICAL ANALYSIS
20
Occupancy
Information relating to average occupancy was available for 882 children (76.8% of
admissions).
Child occupancy in Dunboyne was highest in the period 1956-69; an average of 17 children
were living in the home in this period. Occupancy peaked in 1965 and 1966; an average of
22 and 21 children respectively were living in the home in those years. Average child
occupancy exceeded admissions in 1957, 1959, 1961 and 1962. After extra accommodation
was added in 1963, average occupancy remained well below admissions from there on in.
Although child admissions to Dunboyne increased significantly in the 1970s, average
occupancy decreased to single digits. This is most likely attendant on the decrease in the
0
10
20
30
40
50
60
70
80
90
19
55
19
56
19
57
19
58
19
59
19
60
19
61
19
62
19
63
19
64
19
65
19
66
19
67
19
68
19
69
19
70
19
71
19
72
19
73
19
74
19
75
19
76
19
77
19
78
19
79
19
80
19
81
19
82
19
83
19
84
19
85
19
86
19
87
19
88
19
89
19
90
Dunboyne Comparison of Total Children Admitted per Year and Average Occupancy
Total Children Admitted Average of Occupancy

CHAPTER 24A DUNBOYNE STATISTICAL ANALYSIS
21
number of women who returned to Dunboyne after giving birth and the increase in the
number of women who left the institution within 50 days of giving birth.
The occupancy comparison chart shows a comparison between child occupancy recorded in
the Commission’s database (compiled from the institutional records) and returns made to the
Department of Health by Dunboyne for the years 1957-69 inclusive. Temporary absences
from Dunboyne, such as cases where a child was receiving treatment in hospital, are not
included in the Commission’s calculations so this may slightly inflate the Commission’s
calculations regarding occupancy. It seems clear, however, that the numbers forwarded by
Dunboyne to the Department of Health are largely in line with those recorded in the
institutional records.
0
5
10
15
20
25
Occupancy Comparison
MBHCOI Occupancy DoH Occupancy

CHAPTER 24A DUNBOYNE STATISTICAL ANALYSIS
22
Child length of stay
Information relating to length of stay was available for 882 children (76.8% of admissions).
Children admitted to Dunboyne in the 1950s spent the longest periods in the home. The
average stay in that decade was 379 days and ranged between 569 days on average in
1955 to 325 days on average in 1958. Although child length of stay in 1961 was relatively
high - 476 days was the average stay that year - by 1970 average length of stay had fallen
dramatically to 63 days. By 1978 average length of stay had decreased to just eight days.
Although average length of stay increased in the years 1979-81 average length of stay for
the remainder of the 1980s was between one and six days.
Child discharge relative to Mother
Information relating to child discharge relative to the mother was available for 899 children
(78.3% of admissions).
The institutional records show that most children (71%) were discharged from Dunboyne on
the same date as their mothers; 21% were discharged while their mothers remained in the
home and 8% remained in the home for periods subsequent to their mothers’ discharge.
0
100
200
300
400
500
600
19
55
19
56
19
57
19
58
19
59
19
60
19
61
19
62
19
63
19
64
19
65
19
66
19
67
19
68
19
69
19
70
19
71
19
72
19
73
19
74
19
75
19
76
19
77
19
78
19
79
19
80
19
81
19
82
19
83
19
84
19
85
19
86
19
87
19
90
Child Average Days Stayed by Year of Admission

CHAPTER 24A DUNBOYNE STATISTICAL ANALYSIS
23
Child exit pathways
Information relating to child exit pathways was available for 1,121 children (97.7% of
admissions).
The institutional records show that most children (68.2%) were placed for adoption - mainly
through St Clare’s Adoption Society, Stamullen, and the CPRSI; 22.2% were discharged
with their mother or another family member; 8.9% transferred to other institutions - mainly
children’s homes and hospitals - and 0.6% were boarded out.
The available records show that, in the 1950s, 39.66% of children discharged from
Dunboyne were placed for adoption. This increased to 71.16% in the 1960s but had
decreased to 44.44% by the 1980s. In the 1950s, 32.76% of children left Dunboyne with
their mother or other family member. This decreased to 20.9% in the 1960s but had
increased to 50% by the 1980s. In the 1950s, 20.69% of children (1 in every 5) transferred
to other institutions - by the 1960s, 5.56% of children exited the home via this route.
765
249
100
7
0 100 200 300 400 500 600 700 800 900
Adoption (post 1952)
With Mother/Family
To Other Institution
Boarded Out
Dunboyne Exit Pathways (Institutional Records)

CHAPTER 24A DUNBOYNE STATISTICAL ANALYSIS
24
Foreign adoptions
The Commission identified 47 children who were placed for foreign adoption from Dunboyne.
Most children (89.4%) were adopted in the USA; 8.5% in Great Britain and 2.1% were
adopted in Northern Ireland.
42
4
1
0 5 10 15 20 25 30 35 40 45
USA
Great Britain
Northern Ireland
Dunboyne Foreign Adoptions

CHAPTER 24A DUNBOYNE STATISTICAL ANALYSIS
25
Child deaths
The Commission identified 37 child deaths associated with Dunboyne. These include one
child who died in Dunboyne; five who were admitted to Dunboyne and died elsewhere and
31 children who were never admitted to Dunboyne but whose mothers had been living in the
home prior to their birth.
The child who died in Dunboyne was born in Holles St and admitted with the mother when
five days old. The child died in Dunboyne aged 27 days; the cause of death was notified as
pneumonia.
Information relating to date of death was available for 34 of the 37 children. The available
records show that 33 were born in Holles St hospital5 - 20 subsequently died there; five died
in Our Lady’s Children’s Hospital, Crumlin; three in Temple St Children’s Hospital; two in the
Rotunda Hospital and one in Dunboyne. Place of death was not available for the remaining
cases.
The worst year for child deaths was 1975 - five children died that year. All five were born in
Holles St hospital to women transferred from Dunboyne - three subsequently died in Holles
St and the others died following transfer to Temple Street and Our Lady’s Children’s
Hospital.
5 The birth place of the remaining child was not identified.
0
1
2
3
4
5
6
1958 1959 1962 1965 1966 1967 1968 1971 1972 1973 1974 1975 1976 1978 1982 1983 1984 1986 1987 1989
Dunboyne Total Child Deaths per Year

CHAPTER 24A DUNBOYNE STATISTICAL ANALYSIS
26
Age at death
Information relating to age on death was available for 32 of 37 child deaths.
All deaths occurred in infancy as follows: Perinatal (0-7 days) 65.6%; Neonatal (8-28 days)
15.6% and Infant (29-365 days) 18.8%.
65.63%
15.63%
18.75%
0.00%
10.00%
20.00%
30.00%
40.00%
50.00%
60.00%
70.00%
1. Perinatal 2. Neonatal 3. Infant
Dunboyne Child Deaths Age on Death

CHAPTER 24A DUNBOYNE STATISTICAL ANALYSIS
27
Cause of death
Information relating to cause of death was available for 32 of the 37 child deaths (86.5%).
Most deaths (37.5%) were notified as being due to one off incidents of sudden infant death
syndrome; potter syndrome; pyloric stenosis; congenital malformation and perinatal
asphyxia. Respiratory infections - mainly bronchopneumonia - accounted for 28.1% of
deaths; 15.6% were notified as spina bifida; 12.5% as non-specific causes - generally
prematurity and 6.3% were notified as congenital heart disease.
The Commission located a GRO death record for 32 of the 37 children.
12
9
5
4
2
0 2 4 6 8 10 12 14
Other
Respiratory Infections
Spina Bifida
Non-specific
Congenital Heart Disease
Dunboyne Child Deaths Cause of Death Category
![A L ‘Thorntons’] A - Environmental Protection Agency · 2016. 7. 25. · ‘Thorntons’] A L A Thorntons Recycling Centre Dunboyne Industrial Estate, Dunboyne, Co. Meath Waste](https://static.fdocuments.net/doc/165x107/60de77d668633c294a6fd3c3/a-l-athorntonsa-a-environmental-protection-2016-7-25-athorntonsa.jpg)