Synthesis, Characterization, Antimicrobial Investigation ...

28
CHAPTER 2
SYNTHESIS, GROWTH AND CHARACTERIZATION OF
AMINO ACIDS ADMIXTURED L-ARGININE PHOSPHATE
MONOHYDRATE SINGLE CRYSTALS
2.1 INTRODUCTION
The development of semiorganic nonlinear optical (SONLO)
materials leads to novel applications, such as frequency conversion by NLO
crystals, light amplitude and phase modulation by Electro optic (EO) crystals
and phase conjugation by photorefractive crystals. Most of the organic NLO
crystals are constituted by weak van der Waals and hydrogen bonds with
conjugated electrons. Hence, they are soft in nature and hence difficult to
cut and polish the crystals and also they have intense absorption in UV region.
In view of these difficulties, a new type of NLO materials have been built
from organic-inorganic complexes, which form stronger ionic bond than the
van der Waals and hydrogen bonds, thus increasing the mechanical strength
of these semiorganic crystals. The invention of L-arginine phosphate
monohydrate enhanced the search for new materials in the single crystalline
form to fulfill the needs in the field of nonlinear optics and comparable with
potassium dihydrogen phosphate (Xu et al 1983). It is very important for an
NLO material to have excellent phase matching to get more conversion
efficiency. LAP crystals posses phase matching angles varying from 29 to
35 , since the phase matching angles are depending on the wavelength used
and the temperature. Attempts have been made on the synthesis of other salts

29
of L-arginine because of their excellent nonlinear optical properties. Monaco
et al (1987) identified several salts of L-arginine derivatives with better NLO
properties than KDP and verified the linear and nonlinear optical properties.
Fuchs et al (1989) reported the mechanical and thermal properties of LAP
crystals. It has been reported that the surface compliances of LAP are 2 to 3
times larger than those of KDP and the volume compressibility of LAP is
about twice as large as that of KDP. These mechanical differences are
probably attributable to the open, hydrogen bonded network structure of LAP.
LAP is strongly plastic material and it is 2.5 times softer than KDP. Even a
small stress applied during handling of the crystals will make deformation at
the surface. LAP undergoes an irreversible endothermic transition at around
130oC with the free energy of 250 J/g. Direct observation of heated LAP
shows that the crystal begins to soften above 100oC and then liquefies at 120
– 140oC. Above 15oC, other volatile substances are produced due to ammonia
molecule. Colored solution is formed by thermal as well as photo-induced
disintegration of L-arginine molecule.
The quest for various frequency conversion materials is
concentrated on semiorganic crystals due to their large nonlinearity, high
resistance to laser induced damage, low angular sensitivity and good
mechanical hardness (Haja Hameed et al 1999, 2003 and Packiam Julius
2004). Effect of amino acid mixing on the properties of various NLO crystals
have been investigated (Arunmozhi et al 1997, Aravazhi et al 1997 and Haja
Hameed et al 2005a). Growth and characterization of some amino acid doped
L-arginine phosphate crystals have been investigated by Joseph Arulpragasam
et al (2006). Mohan kumar et al (2001) investigated the effect of L-lysine in
TGS and TGSP Single crystals. The aim of the present work was to study the
influence of amino acids on the characteristics of LAP crystals. The neutral
amino acids - glycine, L-alanine and L-valine have been separately mixed
with L-arginine phosphate and the crystals of dimensions around 20x17x7

30
mm3 have been grown. The doping effect on growth and characterization
studies such as X- ray powder diffraction (XRD), Fourier transform infrared
(FTIR) and thermo gravimetric analyses and differential thermo gravimetric
analyses (TG & DTG) has been studied.
2.2 STRUCTURE OF L-ARGININE PHOSPHATE
MONOHYDRATE (LAP)
The structure of L-arginine phosphate monohydrate crystal reported
by Aoki et al (1971) is shown in Figure 2.1. It can be regarded as layers of
phosphate ions, arginine ions and water molecule stacked along ‘a’ axis.
While the arginine-phosphate layers are held together both by ionic forces and
a large number of hydrogen bonds, the arginine-water-arginine layers are
linked only by the bridging of water molecules and van der Waals forces
between the aliphatic segments of adjacent arginines. It is likely that these
weakly bonded layers are the cause of the easy cleavage parallel to (100)
observed in LAP crystals (Fuchs et al 1989). In LAP crystal, the guanadyl and
amino groups are protonated and hence have positive charges, which balance
the negative charges of the carboxylate and dihydrogen phosphate ions. It is
likely that the birefringence and the nonlinear coefficients of LAP crystals are
largely determined by the geometric arrangement of these ionic units (Eimerl
et al 1989). It follows that the primary role of the phosphate ion is to control
the structure. Its influence on the macroscopic NLO coefficient lies in its
control on the orientation of the protonated groups and not in intrinsic
nonlinearity. This crystal belongs to the monoclinic system with the space
group P21 with two formula units per unit cell. The cell dimensions are a =
10.85 Å, b = 7.91 Å, c = 7.32 Å, the angle between ‘a’ and ‘c’ axes is 98°
(Aoki et al 1971). Figure 2.2 shows the molecular structure of L-arginine
phosphate monohydrate.

31
Figure 2.1 Crystal structure of L-arginine phosphate monohydrate
(Aoki et al 1971)
Figure 2.2 Molecular structure of L-arginine phosphate monohydrate

32
2.3 EXPERIMENTAL PROCEDURE
2.3.1 Material Synthesis
L-arginine phosphate was synthesized from the strongly base amino
acid, L-arginine and orthophosphoric acid as per the following reaction:
(NH2) NHCNH (CH2)3 CH (NH2) COOH + H3 PO4 + H2 O
(H2N)2+ CNH(CH2)3 CH (NH3)
+ COO-. H2 PO4 . H2 O
L-arginine (98%) and orthophosphoric acid (87%) were taken in
equimolar ratio and dissolved in millipore water (resistivity of 18.3 M cm)
as per the above reaction. The starting material was prepared by evaporating
excess water to almost dry at room temperature.
For synthesis of alanine mixed LAP, 0.8, 0.2, 1 molar concentration
of L-arginine (98%), L-alanine (99%) and orthophosphoric acid (87%) were
taken and dissolved in millipore water. The mixed solution was kept in hot
plate below 60 C and allowed to evaporate the excess water. As per the
following reaction, dried salt of ALAP was obtained after evaporating the
water.
[(NH2) NHCNH (CH2)3 CH (NH2) COOH](1-x) + [CH3CH(NH)COOH]x +
H3 PO4 + H2 O (H2N)2+ CNH(CH2)3 CH (NH3)
+ COO-. H2 PO4 . H2 O
For the synthesis of glycine mixed LAP, L-arginine, glycine and
ortho phosphoric acid with molar ratio 0.8:0.2:1 respectively were taken in
addition to the excess of millipore water. The reaction is as follows
[(NH2) NHCNH (CH2)3 CH (NH2) COOH](1-x) + [CH2(NH2)COOH]x +
H3 PO4 + H2 O (H2N)2+ CNH(CH2)3 CH (NH3)
+ COO-. H2 PO4 . H2 O

33
The same procedure was adopted for synthesis of valine mixed
LAP (VLAP) as per the reaction:
[(NH2) NHCNH (CH2)3 CH (NH2) COOH](1-x) + [(CH3)2CH(NH)COOH]x +
H3 PO4 + H2 O (H2N)2+ CNH(CH2)3 CH (NH3)
+ COO-. H2 PO4 . H2 O
Synthesized salts of LAP, ALAP, GLAP and VLAP were used for
the growth of bulk crystals. The prepared salts were further purified by
repeated recrystallization process.
2.3.2 Multicrystal X-ray Diffractometry
The crystalline perfection of the grown single crystals was
characterized by HRXRD by employing a multicrystal X-ray diffractometer
developed at National Physical Laboratory (NPL) (Lal and Bhagavannarayana
1989). Figure 2.3 shows the schematic diagram of the multicrystal X-ray
diffractometer. The divergence of the X-ray beam emerging from a fine focus
X-ray tube (Philips X-ray Generator; 0.4 mm x 8 mm; 2kWMo) is first
reduced by a long collimator fitted with a pair of fine slit assemblies. This
collimated beam is diffracted twice by two Bonse-Hart type of
monochromator crystals and the thus diffracted beam contains well resolved
MoK 1 and MoK 2 components (Bonse and Hart 1965). The MoK 1 beam is
isolated with the help of fine slit arrangement and allowed to further diffract
from a third (111) Si monochromator crystal set in dispersive geometry (+, -, -).
Due to dispersive configuration, though the lattice constant of the
monochromator crystal and the specimen are different, the dispersion
broadening in the diffraction curve of the specimen does not arise. Such an
arrangement disperses the divergent part of the MoK 1 beam away from the
Bragg diffraction peak and thereby gives a good collimated and
monochromatic MoK 1 beam at the Bragg diffraction angle, which is used as

34
incident or exploring beam for the specimen crystal. The dispersion
phenomenon is well described by comparing the diffraction curves recorded
in dispersive (+,-,-) and non-dispersive (+,-,+) configurations
(Bhagavannarayana 1994). This arrangement improves the spectral purity
( / 10-5) of the MoK 1 beam. The divergence of the exploring beam in
the horizontal plane (plane of diffraction) was estimated to be 3 arc sec.
The specimen occupies the fourth crystal stage in symmetrical Bragg
geometry for diffraction in (+, -, -, +) configuration. The specimen can be
rotated about a vertical axis, which is perpendicular to the plane of diffraction,
with minimum angular interval of 0.4 arc sec. The diffracted intensity is
measured by using an in-house (NPL) developed scintillation counter. To
provide two-theta (2 B) angular rotation to the detector (scintillation counter)
corresponding to the Bragg diffraction angle ( B), it is coupled to the radial
arm of the goniometer of the specimen stage.
The rocking or diffraction curves were recorded by changing the
glancing angle (angle between the incident X-ray beam and the surface of the
specimen) around the Bragg diffraction peak position B (taken as zero for the
sake of convenience) starting from a suitable arbitrary glancing angle. The
detector was kept at the same angular position 2 B with wide opening for its
slit, the so-called scan. This arrangement is very appropriate to record the
short range order scattering caused by the defects or by the scattering from
local Bragg diffractions from agglomerated point defects or due to low angle
and very low angle structural grain boundaries (Bhagavannarayana and
Kushwaha 2010).

35
Figure 2.3 Schematic line diagram of Multicrystal X-ray diffractometer
designed, developed and fabricated at NPL, New Delhi
2.4 GROWTH OF LAP CRYSTALS
2.4.1 Crystal Growth
Optical quality seed crystals grown by slow evaporation technique
were used to grow bulk crystals by slow cooling method. After saturating the
mother solution at 40 C, the growth has been initiated at 39.95 C with a
cooling rate of 0.2 C/day by using a constant temperature bath with a control
accuracy of 0.01 C. The constant temperature bath used in this study is
shown in the Figure 2.4. Millipore water was used for the preparation of the
growth solutions of all the four salts. Optical quality bulk crystals of various
dimensions were harvested after a typical growth period of about 20 days.
Growth rates were determined along the crystallographic axes (a, b, c) by
using digital vernier caliper.
36
Figure 2.4 Photograph of constant temperature bath used to grow the
LAP crystals
2.4.2 Growth Aspects
Sangwal et al (1995) reported various planes present in the LAP
crystals. In the ALAP crystal (100), (110), (-110), (010), (101), (011), (2-1-1),
(011) are the prominent planes, which have been identified. (100), (101),
(110), (-110), (011), (0-11), (2-1-1) (201) are the planes which have been
identified in GLAP. (100), (110), (-110), (-2-11), (-2-1-1), (1-11), (-1-11) are
the main planes observed in the VLAP. The as-grown crystals of LAP,
GLAP, ALAP and VLAP are shown in Figure 2.5. The morphology of the
LAP is shown in the Figure 2.6. Growth rates along the three crystallographic
axes (a, b, c) have been studied for pure and amino acids mixed LAP crystals.
For the pure LAP crystal, the growth rate along the ‘b’ axis has been observed
to be more than that of the other two axes. Among the axes ‘a’ and ‘c’ the
growth rate along the ‘c’ axis has been observed to be more than that of the
‘a’ axis. When compared to pure LAP crystal, the growth rate of ALAP and
GLAP along ‘a’ and ‘b’ axes has not been affected notably, but the c-axis
growth rate is significantly increased. The growth rates of ALAP along all the

37
three axes have been observed to be slightly more compared to GLAP. On the
other hand, the growth rates of VLAP along ‘a’ and ‘b’ axes have been found
to be changed considerably. The increased growth rates have been observed in
‘a’ and ‘b’ axes, whereas the growth rate in ‘c’ axis remain almost same as pure
LAP. Tapering effect has also been observed along the three crystallographic
axes and hence, the shape of the crystal resembles triangle. Due to the
tapering effect the quality of the crystal has been found to be affected. GLAP
is observed to have more transparency than that of other LAP crystals. The
growth rates along the crystallographic axes are tabulated in Table 2.1.
Figure 2.5 As-grown crystals of LAP, GLAP, ALAP and VLAP
Figure 2.6 Morphology of the LAP crystal ( Sangwal et al 1995)

38
Table 2.1 Statistics of growth rates along the crystallographic axes of
pure and amino acid mixed LAP crystals
Growth rates(mm/day)Crystals
a b c
LAP 0.35 0.64 0.49
GLAP 0.33 0.66 0.72
ALAP 0.37 0.7 0.78
VLAP 0.56 0.84 0.46
Standard Deviation 0.11 0.09 0.16
Standard Error 0.05 0.05 0.08
2.4.3 Microbial Contamination
The microbial contamination of the solution is one of the major
problems in the growth of L-arginine phosphate family crystals due to the
incorporation of endotoxin during the long growth period. This problem
affects the quality of the crystals limiting the growth of large size crystals by
the conventional slow cooling method. Moreover the incorporation of
microbes into the crystals reduces the laser damage threshold of the crystals
when subjected to laser radiation. Since, L-arginine is an amino acid, which is
rich in nutrient; microbes grow on the surface of the solution when it is
exposed to atmosphere. After a few days, the microbes that grew on the
surface fall into the solution and hence the solution is contaminated. A
number of additives have been tried to inhibit the microbial growth. Yokotani
et al (1990) reported that the addition of H2O2 and CHCl3 in the DLAP
solution inhibited the microbial growth. Dhanaraj et al (1991) employed a
thick layer of n- hexane of about 2-4 cm height over the solution surface to
overcome this problem. In the present study, H2O2 additive has been added to
prevent the microbial formation in solutions. For the entire growth period, the

39
growth of microbes has been monitored. Till the crystals have been harvested
(after twenty five days) no microbes have been observed in all the four
solutions. But after thirty days, a layer of thin white colored microbes were
observed in LAP; In the case of ALAP a thinner layer of light white colored
microbes was observed. A thick layer of dark brown colored microbes was
observed in GLAP. However, in the VLAP solution, the microbes were
observed to be very less and also it is not in the form of layer. This
observation is the evidence of presence of neutral amino acids in the
respective solutions.
2.4.4 Coloration
The coloration of the solution with time is another major problem
as reported by Sasaki et al (1989). The coloration of the solution is due to the
fact that the chemical decomposition takes place in L-arginine molecule when
exposed to light. This coloration is known as photodecomposition. By using
different illumination conditions Dhanaraj et al (1991) have prevented the
coloration of the solution during the growth period. When the crystals were
grown under light proof containers at very low temperatures, no coloration
was observed. It was concluded that the decomposition of L-arginine is the
combined effect of thermal and photo induced decomposition. In the present
study thermal decomposition was avoided by using the low growth
temperature range between 40 C and 30 C for the growth of crystals.
At the time of growth run pure, alanine, glycine and valine, mixed
LAP solutions were colorless. When harvesting the crystals after considerable
size i.e. after 20 days, the solutions of LAP and ALAP become pale yellow.
The solution of GLAP was light brown and the VLAP solution remains
colorless. Hence, the photo-induced decomposition did not take place in
VLAP solution.

40
2.5 CHARACTERIZATION STUDIES
2.5.1 Powder X-ray Diffraction Studies
Powder X-ray diffraction patterns were recorded at room
temperature by using XPERT-PRO diffractometer system for LAP, ALAP,
GLAP and VLAP crystals as shown in Figures 2.7a, 2.7b, 2.7c and 2.7d
respectively. The interplanar distance (d) was calculated for all the prominent
peaks using Bragg’s equation. Using the values of ‘d’, and 2 the hkl values
for all the reflections were assigned. The lattice parameter values were
calculated using the monoclinic crystallographic equation for = 98 . It is
observed that the addition of amino acids alters the lattice parameter values.
Among the four diffraction patterns, the number of peaks observed for VLAP
is less compared to LAP, GLAP and ALAP. The calculated lattice parameters
are shown in Table 2.2.
Table 2.2 Lattice parameter values of pure and amino acids mixed LAP
crystals
Lattice ParametersÅCrystals
A b c
Pure LAP 10.8841 7.9424 7.3408
GLAP 10.9192 8.0866 7.3065
ALAP 10.9191 8.0866 7.2746
VLAP 10.8328 8.0613 7.2477
Standard Deviation 0.0408 0.0689 0.0402
Standard Error 0.0204 0.0345 0.0201

41
10 20 30 40 50 60 70 80
0
500
1000
1500
2000
2500
3000
3500
4000
(311)
(221
)
(120
)
(11-1
)(2
00)
(21-1
)(1
11)
(101
)
(012
)(2
20
)
(313
)
(32
0)
Inte
ns
ity
(a
rb.u
nit
s)
Diffraction angle, 2 deg)
(300)
(a) LAP
Figure 2.7 (Continued)

42
Figure 2.7 X-ray diffraction patterns of (a) LAP (b) ALAP (c) GLAP
and (d) VLAP

43
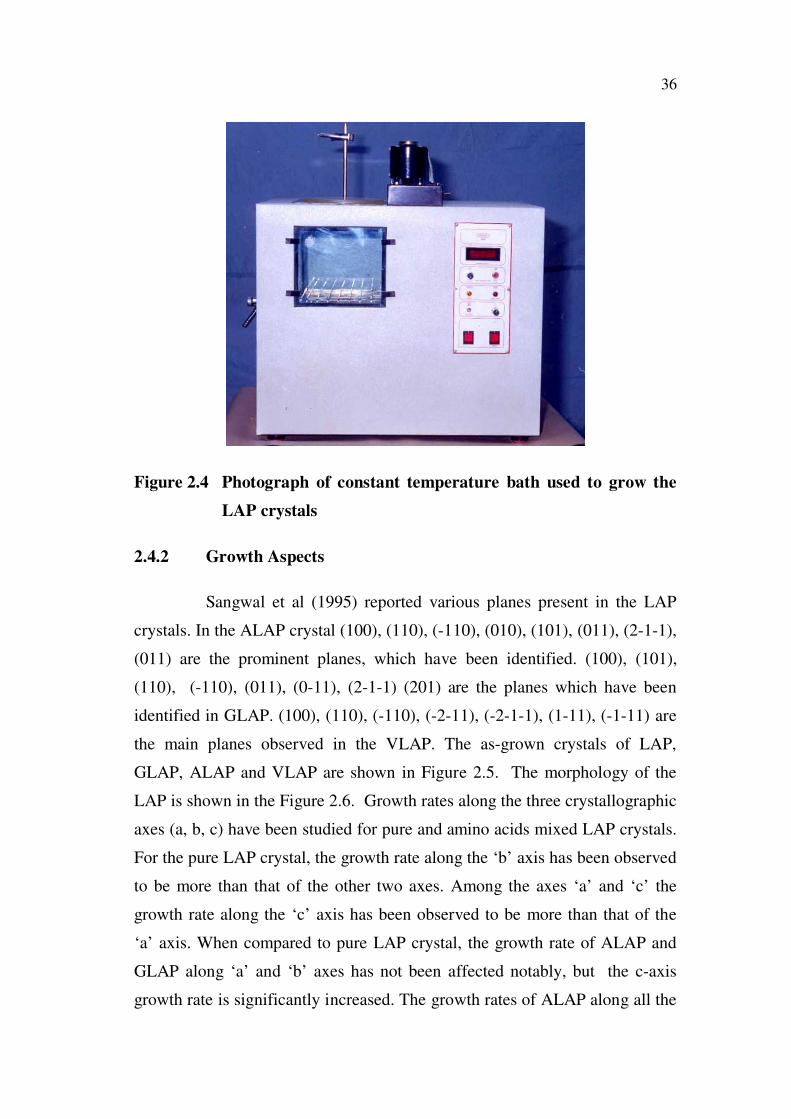
2.5.2 FTIR Spectral Analysis
In order to analyze the presence of various functional groups in the
grown crystals FTIR spectra for LAP, ALAP, GLAP and VLAP were
recorded at room temperature using Thermo Nicolet 380 FTIR spectrometer
as shown in the Figures 2.8a, 2.8b, 2.8c and 2.8d respectively. LAP, ALAP,
GLAP and VLAP were crushed separately and a few milligram of each salt
was used for making pellets with KBr. The spectra were found to be complex,
because of various functional groups present in the crystals. The bands due to
stretching vibrations of NH2, NH2+, NH3
+, COO- and HPO4 have been
observed in the high frequency range. In the range of lower frequency, the
bands due to the deformation vibrations of various functional groups have
been observed. In FTIR spectra, the bands have been formed due to the
internal vibration of the arginine molecule, phosphate group, and hydrated
group in the mixed crystals. Moreover, rocking mode, symmetric deformation
and asymmetric bending have been found from all the three spectra. The
rocking mode of NH2 group is at 782 cm-1 in GLAP, 780 cm-1 in ALAP and at
781 cm-1 in VLAP. In the formation of phosphate ion, P-OH stretching has
been observed at 950 cm-1 in all the crystals. P-OH deformation bands are due
to the internal vibration of the phosphate group, which has been identified at
408 cm-1 in all the crystals. The normal mode frequencies have been identified
at 3637 cm-1 and 3891 cm-1 due to the presence of H2O molecules in the
grown crystals. Overlaping of bands due to the hydrogen bonding in the high
frequency range has been observed in the all the spectra. Variation of
intensity has been observed for the pure and doped crystals and the wave
numbers and its assignments are given in Table 2.3.

44
4000 3500 3000 2500 2000 1500 1000 500
0
20
40
60
80
100
Tra
nsm
itta
nce (
% )
Wavenumber (cm-1
)
(a) LAP
4000 3500 3000 2500 2000 1500 1000 5000
20
40
60
80
100
Tra
nsm
itta
nc
e (
%)
Wavenumber (cm-1
)
(b) ALAP
Figure 2.8 (Continued)

45
4000 3500 3000 2500 2000 1500 1000 5000
20
40
60
80
100
Tra
ns
mit
tan
ce
(%
)
Wavenumber (cm-1
)
(c) GLAP
4000 3500 3000 2500 2000 1500 1000 5000
20
40
60
80
100
Tra
nsm
itta
nce (
%)
Wavenumber(cm-1)
(d) VLAP
Figure 2.8 FTIR Spectra of (a) LAP (b) ALAP (c) GLAP and (d) VLAP
crystals
46
Table 2.3 Wave numbers and assignments for LAP crystal
Wave number (cm-1) Assignments
3449 3 (H2O)
3331 1 (H2O)
3166 NH+3 asymmetric stretching
2411 NH+3 symmetric stretching
1690 C = N stretching
1652 NH+2 deformation
1615 C = O stretching
1568 COO - asymmetric stretching
1524 NH+3 asymmetric deformation
1454 2 (H2O)
1409 COO - symmetric stretching
1372 C – C – H in plane deformation
1334 CH2 wagging
1320 CH2 wagging
1286 P – OH angular
1245 P = O stretching
1176 NH+3 rocking
1160 NH+2 wagging
1130 NH2 wagging
1088 3 (PO4)
1045 1(PO4)
1035 P – OH deformation
950 P – OH stretching
901 CH2 rocking
872 C – C stretching, P – OH stretching
782 NH2 rocking
760 COO - scissoring
699 NH2 out of plane bending

47
2.5.3 HRXRD Analysis of LAP Single Crystal
Before recording the diffraction curve, to remove the non-
crystallized solute atoms remained on the surface of the crystal and also to
ensure the surface planarity, the specimen was first lapped and chemically
etched in a non-preferential etchant. This process also ensures to remove
surface layers, which may sometimes form on the surface of the crystal due to
organic additives (Bhagavannarayana et al 2006).
High-resolution rocking/diffraction curve (DC) was recorded for a
typical undoped LAP crystal grown by SEST (slow evaporation of solvent
technique) method using (300) diffracting planes in symmetrical Bragg
geometry by employing the multicrystal X-ray diffractometer with MoK 1
radiation and is shown in Figure 2.9.
-100 -50 0 50 1000
400
800
1200 LAP(Pure)
(300) Planes
MoK
Diffr
acte
d X
-ra
y in
ten
sity [
c/s
]
Glancing angle [arc s]
6"
Figure 2.9 High-resolution X-ray diffraction curve recorded for a
typical undoped LAP single crystal specimen using (300)
diffracting planes
As seen in the figure, the DC contains a single sharp peak, which
indicates that the specimen is free from structural grain boundaries. The

48
FWHM (full width at half maximum) of the curve is 6 arc s, which is very
close to that expected from the plane wave theory of dynamical X-ray
diffraction (Batterman and Cole 1964) for an ideally perfect crystal.
2.5.4 HRXRD Analysis of GLAP Crystal
The high resolution X-ray diffraction curve was recorded for (300)
diffraction planes of GLAP crystal using MoK 1 radiation as shown in
Figure 2.10.
-400 -200 0 200 4000
200
400
600
Diffr
acte
d X
-ra
y inte
nsity [
c/s
]
Glancing angle [arc s]
84" 130" 88"
52" 92"70" 112"
GLAP
(300) Planes
MoK
Figure 2.10 High-resolution X-ray diffraction curve recorded for a
typical GLAP single crystal specimen using (300) diffracting
planes
The solid line (convoluted curve) is well fitted with the
experimental points represented by the filled circles. On deconvolution of the
diffraction curve, it is clear that the curve contains three additional peaks,
which are 88, 130 and 214 arc s away from the main peak (at zero glancing
angle). These three additional peaks correspond to three internal structural
low angle boundaries (tilt angle > 1 arc min but less than a degree)

49
(Bhagavannarayana et al 2005), whose tilt angles (tilt angle may be defined as
the disorientation angle between the two crystalline regions on both sides of
the structural grain boundary) are 88, 130 and 84 arc s from their adjoining
regions. The FWHM of the main peak and the very low angle boundaries are
respectively 70, 112, 92 and 52 arc s. The broader low intensity peaks with
112 and 92 arc s FWHM show that the grain corresponding to these peaks
contains mosaic blocks disoriented to each other by at least few tens of arc
seconds.
2.5.5 HRXRD Analysis of ALAP Crystal
Figure 2.11 shows the high resolution X-ray diffraction curve
recorded for (300) diffraction planes of ALAP crystal using MoK 1 radiation.
The solid line (convoluted curve) is well fitted with the experimental points
represented by the filled circles.
-200 0 200 4000
400
800
1200
Diffr
acte
d X
-ra
y in
ten
sity [c/s
]
Glancing angle [arc s]
ALAP
(300) Planes
MoK
300"19"
157 10" 162"
Figure 2.11 High-resolution X-ray diffraction curve recorded for a
typical ALAP single crystal specimen using (300) diffracting
planes

50
On deconvolution of the diffraction curve, it is clear that the curve
contains two additional peaks, which are 19 and 300 arc s away from the main
peak (at zero glancing angle). Out of these two peaks, the peak at 19 arc s
away from the main peak shows a very low angle boundary, whose tilt angle
is 18 arc s. The other additional peak at 300 arc sec corresponds to a low
angle boundary whose tilt angle is 300 arc s. The FWHM of the main peak
and the very low angle boundaries are respectively 10, 157 and 162 arc s. The
broadness of the additional peaks show that the grains corresponding to these
peaks contain mosaic blocks disoriented to each other by at least few tens of
arc seconds similar to GLAP crystal.
2.5.6 HRXRD Analysis of VLAP Crystal
High resolution X-ray diffraction curve recorded for (300)
diffraction planes of VLAP crystal is shown in Figure 2.12.
-500 -250 0 250 5000
200
400
600
Diffr
acte
d X
-ra
y in
ten
sity [c/s
]
Glancing angle [arc s]
60"
142" 166"
68"40"54"202"
VLAP
(300)Planes
MoK
Figure 2.12 High-resolution X-ray diffraction curve recorded for a
typical VLAP single crystal specimen using (300) diffracting
planes

51
It is observed that the diffraction curve contains three additional
peaks, which are 166, 226 and 368 arc s away from the main peak (at 225 arc
s glancing angle). These three additional peaks correspond to three internal
structural low angle boundaries whose tilt angles are 166, 60 and 142 arc s
from their adjoining regions. The FWHM of the prominent peak and the very
low angle boundaries are 68, 40, 54 and 202 arc s respectively. The broader
low intensity peak with 202 arc s FWHM shows that the grain corresponding
to this peak contains mosaic blocks disoriented to each other by at least few
tens of arc seconds.
The multi peeks observed in all the doped crystals ensure the
presence of amino acids in the LAP lattice. Since the tilt angles are in the
order of a few arc sec, one cannot presume these grain boundaries as twins. A
complete description of such boundaries with X-ray topographs has been
described by Bhagavannarayana and Kushwaha (2010). However, the
background scattering indicate the presence of point defects like interstitials
and vacancies.
2.5.7 UV-VIS-NIR Spectral Analysis
Since the absorption, if any in the NLO material near the
fundamental or second harmonic will lead to loss of conversion efficiency, it
is necessary to have good optical transparency in the NLO crystal in the UV
region. Optical absorption spectra were recorded in the range between 200 to
1200 nm using 2 mm thick c-cut crystal plates of GLAP, ALAP and VLAP
crystals. The recorded absorption spectra are shown in Figures 2.13a, 2.13b
and 2.13c. From the spectra, it is evident that GLAP and ALAP crystals are
having strong absorption only below 240 nm. However, VLAP has at 230 nm.
Hence, these crystals are useful for optoelectronic applications and the second
harmonic generation from the Nd:YAG Laser which is sufficient for SHG
laser radiation of 1064 nm or other applications in the blue region.

52
Figure 2.13 UV-VIS-NIR absorption spectra of (a) GLAP(b) ALAP and
(c) VLAP
53
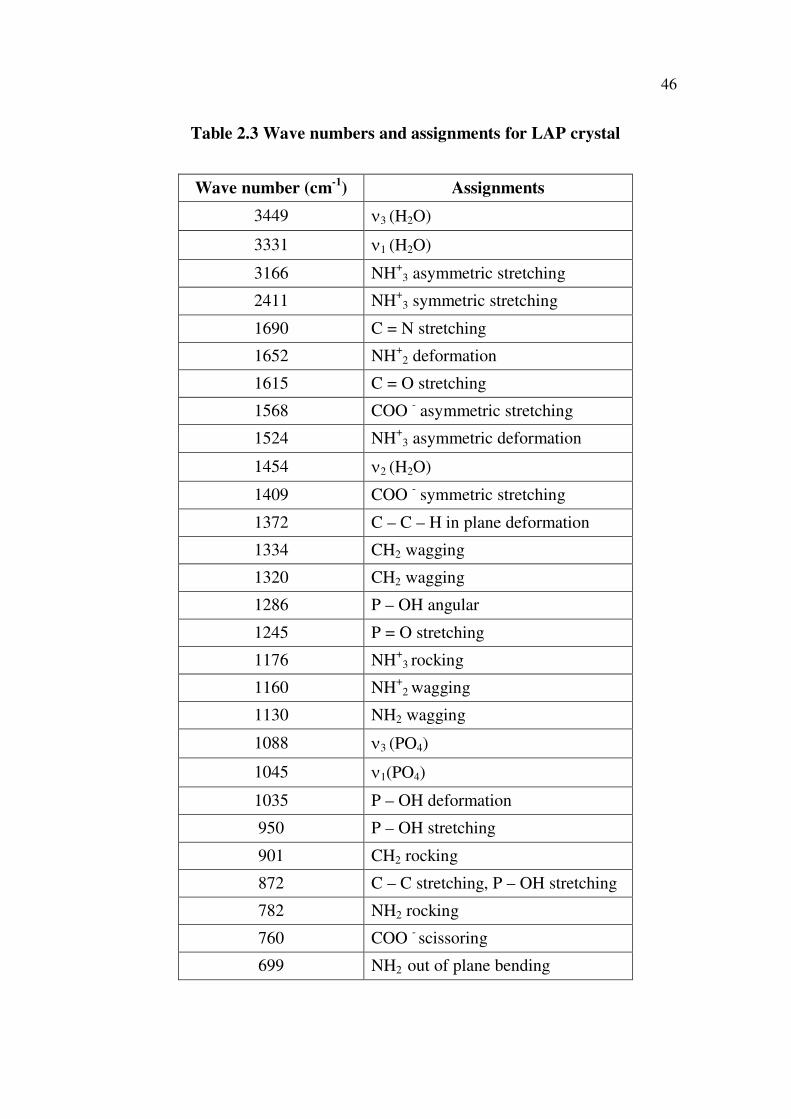
2.5.8 Thermal Analysis
Thermal analyses are of immense importance as far as fabrication
technology is concerned, as they provide thermal stability of the material for
fabrication, where a considerable amount of heat is generated during the
cutting process. Thermal analysis has been performed on the grown crystals to
study the thermal stability and melting point. The powdered samples of doped
crystals were subjected to thermo gravimetric analysis (TGA). Differential
thermo gravimetric analysis (DTG) curves were also obtained for the doped
samples. TGA and DTG curves for GLAP, ALAP and VLAP are shown in
Figure 2.14 (a, b and c). The curves were obtained for the temperature range
of 35 C to 800 C. The percentage of weight loss due to temperature for each
sample were observed to be increased for these crystals compared to pure
LAP. The first decomposition due to dehydration of water takes place at
157.3 C in GLAP and ALAP, whereas, for VLAP the first decomposition
temperature is 161 C. This decomposition temperature corresponds to the
melting points of the crystals. However, in the case of LAP, it is nearly 137 C
(Haja Hameed et al 1999). Thermal stability of the doped crystals are found to
be increased. Melting points of the grown crystals are presented in Table 2.4.
Table 2.4 Melting points of pure and amino acids mixed LAP crystals
Crystals Melting Point
LAP 137.0
ALAP 157.3
GLAP 157.3
VLAP 161.0
Standard Deviation 10.91
Standard Error 5.45

54
Figure 2.14 (Continued)

55
Figure 2.14 (Continued)

56
Figure 2.14 TG/DTG curves of (a) glycine mixed L-arginine phosphate
monohydrate crystal (b) alanine mixed L-arginine
phosphate monohydrate crystal (c) valine mixed L-arginine
phosphate monohydrate crystal

57
2.6 CONCLUSION
Single crystals of pure and amino acids mixed L-arginine
phosphate crystals such as GLAP, ALAP and VLAP have been grown from
aqueous solution by slow cooling method. Growth rates of these crystals
along the three crystallographic axes of pure and amino acids mixed LAP
crystals have been found to be varied. This growth rate variation is due to the
partial substitution of glycine, alanine and valine in the respective LAP
crystals. The variation of lattice parameters has also been observed from
powder X-ray diffraction studies, which confirmed the incorporation of amino
acids in the LAP crystal lattice. Presence of amino acids in the lattice is also
confirmed by the observation of multi-peaks in the high resolution X-ray
diffraction curves. Various functional groups of LAP and amino acids mixed
LAP crystals have been identified by FTIR studies. Suitability of the grown
crystals for the applications in the blue region is confirmed by optical
absorption study. The incorporation of amino acids in pure LAP significantly
enhances the thermal stability. It has been observed that L-valine has more
influence on the properties of the grown crystals. The presence of L-valine in
the solution completely prevents the formation of microbes and coloration.