CHAPTER 2 PREPARATION AND PROPERTIES OF...
26
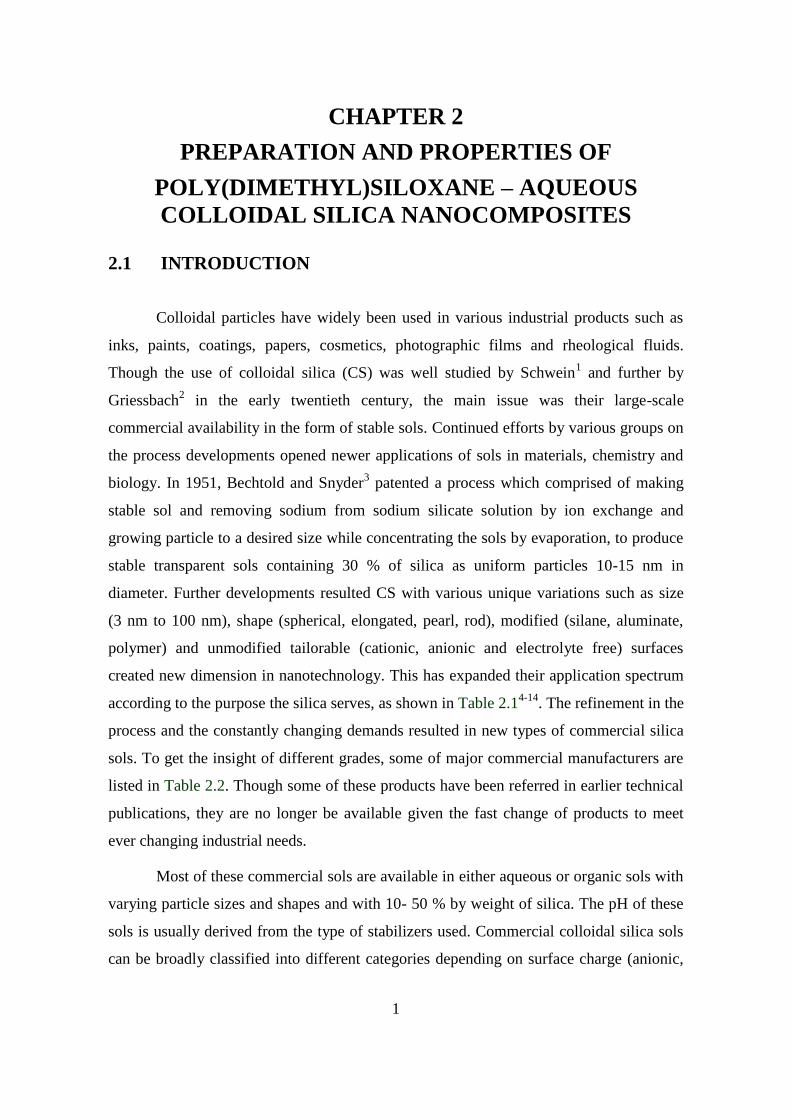
1 CHAPTER 2 PREPARATION AND PROPERTIES OF POLY(DIMETHYL)SILOXANE – AQUEOUS COLLOIDAL SILICA NANOCOMPOSITES 2.1 INTRODUCTION Colloidal particles have widely been used in various industrial products such as inks, paints, coatings, papers, cosmetics, photographic films and rheological fluids. Though the use of colloidal silica (CS) was well studied by Schwein 1 and further by Griessbach 2 in the early twentieth century, the main issue was their large-scale commercial availability in the form of stable sols. Continued efforts by various groups on the process developments opened newer applications of sols in materials, chemistry and biology. In 1951, Bechtold and Snyder 3 patented a process which comprised of making stable sol and removing sodium from sodium silicate solution by ion exchange and growing particle to a desired size while concentrating the sols by evaporation, to produce stable transparent sols containing 30 % of silica as uniform particles 10-15 nm in diameter. Further developments resulted CS with various unique variations such as size (3 nm to 100 nm), shape (spherical, elongated, pearl, rod), modified (silane, aluminate, polymer) and unmodified tailorable (cationic, anionic and electrolyte free) surfaces created new dimension in nanotechnology. This has expanded their application spectrum according to the purpose the silica serves, as shown in Table 2.1 4-14 . The refinement in the process and the constantly changing demands resulted in new types of commercial silica sols. To get the insight of different grades, some of major commercial manufacturers are listed in Table 2.2. Though some of these products have been referred in earlier technical publications, they are no longer be available given the fast change of products to meet ever changing industrial needs. Most of these commercial sols are available in either aqueous or organic sols with varying particle sizes and shapes and with 10- 50 % by weight of silica. The pH of these sols is usually derived from the type of stabilizers used. Commercial colloidal silica sols can be broadly classified into different categories depending on surface charge (anionic,
Transcript of CHAPTER 2 PREPARATION AND PROPERTIES OF...
1
CHAPTER 2
PREPARATION AND PROPERTIES OF
POLY(DIMETHYL)SILOXANE – AQUEOUS
COLLOIDAL SILICA NANOCOMPOSITES
2.1 INTRODUCTION
Colloidal particles have widely been used in various industrial products such as
inks, paints, coatings, papers, cosmetics, photographic films and rheological fluids.
Though the use of colloidal silica (CS) was well studied by Schwein1 and further by
Griessbach2 in the early twentieth century, the main issue was their large-scale
commercial availability in the form of stable sols. Continued efforts by various groups on
the process developments opened newer applications of sols in materials, chemistry and
biology. In 1951, Bechtold and Snyder3 patented a process which comprised of making
stable sol and removing sodium from sodium silicate solution by ion exchange and
growing particle to a desired size while concentrating the sols by evaporation, to produce
stable transparent sols containing 30 % of silica as uniform particles 10-15 nm in
diameter. Further developments resulted CS with various unique variations such as size
(3 nm to 100 nm), shape (spherical, elongated, pearl, rod), modified (silane, aluminate,
polymer) and unmodified tailorable (cationic, anionic and electrolyte free) surfaces
created new dimension in nanotechnology. This has expanded their application spectrum
according to the purpose the silica serves, as shown in Table 2.14-14
. The refinement in the
process and the constantly changing demands resulted in new types of commercial silica
sols. To get the insight of different grades, some of major commercial manufacturers are
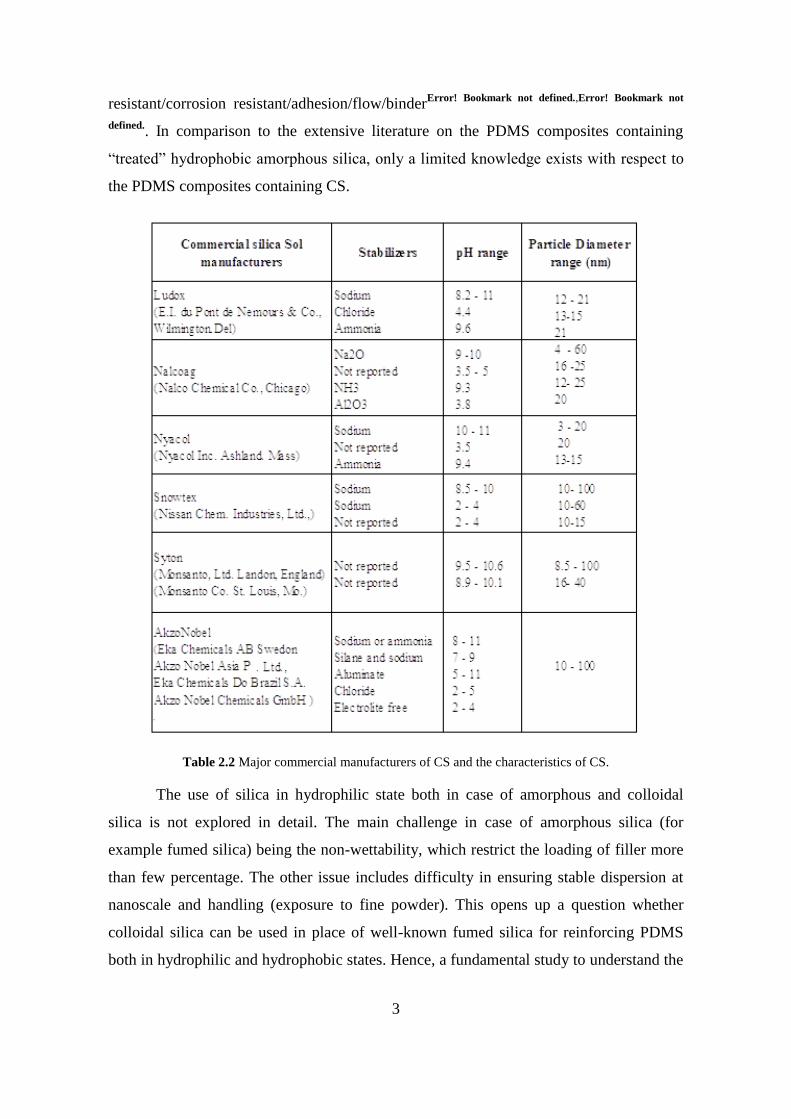
listed in Table 2.2. Though some of these products have been referred in earlier technical
publications, they are no longer be available given the fast change of products to meet
ever changing industrial needs.
Most of these commercial sols are available in either aqueous or organic sols with
varying particle sizes and shapes and with 10- 50 % by weight of silica. The pH of these
sols is usually derived from the type of stabilizers used. Commercial colloidal silica sols
can be broadly classified into different categories depending on surface charge (anionic,
2
cationic, silane modified or electrolyte free), pH (acidic or basic) and dispersion (aqueous
and organic). Hence unlike the amorphous silica, colloidal silica has lot of variations in
size, shape, dispersions and tailorable surface, which can give different spectrum of
properties if it is used optimally.
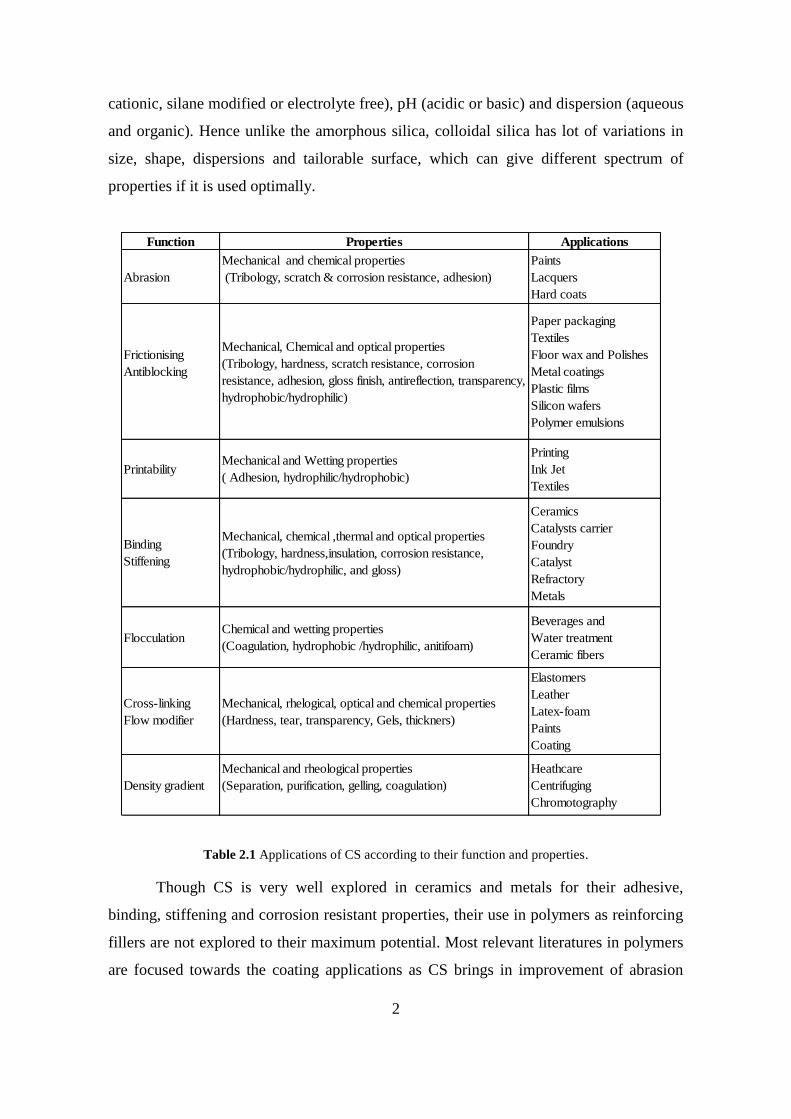
Table 2.1 Applications of CS according to their function and properties.
Though CS is very well explored in ceramics and metals for their adhesive,
binding, stiffening and corrosion resistant properties, their use in polymers as reinforcing
fillers are not explored to their maximum potential. Most relevant literatures in polymers
are focused towards the coating applications as CS brings in improvement of abrasion
Function Properties Applications
Abrasion
Mechanical and chemical properties
(Tribology, scratch & corrosion resistance, adhesion)
Paints
Lacquers
Hard coats
Frictionising
Antiblocking
Mechanical, Chemical and optical properties
(Tribology, hardness, scratch resistance, corrosion
resistance, adhesion, gloss finish, antireflection, transparency,
hydrophobic/hydrophilic)
Paper packaging
Textiles
Floor wax and Polishes
Metal coatings
Plastic films
Silicon wafers
Polymer emulsions
PrintabilityMechanical and Wetting properties
( Adhesion, hydrophilic/hydrophobic)
Printing
Ink Jet
Textiles
Binding
Stiffening
Mechanical, chemical ,thermal and optical properties
(Tribology, hardness,insulation, corrosion resistance,
hydrophobic/hydrophilic, and gloss)
Ceramics
Catalysts carrier
Foundry
Catalyst
Refractory
Metals
FlocculationChemical and wetting properties
(Coagulation, hydrophobic /hydrophilic, anitifoam)
Beverages and
Water treatment
Ceramic fibers
Cross-linking
Flow modifier
Mechanical, rhelogical, optical and chemical properties
(Hardness, tear, transparency, Gels, thickners)
Elastomers
Leather
Latex-foam
Paints
Coating
Density gradient
Mechanical and rheological properties
(Separation, purification, gelling, coagulation)
Heathcare
Centrifuging
Chromotography
3
resistant/corrosion resistant/adhesion/flow/binderError! Bookmark not defined.,Error! Bookmark not
defined.. In comparison to the extensive literature on the PDMS composites containing
“treated” hydrophobic amorphous silica, only a limited knowledge exists with respect to
the PDMS composites containing CS.
Table 2.2 Major commercial manufacturers of CS and the characteristics of CS.
The use of silica in hydrophilic state both in case of amorphous and colloidal
silica is not explored in detail. The main challenge in case of amorphous silica (for
example fumed silica) being the non-wettability, which restrict the loading of filler more
than few percentage. The other issue includes difficulty in ensuring stable dispersion at
nanoscale and handling (exposure to fine powder). This opens up a question whether
colloidal silica can be used in place of well-known fumed silica for reinforcing PDMS
both in hydrophilic and hydrophobic states. Hence, a fundamental study to understand the
4
reinforcing capability of colloidal silica is undertaken, as such study can potentially open
up a new dimension to the nanotechnology research field.
In this present chapter, commercially available aqueous hydrophilic colloidal
silica of three different particle sizes (20±5 nm, 30±5 nm and 60±5 nm), are used to make
PDMS-CS composites. Prior to cross-linking, the properties of the CS filled PDMS
composites are studied for their thermal and rheological characteristics. Reinforcing
capability of CS is inferred from the tensile properties, tear strength and Shore A
hardness characteristics of cured PDMS-CS composites. Particle dispersion in the
composites is inferred by analyzing scanning electron micrographs (SEM) and
transmission electron micrographs (TEM) and optical properties. Further, the effect of
addition of alcoholic solvents along with aqueous dispersion of CS on the properties of
resulting composites has also been investigated.
2.2 EXPERIMENTAL
2.2.1 Materials and Methods
Aqueous dispersions of colloidal silica of various particle sizes were purchased
from Nalco Chemicals, USA or received as a free sample from Nissan Chemicals, USA.
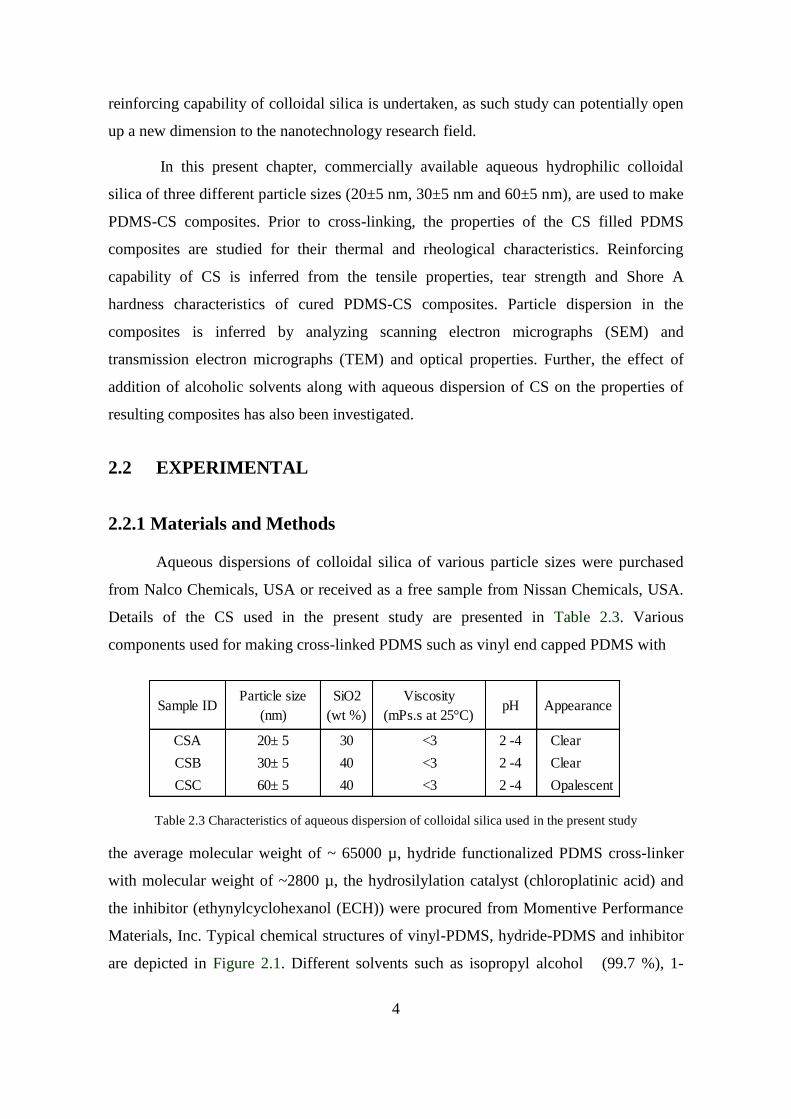
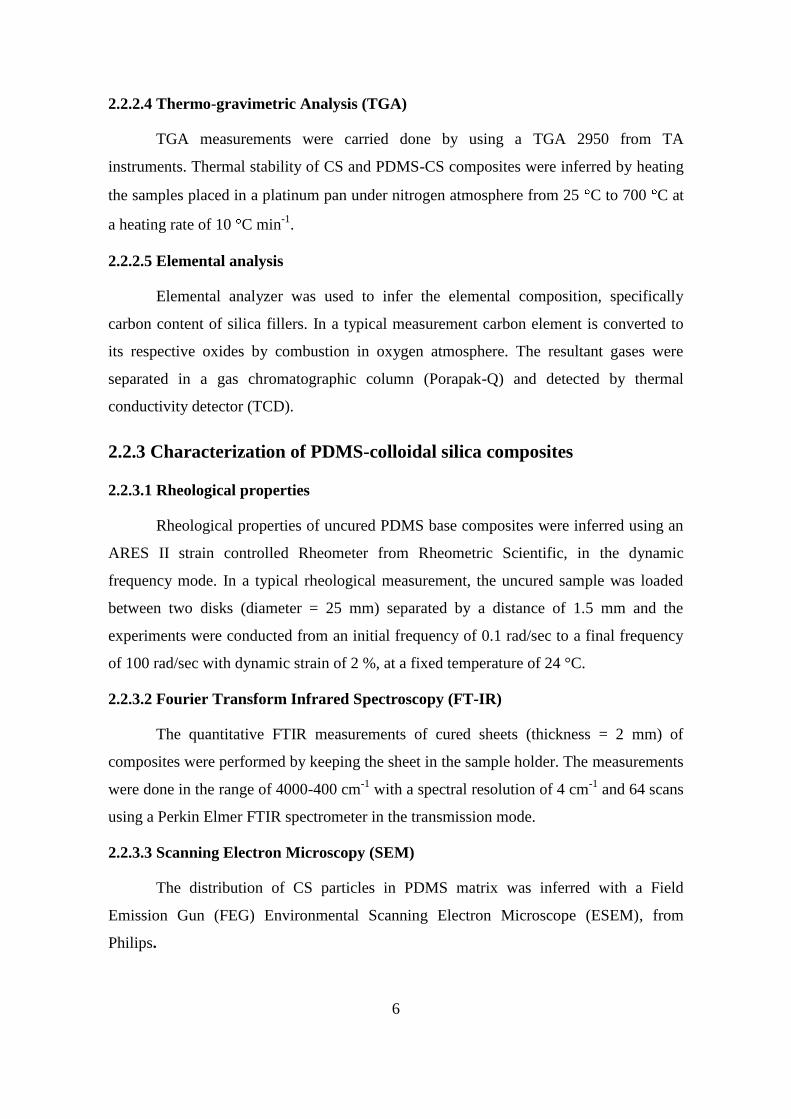
Details of the CS used in the present study are presented in Table 2.3. Various
components used for making cross-linked PDMS such as vinyl end capped PDMS with
Table 2.3 Characteristics of aqueous dispersion of colloidal silica used in the present study
the average molecular weight of ~ 65000 µ, hydride functionalized PDMS cross-linker
with molecular weight of ~2800 µ, the hydrosilylation catalyst (chloroplatinic acid) and
the inhibitor (ethynylcyclohexanol (ECH)) were procured from Momentive Performance
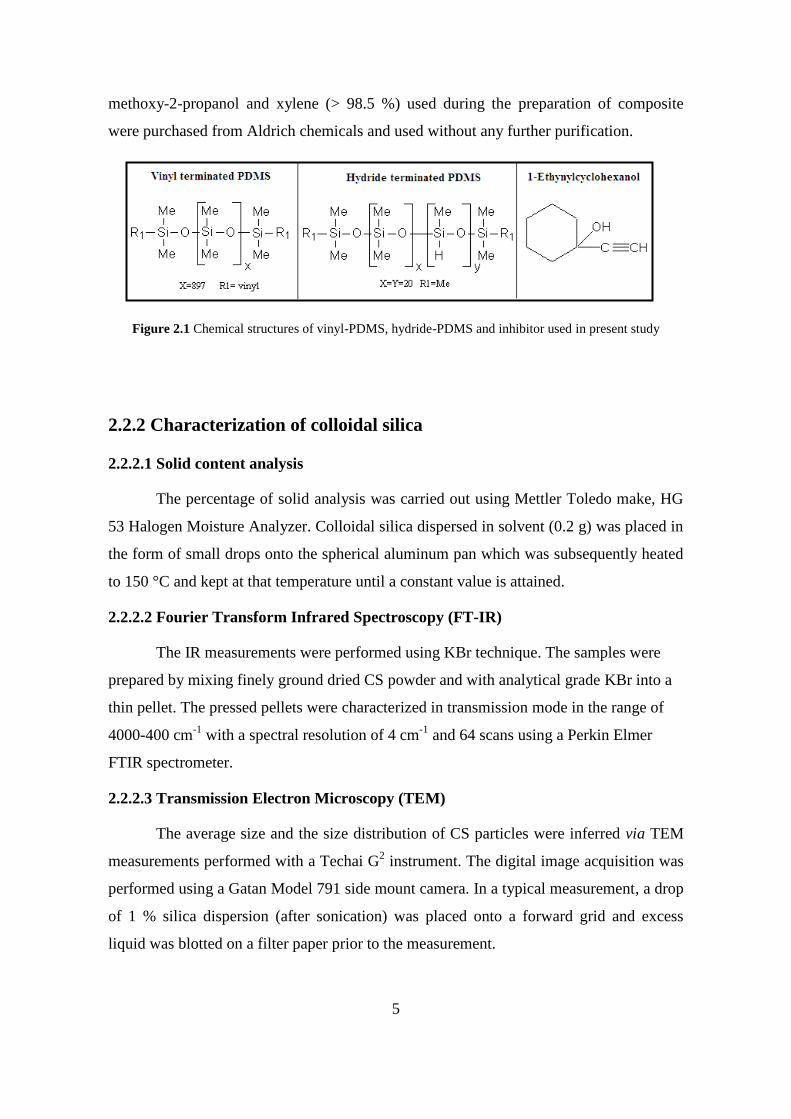
Materials, Inc. Typical chemical structures of vinyl-PDMS, hydride-PDMS and inhibitor
are depicted in Figure 2.1. Different solvents such as isopropyl alcohol (99.7 %), 1-
Sample IDParticle size
(nm)
SiO2
(wt %)
Viscosity
(mPs.s at 25°C)pH Appearance
CSA 20± 5 30 <3 2 -4 Clear
CSB 30± 5 40 <3 2 -4 Clear
CSC 60± 5 40 <3 2 -4 Opalescent
5
methoxy-2-propanol and xylene (> 98.5 %) used during the preparation of composite
were purchased from Aldrich chemicals and used without any further purification.
Figure 2.1 Chemical structures of vinyl-PDMS, hydride-PDMS and inhibitor used in present study
2.2.2 Characterization of colloidal silica
2.2.2.1 Solid content analysis
The percentage of solid analysis was carried out using Mettler Toledo make, HG
53 Halogen Moisture Analyzer. Colloidal silica dispersed in solvent (0.2 g) was placed in
the form of small drops onto the spherical aluminum pan which was subsequently heated
to 150 °C and kept at that temperature until a constant value is attained.
2.2.2.2 Fourier Transform Infrared Spectroscopy (FT-IR)
The IR measurements were performed using KBr technique. The samples were
prepared by mixing finely ground dried CS powder and with analytical grade KBr into a
thin pellet. The pressed pellets were characterized in transmission mode in the range of
4000-400 cm-1
with a spectral resolution of 4 cm-1
and 64 scans using a Perkin Elmer
FTIR spectrometer.
2.2.2.3 Transmission Electron Microscopy (TEM)
The average size and the size distribution of CS particles were inferred via TEM
measurements performed with a Techai G2 instrument. The digital image acquisition was
performed using a Gatan Model 791 side mount camera. In a typical measurement, a drop
of 1 % silica dispersion (after sonication) was placed onto a forward grid and excess
liquid was blotted on a filter paper prior to the measurement.
6
2.2.2.4 Thermo-gravimetric Analysis (TGA)
TGA measurements were carried done by using a TGA 2950 from TA
instruments. Thermal stability of CS and PDMS-CS composites were inferred by heating
the samples placed in a platinum pan under nitrogen atmosphere from 25 C to 700 C at
a heating rate of 10 C min-1
.
2.2.2.5 Elemental analysis
Elemental analyzer was used to infer the elemental composition, specifically
carbon content of silica fillers. In a typical measurement carbon element is converted to
its respective oxides by combustion in oxygen atmosphere. The resultant gases were
separated in a gas chromatographic column (Porapak-Q) and detected by thermal
conductivity detector (TCD).
2.2.3 Characterization of PDMS-colloidal silica composites
2.2.3.1 Rheological properties
Rheological properties of uncured PDMS base composites were inferred using an
ARES II strain controlled Rheometer from Rheometric Scientific, in the dynamic
frequency mode. In a typical rheological measurement, the uncured sample was loaded
between two disks (diameter = 25 mm) separated by a distance of 1.5 mm and the
experiments were conducted from an initial frequency of 0.1 rad/sec to a final frequency
of 100 rad/sec with dynamic strain of 2 %, at a fixed temperature of 24 °C.
2.2.3.2 Fourier Transform Infrared Spectroscopy (FT-IR)
The quantitative FTIR measurements of cured sheets (thickness = 2 mm) of
composites were performed by keeping the sheet in the sample holder. The measurements
were done in the range of 4000-400 cm-1
with a spectral resolution of 4 cm-1
and 64 scans
using a Perkin Elmer FTIR spectrometer in the transmission mode.
2.2.3.3 Scanning Electron Microscopy (SEM)
The distribution of CS particles in PDMS matrix was inferred with a Field
Emission Gun (FEG) Environmental Scanning Electron Microscope (ESEM), from
Philips.
7
2.2.3.4 Transmission Electron Microscopy (TEM)
The transmission electron microscope (TEM) was used to analyze the
morphological features of PDMS-CS composites. The sample preparation for TEM
analysis involved cutting and blocking of the part of the cured sheet using the scalpel.
The blocked sample was then faced and microtomed at -140 ˚C using a Leica Ultracut
microtome to obtain 100 nm sections. The resultant sections were collected on a copper
grid of 400 mesh and the images parallel to flow direction of representative areas were
taken at different magnifications.
2.2.3.5 X-ray diffraction (XRD):
The change in crystallinity of PDMS with the incorporation of CS was inferred
through powder XRD measurements, performed on a Panalytical X’Pert Pro X-Ray
diffractometer (C Cu Kα, λ = 0.154 nm). Instrument voltage was set to 40/40 KV/mA and
beam size on the sample was fixed during entire scan at 3.00 mm. Data was collected by
Panalytical X’cerelator detector system from angle (2 theta) 2 to 10°. Average d-spacing
was obtained by the peak position of the basal peak in the XRD scan.
2.2.3.6 Mechanical properties
The mechanical properties such as the tensile properties (at 100mm/ min cross
head speed) and the tear strength were measured using Instron instruments, adapting
protocols specified in DIN 53504 and ASTM D624, respectively. The hardness of the
cured PDMS composites was measured by using a Shore-A Durometer, following DIN
53505 method. The results reported are average values obtained with at least five test
specimens.
2.2.3.7 Optical properties
Transmission is the measure of the amount of light that passes through the sample
and haze is the scattering of visible light as it passes through a transparent material. The
BYK Gardner Spectrophotometer was used to measure the percent transmission (% T)
and the haze. After specifying the illuminant, observer angle, and the reference color, the
test sample (2 mm thick sheet) inserted into the specimen holder and the
spectrophotometer reading was recorded. An average of three readings is reported.
8
2.2.4 Preparation of PDMS-colloidal silica composites
2.2.4.1 Equipment used for the preparation of PDMS composite base
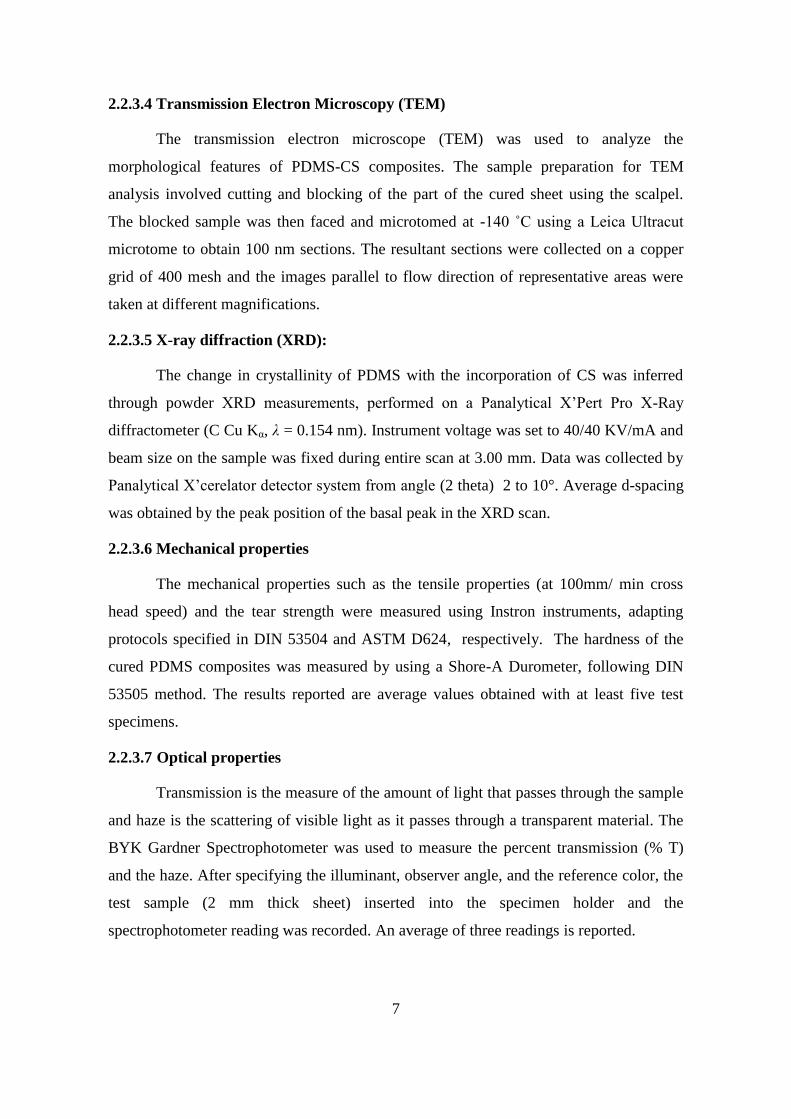
Dispersion of colloidal silica in PDMS was carried out in a Ross double planetary mixer
(DPM) kettle (Figure 2.2). The Ross DPM is designed to mix a variety of thick heavy and
hard to mix products efficiently with specially designed blades. The Ross DPM used for
the present work possesses in-built design features such as vacuum line, nitrogen gas line
and two ports for charging the reactants.
Figure 2.2: Double planetary mixing system used to prepare the PDMS composites
2.2.4.2 Method for preparation of PDMS-colloidal silica composites
Cured PDMS composites investigated in the present study were prepared using a
two-step process. The first step involved the preparation of composite base and the
second step comprised of curing of composite base with addition of an inhibitor, a cross
linker and a catalyst at elevated temperature. The composite base (100 g) was prepared by
mixing aqueous dispersion of colloidal silica (133 g with 40 g equivalent solid)
dispersion with PDMS fluid (60 g) at room temperature. The CS dispersions were mixed
in portions (30 ml during every 10 min) to ensure homogeneous mixing. Subsequently,
the contents were heated to a temperature of 80 °C with concomitant application of
vacuum for an hour, to remove the water. The temperature of the kettle was further raised
to 110 °C and kept at that temperature for 60 min under vacuum (10 mbar) to remove
trace of water. The contents were cooled to room temperature, prior to the start of second
step. In the second step, the composite base was mixed with required amounts of hydride
functionalized PDMS cross-linker (0.48 g), ethynylcyclohexanol (30 mg) and platinum
9
catalyst (10 ppm), in a kitchen blender. It is essential to remove any air bubbles from the
mass with the application of vacuum, prior to curing it in a compression-molding
machine. The curing of the PDMS-CS composite into the sheets (~ 2 mm thick) in the
compression-molding machine was done at 180 °C by applying 90 kN pressure for a
period of 10 min. Using above procedure, PDMS composites consisted of various
loadings (30 wt %, 20 wt % and 10 wt%) of colloidal silica were also prepared (Table
2.4). To understand the influence of the addition of alcoholic solvents, the aqueous
dispersion of CS was mixed with alcoholic solvents such as 1-methoxy 2- propanol and
isopropanol in 1:1 ratio with respect to water present in the dispersion. For the purpose of
comparison a control sample in which the CS dispersion was diluted with water in the
same ratio as alcoholic solvent was also made. The alcohol/water diluted CS dispersions
were subsequently used for preparing PDMS-CS composites. The sample code and the
loading levels of PDSM-CS are provided in Table-2.4.
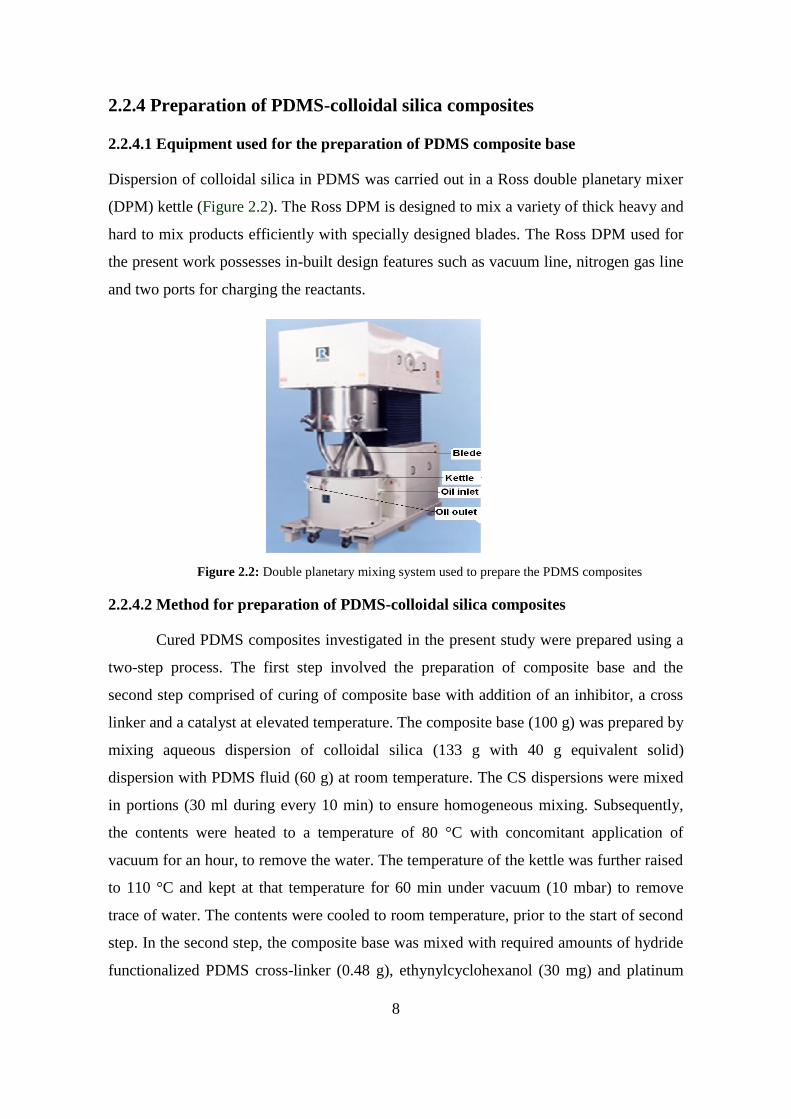
Table 2.4 Sample codes and the details of composite formulation
2.3 RESULTS AND DISCUSSION
2.3.1 Analysis of commercial aqueous colloidal silica
Prior to the preparation of PDMS-CS composites, the colloidal silica dispersions
were analyzed for their solid content in terms of % solids. The solid content analysis was
Samle
name
PDMS
( wt %)
CS
(wt %)
Neat PDMS 100 0
CSA 10 90 10
CSA 20 80 20
CSA 30 70 30
CSA 40 60 40
CSB 10 90 10
CSB 20 80 20
CSB 30 70 30
CSB 40 60 40
CSC 10 90 10
CSC 20 80 20
CSC 30 70 30
CSC 40 60 40
CSB40 water 90 10
CSB40 IPA 80 20
CSB40 MP 70 30
10
performed by placing 0.3 g of CS dispersions at 150 °C temperature for 3 min and the
amount of solid present in the dispersions were found to be ~ 31 % for CSA and ~ 40 %
for CSB and CSC respectively.
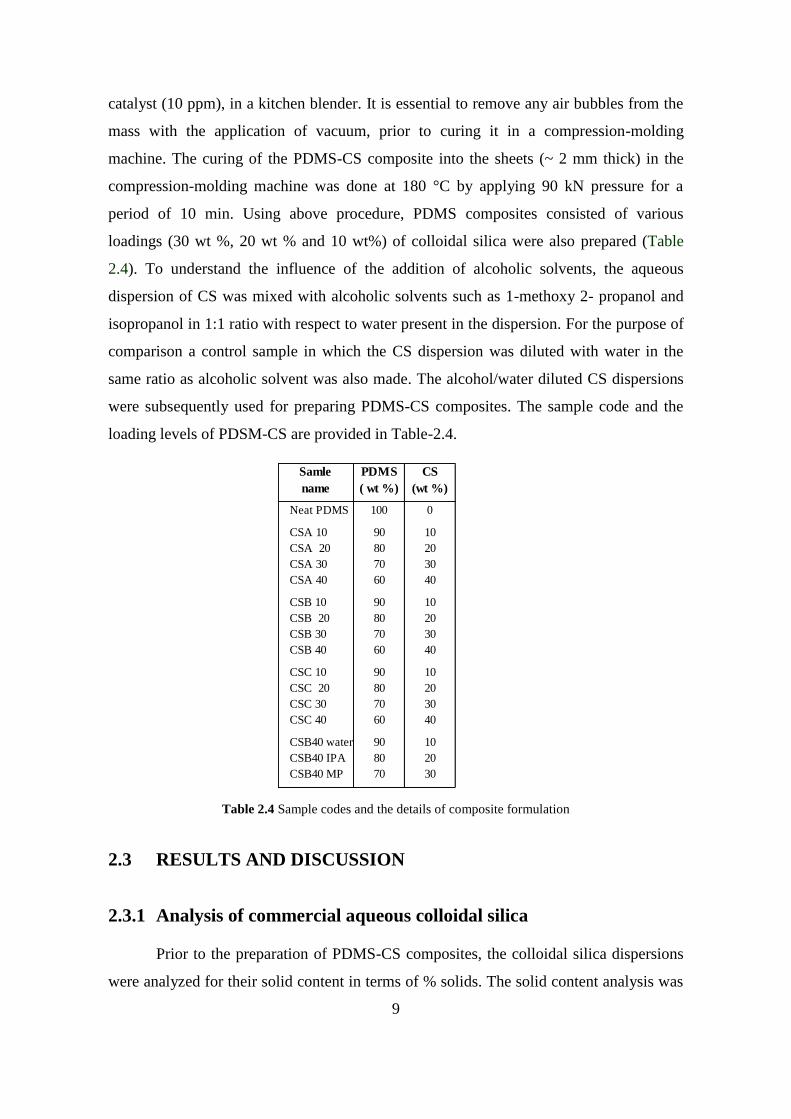
The size and distributions of CS particles was inferred through Transmission
Electron Microscopic (TEM) analysis of diluted CS dispersion (1 %) as shown in Figure
2.3. From TEM analyses, it is evident that all the CSA has particle size ~ 28 nm with
small distribution, whereas CSB and CSC have large distributions with average particle
size of ~ 38 nm and ~ 58 nm, respectively.
Figure 2.3 TEM analyses of commercial aqueous colloidal silica dispersions.
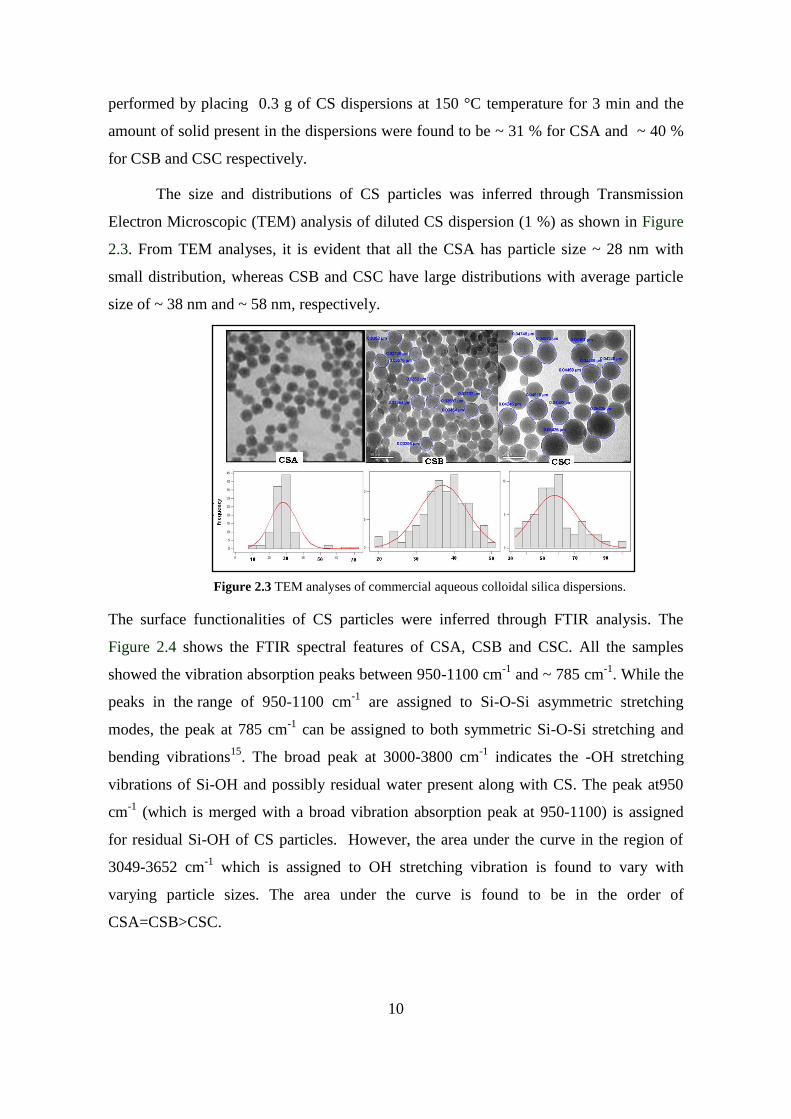
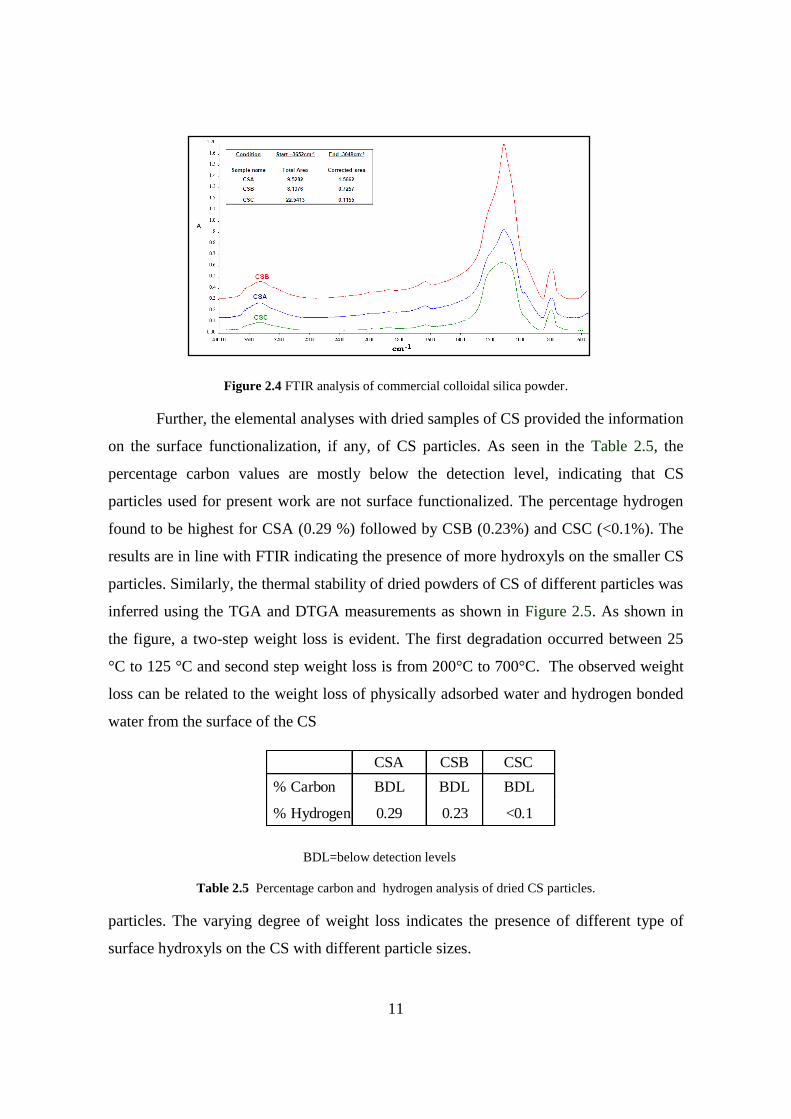
The surface functionalities of CS particles were inferred through FTIR analysis. The
Figure 2.4 shows the FTIR spectral features of CSA, CSB and CSC. All the samples
showed the vibration absorption peaks between 950-1100 cm-1
and ~ 785 cm-1
. While the
peaks in the range of 950-1100 cm-1
are assigned to Si-O-Si asymmetric stretching
modes, the peak at 785 cm-1
can be assigned to both symmetric Si-O-Si stretching and
bending vibrations15
. The broad peak at 3000-3800 cm-1
indicates the -OH stretching
vibrations of Si-OH and possibly residual water present along with CS. The peak at950
cm-1
(which is merged with a broad vibration absorption peak at 950-1100) is assigned
for residual Si-OH of CS particles. However, the area under the curve in the region of
3049-3652 cm-1
which is assigned to OH stretching vibration is found to vary with
varying particle sizes. The area under the curve is found to be in the order of
CSA=CSB>CSC.
11
Figure 2.4 FTIR analysis of commercial colloidal silica powder.
Further, the elemental analyses with dried samples of CS provided the information
on the surface functionalization, if any, of CS particles. As seen in the Table 2.5, the
percentage carbon values are mostly below the detection level, indicating that CS
particles used for present work are not surface functionalized. The percentage hydrogen
found to be highest for CSA (0.29 %) followed by CSB (0.23%) and CSC (<0.1%). The
results are in line with FTIR indicating the presence of more hydroxyls on the smaller CS
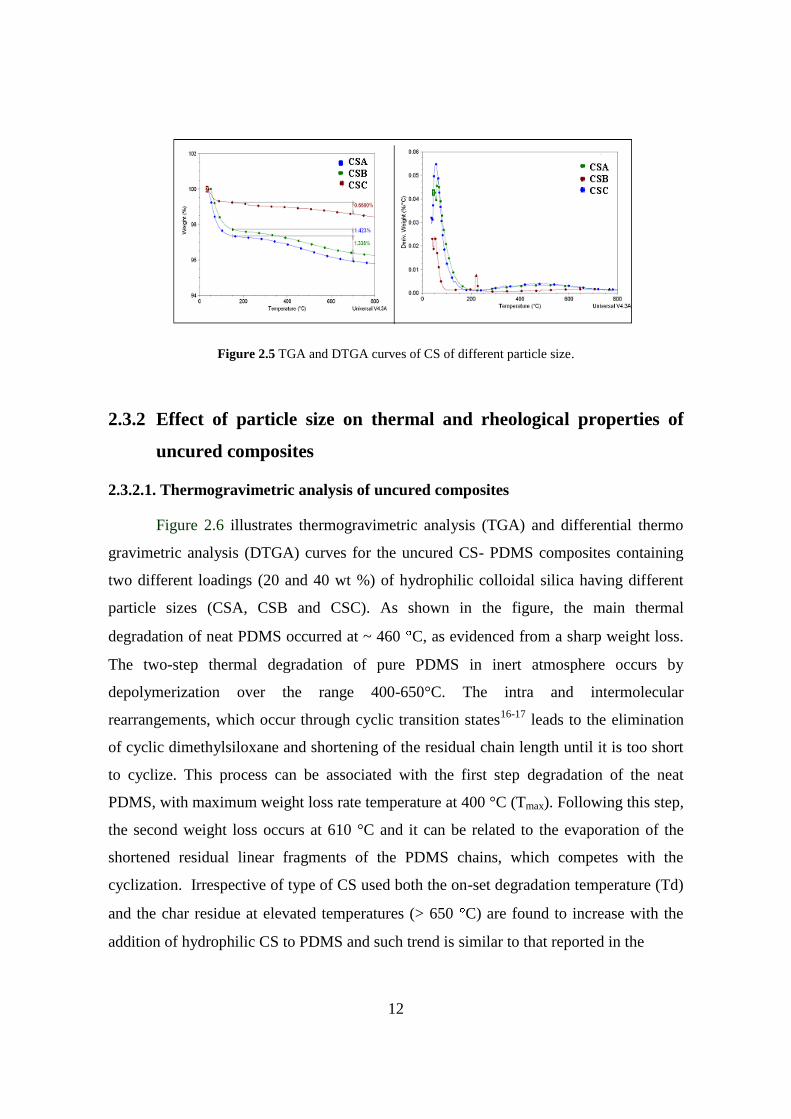
particles. Similarly, the thermal stability of dried powders of CS of different particles was
inferred using the TGA and DTGA measurements as shown in Figure 2.5. As shown in
the figure, a two-step weight loss is evident. The first degradation occurred between 25
°C to 125 °C and second step weight loss is from 200°C to 700°C. The observed weight
loss can be related to the weight loss of physically adsorbed water and hydrogen bonded
water from the surface of the CS
BDL=below detection levels
Table 2.5 Percentage carbon and hydrogen analysis of dried CS particles.
particles. The varying degree of weight loss indicates the presence of different type of
surface hydroxyls on the CS with different particle sizes.
CSA CSB CSC
% Carbon BDL BDL BDL
% Hydrogen 0.29 0.23 <0.1
12
Figure 2.5 TGA and DTGA curves of CS of different particle size.
2.3.2 Effect of particle size on thermal and rheological properties of
uncured composites
2.3.2.1. Thermogravimetric analysis of uncured composites
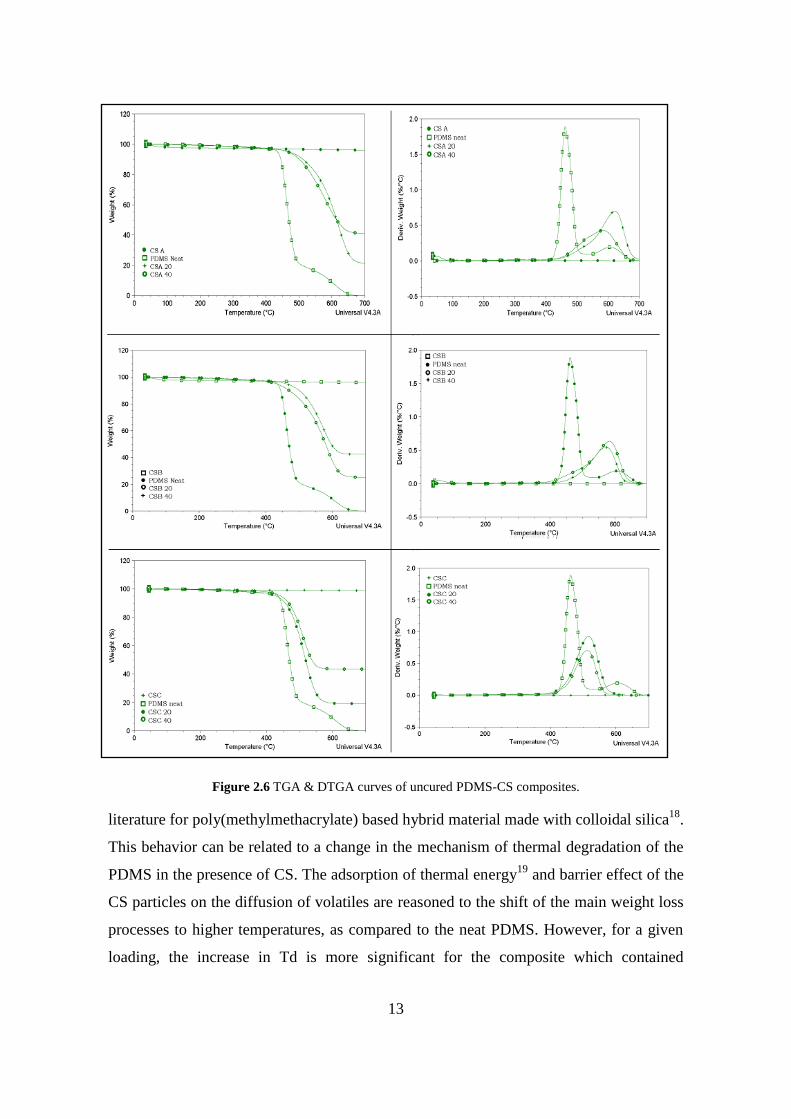
Figure 2.6 illustrates thermogravimetric analysis (TGA) and differential thermo
gravimetric analysis (DTGA) curves for the uncured CS- PDMS composites containing
two different loadings (20 and 40 wt %) of hydrophilic colloidal silica having different
particle sizes (CSA, CSB and CSC). As shown in the figure, the main thermal
degradation of neat PDMS occurred at ~ 460 C, as evidenced from a sharp weight loss.
The two-step thermal degradation of pure PDMS in inert atmosphere occurs by
depolymerization over the range 400-650°C. The intra and intermolecular
rearrangements, which occur through cyclic transition states16-17
leads to the elimination
of cyclic dimethylsiloxane and shortening of the residual chain length until it is too short
to cyclize. This process can be associated with the first step degradation of the neat
PDMS, with maximum weight loss rate temperature at 400 °C (Tmax). Following this step,
the second weight loss occurs at 610 °C and it can be related to the evaporation of the
shortened residual linear fragments of the PDMS chains, which competes with the
cyclization. Irrespective of type of CS used both the on-set degradation temperature (Td)
and the char residue at elevated temperatures (> 650 C) are found to increase with the
addition of hydrophilic CS to PDMS and such trend is similar to that reported in the
13
Figure 2.6 TGA & DTGA curves of uncured PDMS-CS composites.
literature for poly(methylmethacrylate) based hybrid material made with colloidal silica18
.
This behavior can be related to a change in the mechanism of thermal degradation of the
PDMS in the presence of CS. The adsorption of thermal energy19
and barrier effect of the
CS particles on the diffusion of volatiles are reasoned to the shift of the main weight loss
processes to higher temperatures, as compared to the neat PDMS. However, for a given
loading, the increase in Td is more significant for the composite which contained
14
colloidal silica of lower particle size. Accordingly, the increase of Td for different
PDMS-CS composites follows the trend: CSA > CSB > CSC. The increased Td in case of
CSA and CSB could be due to the barrier effect and heat sinking capability coming from
the strong hydrogen bonding due to relatively large number of silanols present at the
surface of CSA and CSB particles, as compare to those present on the CSC. The char
residue is found to vary slightly for different PDMS composites and such variations can
be rationalized to a difference in the dispersion of silica in the chosen samples.
2.3.2.2 Rheological characteristics
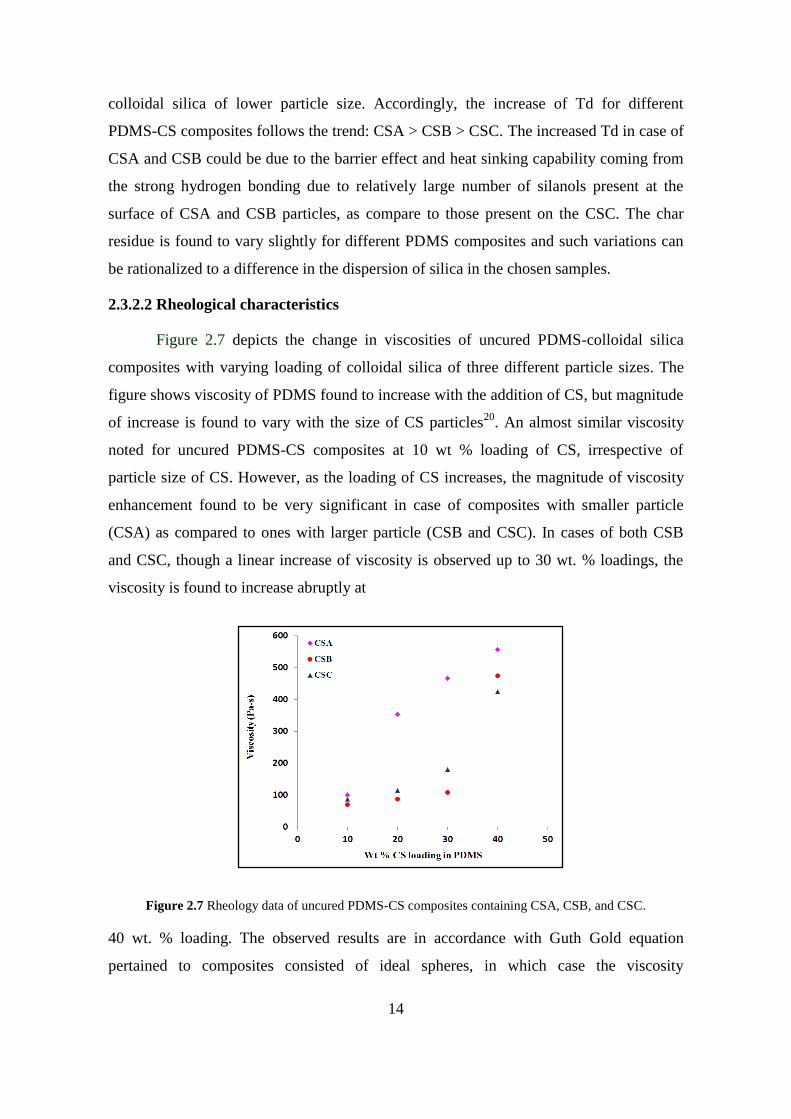
Figure 2.7 depicts the change in viscosities of uncured PDMS-colloidal silica
composites with varying loading of colloidal silica of three different particle sizes. The
figure shows viscosity of PDMS found to increase with the addition of CS, but magnitude
of increase is found to vary with the size of CS particles20
. An almost similar viscosity
noted for uncured PDMS-CS composites at 10 wt % loading of CS, irrespective of
particle size of CS. However, as the loading of CS increases, the magnitude of viscosity
enhancement found to be very significant in case of composites with smaller particle
(CSA) as compared to ones with larger particle (CSB and CSC). In cases of both CSB
and CSC, though a linear increase of viscosity is observed up to 30 wt. % loadings, the
viscosity is found to increase abruptly at
Figure 2.7 Rheology data of uncured PDMS-CS composites containing CSA, CSB, and CSC.
40 wt. % loading. The observed results are in accordance with Guth Gold equation
pertained to composites consisted of ideal spheres, in which case the viscosity
15
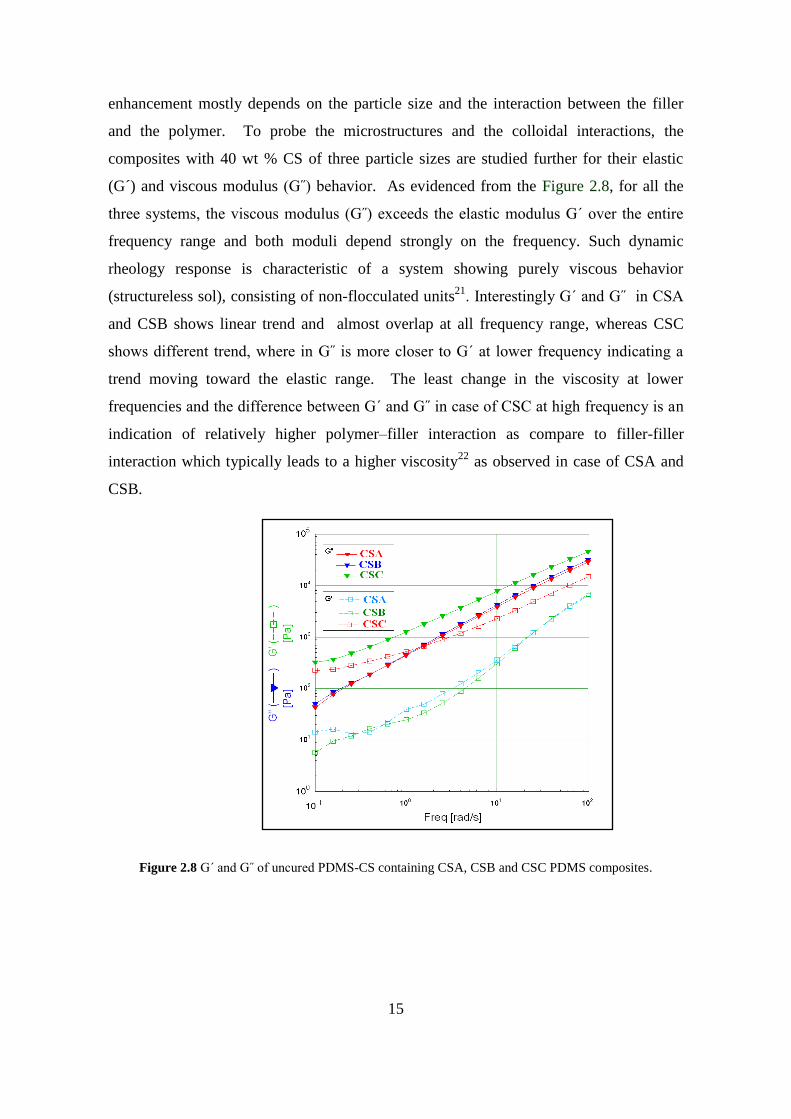
enhancement mostly depends on the particle size and the interaction between the filler
and the polymer. To probe the microstructures and the colloidal interactions, the
composites with 40 wt % CS of three particle sizes are studied further for their elastic
(G´) and viscous modulus (G˝) behavior. As evidenced from the Figure 2.8, for all the
three systems, the viscous modulus (G˝) exceeds the elastic modulus G´ over the entire
frequency range and both moduli depend strongly on the frequency. Such dynamic
rheology response is characteristic of a system showing purely viscous behavior
(structureless sol), consisting of non-flocculated units21
. Interestingly G´ and G˝ in CSA
and CSB shows linear trend and almost overlap at all frequency range, whereas CSC
shows different trend, where in G˝ is more closer to G´ at lower frequency indicating a
trend moving toward the elastic range. The least change in the viscosity at lower
frequencies and the difference between G´ and G˝ in case of CSC at high frequency is an
indication of relatively higher polymer–filler interaction as compare to filler-filler
interaction which typically leads to a higher viscosity22
as observed in case of CSA and
CSB.
Figure 2.8 G´ and G˝ of uncured PDMS-CS containing CSA, CSB and CSC PDMS composites.
16
2.3.3 Effect of particle size on structure and morphological properties
of cured composites
2.3.3.1 FTIR characterization of PDMS composites
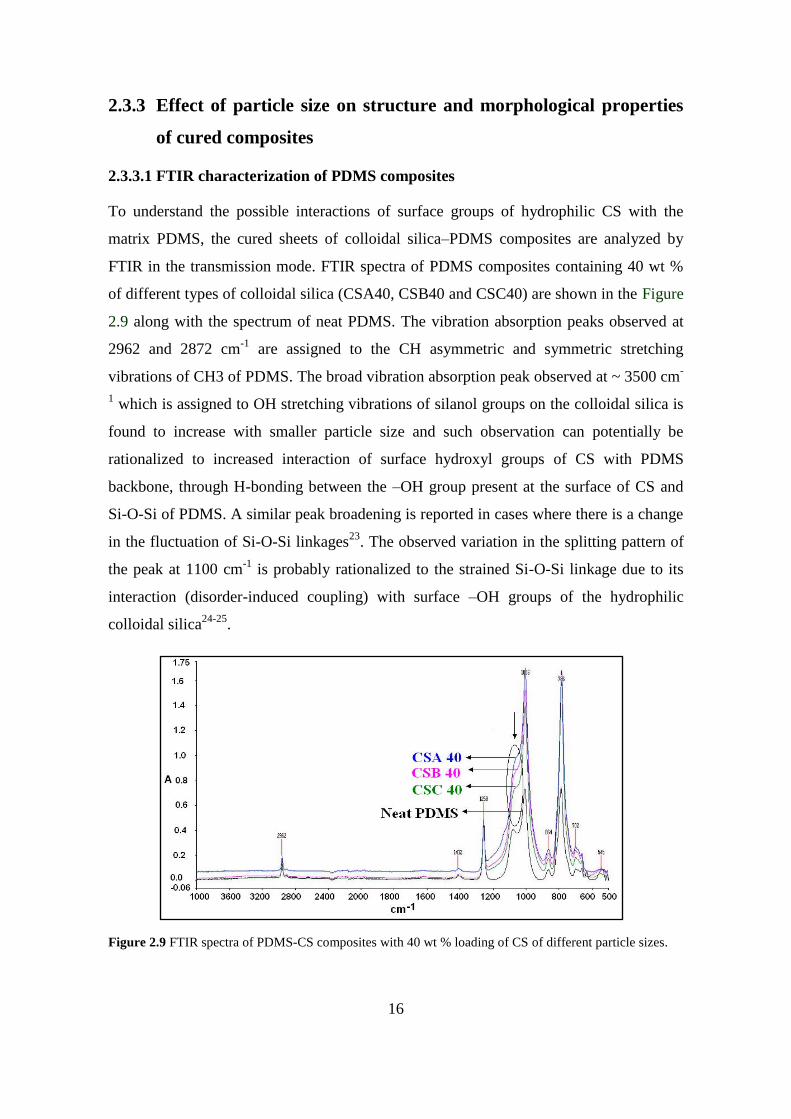
To understand the possible interactions of surface groups of hydrophilic CS with the
matrix PDMS, the cured sheets of colloidal silica–PDMS composites are analyzed by
FTIR in the transmission mode. FTIR spectra of PDMS composites containing 40 wt %
of different types of colloidal silica (CSA40, CSB40 and CSC40) are shown in the Figure
2.9 along with the spectrum of neat PDMS. The vibration absorption peaks observed at
2962 and 2872 cm-1
are assigned to the CH asymmetric and symmetric stretching
vibrations of CH3 of PDMS. The broad vibration absorption peak observed at ~ 3500 cm-
1 which is assigned to OH stretching vibrations of silanol groups on the colloidal silica is
found to increase with smaller particle size and such observation can potentially be
rationalized to increased interaction of surface hydroxyl groups of CS with PDMS
backbone, through H-bonding between the –OH group present at the surface of CS and
Si-O-Si of PDMS. A similar peak broadening is reported in cases where there is a change
in the fluctuation of Si-O-Si linkages23
. The observed variation in the splitting pattern of
the peak at 1100 cm-1
is probably rationalized to the strained Si-O-Si linkage due to its
interaction (disorder-induced coupling) with surface –OH groups of the hydrophilic
colloidal silica24-25
.
Figure 2.9 FTIR spectra of PDMS-CS composites with 40 wt % loading of CS of different particle sizes.
17
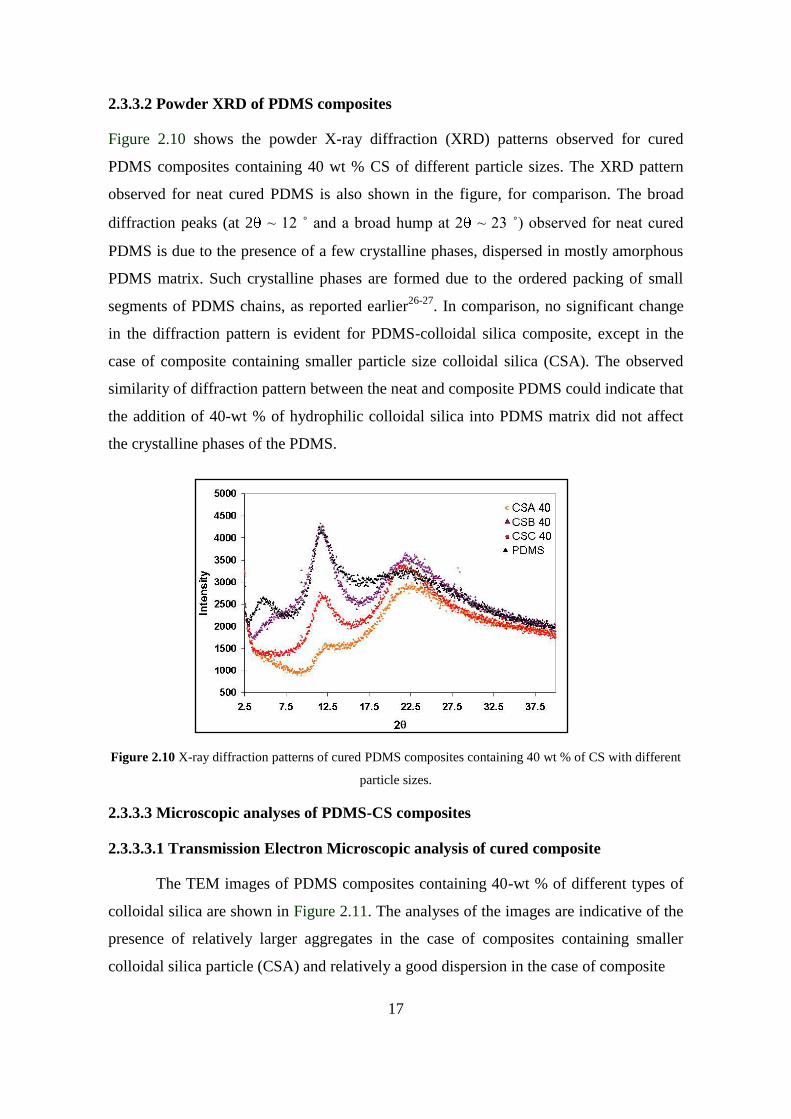
2.3.3.2 Powder XRD of PDMS composites
Figure 2.10 shows the powder X-ray diffraction (XRD) patterns observed for cured
PDMS composites containing 40 wt % CS of different particle sizes. The XRD pattern
observed for neat cured PDMS is also shown in the figure, for comparison. The broad
diffraction peaks (at 2 ~ 12 ˚ and a broad hump at 2 ~ 23 ˚) observed for neat cured
PDMS is due to the presence of a few crystalline phases, dispersed in mostly amorphous
PDMS matrix. Such crystalline phases are formed due to the ordered packing of small
segments of PDMS chains, as reported earlier26-27
. In comparison, no significant change
in the diffraction pattern is evident for PDMS-colloidal silica composite, except in the
case of composite containing smaller particle size colloidal silica (CSA). The observed
similarity of diffraction pattern between the neat and composite PDMS could indicate that
the addition of 40-wt % of hydrophilic colloidal silica into PDMS matrix did not affect
the crystalline phases of the PDMS.
Figure 2.10 X-ray diffraction patterns of cured PDMS composites containing 40 wt % of CS with different
particle sizes.
2.3.3.3 Microscopic analyses of PDMS-CS composites
2.3.3.3.1 Transmission Electron Microscopic analysis of cured composite
The TEM images of PDMS composites containing 40-wt % of different types of
colloidal silica are shown in Figure 2.11. The analyses of the images are indicative of the
presence of relatively larger aggregates in the case of composites containing smaller
colloidal silica particle (CSA) and relatively a good dispersion in the case of composite
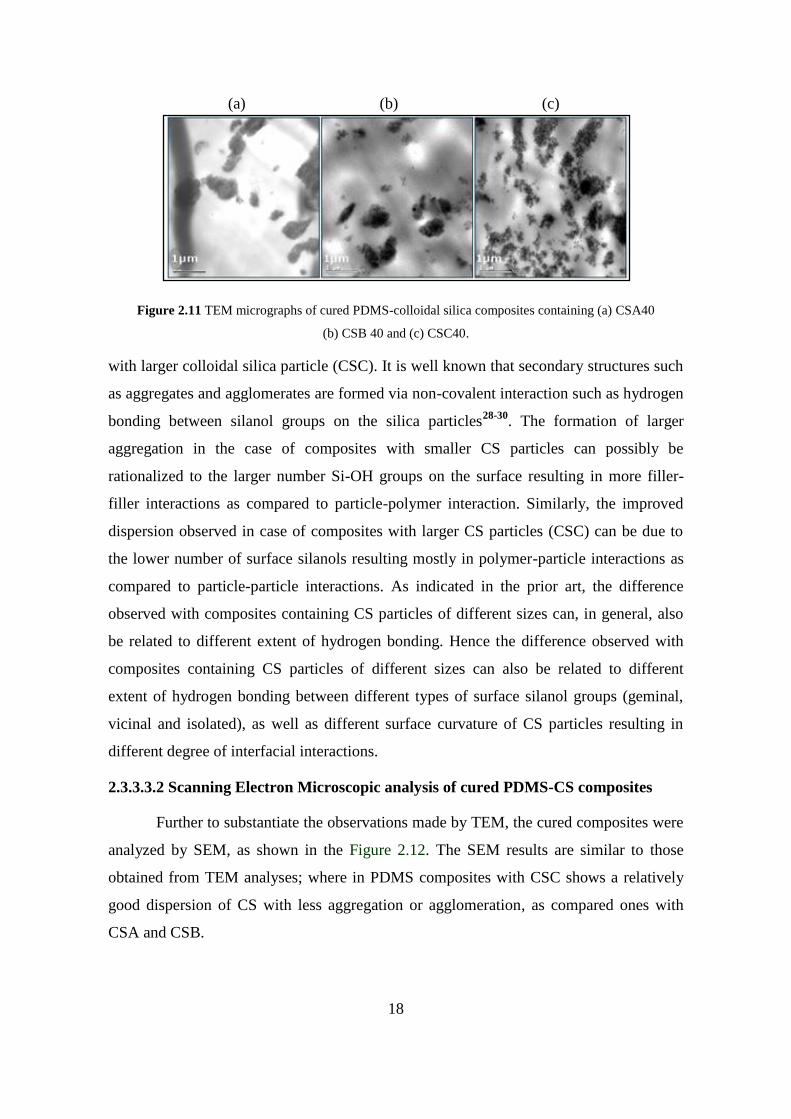
18
(a) (b) (c)
Figure 2.11 TEM micrographs of cured PDMS-colloidal silica composites containing (a) CSA40
(b) CSB 40 and (c) CSC40.
with larger colloidal silica particle (CSC). It is well known that secondary structures such
as aggregates and agglomerates are formed via non-covalent interaction such as hydrogen
bonding between silanol groups on the silica particles28-30
. The formation of larger
aggregation in the case of composites with smaller CS particles can possibly be
rationalized to the larger number Si-OH groups on the surface resulting in more filler-
filler interactions as compared to particle-polymer interaction. Similarly, the improved
dispersion observed in case of composites with larger CS particles (CSC) can be due to
the lower number of surface silanols resulting mostly in polymer-particle interactions as
compared to particle-particle interactions. As indicated in the prior art, the difference
observed with composites containing CS particles of different sizes can, in general, also
be related to different extent of hydrogen bonding. Hence the difference observed with
composites containing CS particles of different sizes can also be related to different
extent of hydrogen bonding between different types of surface silanol groups (geminal,
vicinal and isolated), as well as different surface curvature of CS particles resulting in
different degree of interfacial interactions.
2.3.3.3.2 Scanning Electron Microscopic analysis of cured PDMS-CS composites
Further to substantiate the observations made by TEM, the cured composites were
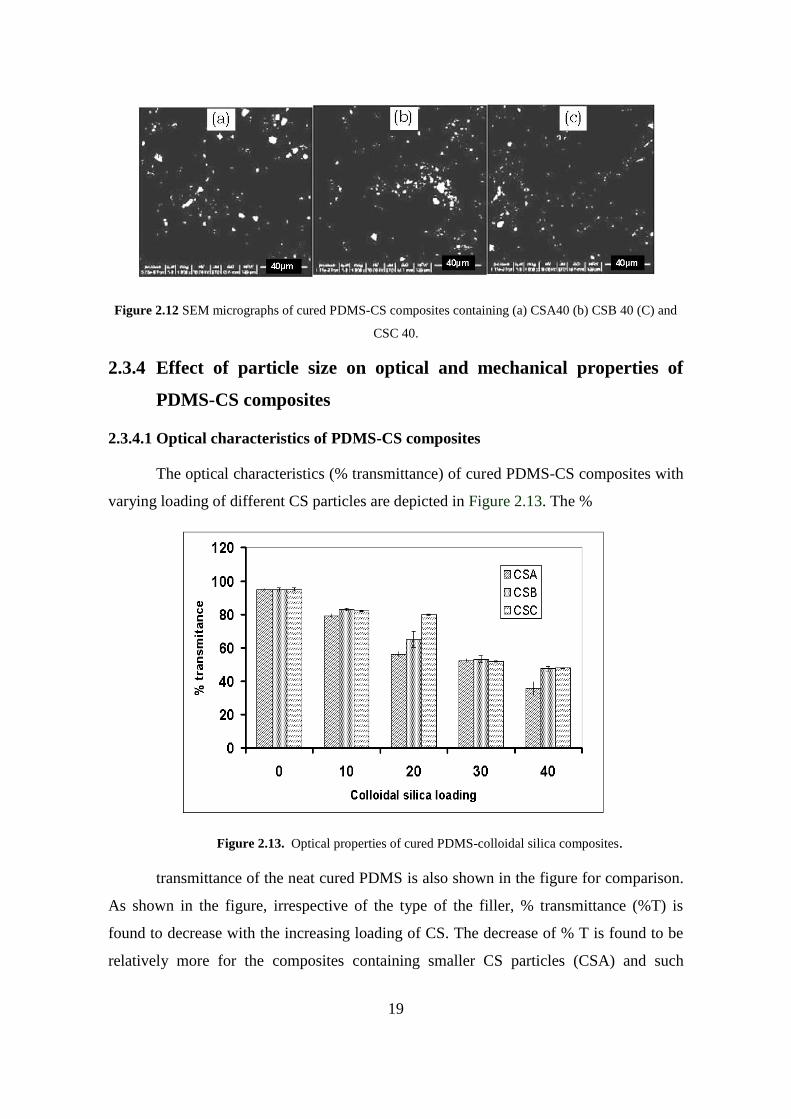
analyzed by SEM, as shown in the Figure 2.12. The SEM results are similar to those
obtained from TEM analyses; where in PDMS composites with CSC shows a relatively
good dispersion of CS with less aggregation or agglomeration, as compared ones with
CSA and CSB.
19
Figure 2.12 SEM micrographs of cured PDMS-CS composites containing (a) CSA40 (b) CSB 40 (C) and
CSC 40.
2.3.4 Effect of particle size on optical and mechanical properties of
PDMS-CS composites
2.3.4.1 Optical characteristics of PDMS-CS composites
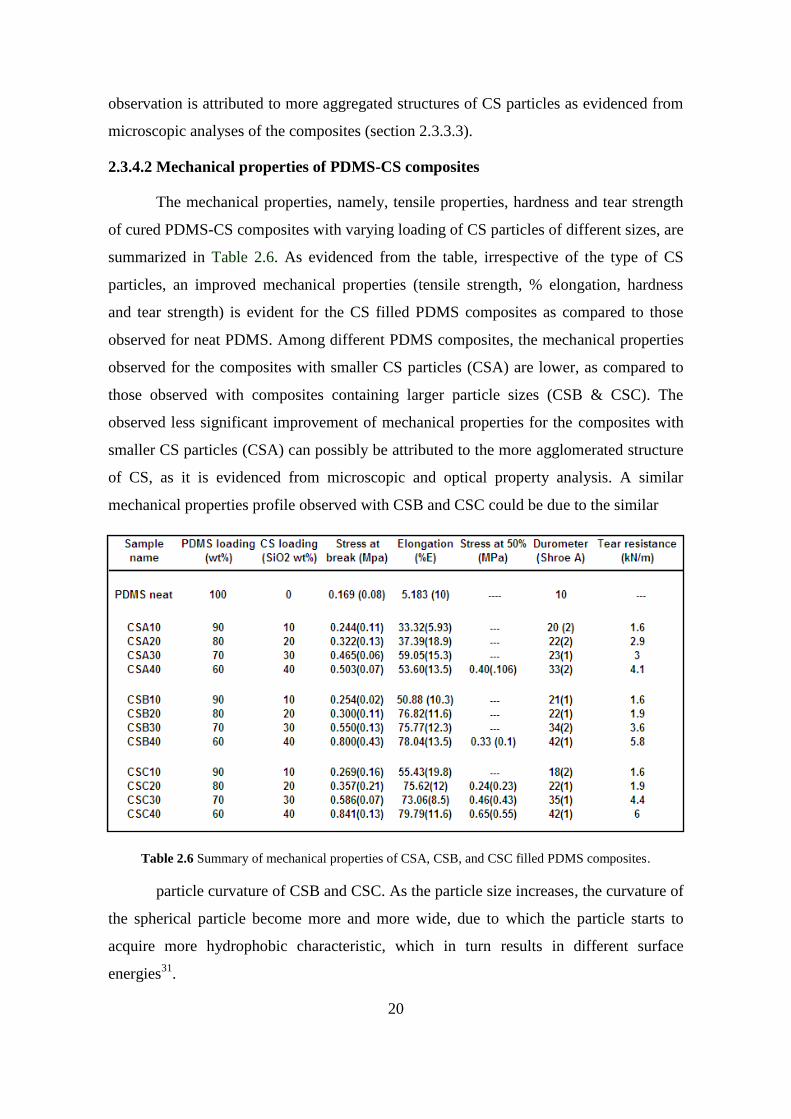
The optical characteristics (% transmittance) of cured PDMS-CS composites with
varying loading of different CS particles are depicted in Figure 2.13. The %
Figure 2.13. Optical properties of cured PDMS-colloidal silica composites.
transmittance of the neat cured PDMS is also shown in the figure for comparison.
As shown in the figure, irrespective of the type of the filler, % transmittance (%T) is
found to decrease with the increasing loading of CS. The decrease of % T is found to be
relatively more for the composites containing smaller CS particles (CSA) and such
20
observation is attributed to more aggregated structures of CS particles as evidenced from
microscopic analyses of the composites (section 2.3.3.3).
2.3.4.2 Mechanical properties of PDMS-CS composites
The mechanical properties, namely, tensile properties, hardness and tear strength
of cured PDMS-CS composites with varying loading of CS particles of different sizes, are
summarized in Table 2.6. As evidenced from the table, irrespective of the type of CS
particles, an improved mechanical properties (tensile strength, % elongation, hardness
and tear strength) is evident for the CS filled PDMS composites as compared to those
observed for neat PDMS. Among different PDMS composites, the mechanical properties
observed for the composites with smaller CS particles (CSA) are lower, as compared to
those observed with composites containing larger particle sizes (CSB & CSC). The
observed less significant improvement of mechanical properties for the composites with
smaller CS particles (CSA) can possibly be attributed to the more agglomerated structure
of CS, as it is evidenced from microscopic and optical property analysis. A similar
mechanical properties profile observed with CSB and CSC could be due to the similar
Table 2.6 Summary of mechanical properties of CSA, CSB, and CSC filled PDMS composites.
particle curvature of CSB and CSC. As the particle size increases, the curvature of
the spherical particle become more and more wide, due to which the particle starts to
acquire more hydrophobic characteristic, which in turn results in different surface
energies31
.
21
The reinforcement is a surface phenomenon and it results from both
chemisorptions and the physisorption of filler onto the polymer matrix. The physisorption
is due to the interaction of surface –OH groups of colloidal silica with the PDMS chain
segments. A small variation in number of silanol groups, the surface curvature of
particles and the resulting surface energies can lead to different levels of physisorption of
CS onto PDMS in PDMS-CS composites. The ultimate particle-particle and particle–
polymer variation may also get stabilized after certain particle size range, as evident from
only a small difference in mechanical properties of composites with CSB and CSC.
2.3.5 Effect of co-solvent on rheological properties of PDMS composites
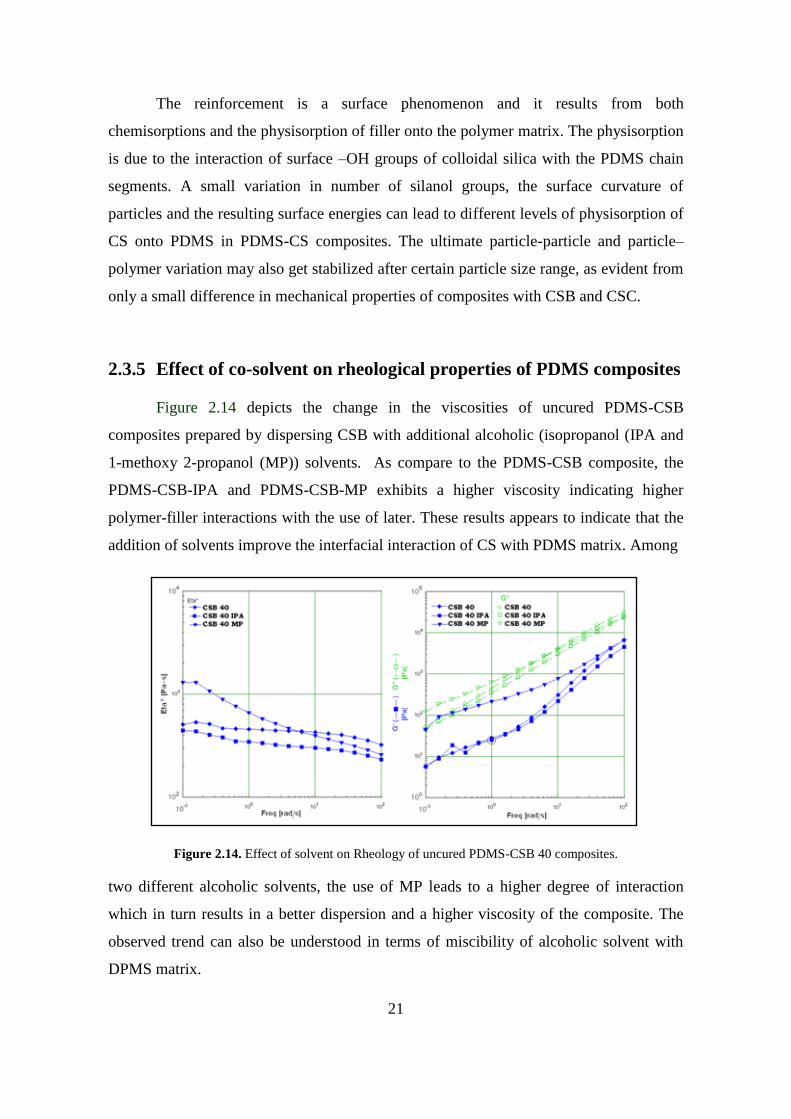
Figure 2.14 depicts the change in the viscosities of uncured PDMS-CSB
composites prepared by dispersing CSB with additional alcoholic (isopropanol (IPA and
1-methoxy 2-propanol (MP)) solvents. As compare to the PDMS-CSB composite, the
PDMS-CSB-IPA and PDMS-CSB-MP exhibits a higher viscosity indicating higher
polymer-filler interactions with the use of later. These results appears to indicate that the
addition of solvents improve the interfacial interaction of CS with PDMS matrix. Among
Figure 2.14. Effect of solvent on Rheology of uncured PDMS-CSB 40 composites.
two different alcoholic solvents, the use of MP leads to a higher degree of interaction
which in turn results in a better dispersion and a higher viscosity of the composite. The
observed trend can also be understood in terms of miscibility of alcoholic solvent with
DPMS matrix.
22
2.3.6 Effect of co-solvent on morphological properties of PDMS
composites
2.3.6.1 TEM analysis
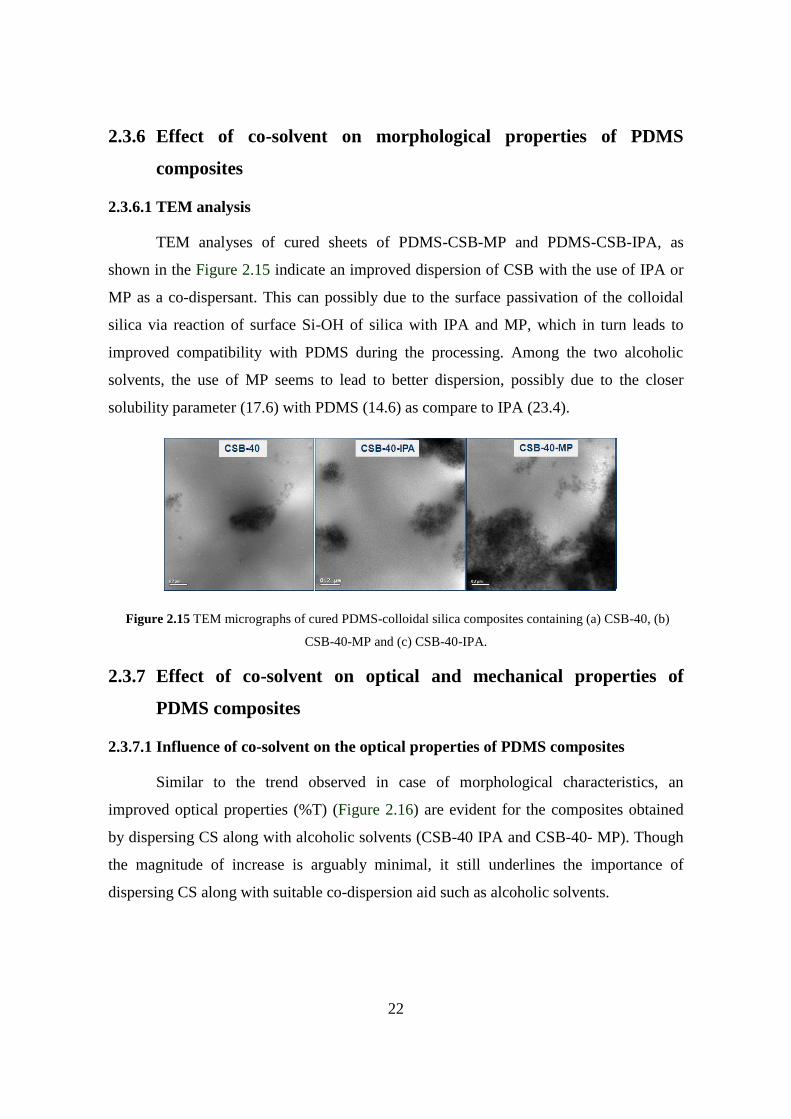
TEM analyses of cured sheets of PDMS-CSB-MP and PDMS-CSB-IPA, as
shown in the Figure 2.15 indicate an improved dispersion of CSB with the use of IPA or
MP as a co-dispersant. This can possibly due to the surface passivation of the colloidal
silica via reaction of surface Si-OH of silica with IPA and MP, which in turn leads to
improved compatibility with PDMS during the processing. Among the two alcoholic
solvents, the use of MP seems to lead to better dispersion, possibly due to the closer
solubility parameter (17.6) with PDMS (14.6) as compare to IPA (23.4).
Figure 2.15 TEM micrographs of cured PDMS-colloidal silica composites containing (a) CSB-40, (b)
CSB-40-MP and (c) CSB-40-IPA.
2.3.7 Effect of co-solvent on optical and mechanical properties of
PDMS composites
2.3.7.1 Influence of co-solvent on the optical properties of PDMS composites
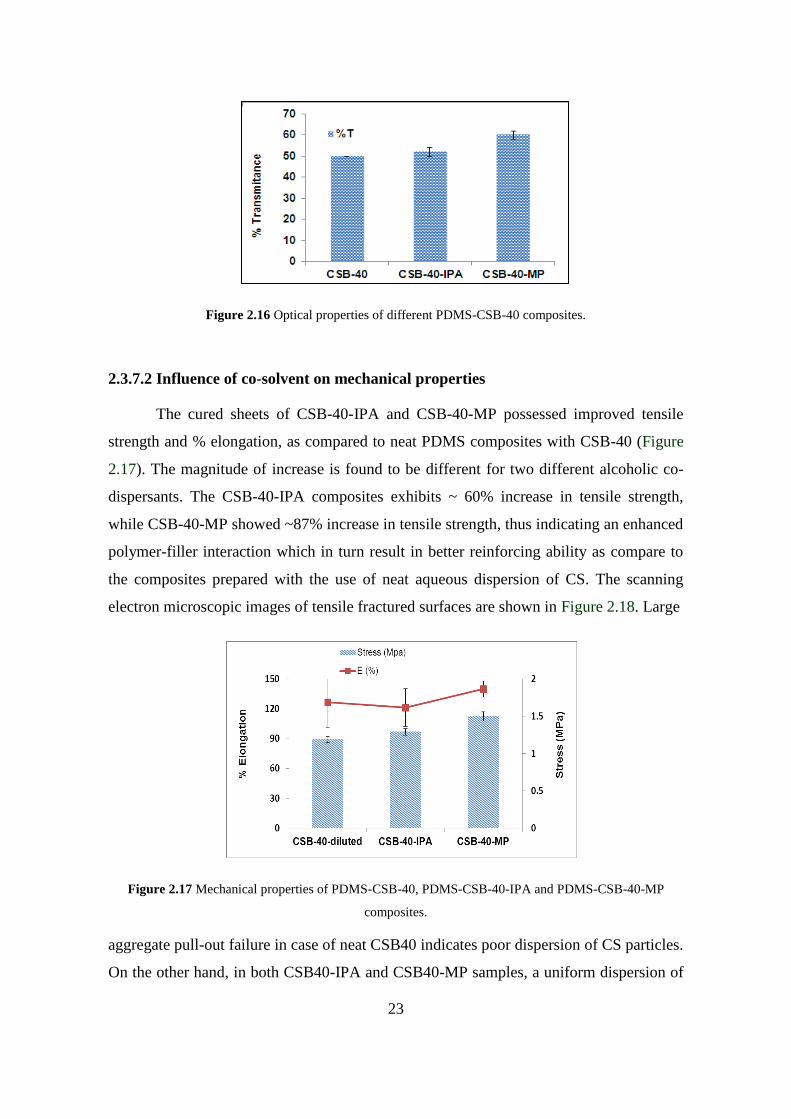
Similar to the trend observed in case of morphological characteristics, an
improved optical properties (%T) (Figure 2.16) are evident for the composites obtained
by dispersing CS along with alcoholic solvents (CSB-40 IPA and CSB-40- MP). Though
the magnitude of increase is arguably minimal, it still underlines the importance of
dispersing CS along with suitable co-dispersion aid such as alcoholic solvents.
23
Figure 2.16 Optical properties of different PDMS-CSB-40 composites.
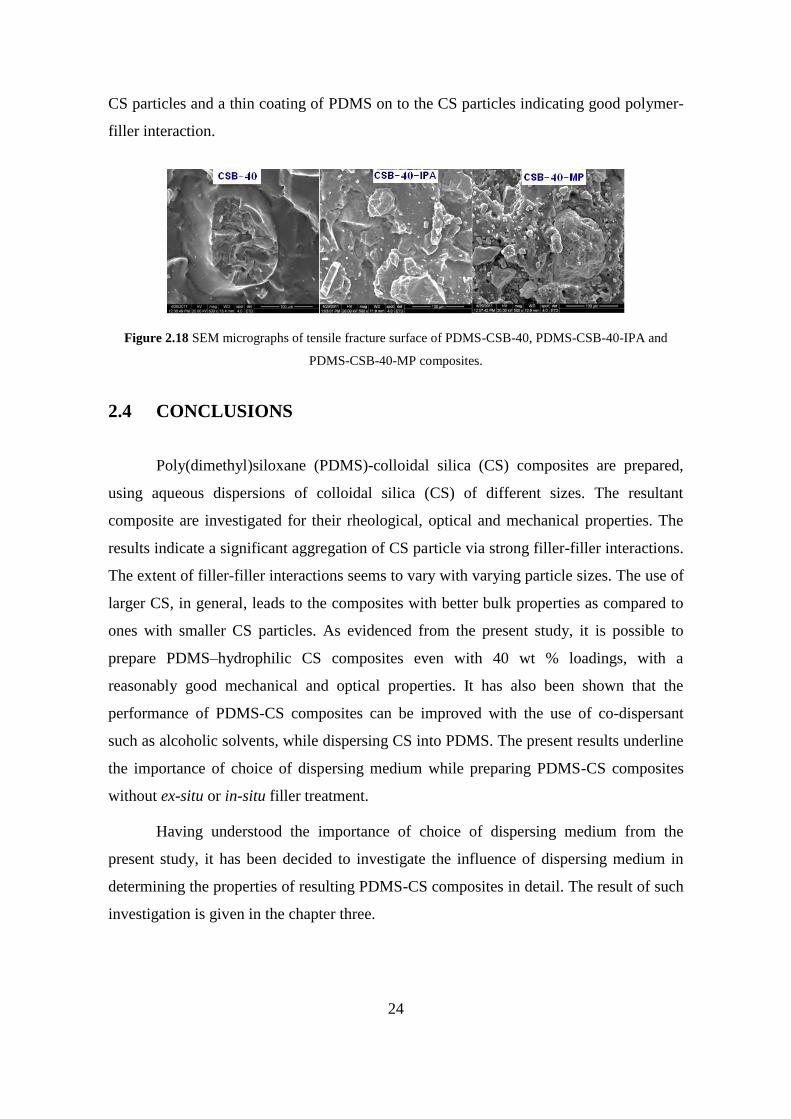
2.3.7.2 Influence of co-solvent on mechanical properties
The cured sheets of CSB-40-IPA and CSB-40-MP possessed improved tensile
strength and % elongation, as compared to neat PDMS composites with CSB-40 (Figure
2.17). The magnitude of increase is found to be different for two different alcoholic co-
dispersants. The CSB-40-IPA composites exhibits ~ 60% increase in tensile strength,
while CSB-40-MP showed ~87% increase in tensile strength, thus indicating an enhanced
polymer-filler interaction which in turn result in better reinforcing ability as compare to
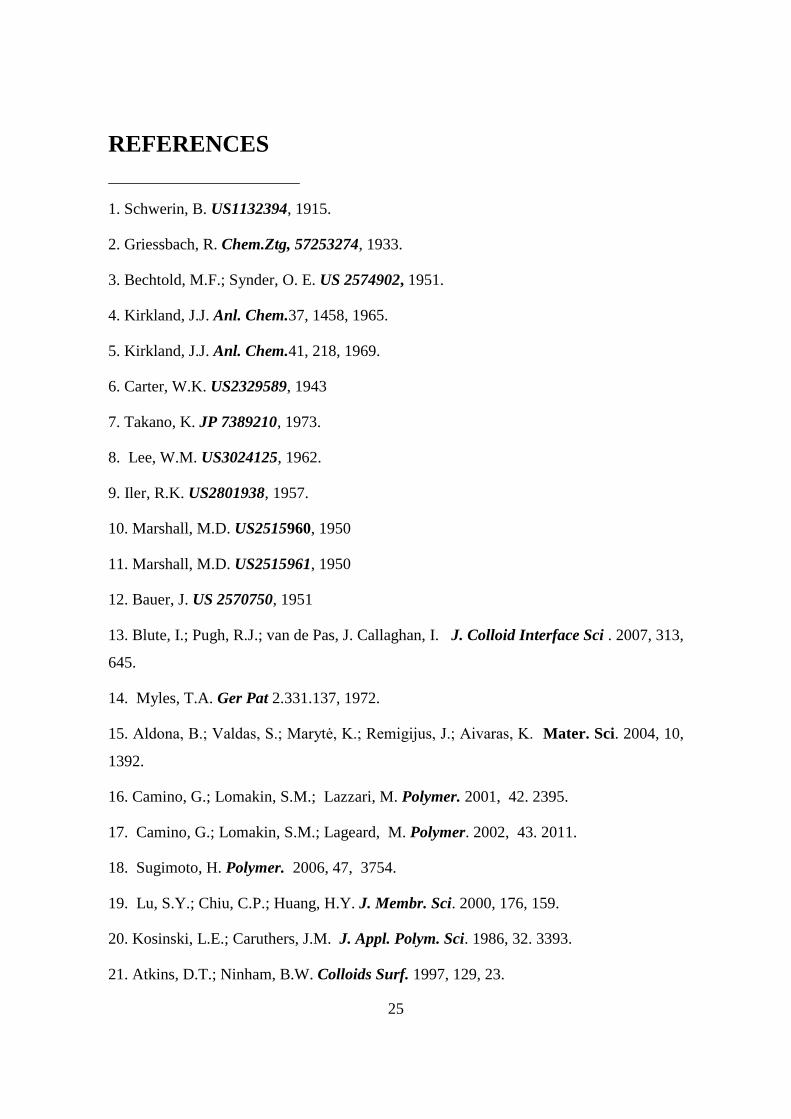
the composites prepared with the use of neat aqueous dispersion of CS. The scanning
electron microscopic images of tensile fractured surfaces are shown in Figure 2.18. Large
Figure 2.17 Mechanical properties of PDMS-CSB-40, PDMS-CSB-40-IPA and PDMS-CSB-40-MP
composites.
aggregate pull-out failure in case of neat CSB40 indicates poor dispersion of CS particles.
On the other hand, in both CSB40-IPA and CSB40-MP samples, a uniform dispersion of
24
CS particles and a thin coating of PDMS on to the CS particles indicating good polymer-
filler interaction.
Figure 2.18 SEM micrographs of tensile fracture surface of PDMS-CSB-40, PDMS-CSB-40-IPA and
PDMS-CSB-40-MP composites.
2.4 CONCLUSIONS
Poly(dimethyl)siloxane (PDMS)-colloidal silica (CS) composites are prepared,
using aqueous dispersions of colloidal silica (CS) of different sizes. The resultant
composite are investigated for their rheological, optical and mechanical properties. The
results indicate a significant aggregation of CS particle via strong filler-filler interactions.
The extent of filler-filler interactions seems to vary with varying particle sizes. The use of
larger CS, in general, leads to the composites with better bulk properties as compared to
ones with smaller CS particles. As evidenced from the present study, it is possible to
prepare PDMS–hydrophilic CS composites even with 40 wt % loadings, with a
reasonably good mechanical and optical properties. It has also been shown that the
performance of PDMS-CS composites can be improved with the use of co-dispersant
such as alcoholic solvents, while dispersing CS into PDMS. The present results underline
the importance of choice of dispersing medium while preparing PDMS-CS composites
without ex-situ or in-situ filler treatment.
Having understood the importance of choice of dispersing medium from the
present study, it has been decided to investigate the influence of dispersing medium in
determining the properties of resulting PDMS-CS composites in detail. The result of such
investigation is given in the chapter three.
25
REFERENCES
1. Schwerin, B. US1132394, 1915.
2. Griessbach, R. Chem.Ztg, 57253274, 1933.
3. Bechtold, M.F.; Synder, O. E. US 2574902, 1951.
4. Kirkland, J.J. Anl. Chem.37, 1458, 1965.
5. Kirkland, J.J. Anl. Chem.41, 218, 1969.
6. Carter, W.K. US2329589, 1943
7. Takano, K. JP 7389210, 1973.
8. Lee, W.M. US3024125, 1962.
9. Iler, R.K. US2801938, 1957.
10. Marshall, M.D. US2515960, 1950
11. Marshall, M.D. US2515961, 1950
12. Bauer, J. US 2570750, 1951
13. Blute, I.; Pugh, R.J.; van de Pas, J. Callaghan, I. J. Colloid Interface Sci . 2007, 313,
645.
14. Myles, T.A. Ger Pat 2.331.137, 1972.
15. Aldona, B.; Valdas, S.; Marytė, K.; Remigijus, J.; Aivaras, K. Mater. Sci. 2004, 10,
1392.
16. Camino, G.; Lomakin, S.M.; Lazzari, M. Polymer. 2001, 42. 2395.
17. Camino, G.; Lomakin, S.M.; Lageard, M. Polymer. 2002, 43. 2011.
18. Sugimoto, H. Polymer. 2006, 47, 3754.
19. Lu, S.Y.; Chiu, C.P.; Huang, H.Y. J. Membr. Sci. 2000, 176, 159.
20. Kosinski, L.E.; Caruthers, J.M. J. Appl. Polym. Sci. 1986, 32. 3393.
21. Atkins, D.T.; Ninham, B.W. Colloids Surf. 1997, 129, 23.
26
22. Edwards, D. C. J. Mater. Sci. 1990, 2, 4175.
23. Zhili, LI.; Wei, H.; Dmitry, K.; Jose, C.M.; J. Brokken,Z; Gijsbertus de; Peter, C.T.
Polymer. 2006, 47, 1150.
24. Dhas, N.A.; Gedanken, A.; Chem. Mater. 1997, 9, 3144.
25. Dhas, N.A.; Gedanken, A. Appl. Phys. Lett. 1998, 72, 2511.
26. David, E. W. Vaoghan, US3884835, 1975.
27. Zoran, S.; Petrovi .; Ivan, J.; Alan, W.; György, B. J. Appl. Polym. Sci. 2000, 76,
133.
28. Wolff, S. Rubber Chem Technol. 1996, 69, 325.
29. Michal, G.; Ferch, H.; Schriftenreihe pigmente. Degussa Ag (F.R.G.) 1991, 11, 63.
30. Kralevich, M. L.; Koenig,J. L. Rubber Chem. Technol. 1998, 71, 300.
31. Motoyuki, I.; Mayumi, T.; Hidehiro Kamiya. J . Colloid Interface Sci. 2007, 307,
418.