Chapter 2: Population Key Issue 2: Why Do Populations Rise & Fall in Particular Places?
35
Chapter 2: Population Key Issue 2: Why Do Populations Rise & Fall in Particular Places?
-
Upload
susanna-bell -
Category
Documents
-
view
226 -
download
0
Transcript of Chapter 2: Population Key Issue 2: Why Do Populations Rise & Fall in Particular Places?

Chapter 2: Population
Key Issue 2: Why Do Populations Rise & Fall in Particular Places?

AP Human Geography is not just another class…
It is a matter of LIFE and DEATH!
Key Issue Overview
• Introduction• Natural Increase
– Crude Birth Rate (CBR)– Crude Death Rate (CDR)– Natural Increase Rate (NIR)– Doubling Time
• Fertility– Total Fertility Rate (TFR)
• Mortality– Infant Mortality Rate (IMR)– Life Expectancy
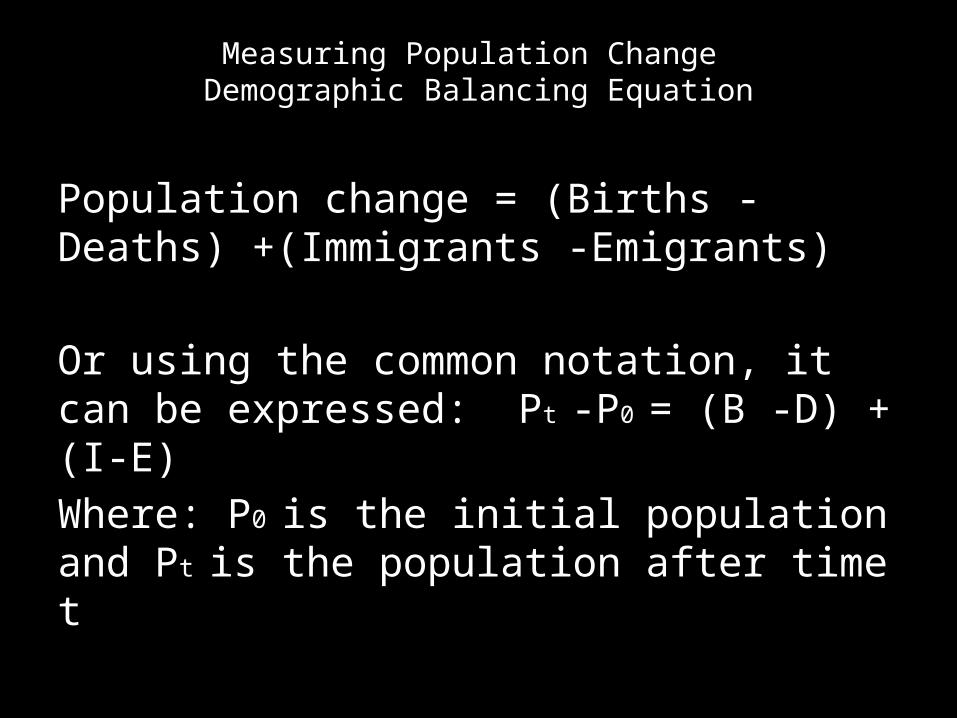
Measuring Population Change Demographic Balancing Equation
Population change = (Births -Deaths) +(Immigrants -Emigrants)
Or using the common notation, it can be expressed: Pt -P0 = (B -D) + (I-E)Where: P0 is the initial population and Pt is the population after time t

Measuring Population Change Natural Increase
• In this chapter, we will just be looking at births and deaths.
• This is called the ‘Natural Increase’. • We will bring migration into the equation in
Chapter 3.

WORLD POPULATION GROWTH

WORLD POPULATION GROWTH

• Natural Increase Rate (NIR)– Percentage by which a population grows in a year– Only uses birth and death rates– Immigration and emigration are excluded
• Doubling time– Number of years needed to double a population

Crude Birth Rate (CBR)Total number of live births per year / 1,000 people in a society
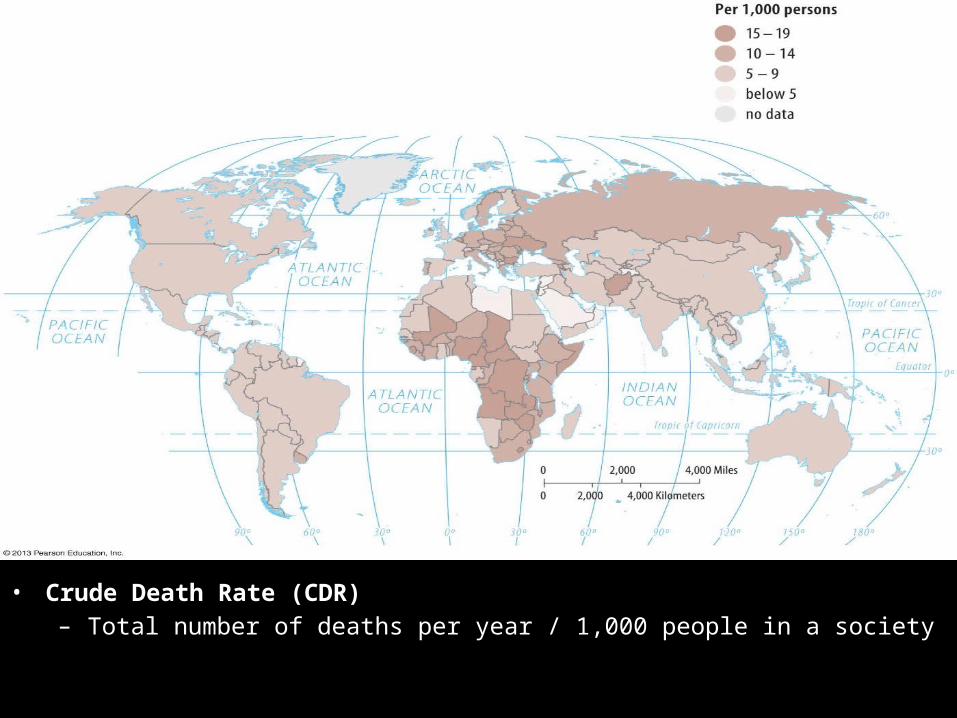
• Crude Death Rate (CDR)– Total number of deaths per year / 1,000 people in a society
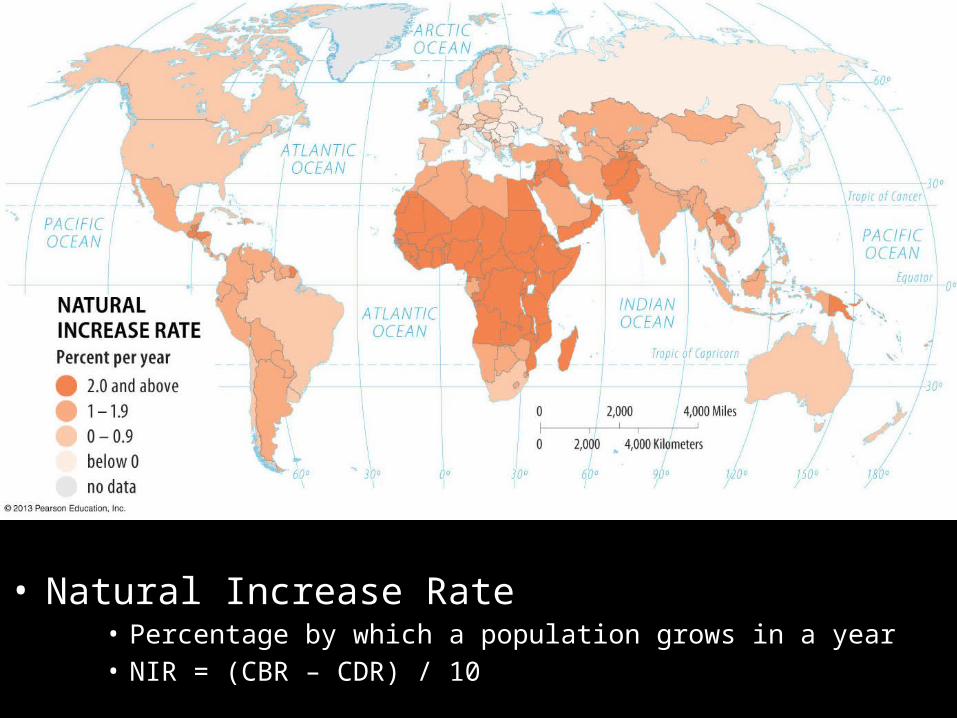
• Natural Increase Rate• Percentage by which a population grows in a year• NIR = (CBR – CDR) / 10
Components of Population Growth
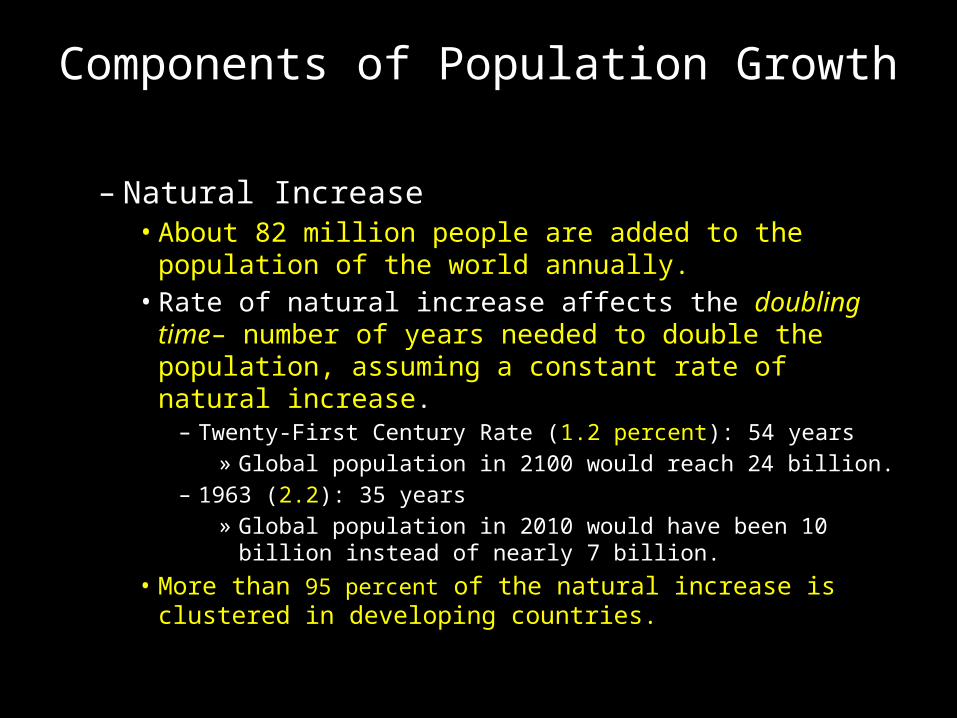
– Natural Increase• About 82 million people are added to the population of
the world annually.• Rate of natural increase affects the doubling time–
number of years needed to double the population, assuming a constant rate of natural increase.
– Twenty-First Century Rate (1.2 percent): 54 years» Global population in 2100 would reach 24 billion.
– 1963 (2.2): 35 years» Global population in 2010 would have been 10 billion
instead of nearly 7 billion.
• More than 95 percent of the natural increase is clustered in developing countries.
Natural Increase Rate Example
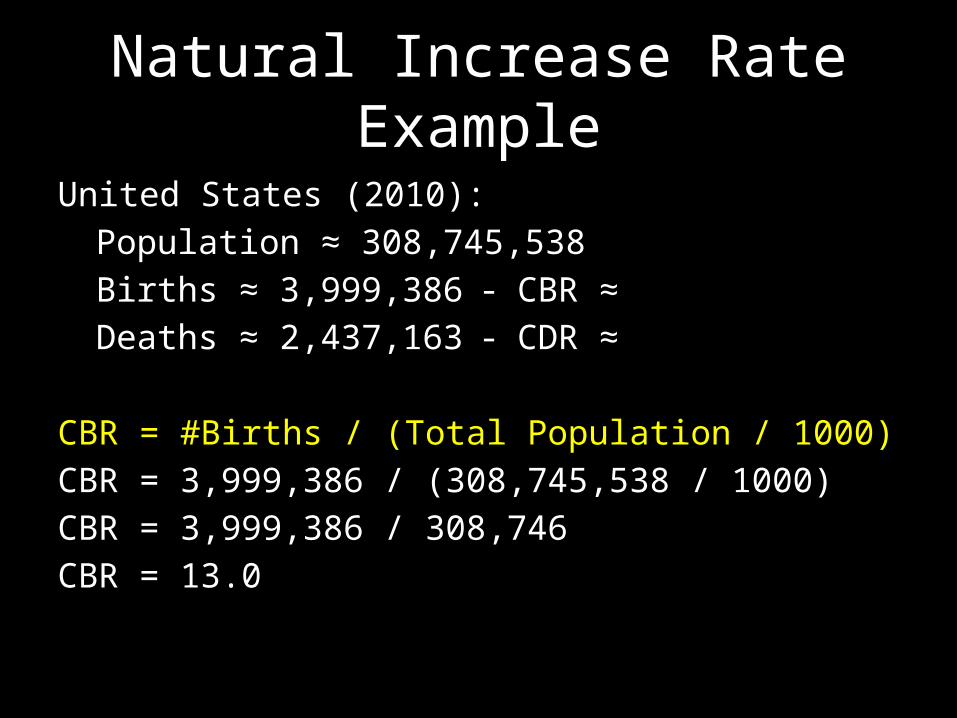
United States (2010):Population ≈ 308,745,538Births ≈ 3,999,386 - CBR ≈Deaths ≈ 2,437,163 - CDR ≈
CBR = #Births / (Total Population / 1000)CBR = 3,999,386 / (308,745,538 / 1000)CBR = 3,999,386 / 308,746CBR = 13.0

Natural Increase Rate Example
United States (2010):Population ≈ 308,745,538Births ≈ 3,999,386 - CBR ≈ 13Deaths ≈ 2,437,163 - CDR ≈
CDR = #Deaths / (Total Population / 1000)CDR = 2,437,163 / (308,745,538 / 1000)CDR = 2,437,163 / 308,746CDR = 8
Natural Increase Rate Example
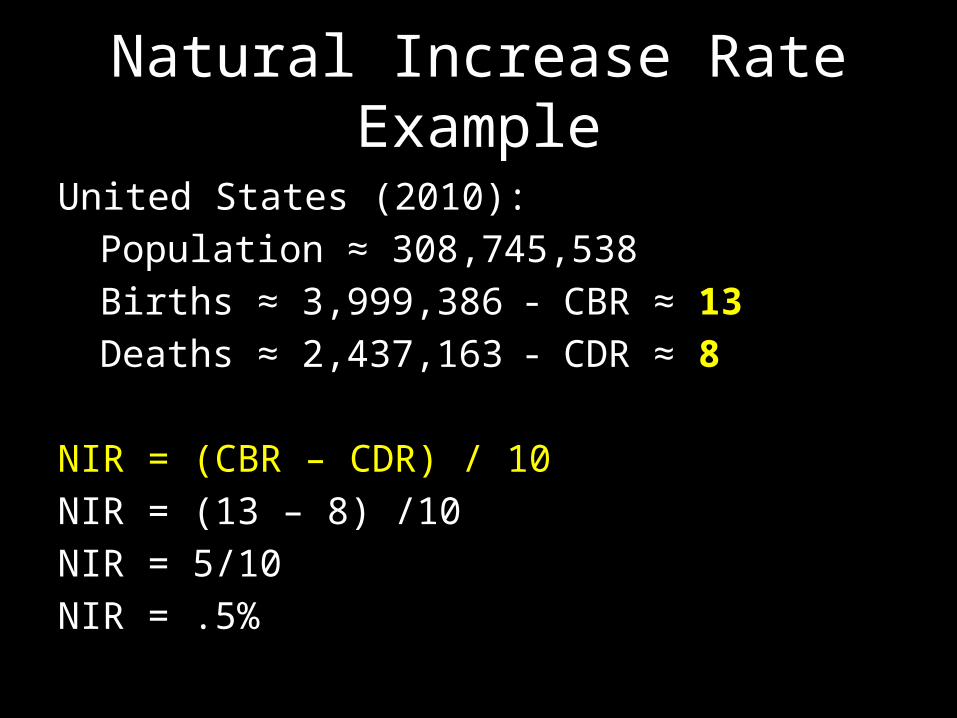
United States (2010):Population ≈ 308,745,538Births ≈ 3,999,386 - CBR ≈ 13Deaths ≈ 2,437,163 - CDR ≈ 8
NIR = (CBR – CDR) / 10NIR = (13 – 8) /10NIR = 5/10NIR = .5%
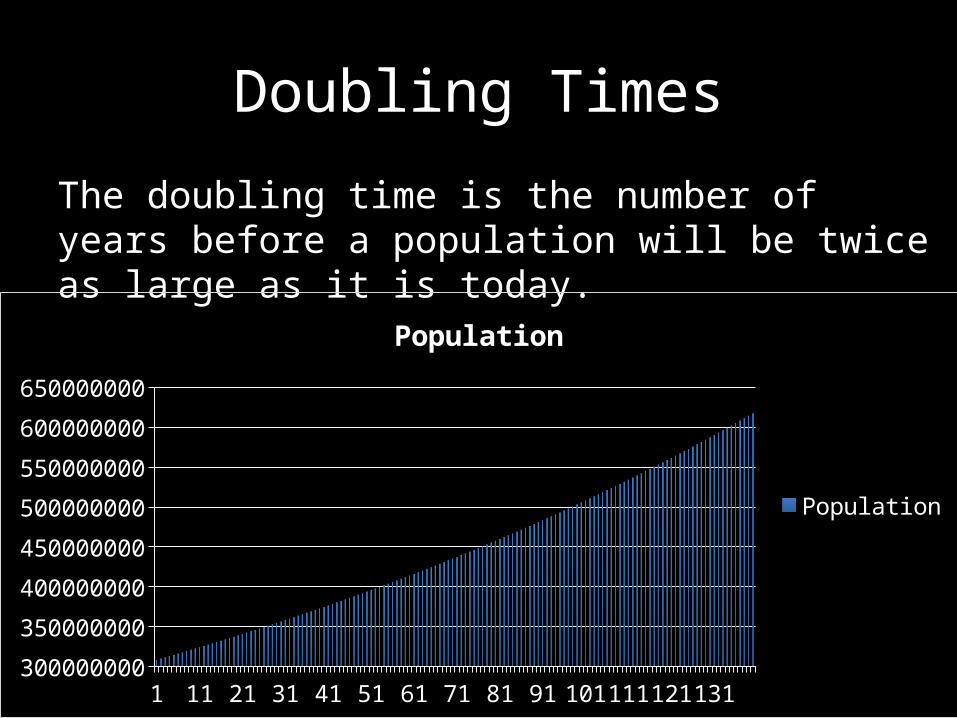
Doubling Times
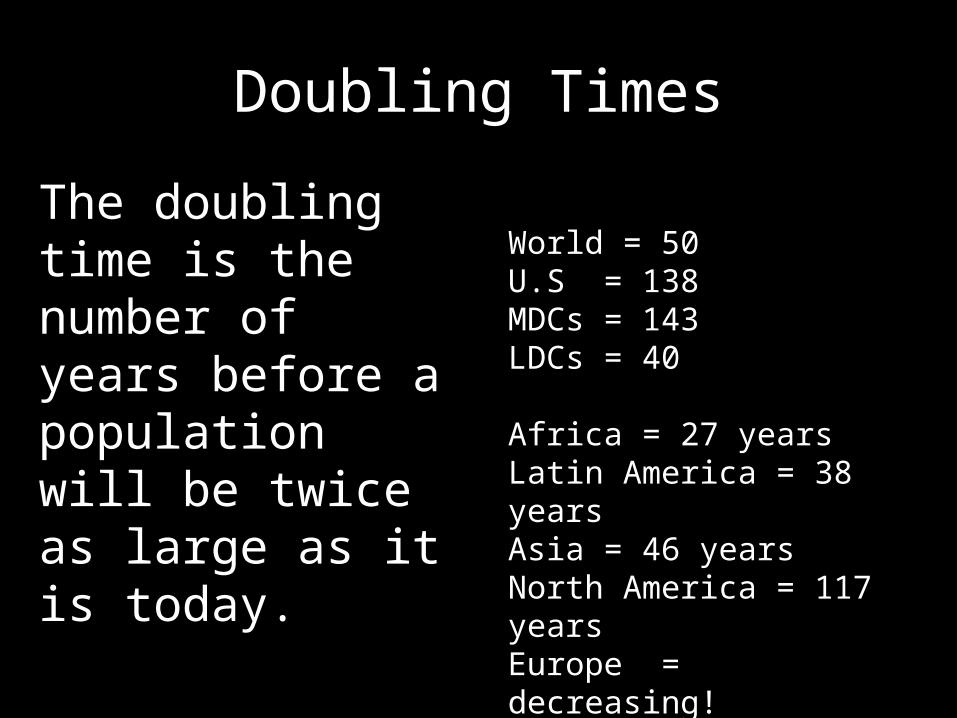
The doubling time is the number of years before a population will be twice as large as it is today.
1 9 17 25 33 41 49 57 65 73 81 89 97 105113121129137300000000
350000000
400000000
450000000
500000000
550000000
600000000
650000000
Population
Population
Doubling Times
The doubling time is the number of years before a population will be twice as large as it is today.
World = 50U.S = 138MDCs = 143LDCs = 40
Africa = 27 yearsLatin America = 38 yearsAsia = 46 yearsNorth America = 117 yearsEurope = decreasing!

• Total Fertility Rate (TFR)– Average number of children a woman will have throughout her
childbearing years (ages 15-49)• Behavior predictor
Palestinian Territories Total
Fertility Rate
1975-1980 7.39
1980-1985 7.00
1985-1990 6.43
1990-1995 6.46
1995-2000 5.99
2000-2005 5.57
AfricaTotal
Fertility Rate
1975-1980 6.60
1980-1985 6.45
1985-1990 6.11
1990-1995 5.67
1995-2000 5.26
2000-2005 4.97
U.K. TotalFertility Rate
1975-1980 1.72
1980-1985 1.80
1985-1990 1.81
1990-1995 1.78
1995-2000 1.70
2000-2005 1.66
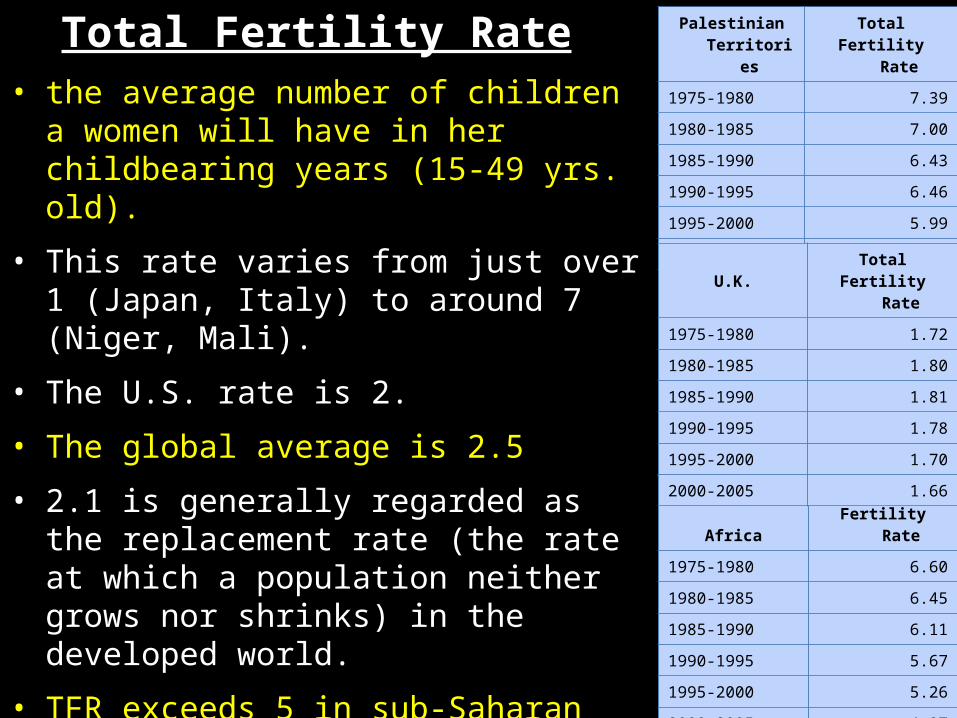
Total Fertility Rate • the average number of children a women
will have in her childbearing years (15-49 yrs. old).
• This rate varies from just over 1 (Japan, Italy) to around 7 (Niger, Mali).
• The U.S. rate is 2.
• The global average is 2.5
• 2.1 is generally regarded as the replacement rate (the rate at which a population neither grows nor shrinks) in the developed world.
• TFR exceeds 5 in sub-Saharan Africa, while 2 or less in nearly all European countries
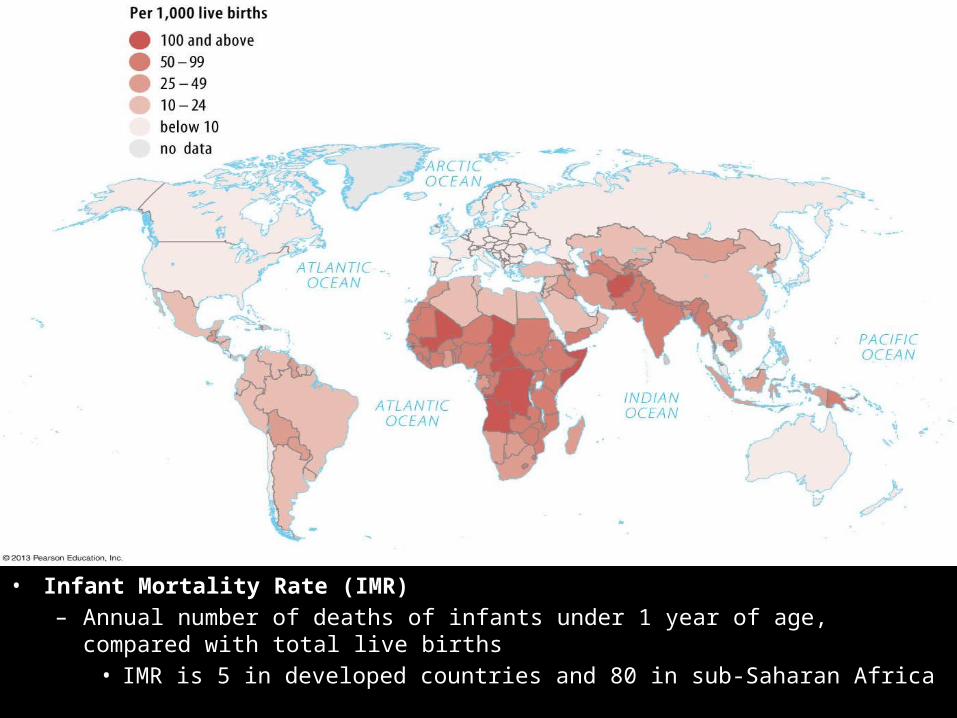
• Infant Mortality Rate (IMR)– Annual number of deaths of infants under 1 year of age, compared with total live
births• IMR is 5 in developed countries and 80 in sub-Saharan Africa
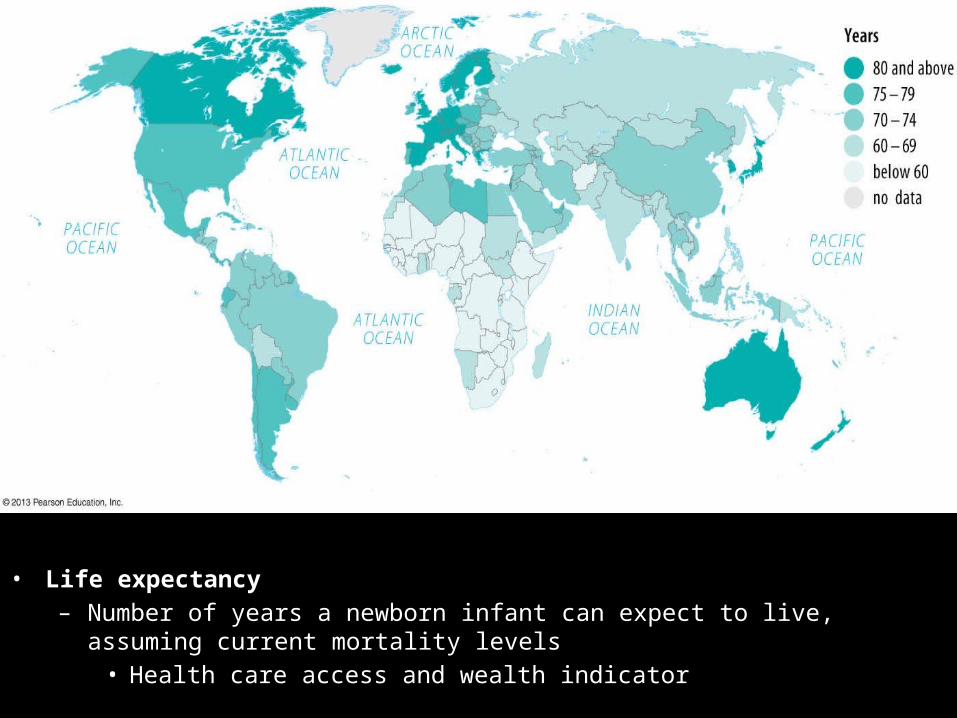
• Life expectancy– Number of years a newborn infant can expect to live, assuming current mortality
levels• Health care access and wealth indicator
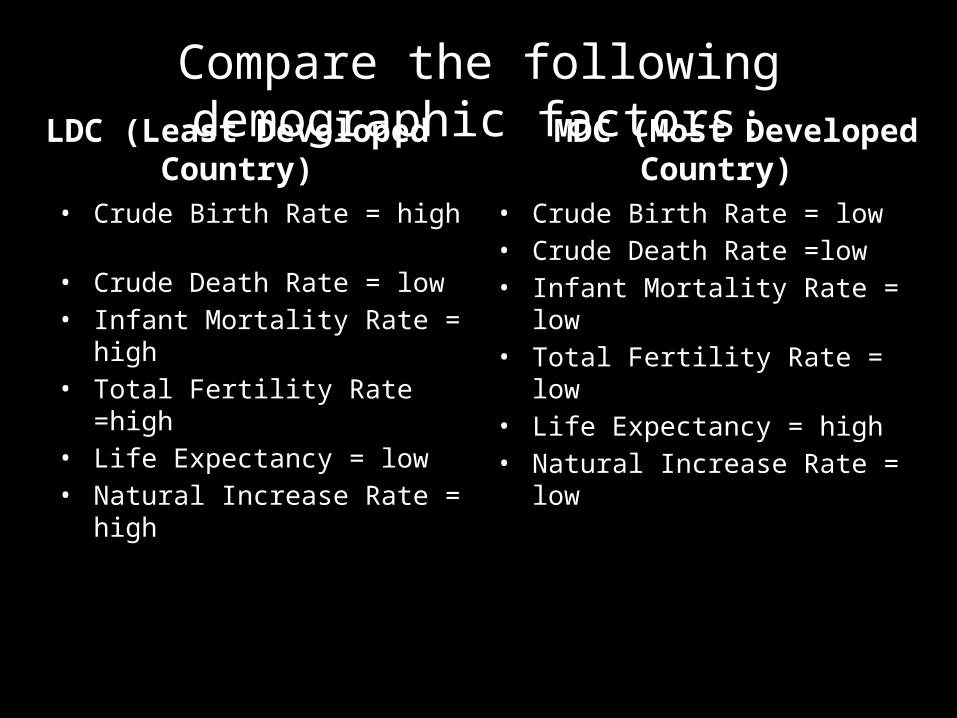
Compare the following demographic factors:
LDC (Least Developed Country)• Crude Birth Rate = high• Crude Death Rate = low• Infant Mortality Rate = high• Total Fertility Rate =high• Life Expectancy = low• Natural Increase Rate = high
MDC (Most Developed Country)• Crude Birth Rate = low• Crude Death Rate =low• Infant Mortality Rate = low• Total Fertility Rate = low• Life Expectancy = high• Natural Increase Rate = low

Population Pyramid
Population Pyramids = graphic device that represents a population’s age and sex
composition.
Pyramid describes diagram’s shape for many countries in 1800’s when
was created.

• The most important demographic characteristic of a population is its age-sex structure. Age-sex pyramids (also known as population pyramids) graphically display this information to improve understanding and ease comparison.
• Age-sex pyramids display the percentage or actual amount of a population broken down by gender and age. The five-year age increments on the y-axis allow the pyramid to vividly reflect long term trends in the birth and death rates but also reflect shorter term baby-booms, wars, and epidemics.
Population Pyramid Overview

Population Pyramids
• The shape of a pyramid is primarily determined by the crude death rate in the community.
• Dependency ratio-the number of people who are too young or too old to work, compared to the number of people in their productive years.
• People who are 0-14 and 65-plus normally are classified as dependents.
• The “graying” of a population refers to the aging of a community.
• Population pyramids also foretell future problems from present population policies or practices. Ex. China’s population policies skewed in favor of males.
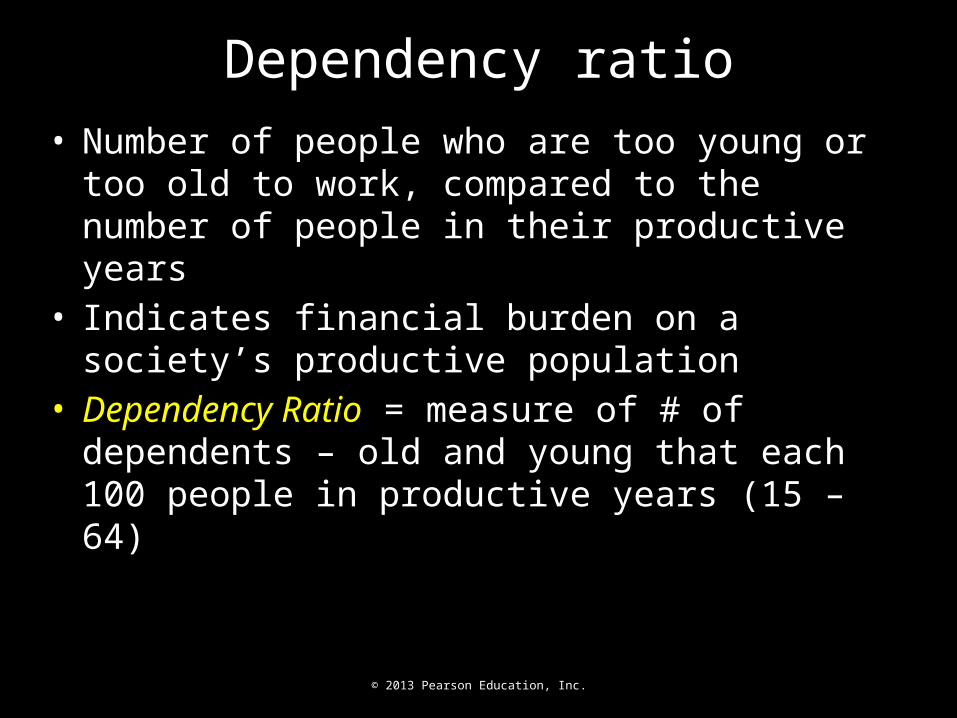
• Number of people who are too young or too old to work, compared to the number of people in their productive years
• Indicates financial burden on a society’s productive population
• Dependency Ratio = measure of # of dependents – old and young that each 100 people in productive years (15 – 64)
© 2013 Pearson Education, Inc.
Dependency ratio

Sex Ratio
• The number of males per hundred females in the population is the sex ratio. In Europe and North America the ratio of men to women is about 95:100
• In poorer countries the high mortality rate during childbirth partly explains the lower percentage of women.


There are three key types of population pyramids:
Rapid Growth:
This pyramid of the Philippines shows a triangle-shaped pyramid and reflects a high growth rate of about 2.1 percent annually.

There are three key types of population pyramids:
Slow Growth:
In the United States, the population is growing at a rate of about 1.7 percent annually. This growth rate is reflected in the more square-like structure of the pyramid. Note the lump in the pyramid between the ages of about 35 to 50.

In wealthy countries with very slow rate of population growth – population is nearly equally divided - so pyramids have
• Almost vertical sides.• War can be reflected by showing depleted age
cohorts and male – female disparities.• The % of a country’s population in each age group
strongly influences demand for goods and services within that national economy.
• Country with high % of young has high demand for educational facilities and health delivery services.
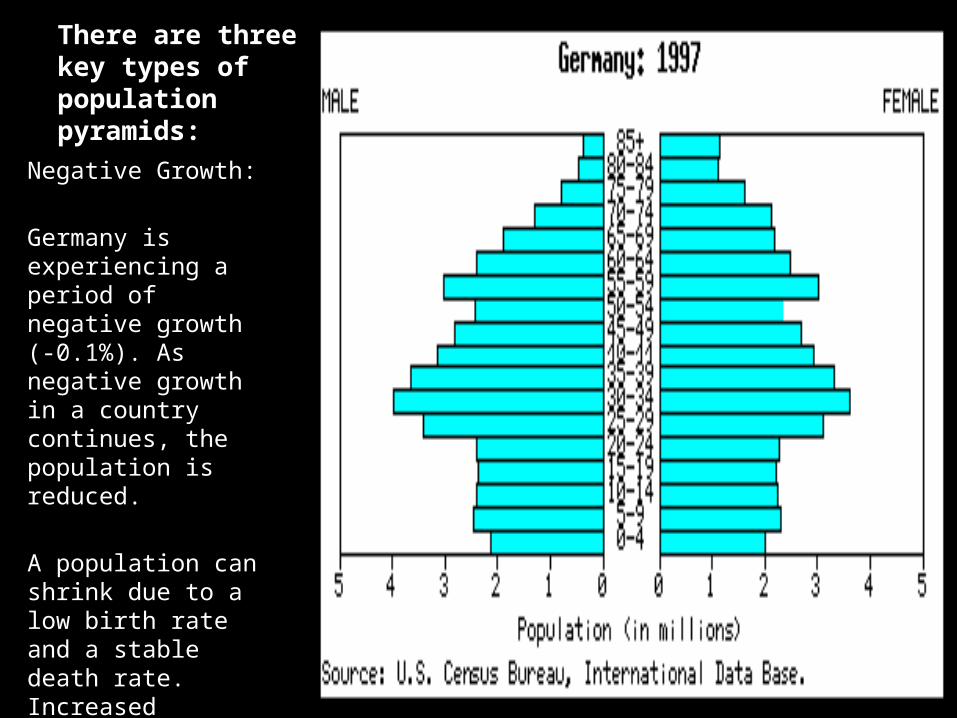
There are three key types of population pyramids:
Negative Growth:
Germany is experiencing a period of negative growth (-0.1%). As negative growth in a country continues, the population is reduced.
A population can shrink due to a low birth rate and a stable death rate. Increased emigration may also be a contributor to a declining population.

Population Pyramids in U.S. cities