
Centre for Disruptive Technologies Mobile Money & Payments Presentation
date post
22-Dec-2015Category
view
264download
8
Chapter 2 of Cecchetti
Money and the Payments System

MoneyMoney
Money is an asset that is generally accepted as payment for goods and services or repayment of debt.
1. A means of payment. Transferability Information
2. A unit of account Allocation of resources Relative prices
3. A store of value Liquidity
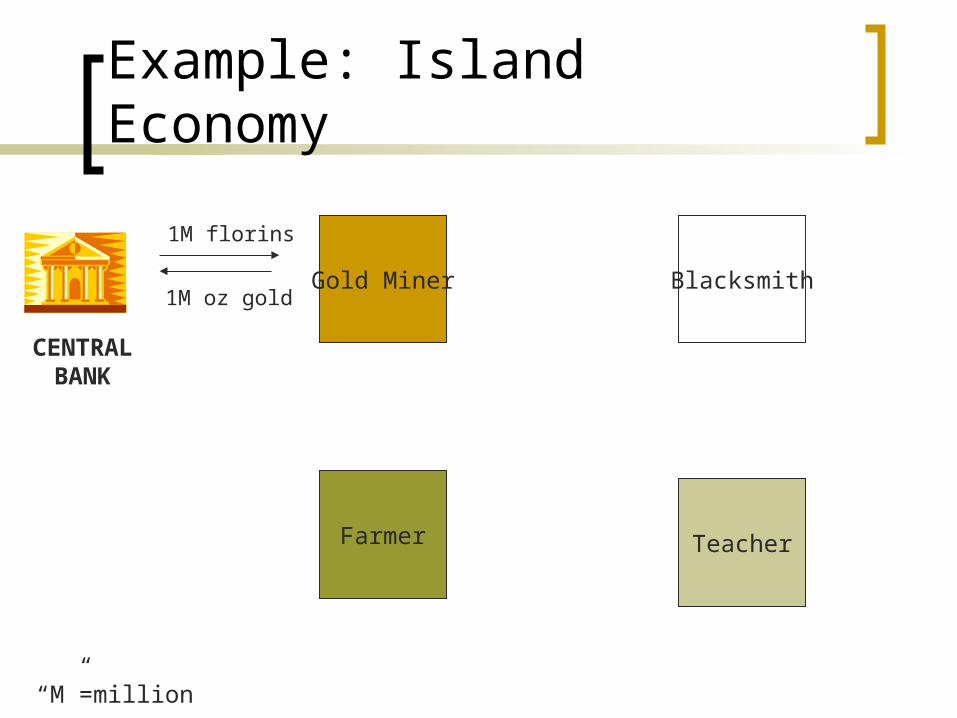
Example: Island Economy
Farmer
Gold Miner Blacksmith
Teacher
1M florins
1M oz gold
CENTRALBANK
“M”=million
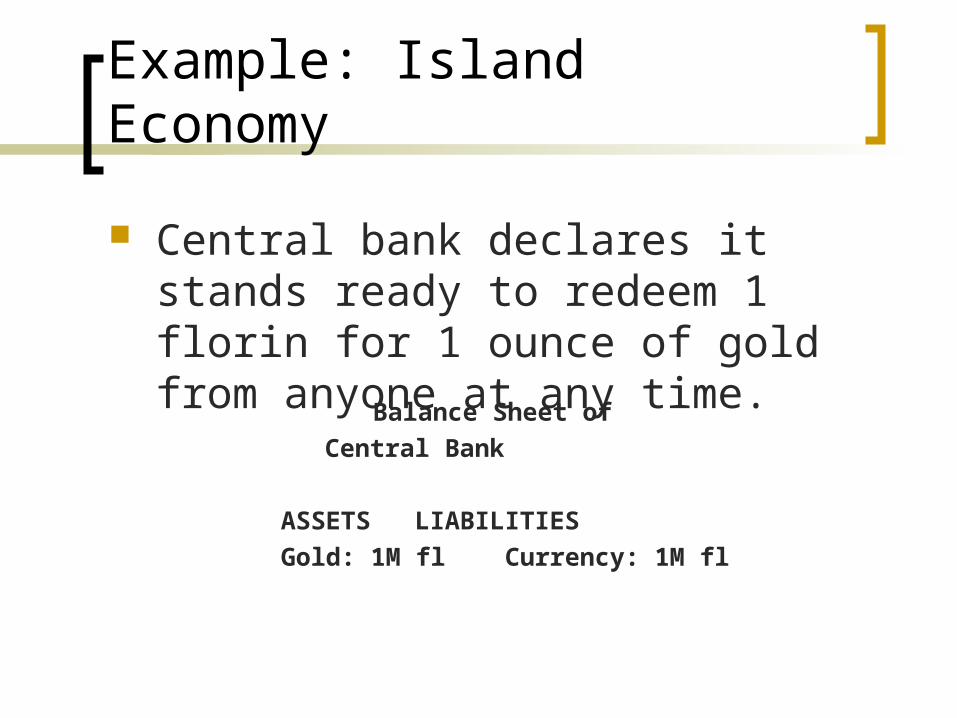
Example: Island Economy
Central bank declares it stands ready to redeem 1 florin for 1 ounce of gold from anyone at any time.
Balance Sheet of
Central Bank
ASSETS LIABILITIES
Gold: 1M fl Currency: 1M fl
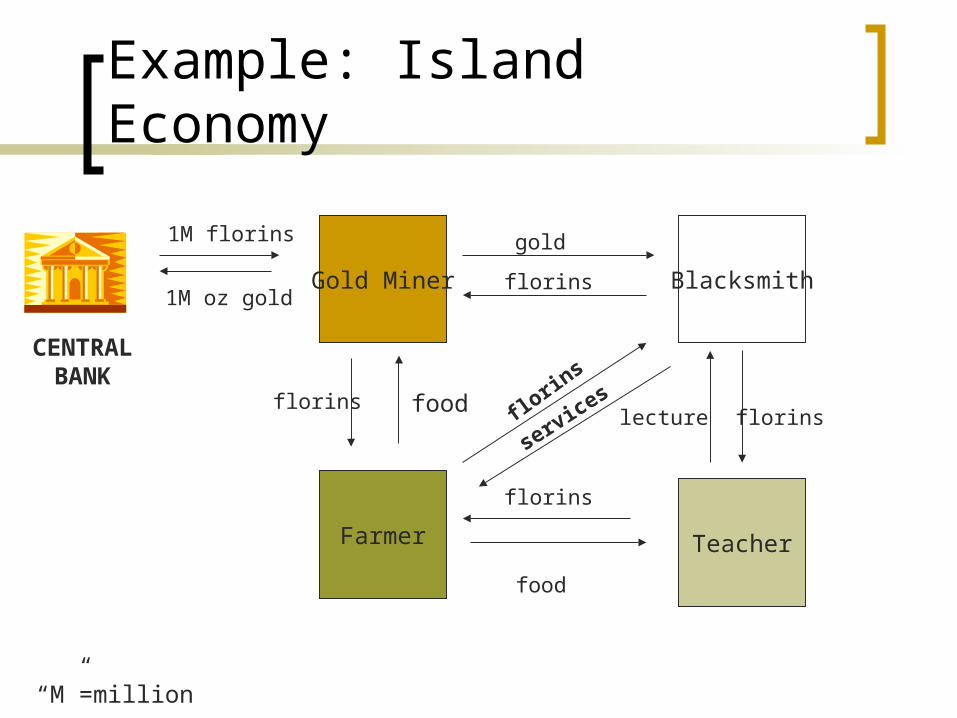
Example: Island Economy
Farmer
Gold Miner Blacksmith
Teacher
1M florins
1M oz gold
CENTRALBANK
“M”=million
florins food florin
s
florins
food
lecture florinsservices
florins
gold
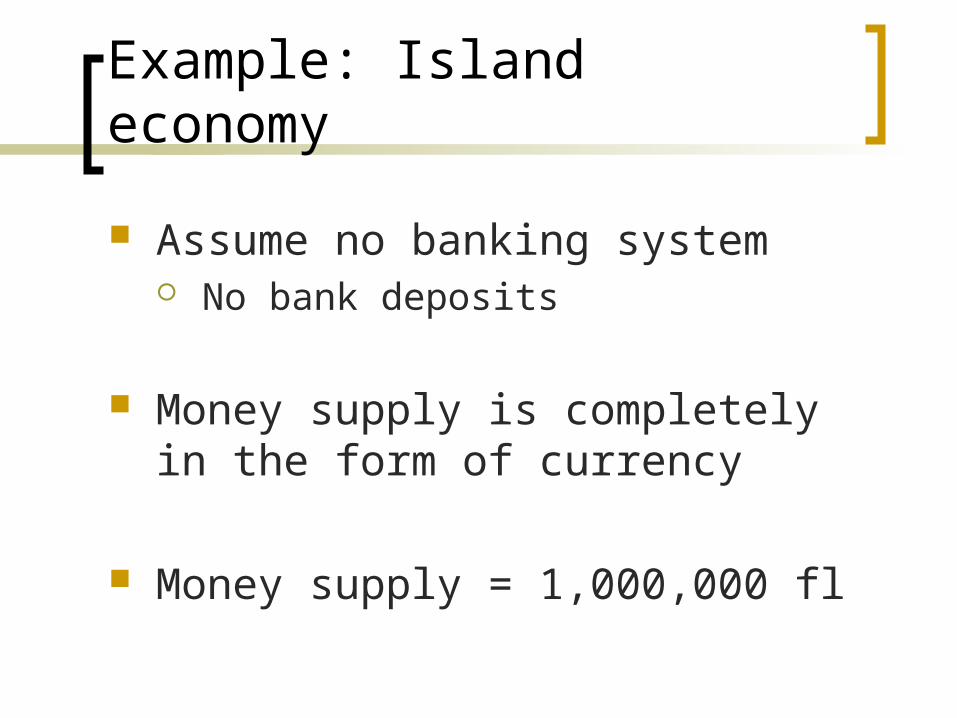
Example: Island economy
Assume no banking system No bank deposits
Money supply is completely in the form of currency
Money supply = 1,000,000 fl
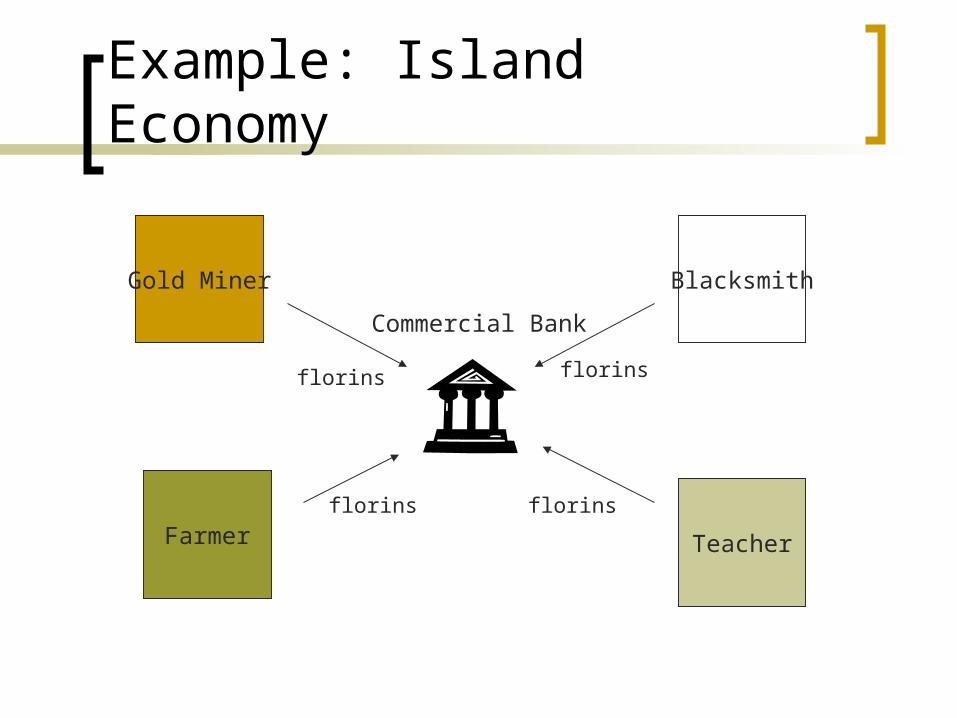
Example: Island Economy
Farmer
Gold Miner Blacksmith
Teacher
florins florins
florinsflorins
Commercial Bank
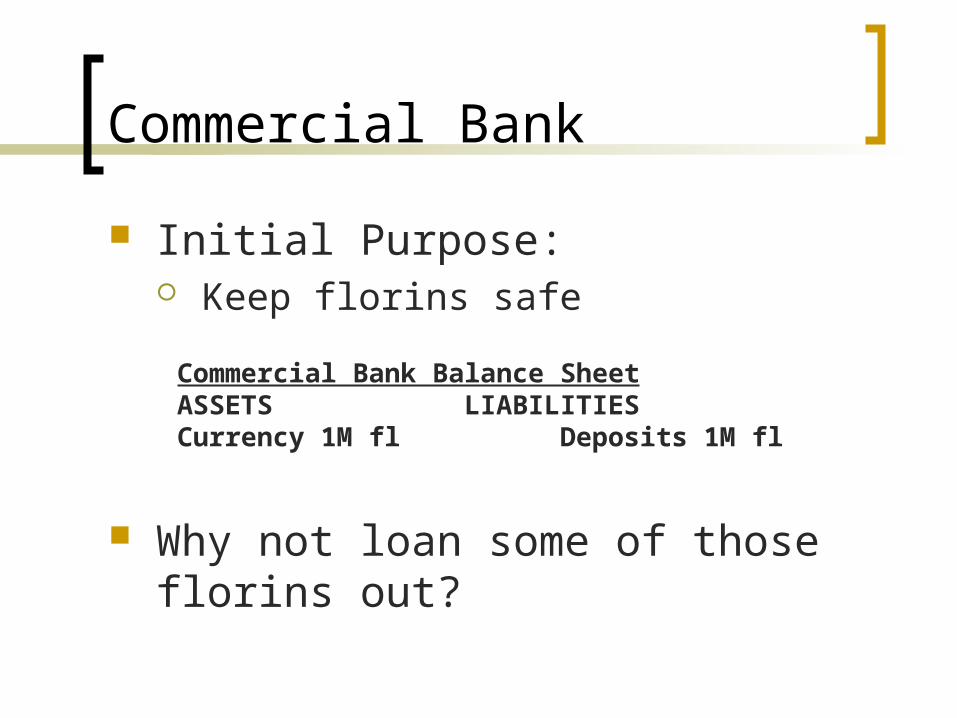
Commercial Bank
Initial Purpose: Keep florins safe
Why not loan some of those florins out?
Commercial Bank Balance SheetASSETS LIABILITIESCurrency 1M fl Deposits 1M fl
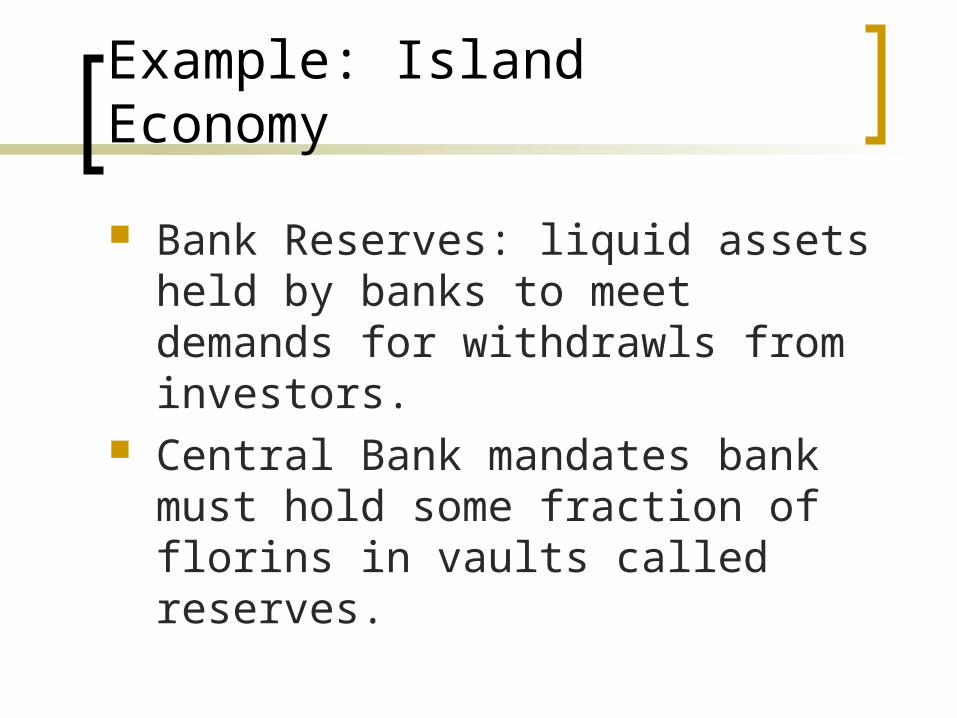
Example: Island Economy
Bank Reserves: liquid assets held by banks to meet demands for withdrawls from investors.
Central Bank mandates bank must hold some fraction of florins in vaults called reserves.
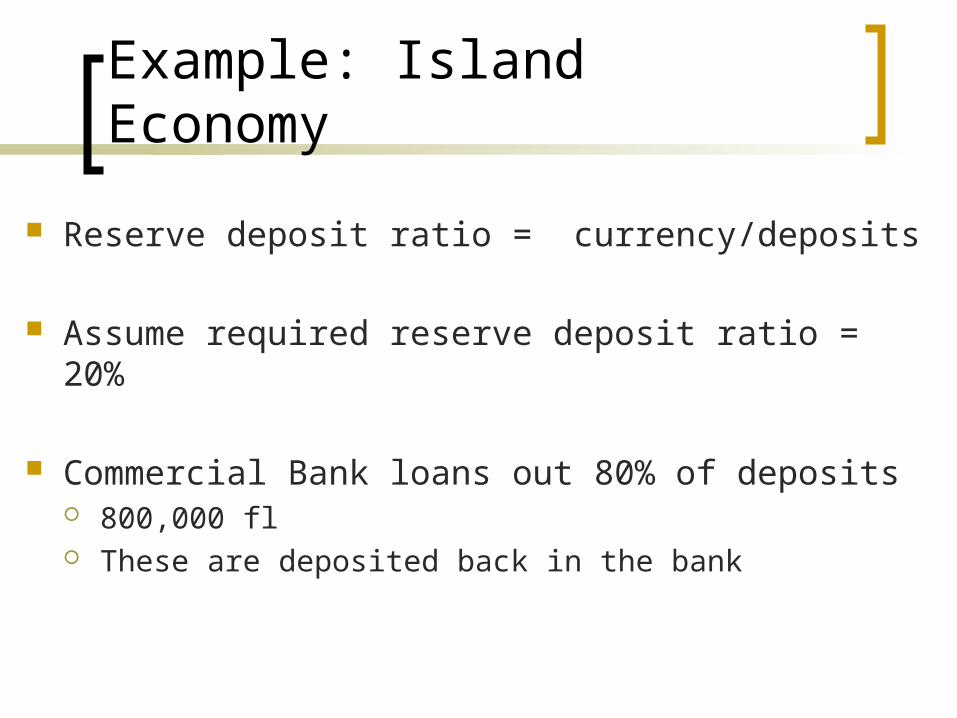
Example: Island Economy
Reserve deposit ratio = currency/deposits
Assume required reserve deposit ratio = 20%
Commercial Bank loans out 80% of deposits 800,000 fl These are deposited back in the bank
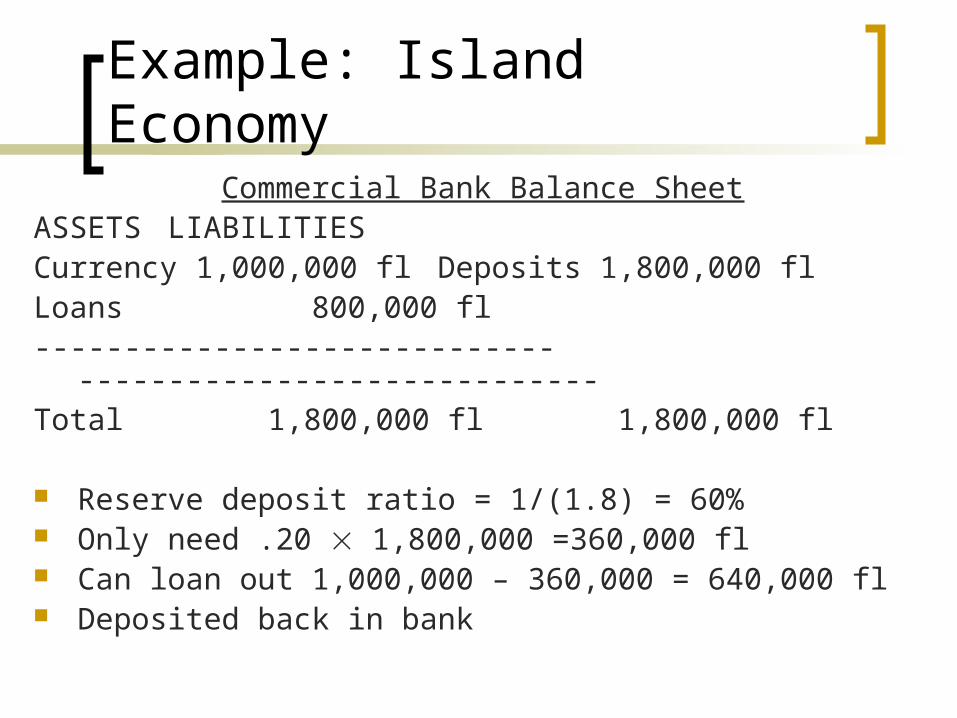
Example: Island EconomyCommercial Bank Balance Sheet
ASSETS LIABILITIESCurrency 1,000,000 fl Deposits 1,800,000 flLoans 800,000 fl----------------------------- -----------------------------Total 1,800,000 fl 1,800,000 fl
Reserve deposit ratio = 1/(1.8) = 60% Only need .20 1,800,000 =360,000 fl Can loan out 1,000,000 – 360,000 = 640,000 fl Deposited back in bank

Example: Island EconomyConsolidated Balance Sheet of Banks
ASSETS LIABILITIESCurrency 1,000,000 fl Deposits 2,440,000 flLoans 1,440,000 fl----------------------------- -----------------------------Total 2,440,000 fl 2,400,000 fl
Reserve deposit ratio = 1/(2.4) = 42% Only need .20 2,440,000 =488,000 fl Can loan out 1,000,000 – 488,000 = 512,000 fl Does this just go on forever . . . . . ?
Example: Island Economy
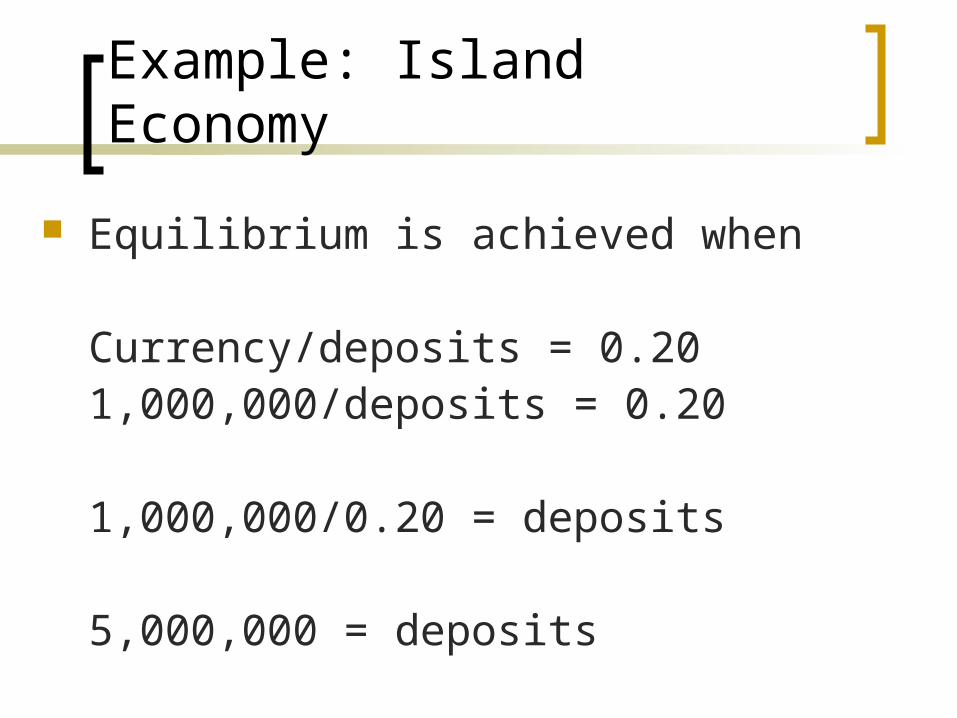
Equilibrium is achieved when
Currency/deposits = 0.201,000,000/deposits = 0.20
1,000,000/0.20 = deposits
5,000,000 = deposits
Example: Island Economy
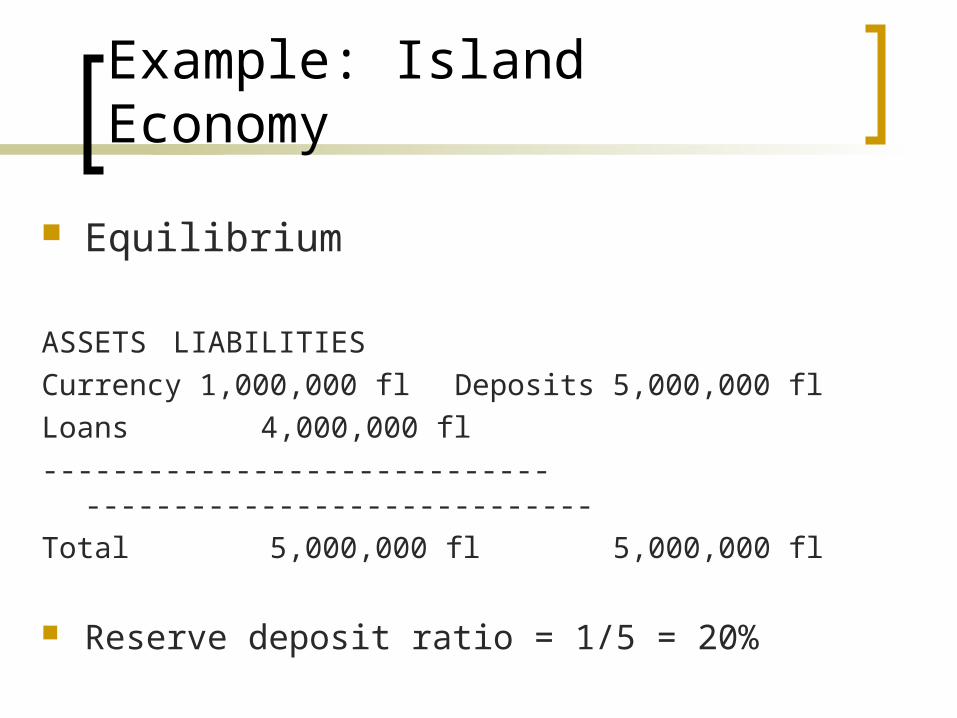
Equilibrium
ASSETS LIABILITIES
Currency 1,000,000 fl Deposits 5,000,000 fl
Loans 4,000,000 fl
----------------------------- -----------------------------
Total 5,000,000 fl 5,000,000 fl
Reserve deposit ratio = 1/5 = 20%
Money Supply
Banks have effect on the money supply
Bank Deposits Very liquid, can be used for transactions Are counted as part of the money supply
In example, no cash is held by public Money supply = total deposits
Risk of bank runs
Measuring Money
Different Definitions of money based upon degree of liquidity.
Federal Reserve System defines monetary aggregates: measures of money
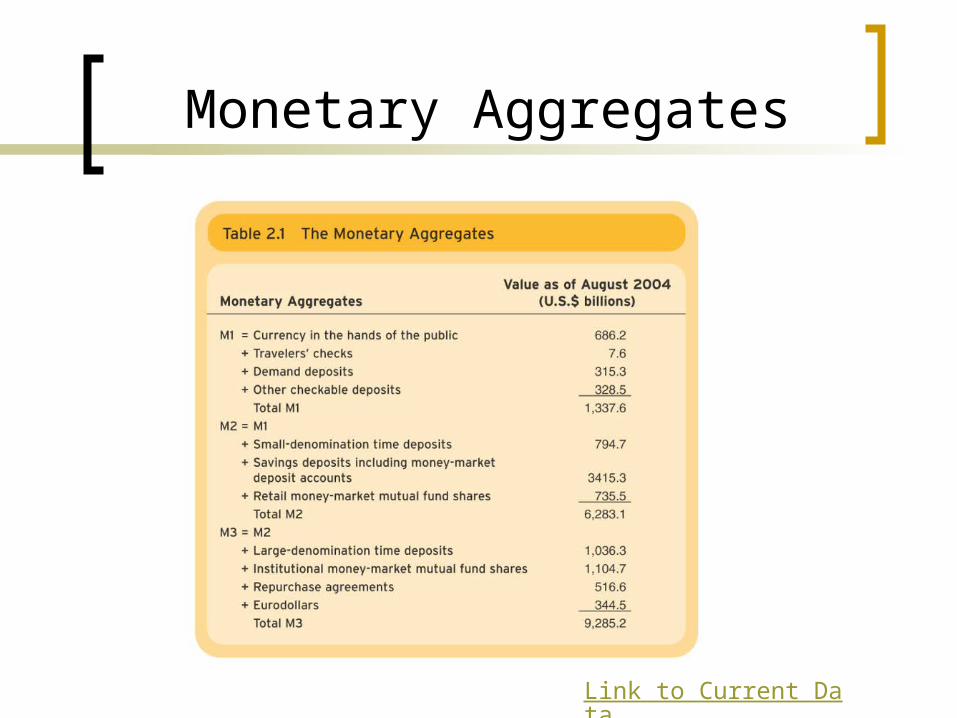
Monetary Aggregates
Link to Current Data
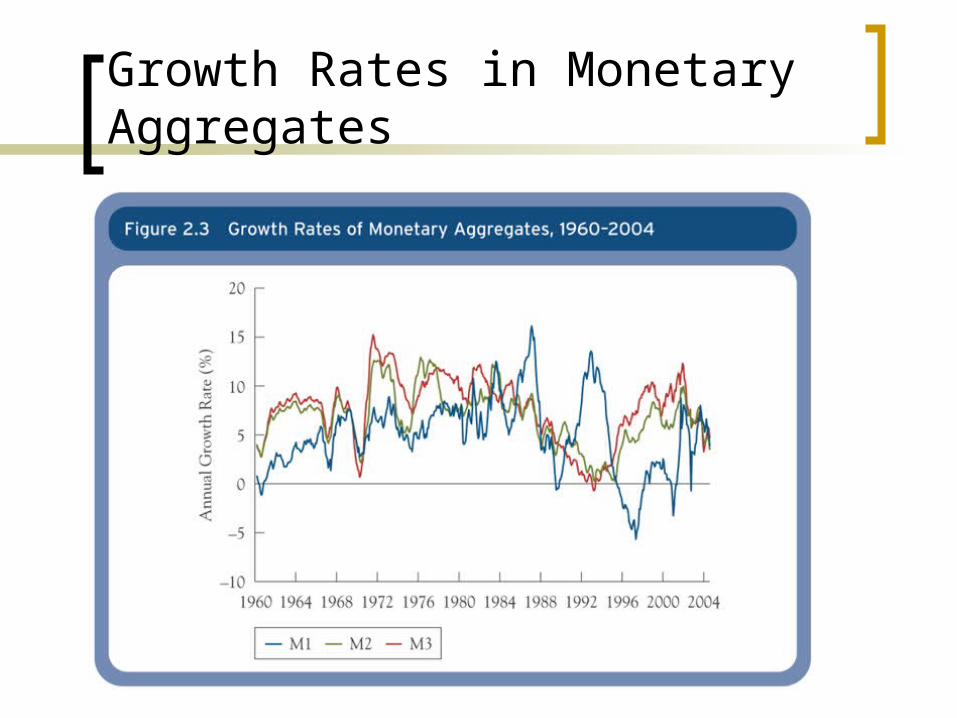
Growth Rates in Monetary Aggregates
Money and Inflation
0
2
4
6
8
10
12
14
0 2 4 6 8 10 12 14Money Growth
Infl
ati
on
2 Y
ea
rs L
ate
r
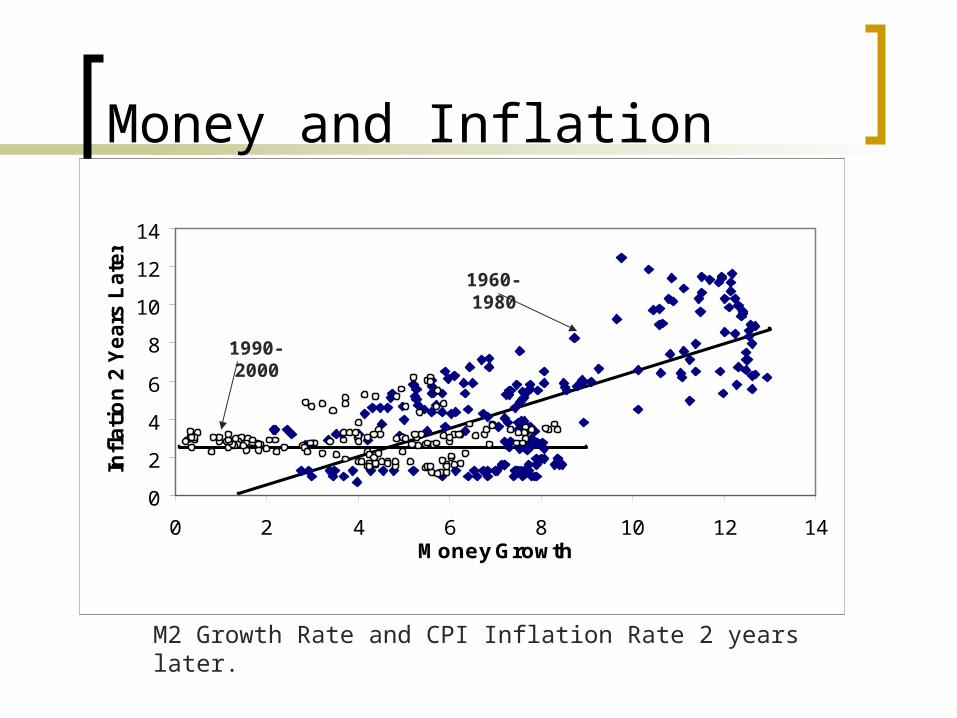
1990-2000
1960-1980
M2 Growth Rate and CPI Inflation Rate 2 years later.
Changes in Rates
Chapter 6 of Cecchetti
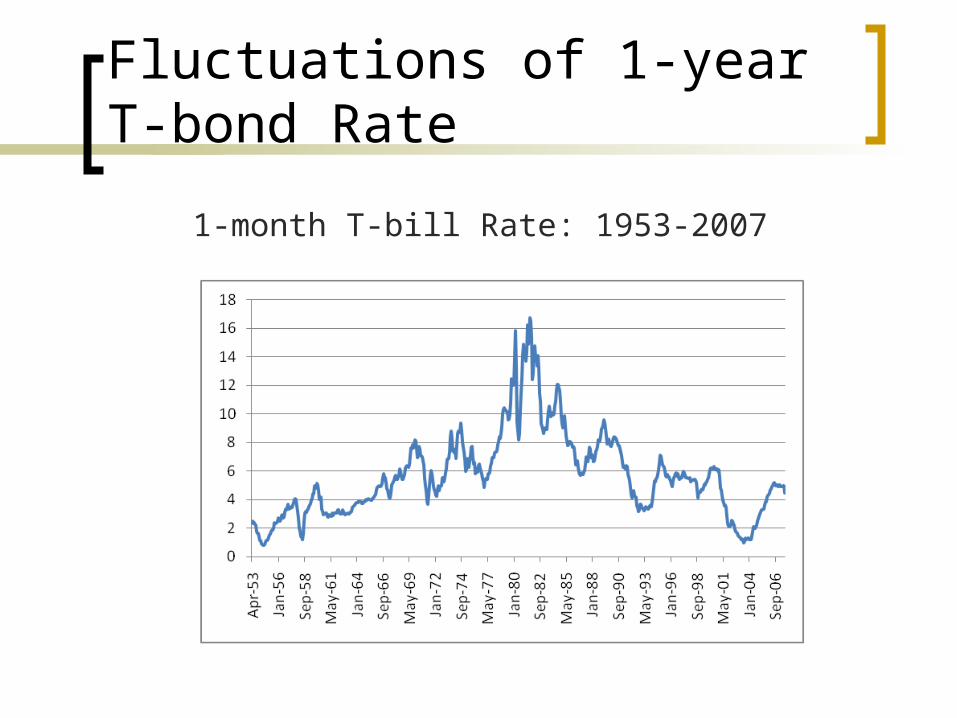
Fluctuations of 1-year T-bond Rate
1-month T-bill Rate: 1953-2007
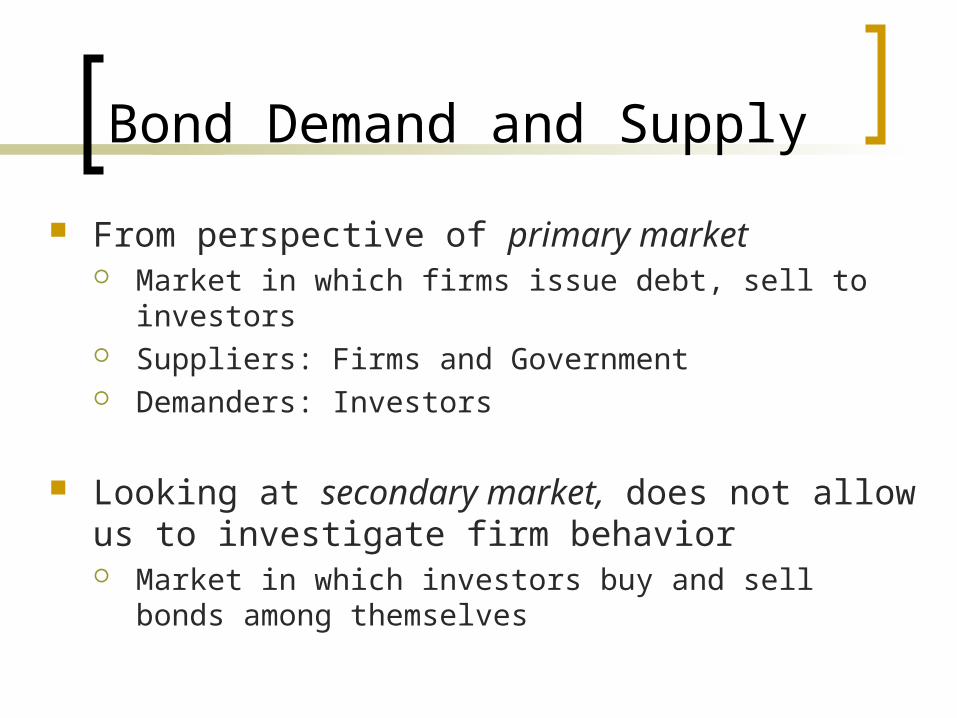
Bond Demand and Supply
From perspective of primary market Market in which firms issue debt, sell to investors Suppliers: Firms and Government Demanders: Investors
Looking at secondary market, does not allow us to investigate firm behavior Market in which investors buy and sell bonds among
themselves
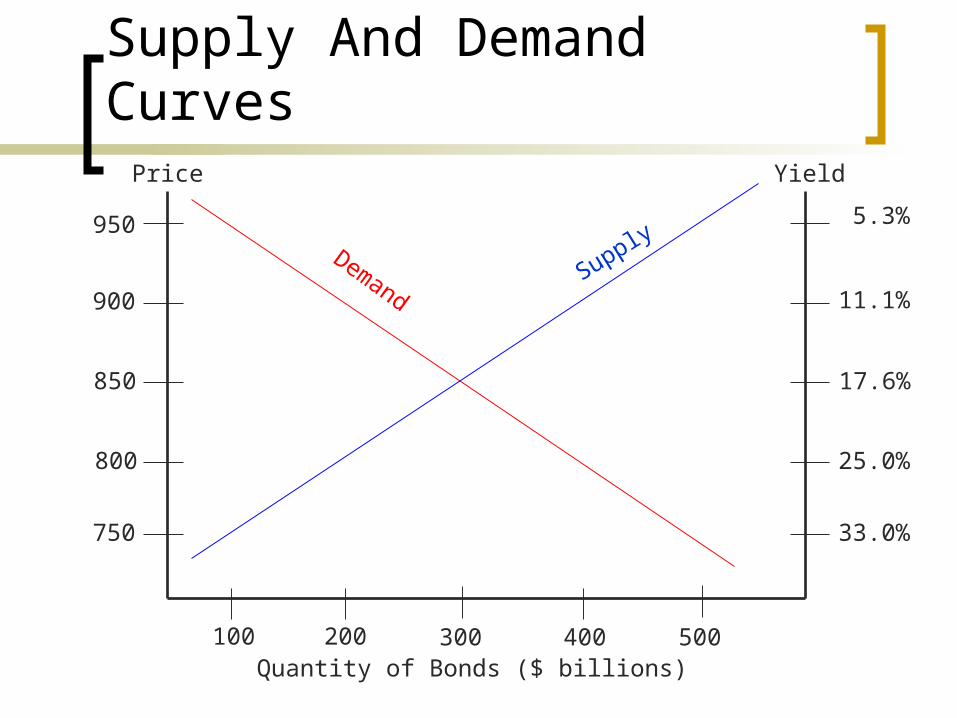
Supply And Demand Curves
Quantity of Bonds ($ billions)
Price
950 5.3%
Yield
300
900
850
800
750
200100 400 500
11.1%
17.6%
25.0%
33.0%
SupplyDemand
Suppliers
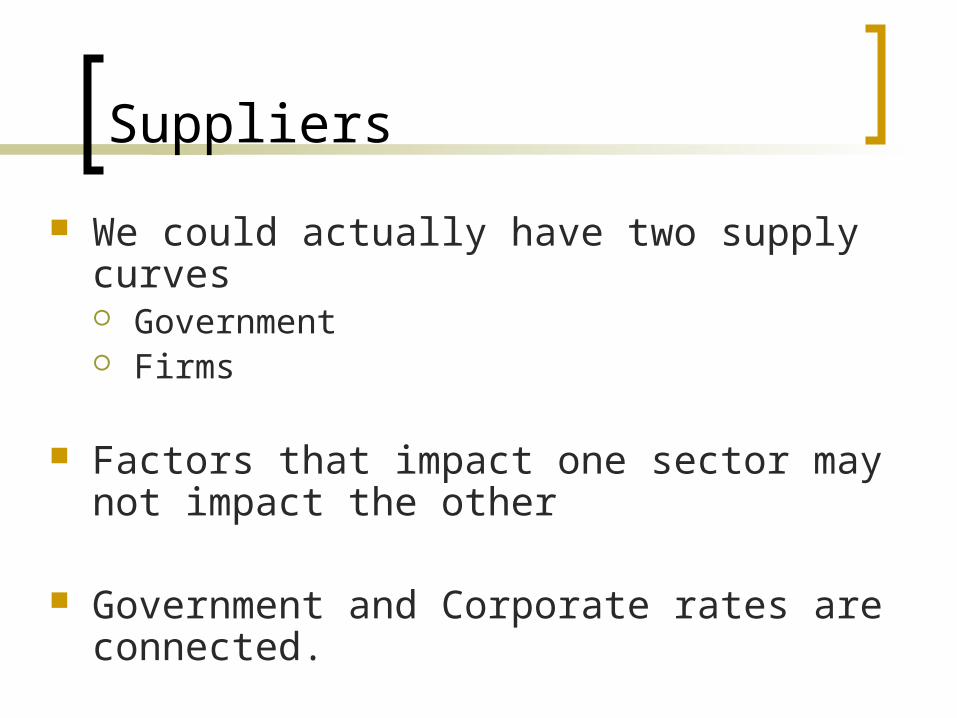
We could actually have two supply curves Government Firms
Factors that impact one sector may not impact the other
Government and Corporate rates are connected.
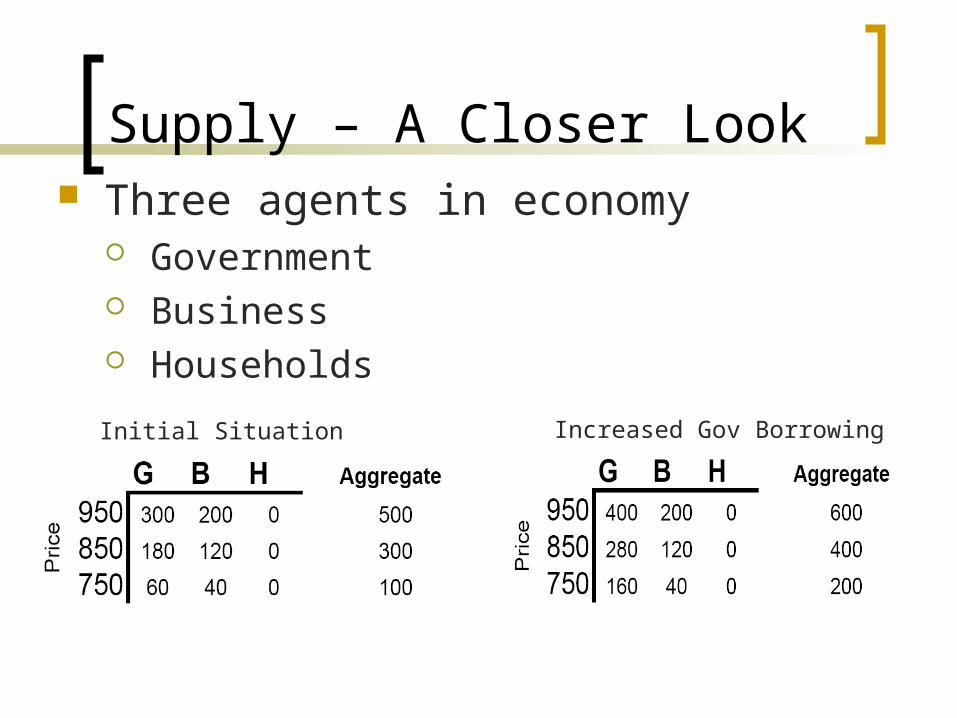
Supply – A Closer Look Three agents in economy
Government Business Households
Initial Situation Increased Gov Borrowing
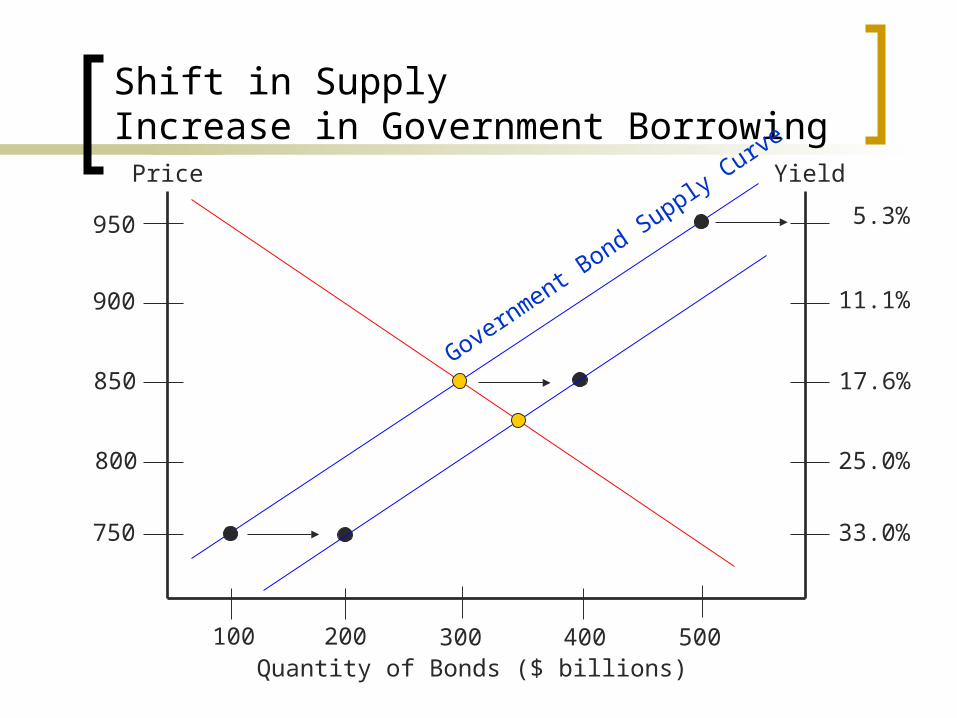
Shift in SupplyIncrease in Government Borrowing
Quantity of Bonds ($ billions)
Price
950 5.3%
Yield
300
900
850
800
750
200100 400 500
11.1%
17.6%
25.0%
33.0%
Government B
ond Supply Curve
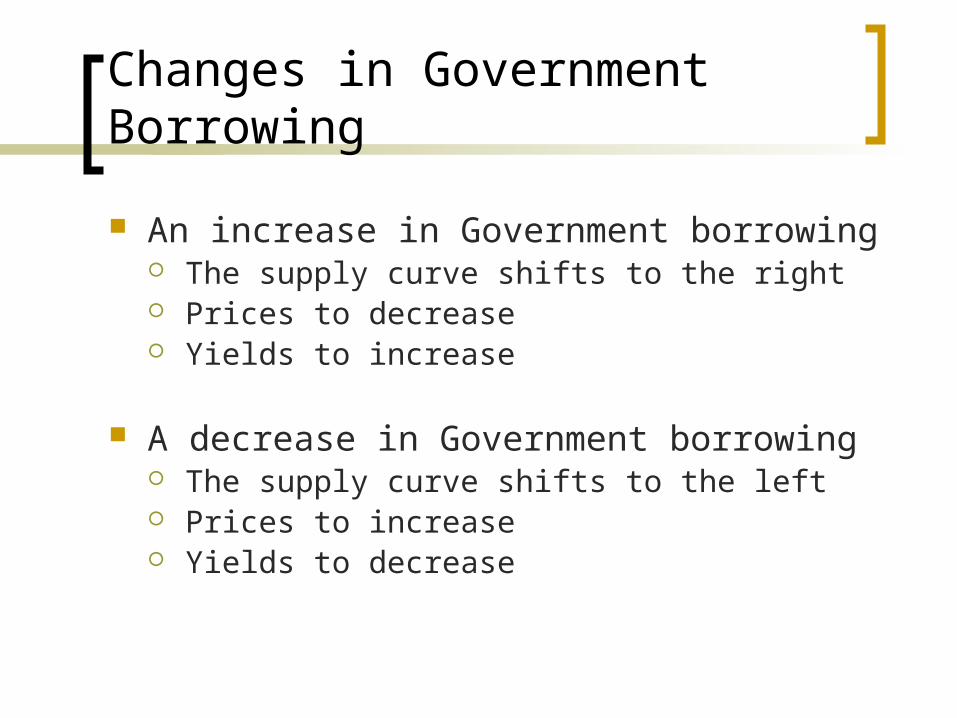
Changes in Government Borrowing
An increase in Government borrowing The supply curve shifts to the right Prices to decrease Yields to increase
A decrease in Government borrowing The supply curve shifts to the left Prices to increase Yields to decrease
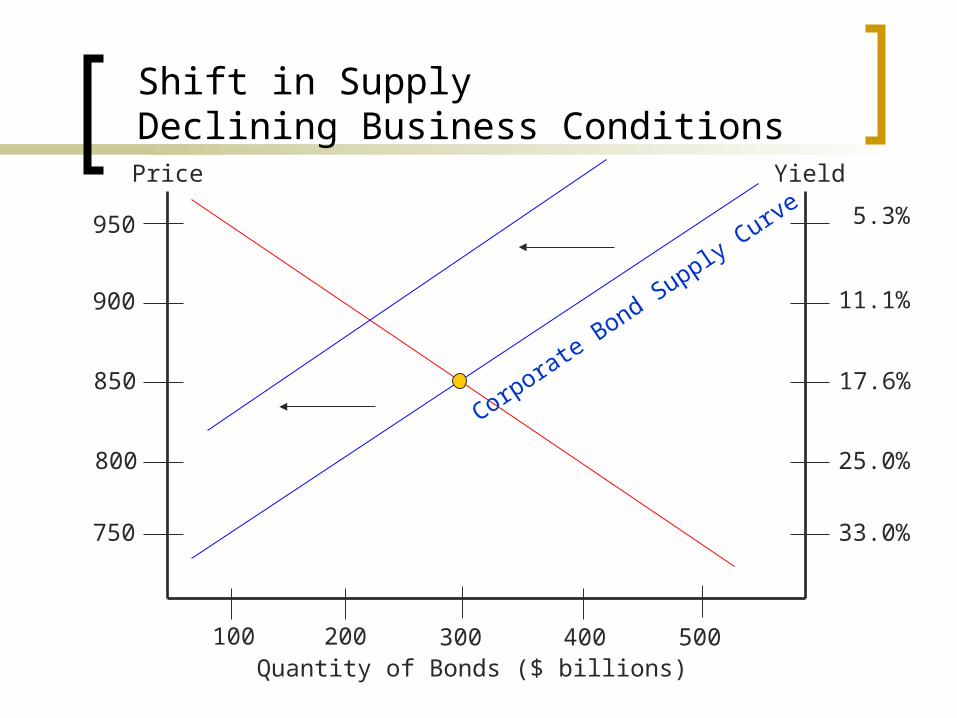
Shift in SupplyDeclining Business Conditions
Quantity of Bonds ($ billions)
Price
950 5.3%
Yield
300
900
850
800
750
200100 400 500
11.1%
17.6%
25.0%
33.0%
Corporate Bond Supply Curve
Changes in Business Conditions
An improvement in business conditions The supply curve to shift to the right Prices to decrease Yields to increase
A decline in business conditions The supply curve to shift to the left Prices to increase Yields to decrease
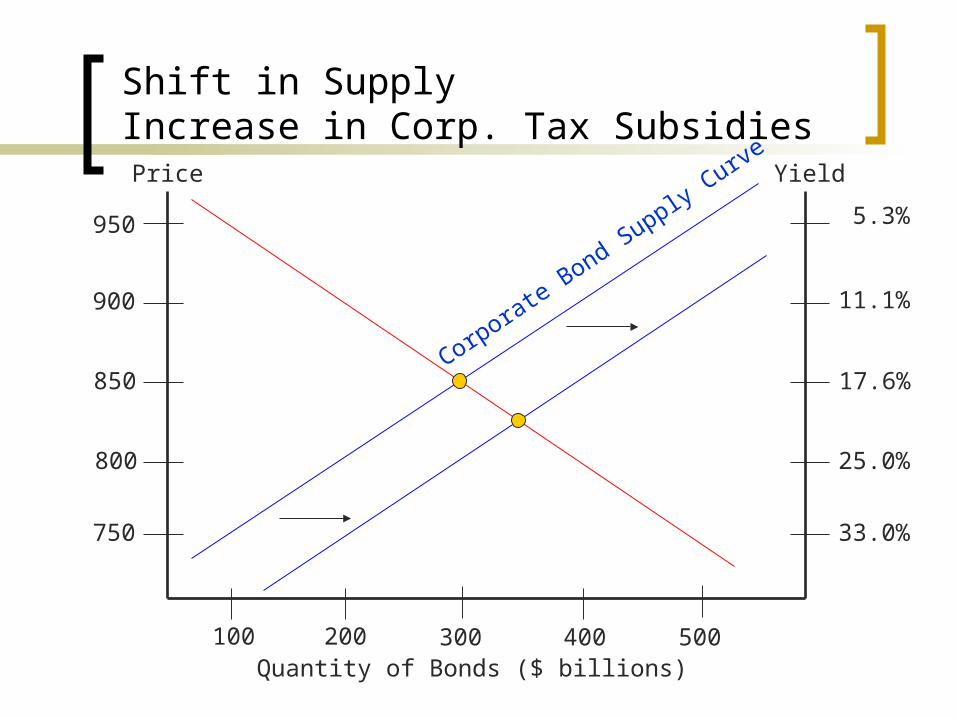
Shift in SupplyIncrease in Corp. Tax Subsidies
Quantity of Bonds ($ billions)
Price
950 5.3%
Yield
300
900
850
800
750
200100 400 500
11.1%
17.6%
25.0%
33.0%
Corporate Bond Supply Curve
Changes in Corp.Tax Subsidies
An increase in Corp. Tax Subsidies The supply curve to shift to the right Prices to decrease Yields to increase
A decrease in Corp. Tax Subsidies The supply curve to shift to the left Prices to increase Yields to decrease
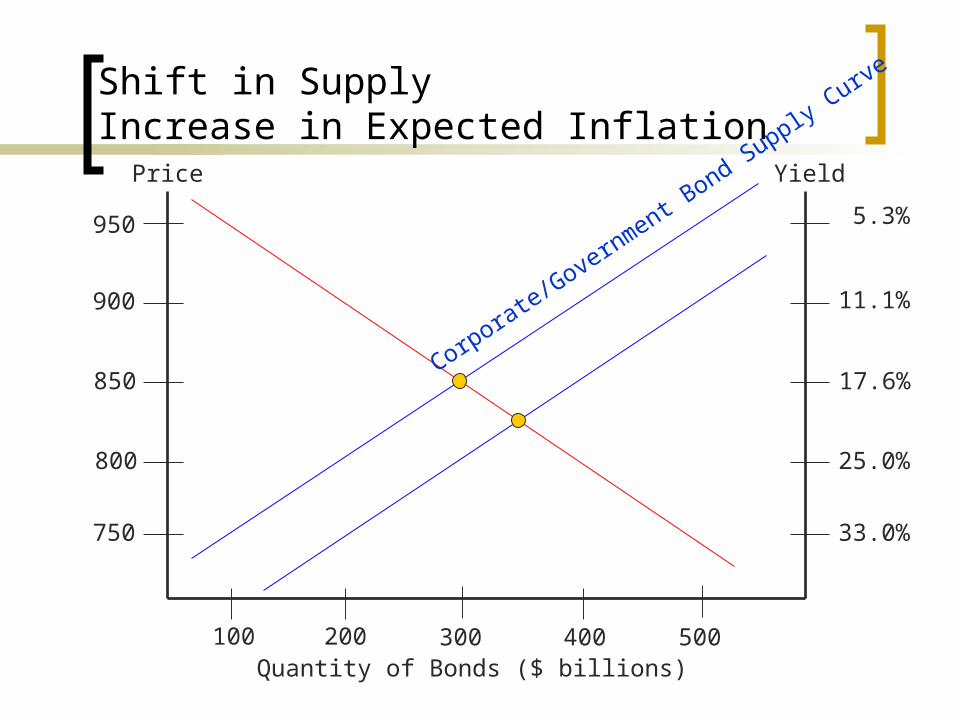
Shift in SupplyIncrease in Expected Inflation
Quantity of Bonds ($ billions)
Price
950 5.3%
Yield
300
900
850
800
750
200100 400 500
11.1%
17.6%
25.0%
33.0%
Corporate/Gove
rnment Bond Supply C
urve
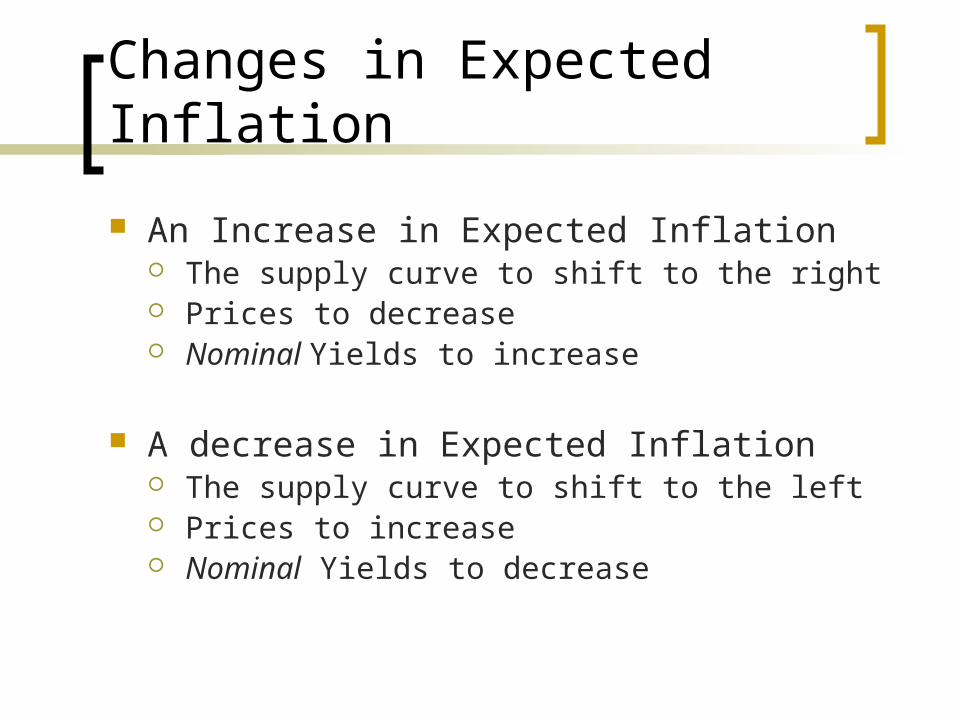
Changes in Expected Inflation
An Increase in Expected Inflation The supply curve to shift to the right Prices to decrease Nominal Yields to increase
A decrease in Expected Inflation The supply curve to shift to the left Prices to increase Nominal Yields to decrease
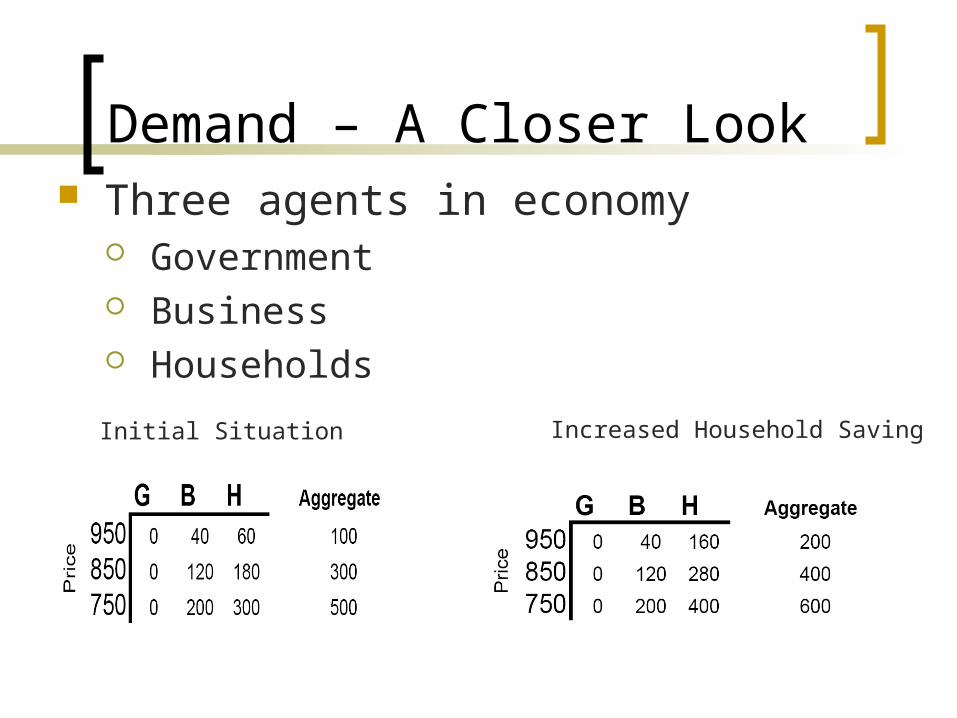
Demand – A Closer Look Three agents in economy
Government Business Households
Initial Situation Increased Household Saving
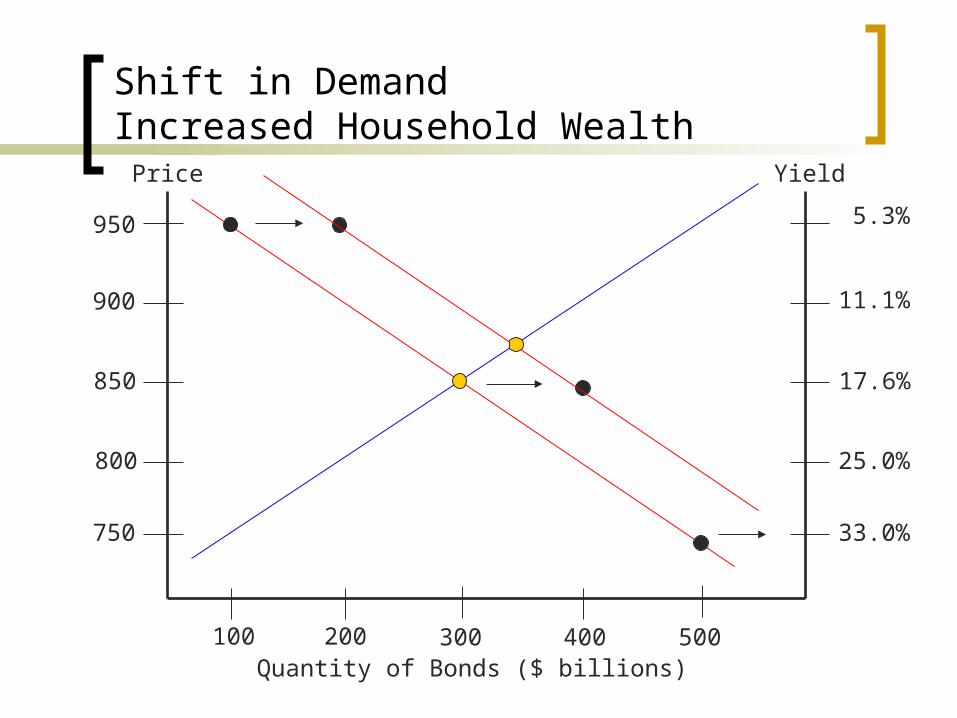
Shift in DemandIncreased Household Wealth
Quantity of Bonds ($ billions)
Price
950 5.3%
Yield
300
900
850
800
750
200100 400 500
11.1%
17.6%
25.0%
33.0%
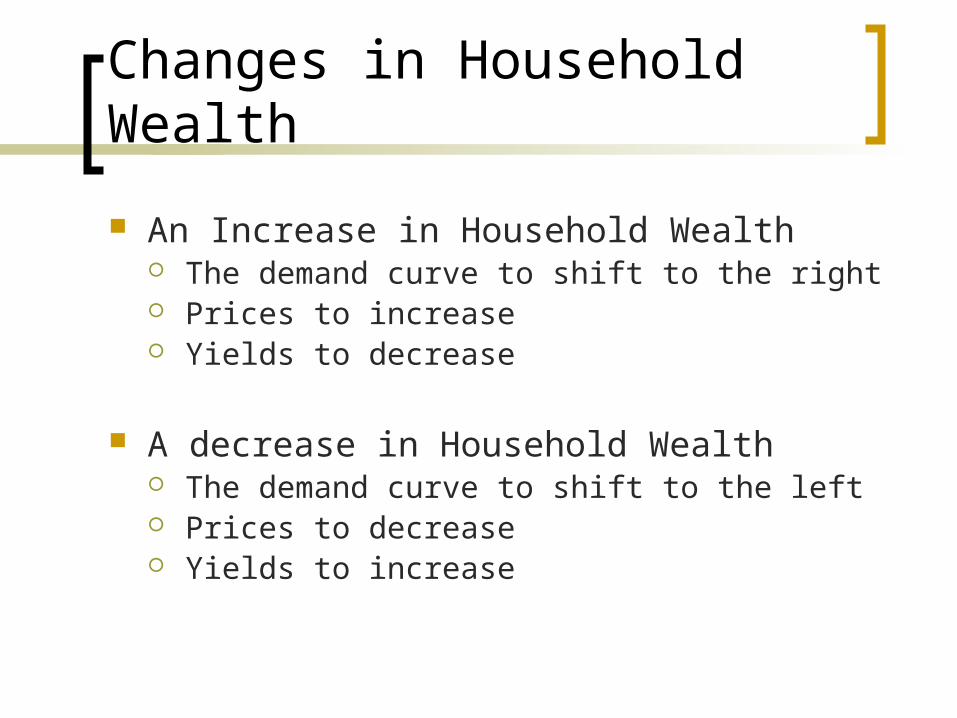
Changes in Household Wealth
An Increase in Household Wealth The demand curve to shift to the right Prices to increase Yields to decrease
A decrease in Household Wealth The demand curve to shift to the left Prices to decrease Yields to increase
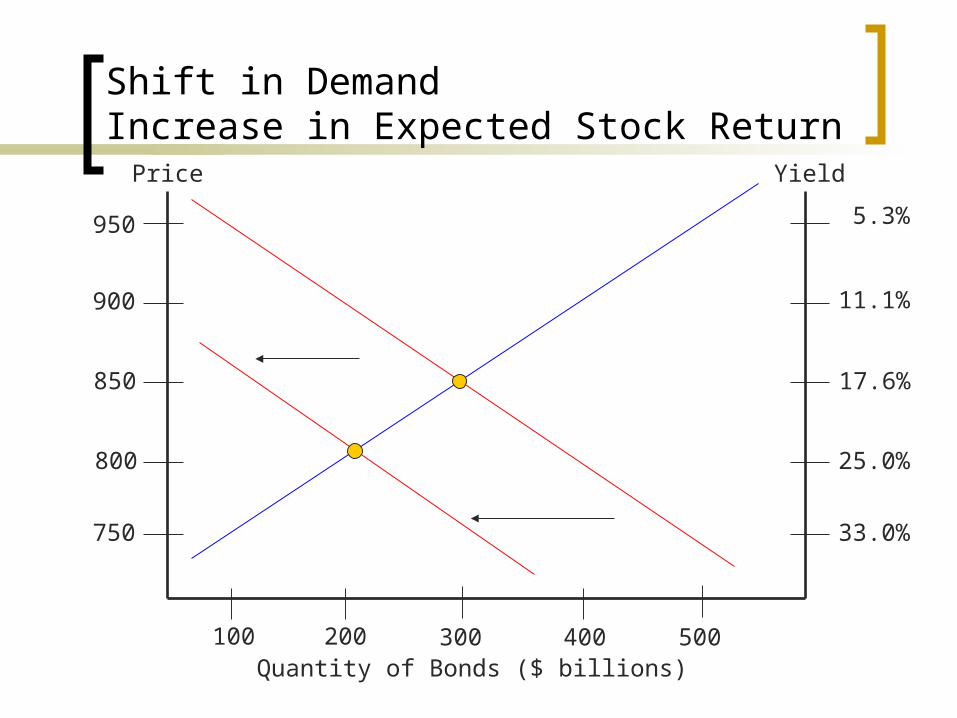
Shift in DemandIncrease in Expected Stock Return
Quantity of Bonds ($ billions)
Price
950 5.3%
Yield
300
900
850
800
750
200100 400 500
11.1%
17.6%
25.0%
33.0%
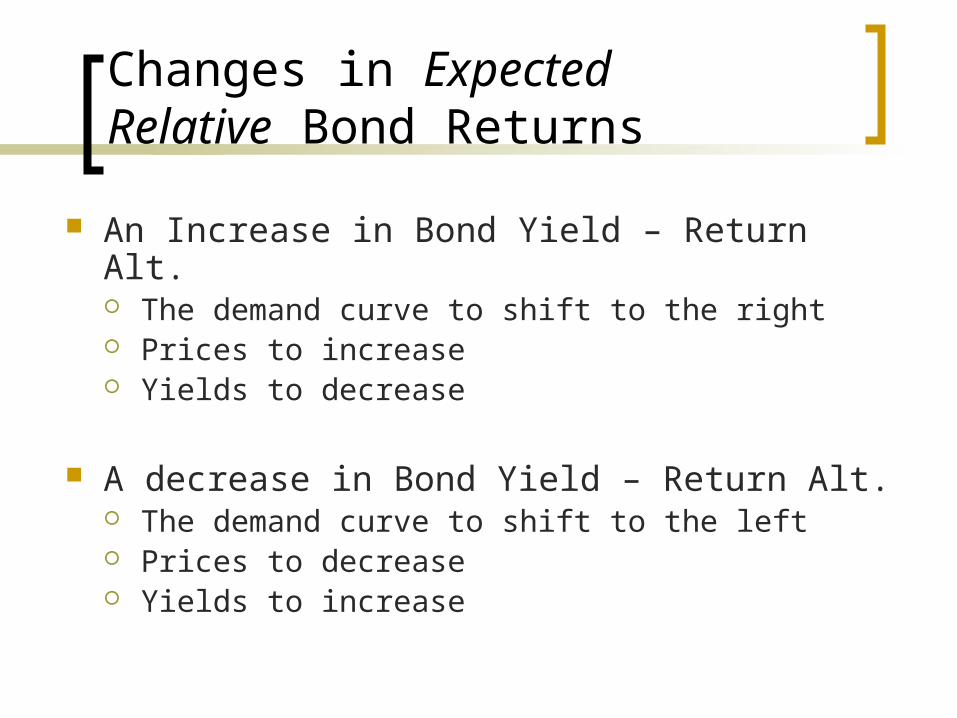
Changes in Expected Relative Bond Returns
An Increase in Bond Yield – Return Alt. The demand curve to shift to the right Prices to increase Yields to decrease
A decrease in Bond Yield – Return Alt. The demand curve to shift to the left Prices to decrease Yields to increase
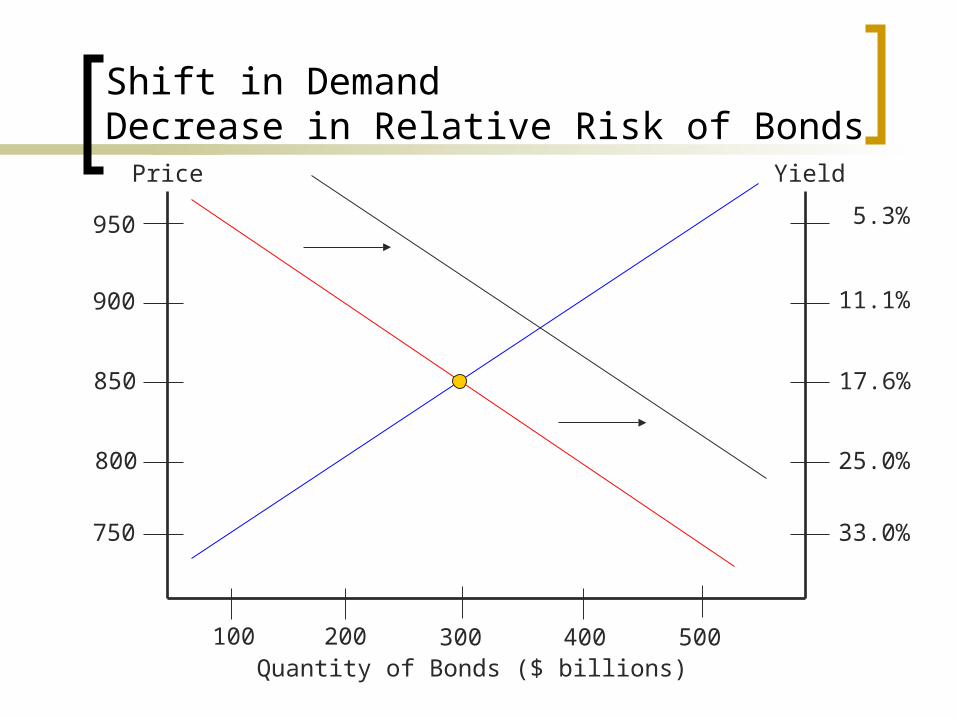
Shift in DemandDecrease in Relative Risk of Bonds
Quantity of Bonds ($ billions)
Price
950 5.3%
Yield
300
900
850
800
750
200100 400 500
11.1%
17.6%
25.0%
33.0%
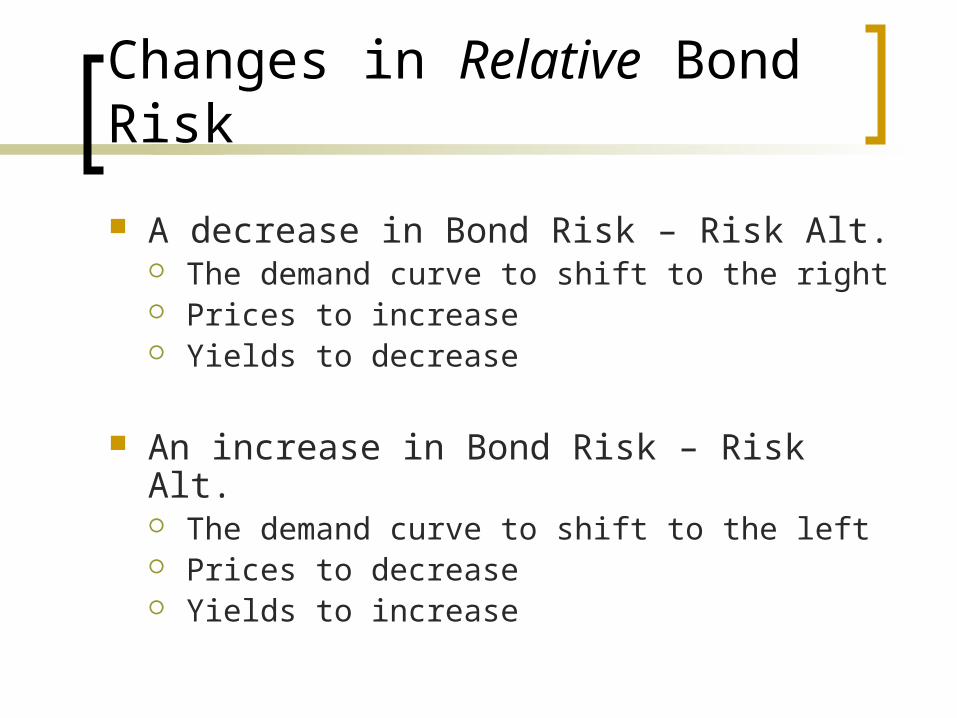
Changes in Relative Bond Risk
A decrease in Bond Risk – Risk Alt. The demand curve to shift to the right Prices to increase Yields to decrease
An increase in Bond Risk – Risk Alt. The demand curve to shift to the left Prices to decrease Yields to increase
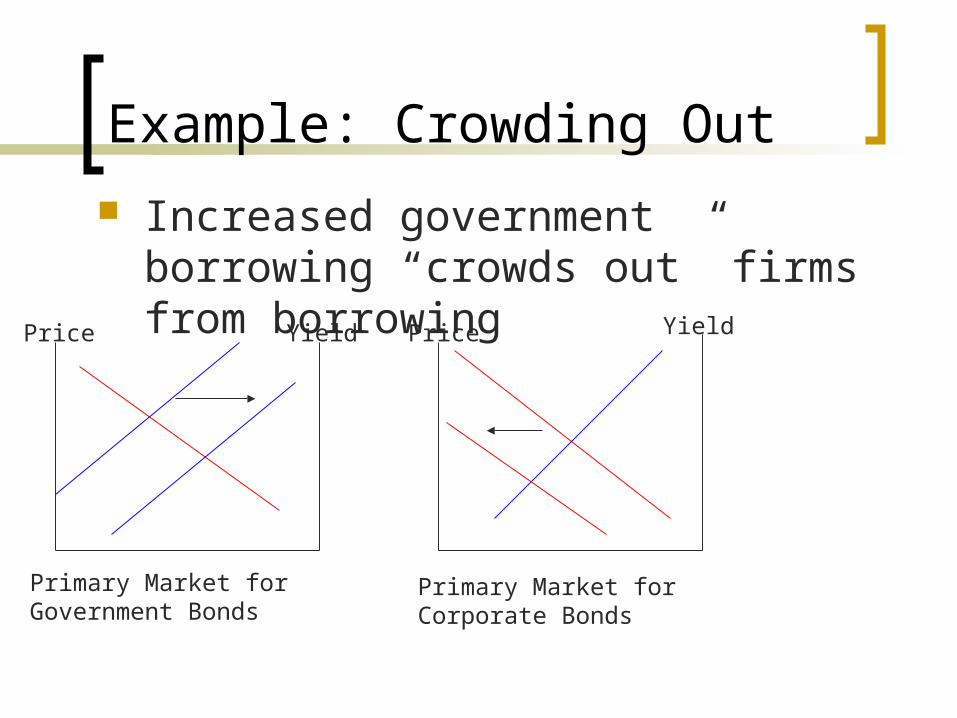
Example: Crowding Out
Increased government borrowing “crowds out” firms from borrowing
Price Yield
Primary Market forGovernment Bonds
Price Yield
Primary Market forCorporate Bonds
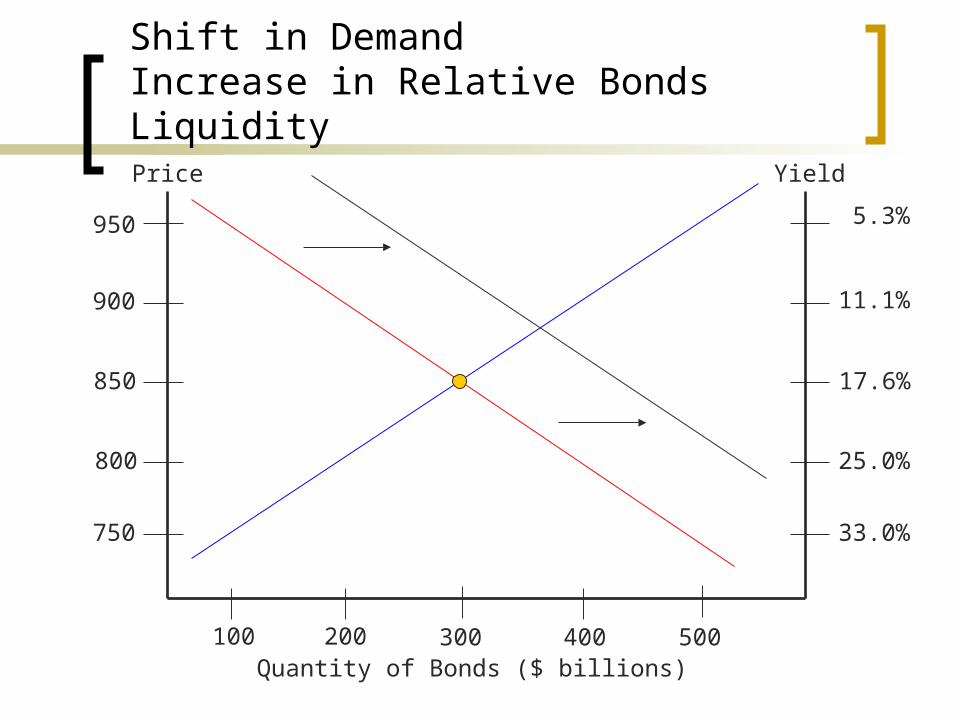
Shift in DemandIncrease in Relative Bonds Liquidity
Quantity of Bonds ($ billions)
Price
950 5.3%
Yield
300
900
850
800
750
200100 400 500
11.1%
17.6%
25.0%
33.0%
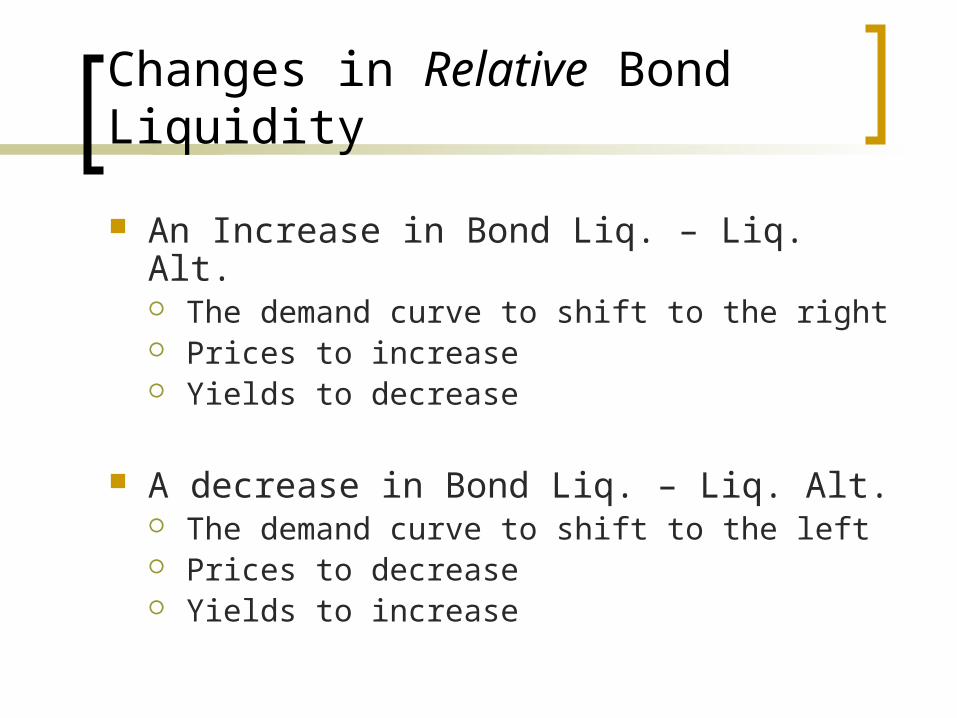
Changes in Relative Bond Liquidity
An Increase in Bond Liq. – Liq. Alt. The demand curve to shift to the right Prices to increase Yields to decrease
A decrease in Bond Liq. – Liq. Alt. The demand curve to shift to the left Prices to decrease Yields to increase
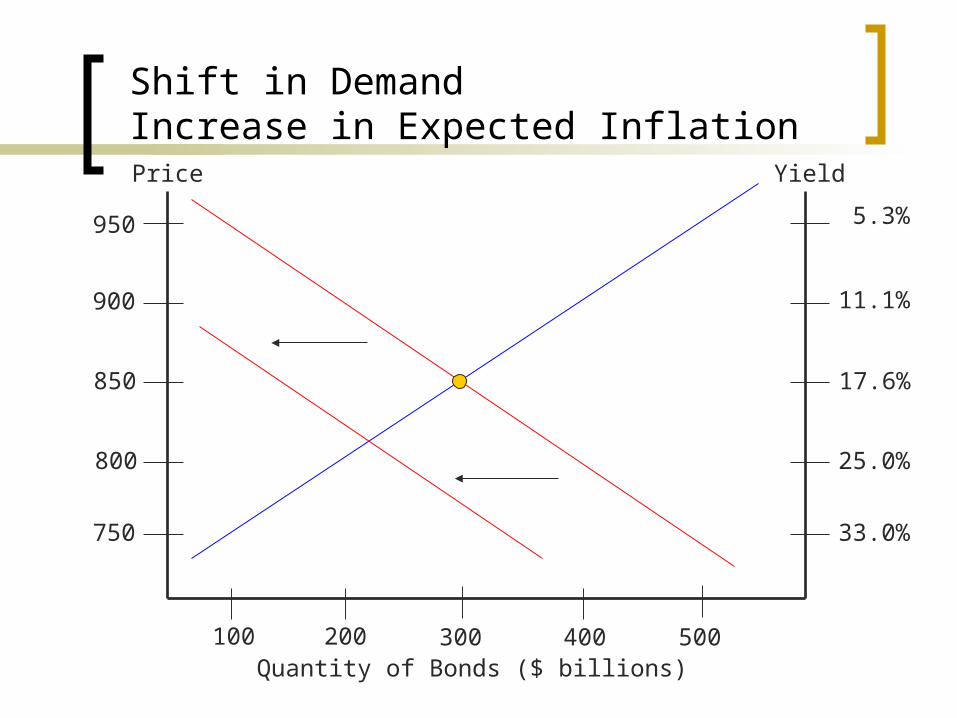
Shift in DemandIncrease in Expected Inflation
Quantity of Bonds ($ billions)
Price
950 5.3%
Yield
300
900
850
800
750
200100 400 500
11.1%
17.6%
25.0%
33.0%
Changes in Expected Inflation
A Decrease in Expected Inflation The demand curve to shift to the right Prices to increase Yields to decrease
An increase in Expected Inflation The demand curve to shift to the left Prices to decrease Yields to increase
Expected Inflation
Expected inflation shifts both curves
Consider a decrease in expected inflation
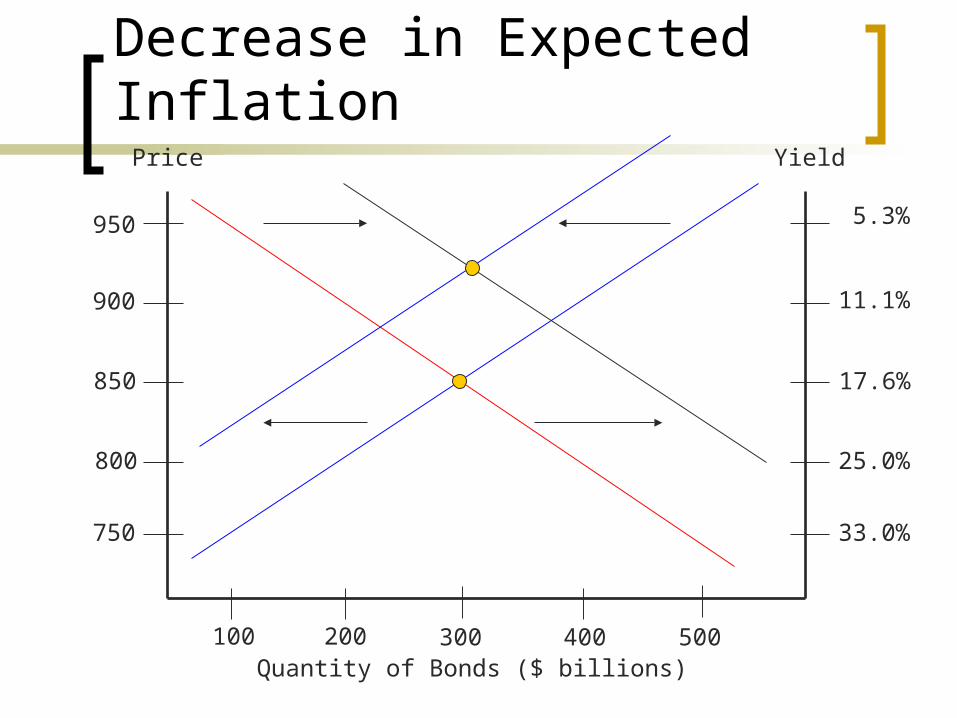
Decrease in Expected Inflation
Quantity of Bonds ($ billions)
Price
950 5.3%
Yield
300
900
850
800
750
200100 400 500
11.1%
17.6%
25.0%
33.0%
Decrease in Expected Inflation
A decrease in expected inflation unambiguously causes bond prices to rise and yields to fall.
Business Cycles
Business Cycles can shift both curves
Consider what happens when economy emerges from a recession.
Jobs are created, household wealth increases Business conditions improve
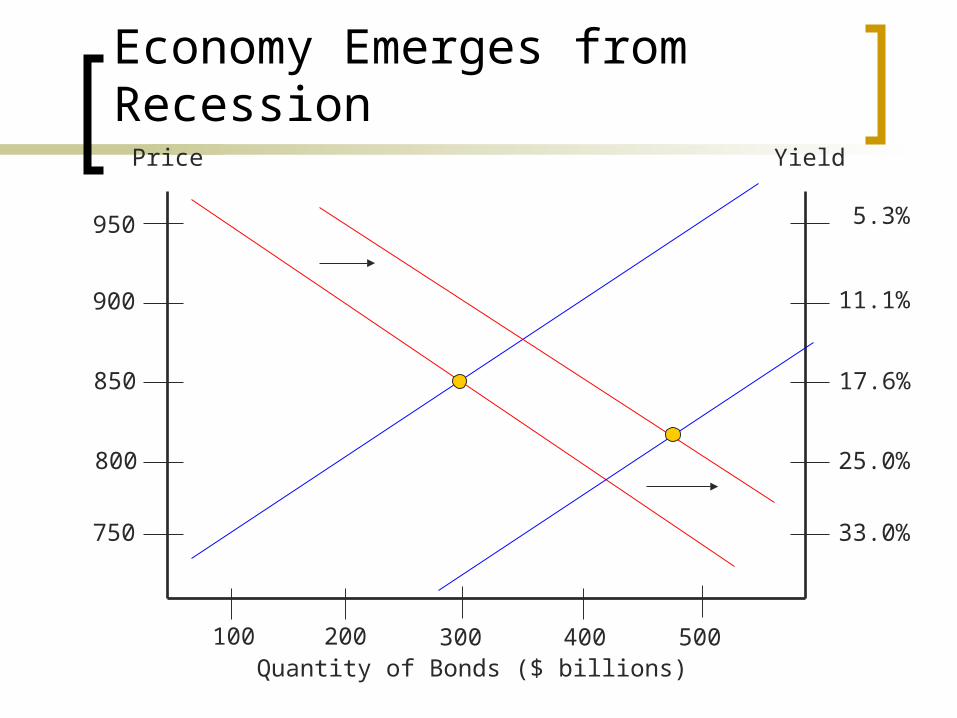
Economy Emerges from Recession
Quantity of Bonds ($ billions)
Price
950 5.3%
Yield
300
900
850
800
750
200100 400 500
11.1%
17.6%
25.0%
33.0%
Economy Emerges from Recession
During expansions Wealth increases (demand shifts right) Business Conditions improve (supply shifts
right)
Effect could be ambiguous Data shows during expansions
Bond prices decline, yields increase
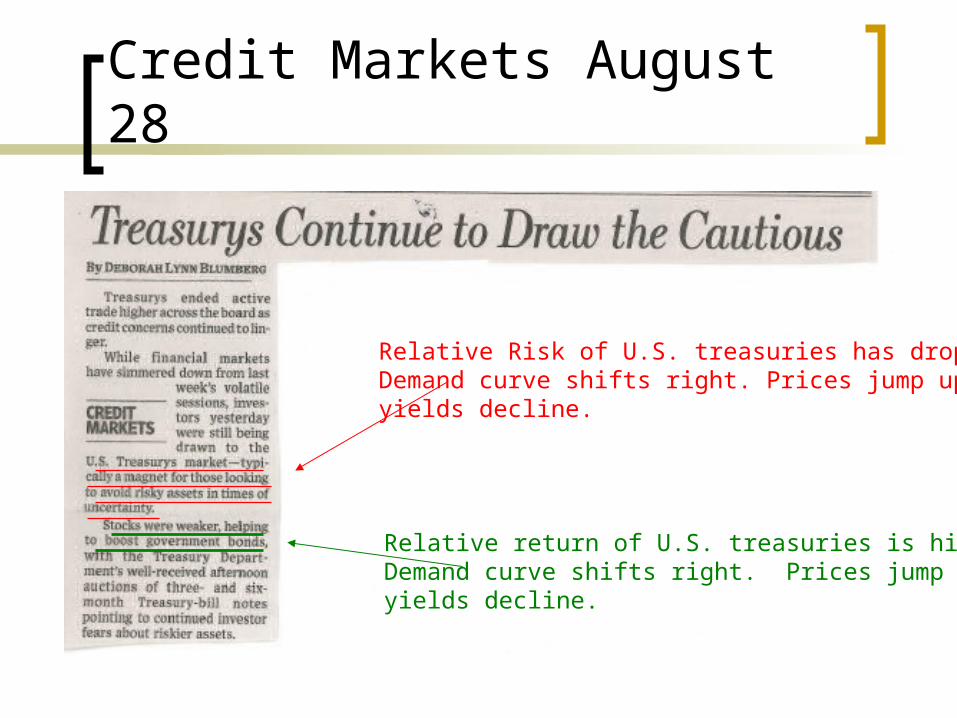
Credit Markets August 28
Relative Risk of U.S. treasuries has dropped.Demand curve shifts right. Prices jump up,yields decline.
Relative return of U.S. treasuries is higher.Demand curve shifts right. Prices jump up,yields decline.

Credit Markets July 2Softer inflation causes demand curve toshift right, supply curve to shift left. Botheffects cause prices to increase, yieldsto decrease.