
CHAPTER 2 LITERATURE REVIEW - UM Students' …studentsrepo.um.edu.my/1592/3/CH_2.pdf10 CHAPTER 2...
22
10 CHAPTER 2 LITERATURE REVIEW 2.1 Theories of Capital Structure There are four major theories in explaining the capital structure of a firm, namely Modigliani-Miller theorem, the pecking order theory, the trade-off theory, and market timing theory. Most of the capital structure studies are guided by trade-off theory and pecking order theory. The four theories are briefly explained in the following sub-chapters. 2.1.1 Modigliani-Miller (MM) Theorem Modigliani and Miller (1958) have contributed to the fundamental theory of capital structure. In the seminar paper presented by Modigliani and Miller, their theorem states that in the absence of transaction costs, corporate taxes, and the possibility of default, the value of firms is independent of the proportion of debt and equity in the firm’s capital structure. Therefore, the difference in leverage ratio for the firms does not change the cost of capital and thus is irrelevant to the value of the firms. Consequently, the investment decision can be made independently of the firm financial decision. This is the famous MM hypothesis which is also called as irrelevance proposition. There are two fundamentally different types of capital structure irrelevance propositions. The first classical arbitrage-based irrelevance proposition provides settings in which arbitrage by investors keeps the value of the firm independent of its leverage. The second capital structure irrelevance proposition is associated with multiple equilibriums. In models of this kind,
Transcript of CHAPTER 2 LITERATURE REVIEW - UM Students' …studentsrepo.um.edu.my/1592/3/CH_2.pdf10 CHAPTER 2...
10
CHAPTER 2 LITERATURE REVIEW
2.1 Theories of Capital Structure
There are four major theories in explaining the capital structure of a firm,
namely Modigliani-Miller theorem, the pecking order theory, the trade-off
theory, and market timing theory. Most of the capital structure studies are
guided by trade-off theory and pecking order theory. The four theories are
briefly explained in the following sub-chapters.
2.1.1 Modigliani-Miller (MM) Theorem
Modigliani and Miller (1958) have contributed to the fundamental theory of
capital structure. In the seminar paper presented by Modigliani and Miller,
their theorem states that in the absence of transaction costs, corporate taxes,
and the possibility of default, the value of firms is independent of the
proportion of debt and equity in the firm’s capital structure. Therefore, the
difference in leverage ratio for the firms does not change the cost of capital
and thus is irrelevant to the value of the firms. Consequently, the investment
decision can be made independently of the firm financial decision. This is the
famous MM hypothesis which is also called as irrelevance proposition.
There are two fundamentally different types of capital structure irrelevance
propositions. The first classical arbitrage-based irrelevance proposition
provides settings in which arbitrage by investors keeps the value of the firm
independent of its leverage. The second capital structure irrelevance
proposition is associated with multiple equilibriums. In models of this kind,
11
equilibrium conditions pin down the aggregate amount of debt and equity in
the market. However, the model does not specify how these aggregate
quantities get divided up among the firms.
The first MM theorem is too idealistic and can only be applied to a perfect
world. Five years later in 1963, Modigliani and Miller improved the model to
match with the real world. Corporate income taxes have been introduced to
the original model to show their impacts on capital structure of a firm. This has
later led to the development of two new capital structure theories, namely
pecking order theory and trade-off theory (Hsiao, Hsu, and Hsu, 2009). The
introduction of tax factor in the new model theoretically encourages the firms
to keep a higher debt ratio in order to exploit the maximum benefit of tax
deductibility from interest payment. The higher the debt level, the greater the
tax shield and thus debt financing is preferable than external equity financing.
2.1.2 Pecking Order Theory
The pecking order theory is originated by Myers and Majluf (1984). This
theory states that there is no fixed target of debt over equity ratio. In other
words, optimal capital structure does not exist in the firms. Firms are said to
follow a financing hierarchy order in sourcing the funds for their investment
projects according to the law of least effort or least resistance. Hence, internal
equity (retained earning) is said to be the most preferable source of funding
option for the firms. When internal equity is depleted, external debt is used
after that. Finally, the least preferred choice of external equity is used if more
financing is required after retained earning and debt. The supports of this
12
argument reflect from the values of managers on flexibility and control
(Damodaran, 1999). To certain extent external financing reduces flexibility for
future financing especially if it is a debt. The control of firm is affected by the
covenants of the bond and the dilution of total holding of firm equity due to
entrance of new stockholders. Therefore, managers prefer retained earning
as a source of capital. In addition, while it costs nothing in terms of floatation
cost to use retained earnings, it does cost more to use external debt and
equity.
Another explanation to the financing hierarchy is based on the existence of
asymmetric information (Myers, 1984; Myers and Majluf, 1984) between
inside and outside investors. When a manager chooses to finance by external
equity, investors would treat this as negative signal and interpret this
behaviour as the firm is overvalued. Therefore, investors tend to sell off the
stocks held by them. Consequently, the value of firm will drop immediately.
For this reason, firms follow a financing hierarchy; descending from internal
funds (retained earning), to debt, and finally to external equity.
Based on this theory, a firm’s capital structure is said to be a function of its
internal cash flows and the amount of positive NPV of investment opportunity
available. The observed leverage reflects the past profitability and investment
(growth) opportunities of firms. A firm that has been very profitable in an
industry with relatively slow growth (few investment opportunities) will have no
incentive to issue debt and will likely have a low debt-to-equity ratio. A less
profitable firm in the same industry will likely have a high debt-to-equity ratio.
13
The more profitable a firm, the more financial slack (a firm’s highly liquid
assets) it can build up.
2.1.3 Trade-Off Theory
Jensen’s (1986) hypothesis states that a firm’s choice of capital structure is
determined by trade-off between agency costs and monitoring costs.
According to the trade-off theory, firms are generally financed by both equities
and debts. Trade-off theory states that optimal capital structure does exist. A
firm is regarded as setting up a target debt level and gradually moving
towards it (Myers, 1984). The purpose of the trade-off theory of capital
structure is to explain the strategy of firms to finance their investments
sometimes by equities and sometimes by debts. The theory also studies the
corresponding advantages and disadvantages of financing either by equity or
by bond. The trade-off theory actually allows the cost of bankruptcy to exist.
The trade off theory primarily deals with the two concepts – cost of financial
distress and agency costs. The first type of financial distress is leading the
firms to bankruptcy if the level of debt exceeds the debt payment ability of the
firms. Whereas the second type of agency cost is a type of internal cost. The
firms may often experience a dispute of interests among the management of
the firm, debt holders, and shareholders. These disputes generally give birth
to agency problems that in turn give rise to the agency costs.
The direct cost of financial distress refers to the cost of insolvency of a
company. A firm experiences financial distress when the firm is unable to
14
cope with the debt holders' obligations. If the firm continues to fail in making
payments to the debt holders, the firm can even be declared as bankrupt and
insolvent. Once the proceedings of insolvency start, the assets of the firm may
be sold at a distress price, which is generally much lower than the current
values of the assets. A huge amount of administrative and legal costs are also
associated with the insolvency. Even if the company is not insolvent, the
financial distress of the company may include a number of indirect costs such
as cost of customers, cost of employees, cost of investors, cost of managers,
cost of shareholders, and cost of suppliers. This is inconsistent with the
finding of Jou (1999) that the value of insurance firms in Taiwan increases
initially with leverage financing but trending down later. Therefore, market
equilibrium is achieved when the benefit of tax shield from debt financing
reaches a maximum level of bankruptcy risk that is sustainable by the firms.
Kraus and Litzenberger (1973) provide a classical statement of theory that
optimal leverage reflects a trade-off between the tax shield of debt and the
deadweight costs of bankruptcy. According to Miller (1977), the attractiveness
of debt decreases with personal tax on interest income.
The agency costs may affect the capital structure of a firm. Jensen and
Meckling (1976) identify two types of conflicts that exist in a corporation –
shareholders-managers conflict and shareholders-debt holders conflict.
Managers especially the top management team in a corporate firm are the
agents of shareholders. These managers do not hold or directly own any
share of the firm and thus the interests of managers and shareholders could
15
be very different and sometimes in conflict. While the shareholders like the
management to run the company in a way that increases shareholder’s value,
managers are said to be in favour of their personal benefits that may not be in
the best interests of shareholders, e.g. increasing in perquisites, power, and
empire building at the expense of shareholders. As a result, managers
overindulge in these pursuits rather than maximizing the firm value. Debt is
identified to be a useful tool to control such misbehaviour. Managers need to
service the payment of debt to avoid bankruptcy of the firms. Bankruptcy is
costly to the managers since they may be replaced and thus may lose their
jobs and benefits. As a result, managers are paying more attention to manage
the firm and maximize the firm resources to save the firm and ultimately
themselves. In addition, acquiring debt commits the firm to pay out the cash at
the pre-determined timeframe and reduce the amount of cash flows of the firm.
Managers are not able to freely spend the cash for their personal benefits.
The idea that debt mitigates agency conflicts between shareholders and
managers is outlined by many researchers including Hart and Moore (1994),
Jensen (1986), and Jensen and Meckling (1976).
The agency conflict between shareholders and debt holders is described in
many literatures. Myers (1977) points out that shareholders may have no
interest to invest more capital even to a profitable project when firms are likely
to go bankrupt in the near future. This is because the debt holders have the
first right to claim their borrowings. Shareholders are only allowable to receive
the residual profits if there is any left over. Conflicts between shareholders
and debt holders also arise from the incentive of shareholders to invest sub-
16
optimally. Shareholders are able to invest at the expense of debt holders.
Shareholders enjoy a profit gain if any investment yields a return above the
face value of the debt whereas debt holders face a big loss if the investment
fails. This is due to the concept of limited liability of the shareholders.
Therefore, shareholders may invest in very risky projects in the hope of big
return but at the same time bear a limited liability in case the investment
projects fail to bring a targeted return.
Based on the static (traditional) trade-off theory, the firm’s optimal capital
structure involves the trade-off among the effect of corporate and personal
taxes, bankruptcy costs, and agency costs. Therefore, the optimal debt-equity
ratio minimizes cost of capital and maximizes firm value. This theory states
that more profitable firms tend to have a higher debt ratio in order to control
and avoid misbehaviour of managers.
Dynamic trade-off theory tries a compromise between static trade-off theory
and pecking order theory (Fischer, Heinkel, and Zechner, 1989; Leland, 1998).
It suggests that due to information asymmetries, market imperfections and
transaction costs, many firms allow their leverage ratios to drift away from
their targets for a time, when the distance becomes large enough managers
take steps to move their firms back to the target. While pecking order theory
explains short-run deviation from the target, static trade-off theory holds in the
long run. Following this approach, leverage must converge toward a target
leverage ratio. That would not be the case following pecking order theory
because managers make no effort to reverse changes in leverage.
17
2.1.4 Market Timing Theory
Market timing theory of capital structure is relatively new. It is first introduced
by Baker and Wurgler (2002). They state that capital structure is the
accumulative outcome of past attempts to time the equity market. Based on
this, they have constructed a historical market-to-book ratio (external finance
weighted historical market-to-book ratio) to capture firms’ past equity market
timing attempts. By controlling the firms’ growth opportunities through the
proxy of current market-to-book ratio, the result reveals that leverage is
inversely related to historical market-to-book ratio. This shows an evidence of
supporting equity market timing hypothesis. Baker and Wurglar (2002) further
argue that the significance of historical market-to-book ratio in explaining
leverage is inconsistent with the trade-off theory. In trade-off framework, as
firms adjust to their optimal capital structure, temporary shocks such as
market timing attempts should not have a long-lasting effect on firms’ leverage.
Mahajan and Tartaroglu (2008) argue that market timing theory and trade-off
theory predict very different leverage adjustment process following equity
issuances.
The equity market timing theory simply argues that time-variation in the
relative cost of equity, whether due to rational or irrational investors, has
important implications for capital structure choices. Empirical work links cost
of equity to capital structure directly has only started quite recently. Aydogan
(2006), Hovakimian (2006), and Kayhan and Titman (2007) confirm the
existence of market timing for security issuance, though they disagree with
18
Baker and Wurgler (2002) on the persistence of the effect of market timing on
capital structure. Their result reveals that market timing only has short period
of effect on leverage ratio of firms.
Market timing theory of capital structure assumes managers are more
informed about the firm’s prospects than investors and that investors do not
anticipate this. It predicts that managers attempt to time the market by issuing
equity when they perceive share prices to be overvalued. It thus suggests that
managers are able to identify certain time periods during which equity
issuance is less costly due to high valuation of company’s stock. In other
words, firms are more likely to issue equity when their market values are high,
relative to book and post market values, and to repurchase equity when their
market values are low. As a consequence, current capital structure is strongly
related to historical market values. This result provides the theory that capital
structure is the cumulative outcome of past attempts to time the equity market
which is consistent with the finding of Baker and Wurglar (2002). Therefore, a
small debt ratio must thus follow a long period of high market-to-book ratio.
2.2 Market Value versus Book Value
Conceptually book value is different from market value. Book value is an
accounting number. It reflects the cost of a transaction which has occurred or
is reasonably certain to occur. Therefore, book value is considered as
backward-looking measure. On the other hand, market value is determined in
the stock market through its market capitalization. Therefore, it is forward-
looking in time. It represents the market’s estimate of the value based on
19
available information and future prediction. Market value reflects the
expectations on the current net worth of the company and its future earnings.
As pointed by Barclay et al. (2006), there is no inherent reason why a forward-
looking measure should be the same as a backward-looking measure. Market
value is significantly different from book value as it takes into the
consideration of reputation, brand names, customer loyalty, management
talent, expected growth opportunities, and macroeconomic environment.
Numerous studies (Bowman, 1980; Sweeney at al., 1997) have shown that
market value is a better choice in comparison to book value in measuring the
debt and equity of a firm. Market value is used in this study whenever it is
available. For the measurement of debt ratio, a quasi-market leverage ratio is
used since it is not possible to measure the exact market value of the total
debt.
2.3 Definition of Debt Ratio
In this study, the terms for capital structure, leverage ratio and debt ratio are
used interchangeably. Several alternative definitions of capital structure have
been used in the literatures. Most studies consider some forms of debt ratio
which could be different in terms of whether a book value or market value is
used in the definition or computation of leverage in deriving the debt ratio.
Some studies even included more than one debt ratio to study the effects of
different debt ratios.
20
Many different types of leverage ratios have been used by different
researchers in the past studies. These leverage ratios consist of both single
debt ratio such as long-term debt ratio or short-term debt ratio and total debt
(the sum of long-term debt and short-term debt) ratio. The results vary
according to the country since the capital structure for certain countries more
trend towards one type of financing option, for instance, Greek firms tend to
finance by short-term loan rather than long-term loan (Eriotis et al., 2007).
Some researchers even use more than one leverage ratio in their models
(Amidu, 2007; Ooi, 1999; Titman and Wessels, 1988; Viviani, 2008). Others
argue that theories are really about long-term debt, while short-term debt is
merely an operational issue. Generally long-term borrowing is more frequently
used in the evaluation of a firm’s debt position. Short-term debt is always
considered as a temporary obligation and thus it is not affecting the firm value
in long-run. However, such assumption is not always the true. Depending on
the country and types of industry, some firms tend to maintain a higher short-
term debt than long-term debt in their borrowing policy. In fact, it is found that
total short-term debt for all the selected firms in this study is always higher
than total long-term debt for these firms and also for each of the five years
(2004 to 2008). Therefore, this study has adopted both long-term debt and
short-term debt as the numerator of debt ratio since both of them are used by
manufacturing firms in Malaysia to finance the firm operations.
On the other hand, the denominator of leverage ratio also varies according to
different researchers. The most commonly used are total assets and total
capital. Total assets represent the total value of firm in book value format. As
21
such, its value is rather stable and less reflective of the actual value of the firm.
The more recent academic literatures tend to focus on market value of the
firm by choosing the total capital as the total value of the firm. Total capital
consists of book value of debt plus market value of equity which is a better
approach to compute the value of the firm at that particular time. Therefore,
total capital is used as the denominator in computing the debt ratio.
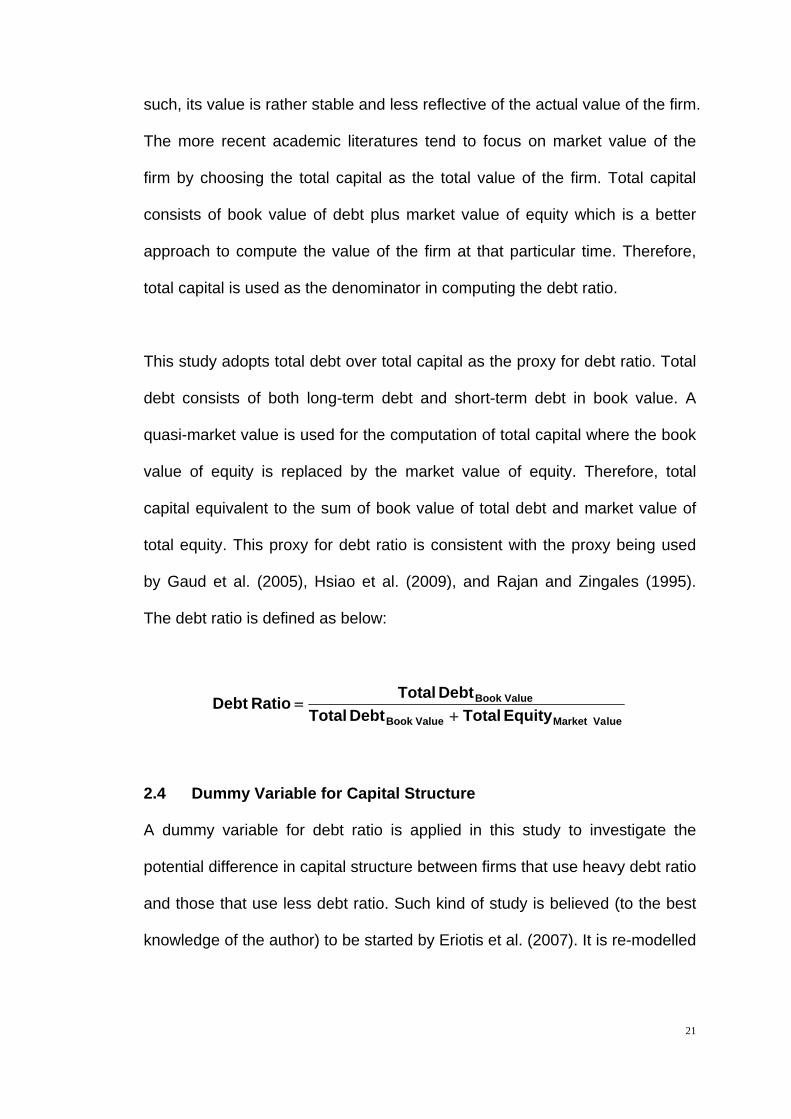
This study adopts total debt over total capital as the proxy for debt ratio. Total
debt consists of both long-term debt and short-term debt in book value. A
quasi-market value is used for the computation of total capital where the book
value of equity is replaced by the market value of equity. Therefore, total
capital equivalent to the sum of book value of total debt and market value of
total equity. This proxy for debt ratio is consistent with the proxy being used
by Gaud et al. (2005), Hsiao et al. (2009), and Rajan and Zingales (1995).
The debt ratio is defined as below:
lueMarket Va ValueBook
ValueBook
Equity Total Debt Total
Debt Total RatioDebt
2.4 Dummy Variable for Capital Structure
A dummy variable for debt ratio is applied in this study to investigate the
potential difference in capital structure between firms that use heavy debt ratio
and those that use less debt ratio. Such kind of study is believed (to the best
knowledge of the author) to be started by Eriotis et al. (2007). It is re-modelled
22
by Mat Kila and Wan Mahmood (2008) with an adjustment to the percentage
of debt ratio.
The study by Eriotis et al. (2007) has a sample mean of 0.5 for debt ratio.
They have adopted debt ratio of fifty (50) percent as the breaking point
between high debt ratio and low debt ratio for Greek firms. The value of
dummy variable is assigned as one (1) for firms with debt ratio greater than
fifty (50) percent and is assigned as zero (0) for firms with debt ratio less than
fifty (50) percent. However, Mat Kila and Wan Mahmood (2008) have modified
the model. Instead of using fifty (50) percent as the cut off point, thirty (30)
percent is adopted for the study of capital structure for firms in Malaysia. The
sample mean for their model is about 0.2.
A quick scanning on the debt ratio of firms listed under the sector of Industry
Products in the Main Market of Bursa Malaysia for a period from 2004 to 2008
shows that the mean of debt ratio is about 0.4. This value is higher than the
debt ratio obtains by Mat Kila and Wan Mahmood (2008) at 0.2 for Malaysian
firms. This indicates that generally debt ratio for manufacturing firms is higher
than the average debt ratio of firms from a mixture of sectors. Therefore, this
study adopts the model being introduced by Eriotis et al. (2007) based on the
consideration of sample mean of debt ratio for this study. The value of the
dummy variable is assigned as one (1) for firms which are having debt ratio
greater than fifty (50) percent, whereas zero (0) is assigned to the firms with
an opposite debt ratio.
23
2.5 Determinants of Capital Structure for Firm Characteristics
Despite many studies, there is still lack of consensus on many basic empirical
facts, such as the determinants of capital structure. Theoretical and empirical
studies have shown that the determinants of capital structure can be
categorized into macroeconomic factors (Bokpin, 2009, Cook and Tang, 2010;
Korajczyk and Levy, 2003), firm level characteristics (Amidu, 2007), time
variant attributes (Ooi, 1999), or even extended to legal factors (Wald and
Long, 2007). In a study by Fraser et al. (2006), they even found that there is
some kind of direct relationship between political patronage and capital
structure.
The examples for some of the macroeconomic factors are inflation rate,
economic growth rate, unemployment rate, gross domestic product (GDP) per
capital, GDP growth rate, central bank discount rate, bank credit (bank size),
market size, term spread, quarterly equity market return, and default spread
(Bokpin 2009; Chen et al., 2009; Cook and Tang, 2010; Korajczyk and Levy,
2003).
On the other hand, firm characteristics are more widely used by the
researchers to study the determinants of capital structure. Amongst the firm
characteristics that are frequently used in the past studies include but not
limited to firm size, interest coverage ratio, tangibility, profitability, growth
opportunities, intangible ratio, change in working capital, dividend, non-debt
tax shield, R&D expenditures, liquidity, earning volatility, and asset beta (Al-
Najjar and Taylor, 2008; Amidu, 2007; Carpentier, 2006; Chen, 2004; Eriotis
24
et al., 2007; Frank and Goyal, 2002; Pandey 2004; Titman and Wessels,
1988).
The third group of attributes is time variant, such as interest rate and stock
market condition (Ooi, 1999), is mostly used to capture the dynamic aspects
of the capital structure decision.
The forth group of attributes is legal factor such as antitakeover index and
recapture (Wald and Long, 2007).
Finally, the last group of determinants is political patronage. Fraser et al.
(2006) have adopted percentage of direct government equity ownership of a
firm, percentage of equity ownership by government controlled or sponsored
institutional investors, and the informal political ties a firm has with the
powerful politicians in that country as the proxies for political patronages.
In this study, only firm characteristics are included in the scope. The factors of
firm characteristics such firm size, interest coverage ratio, tangibility,
profitability, and growth opportunities are adopted for this study based on their
common use in the past studies as the determinants of capital structure
decision. Besides, the inclusion of interest coverage ratio is also served as a
new factor for capital structure study since so far only one (to the best
knowledge of the author) paper has studied this factor for Malaysian firms.
This factor is also rarely tested in other markets out of Malaysia. By including
this factor in the study, it could shed some lights for future researchers on the
25
relationship of this factor to debt ratio in the context of Malaysian market as
well as other world markets.
2.5.1 Firm Size
There is considerable evidence that firm size plays an important role in
determining the capital structure of a firm. Researchers have taken the view
that large firms are less susceptible to bankruptcy because they tend to be
more diversified than smaller firms (Ang et al., 1982; Smith and Warner, 1979).
Several forms of definition have adopted in the past study for firm size. Some
of the researchers even select more than one proxy to represent the firm size
(Viviani, 2008). Amongst them, the most commonly used are natural logarithm
of sales (Carpentier, 2006; Drobetz and Fix, 2005; Huang and Song, 2006;
Psillaki and Daskalakis, 2009; Titman and Wessels, 1988; Viviani, 2008) and
natural logarithm of total assets (Al-Najjar, 2008; Amidu, 2007; Eldomiaty,
2007; Viviani, 2008). In the case of Karadeniz et al. (2009), the sales figures
use to compute firm size is corrected by the inflation rate in which firm size
equals to natural logarithm of corrected sales (to inflation rate).
In this study, natural logarithm of net sales is selected since it is one of the
most commonly used proxies for firm size. In addition, sales instead of total
assets is chosen as the latter is subject to more accounting problems (Gaud
et al., 2005).
Sales)(Net lnSizeFirm
26
The natural logarithmic transformation is used to reduce the skewness of the
distribution and to minimize the standard error of the regression coefficient.
2.5.2 Interest Coverage Ratio
Interest coverage ratio measures the ability of a firm to service the interest on
borrowed money. The higher the interest coverage ratio, the more stable the
firm is as its interest obligations are well covered. Therefore, this ratio also
provides a mean to the debtors to evaluate the risk of default by their creditors.
Earning before interest and taxes (EBIT) to interest expense is used by
Madan (2007) and Rajan and Zingales (1995) to proxy interest coverage ratio.
However, earning before interest, taxes, depreciation and amortization
(EBITDA) to interest expense has also being used by Rajan and Zingales
(1995) as the second proxy for interest coverage ratio. On the other hand,
Eriotis et al. (2007) and Mat Kila and Wan Mahmood (2008) apply a slightly
different definition. They propose net income before taxes to interest
payments as the proxy for interest coverage ratio.
In a study by Rajan and Zingales (1995), both earning before interest and
taxes (EBIT) to interest expense and earning before interest, taxes,
depreciation and amortization (EBITDA) to interest expense are adopted to
measure the interest coverage ratio. Although both ratios are used in Rajan
and Zingales’s (1995) model, they argued that the former proxy is only
appropriate if the investments equal in magnitude to depreciation are needed
27
to keep the firm a going concern. If such investments are not needed, a better
measure of the firm's ability to service debt is EBITDA over fixed interest cost.
A common problem for both measures is that they assume that short-term
liabilities like accounts payable and short-term debt will be rolled over, which
may not be true in times of distress. Furthermore, as Jensen (1986) argues,
an inability to make fixed payments at low levels of debt may have very
different implications for the control of firm than an inability to make those
payments at high levels of debt. The former is more likely to lead to liquidation
while the latter may lead to reorganization (especially if the debt is closely
held). Another problem is that these measures are very sensitive to income
fluctuation.
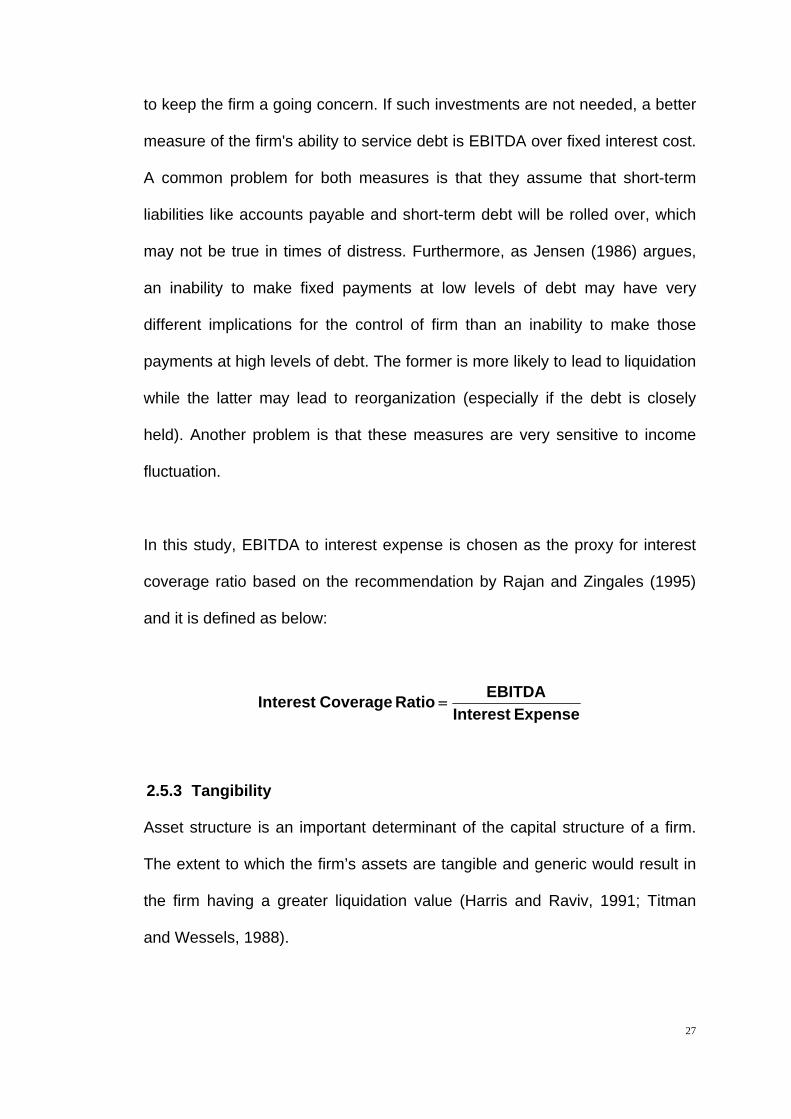
In this study, EBITDA to interest expense is chosen as the proxy for interest
coverage ratio based on the recommendation by Rajan and Zingales (1995)
and it is defined as below:
ExpenseInterest
EBITDA Ratio CoverageInterest
2.5.3 Tangibility
Asset structure is an important determinant of the capital structure of a firm.
The extent to which the firm’s assets are tangible and generic would result in
the firm having a greater liquidation value (Harris and Raviv, 1991; Titman
and Wessels, 1988).
28
Most of the studies apply fixed assets over total assets as the proxy for
tangibility (Akintoye, 2008; Amidu, 2007; Gaud et al., 2005; Karadeniz et al.
2009; Psillaki and Daskalakis, 2009; Serrasqueiro and Ragao, 2009; Titman
and Wessels, 1988). Some have modified slightly to include the stock portion
to become the sum of fixed assets and stock over total assets (Panno, 2003;
Viviani, 2008). In a capital structure study conducted by Booth et al. (2001),
they only focus on non-current assets by defining the proxy for tangibility as
total assets less current assets divided by total assets.
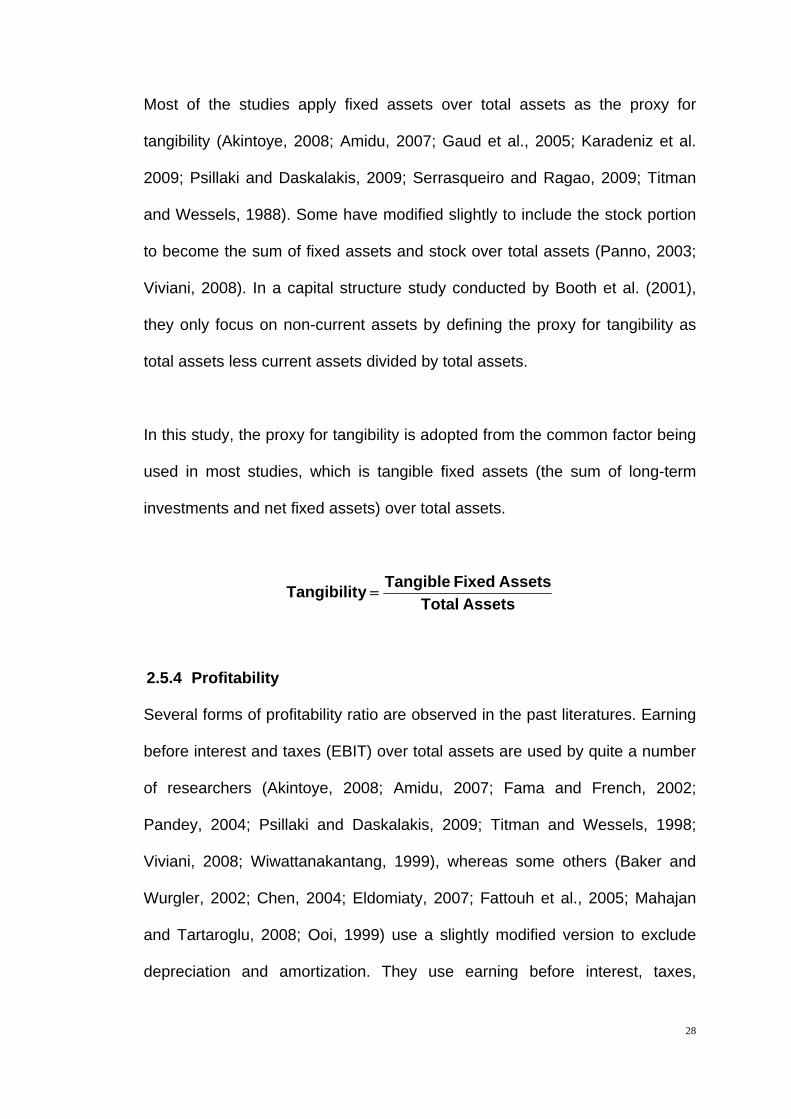
In this study, the proxy for tangibility is adopted from the common factor being
used in most studies, which is tangible fixed assets (the sum of long-term
investments and net fixed assets) over total assets.
AssetsTotal
AssetsFixed Tangible yTangibilit
2.5.4 Profitability
Several forms of profitability ratio are observed in the past literatures. Earning
before interest and taxes (EBIT) over total assets are used by quite a number
of researchers (Akintoye, 2008; Amidu, 2007; Fama and French, 2002;
Pandey, 2004; Psillaki and Daskalakis, 2009; Titman and Wessels, 1998;
Viviani, 2008; Wiwattanakantang, 1999), whereas some others (Baker and
Wurgler, 2002; Chen, 2004; Eldomiaty, 2007; Fattouh et al., 2005; Mahajan
and Tartaroglu, 2008; Ooi, 1999) use a slightly modified version to exclude
depreciation and amortization. They use earning before interest, taxes,
29
depreciation, and amortization (EBITDA) over total assets as the proxy of firm
profitability. Generally, majority of the literatures adopt the classical
profitability ratio, either return on equity (Al-Najjar, 2008; Bokpin, 2009;
Carpentier, 2006; Madan, 2007) or return on assets (Bokpin, 2009; Chen et
al., 2009; Karadeniz et al., 2009; Voulgaris, 2004) as a proxy for firm
profitability.
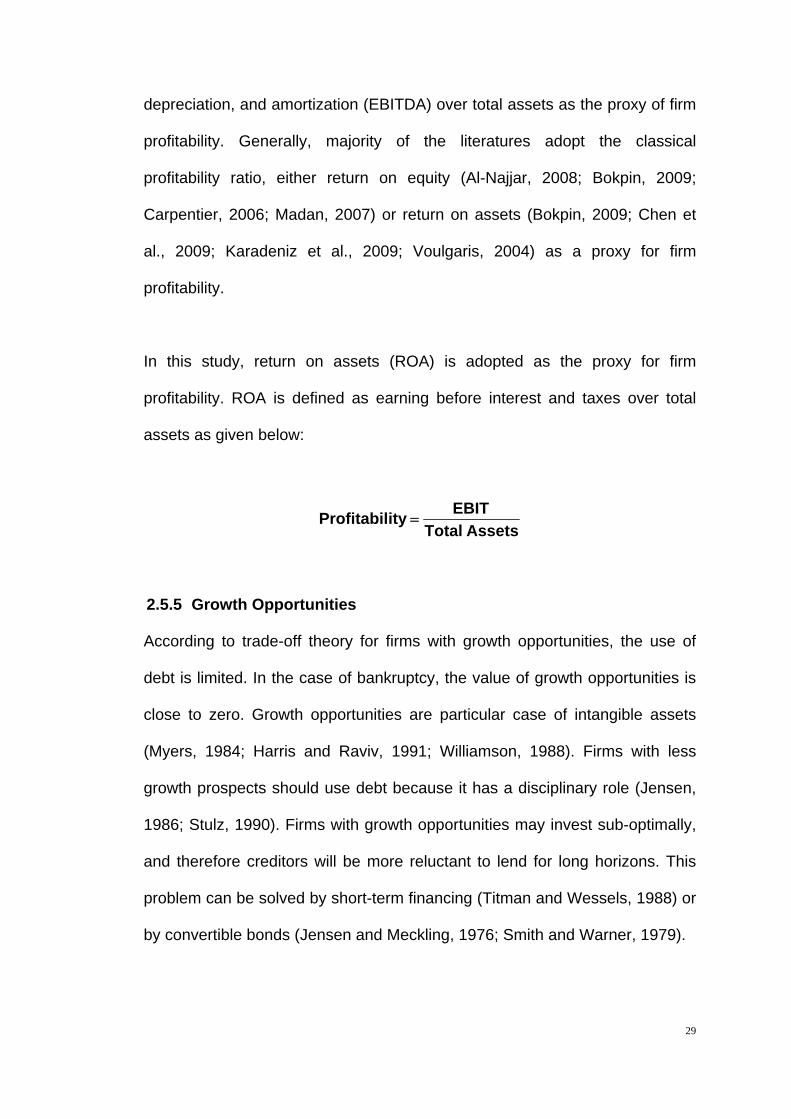
In this study, return on assets (ROA) is adopted as the proxy for firm
profitability. ROA is defined as earning before interest and taxes over total
assets as given below:
AssetsTotal
EBIT ityProfitabil
2.5.5 Growth Opportunities
According to trade-off theory for firms with growth opportunities, the use of
debt is limited. In the case of bankruptcy, the value of growth opportunities is
close to zero. Growth opportunities are particular case of intangible assets
(Myers, 1984; Harris and Raviv, 1991; Williamson, 1988). Firms with less
growth prospects should use debt because it has a disciplinary role (Jensen,
1986; Stulz, 1990). Firms with growth opportunities may invest sub-optimally,
and therefore creditors will be more reluctant to lend for long horizons. This
problem can be solved by short-term financing (Titman and Wessels, 1988) or
by convertible bonds (Jensen and Meckling, 1976; Smith and Warner, 1979).
30
Applying pecking order arguments, growing firms place a greater demand on
internally generate funds. Consequentially, firms with relatively high growth
tend to issue securities less subject to information asymmetries, i.e. short-
term debt. This should lead to firms with relatively higher growth having more
leverage.
A few numbers of proxies have been used to represent firm growth
opportunities. Amidu (2007) uses percentage change in sales of firm to study
the capital structure in banking industry. Eriotis et al. (2007), Mat Kila and
Wan Mahmood (2008), and Psillaki and Daskalakis (2009) use annual change
on earnings as the proxy for growth opportunities. On the other hand, Huang
and Song (2006) use both sales growth rate and Tobin’s Q as the measure of
growth opportunities. Ooi (1999), Viviani (2008), and Voulgaris (2004) use a
different approach by taking the firm’s growth rate in total assets as the proxy
for growth opportunities.
Market-to-book ratio of equity plays a dual role in empirical studies (Mahajan
and Tartaroglu, 2008). It is used as a measure of market mis-valuation (over-
or under-pricing) and is utilized as proxy for future growth opportunities in the
trade-off framework. Some researchers use market-to-book ratio (Al-Najjar,
2008; Booth et al., 2001; D’Mello and Farhat, 2008; Eldomiaty, 2007;
Karadeniz et al., 2009) to proxy the growth opportunities. However, there is an
argument that Tobin’s Q ratio which is quite similar to market-to-book ratio of
equity is in fact a better proxy (Huang and Song, 2006, p. 20; Ross et al.,
2008, p. 66). Tobin’s Q ratio focuses on what the firm is worth today relative to
31
what it would cost to replace it today. Firms with high Tobin’s Q ratio tend to
be those with attractive growth (investment) opportunities or significant
competitive advantages (or both). In contrast, market-to-book ratio of equity
focuses on historical costs and thus is less reflective to the firm future growth
condition.
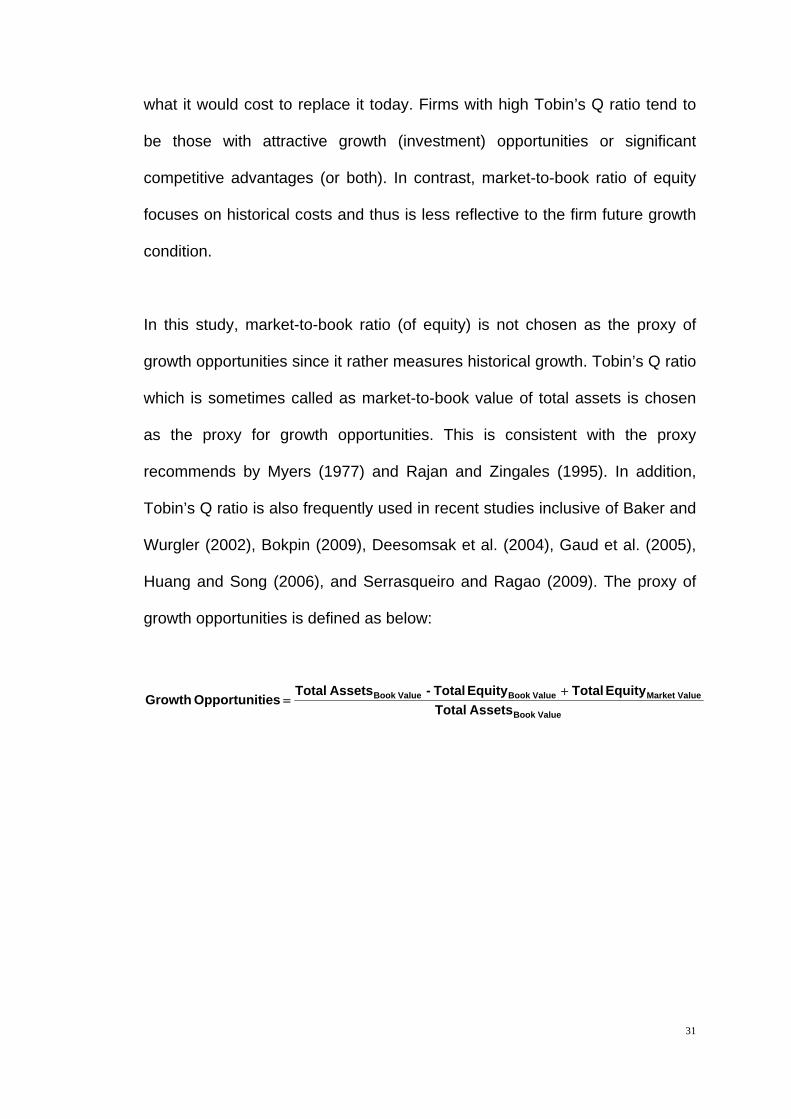
In this study, market-to-book ratio (of equity) is not chosen as the proxy of
growth opportunities since it rather measures historical growth. Tobin’s Q ratio
which is sometimes called as market-to-book value of total assets is chosen
as the proxy for growth opportunities. This is consistent with the proxy
recommends by Myers (1977) and Rajan and Zingales (1995). In addition,
Tobin’s Q ratio is also frequently used in recent studies inclusive of Baker and
Wurgler (2002), Bokpin (2009), Deesomsak et al. (2004), Gaud et al. (2005),
Huang and Song (2006), and Serrasqueiro and Ragao (2009). The proxy of
growth opportunities is defined as below:
ValueBook
ueMarket Val ValueBook ValueBook
AssetsTotal
Equity Total Equity Total - AssetsTotal iesOpportunit Growth


