
Chapter 2 Fused Fiber Couplers: Basic Theory and...
30
Chapter 2 Fused Fiber Couplers: Basic Theory and Automated Fabrication Fused couplers are made by joining two independent optical fibers, which work on the basic principle of coupling between parallel optical waveguides. The fabrication process and the performance parameters of these devices are reviewed. The different process parameters that control the performance as well as the recipe for realizing wavelength insensitive coupler are discussed in this chapter.
Transcript of Chapter 2 Fused Fiber Couplers: Basic Theory and...

Chapter 2
Fused Fiber Couplers: Basic Theory and Automated Fabrication
Fused couplers are made by joining two independent optical fibers, which work on the basic principle of coupling between parallel optical waveguides. The fabrication process and the performance parameters of these devices are reviewed. The different process parameters that control the performance as well as the recipe for realizing wavelength insensitive coupler are discussed in this chapter.
Fused Coupler Technology
26
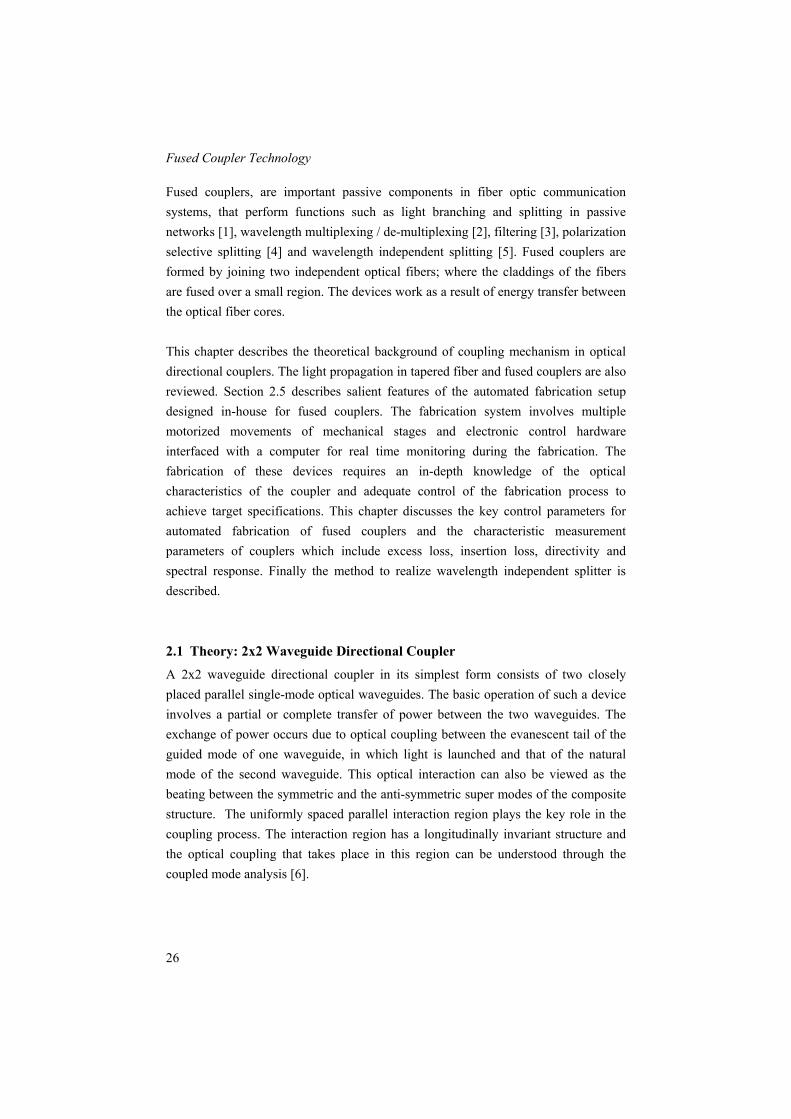
Fused couplers, are important passive components in fiber optic communication systems, that perform functions such as light branching and splitting in passive networks [1], wavelength multiplexing / de-multiplexing [2], filtering [3], polarization selective splitting [4] and wavelength independent splitting [5]. Fused couplers are formed by joining two independent optical fibers; where the claddings of the fibers are fused over a small region. The devices work as a result of energy transfer between the optical fiber cores. This chapter describes the theoretical background of coupling mechanism in optical directional couplers. The light propagation in tapered fiber and fused couplers are also reviewed. Section 2.5 describes salient features of the automated fabrication setup designed in-house for fused couplers. The fabrication system involves multiple motorized movements of mechanical stages and electronic control hardware interfaced with a computer for real time monitoring during the fabrication. The fabrication of these devices requires an in-depth knowledge of the optical characteristics of the coupler and adequate control of the fabrication process to achieve target specifications. This chapter discusses the key control parameters for automated fabrication of fused couplers and the characteristic measurement parameters of couplers which include excess loss, insertion loss, directivity and spectral response. Finally the method to realize wavelength independent splitter is described.
2.1 Theory: 2x2 Waveguide Directional Coupler
A 2x2 waveguide directional coupler in its simplest form consists of two closely placed parallel single-mode optical waveguides. The basic operation of such a device involves a partial or complete transfer of power between the two waveguides. The exchange of power occurs due to optical coupling between the evanescent tail of the guided mode of one waveguide, in which light is launched and that of the natural mode of the second waveguide. This optical interaction can also be viewed as the beating between the symmetric and the anti-symmetric super modes of the composite structure. The uniformly spaced parallel interaction region plays the key role in the coupling process. The interaction region has a longitudinally invariant structure and the optical coupling that takes place in this region can be understood through the coupled mode analysis [6].

Chapter 2
27
Figure 2.1 a: The symmetric and antisymmetric mode fields of the composite structure formed by a pair of identical single mode waveguides
Figure 2.1b: The relative phase difference of the two modes propagating along z and their superposition at z=π/2 cancel in waveguide-1 and add in waveguide-2
In the coupled mode analysis across the interaction region, the two uniform waveguides lying parallel to each other are assumed as a composite structure [7]. The composite system formed by the two single-mode waveguides can be shown to support two modes, a symmetric (even) mode and an anti-symmetric (odd) mode. These two modes called the normal modes or supermodes of the composite structure have different propagation constants [8, 9, 10]. When light is coupled into one of the waveguides, it excites a linear combination of the symmetric and the anti-symmetric supermodes as shown in Figure 2.1. Due to the unequal propagation constants of the two modes, the fields propagating down the system develop a relative phase difference with the distance of propagation. For a certain length of interaction, if the accumulated phase difference between these two modes becomes π, the superposition of these two modal fields will result in the cancellation of the field amplitudes in the input waveguide and an addition in the second waveguide. Such a situation is referred to as coupled state, and the corresponding interaction length as the coupling length, LC. If the interaction length extends beyond LC, reverse coupling takes place from the second waveguide at the input waveguide. Thus, for propagation over a length of 2LC will result in accumulation of a phase difference of 2π and hence power will be

Fused Coupler Technology
28
restored back in the input waveguide. Thus a periodic exchange of power between the two waveguides takes place with propagation. If the two waveguides are identical, complete power can be transferred from one waveguide to the other and vice-versa, while for non-identical waveguides, only a certain maximum power transfer takes place.
For unit power launched in waveguide-1 at z=0, the power distribution between the throughput (PT) and coupled (PC) waveguides at any z [11], is derived in Appendix A and is given by
zzPT γγκ 2
2
2
sin1)( −= (2.1)
zzPC γγκ 2
2
2
sin)( = (2.2)
where 4
)( 222 βκγ ∆+= (2.3)
21 βββ −=∆ (2.4)
Here β1 and β2 are the propagation constants of the fundamental modes of the individual waveguides, and κ is called the coupling coefficient. κ is a measure of the strength of the coupling. It can be shown that:
−
+=
211
2as
Aββκ (2.5)
where κβ
2∆
=A is the asymmetry parameter, sβ and aβ represent the propagation
constants of the symmetric and antisymmetric supermodes and they are given by
22
21
42κββββ +
∆+
+=s (2.6)
22
21
42κββββ +
∆−
+=a (2.7)
For a symmetric coupler formed with two identical waveguides, β∆ =0 and hence,
−
=2
as ββκ (2.8)
κββ ±=as , (2.9)

Chapter 2
29
Thus, the power distributions in a symmetric coupler are given by
zzPT κ2cos)( = (2.10)
zzPC κ2sin)( = (2.11)
These equations clearly demonstrate that for κπ2
=z , input power can be completely
transferred to the coupled waveguide. Figure 2.2 depicts the variation of the
throughput and coupled powers in the two waveguides as a function of the interaction
length, z from which it is apparent that the periodicity of power exchange isκπ
=L .
The power remains in the input waveguide when the interaction length 0=z , κπ ,
κπ
κπ m=
2 ; where ,...3,2,1,0=m whereas the entire power is coupled to the second
waveguide at κπ
+=
21mz ; ,...3,2,1,0=m . This suggests that by choosing a
suitable interaction length, any arbitrary power distribution between the two
interacting waveguides can be achieved. For a 50% distribution of power, the required
interaction length is κπ4
=z . This is the basic principle underlying the operation of a
3dB coupler, used as signal splitters or combiners.
For an asymmetric coupler consisting of two non-identical waveguides, since 0≠∆β , 100% transfer of power from one waveguide to the other is not possible. The efficiency (ηmax) for maximum power transfer depends on the asymmetry parameter, A as
max
22
2
max sin
= zγ
γκη (2.12)
If 12
=∆κβ , then
21
max =η , i.e., a maximum of 50% power transfer is possible. The
coupling coefficient κ quantifies the strength of coupling, which is the amount of
power transfer that takes place per unit length of the coupler. κ is proportional to the
difference between the propagation constants of the even and odd supermodes. Hence,

Fused Coupler Technology
30
the value of κ is governed by the geometry and refractive index profile of the
composite waveguide. Since the mode propagation constants vary with wavelength, κ
is wavelength sensitive and also polarization dependent.
0
0.2
0.4
0.6
0.8
1
0 1 2 3 4 5 6 7 8kz
Nor
mal
ized
Pow
er
Figure 2.2: Estimated power variation in the throughput and coupled ports as a
function of zκ in a symmetric coupler
2.2 Fused Fiber Coupler
A fiber directional coupler, consisting of two closely spaced parallel fibers analogous to waveguide coupler discussed above, also functions on the basis of overlap between the modal fields of the guided modes of the constituent fibers through their evanescent tails [12] The two fibers are therefore required to be brought sufficiently close to each other such that they interact optically and function as a composite fiber directional coupler. In the fused fiber coupler technology, where two or more fibers are fused and tapered together, the coupling substantially takes place through interaction between the cladding modes [8, 13, 14, 15]. In a fused tapered coupler the guided modal field gradually spreads more and more into the cladding with decreasing size of the core, eventually taking up the shape of a waveguide with original cladding as the core surrounded by air as the cladding. Naturally this waveguide will be characterized by relatively large ∆n and hence, the waveguide in this region will effectively function as a multimode guide with its modes corresponding to cladding modes of the fiber. The distribution of launched power between the two output ports is dictated by coupling /
zκ
PT
PC

Chapter 2
31
beating between the modes of multimode guide. This form of coupling is known as cladding mode coupling [16]. In the literature, coupling in Fused Biconical Taper (FBT) couplers is usually categorized on the basis of either strong fusion or weak fusion [13, 17, 18]. For a strongly fused coupler, the waist region can be approximated by a rectangular cladding-air waveguide, and the approximate analytical expression for the coupling coefficient is given by [8]
22
211
132
3
+
Χ
≈
V
naπλκ
(2.13)
where a is the core radius, n2 is the cladding refractive index , λ is the wavelength and V is the V-parameter. For the weakly fused coupler, the waist region can be approximated by two touching cylinders in which case the coupling coefficient is approximately given by [19, 13]
2
25
2
212
322
21
)4048.2()(2Χ
−≈
Van
nn
πκ (2.14)
where n3 is the refractive index of the surrounding, which in most case is air.
For a coupler consisting of two parallel uniform axially invariant waveguides the coupling coefficient κ is a constant (depending on properties of the waveguide material, their core separation and operating wavelength) throughout the coupler length. In that case, the power transfer is a sin2 function of the product of coupling coefficient and interaction length, L.κφ = . Unlike parallel waveguide coupler, in an axially varying coupler structure (which is the case of FBT coupler), the transverse dimensions of the interacting fibers vary along the length, and therefore, the coupling coefficient also varies with z, i.e. it becomes κ(z). The functional dependence of κ(z) is determined by the longitudinal shape of the taper and by the dimension and refractive index profile of the coupler cross-section. Thus, the resultant coupling and the distribution of power between the output ports of a coupler depend on the effective length of interaction L and the effective coupling coefficient, κ. The coupled and throughput powers are expressed as [20].
θ2cos=TP (2.15)

Fused Coupler Technology
32
θ2sin=TP (2.16)
where ∫=L
dzz)(κθ (2.17)
2.3 Light Propagation through Tapered Fiber
The transmission through a single mode fiber is due to the fundamental core mode where the V-number is less than the cutoff V-value of the next higher order mode. While propagating down the taper, the wave encounters a gradually diminishing core and hence a gradually reducing local V-number [21]. This results in a progressive change in the field distribution of the local fundamental mode along the taper. The mode spreads into the cladding with decreasing V. For any given wavelength and core-cladding refractive index profile, there is a core diameter at which the light signal has effectively escaped from the core and is guided by the interface between the cladding and the external medium [22, 23]. This point is called the taper transition. Beyond the taper transition, the fiber is capable of supporting more than one mode since (i) the diameter of the cladding, which now forms the core, is much larger than the untapered core radius and (ii) the corresponding refractive index difference between the cladding and air is very large. These two effects lead to a large V-number and the structure becomes multimoded. The propagating light through such a structure can now be affected by external influences, which may perturb the evanescent field traveling outside the fiber. As the light propagates beyond the point of minimum cross section of the taper, it eventually encounters the up-taper, where the size of the core progressively increases. The light enters the up-tapers guided by the cladding air-boundary and the structure is still capable of supporting more than one mode. When the signal reaches the taper transition point (symmetrically located on the other side of the waist), then the light begins to be guided again by the core-cladding interface and hence the lowest order mode becomes the only propagating mode in the untapered region of the fiber. For a single mode tapered fiber with step profile, the core radius, )(0 za decreases along the z-axis and the ratio of the cladding radius, )(1 za to core radius, )(0 za remains constant.
)0()0()()( 0101 aazaza = (2.18)

Chapter 2
33
The local V value for this kind of taper is given by:
)0()()0()( 00 azaVzV = (2.19)
If the angle is sufficiently small to ensure negligible coupling between the fundamental and higher order modes, the taper is said to be adiabatic. In this case all the energy remains in the fundamental mode. If the taper angle is not small enough, the coupling energy loss is not negligible and the taper is non-adiabatic or lossy.
An infinite adiabatic taper with a parabolic profile defined at a length z from the input by:
)21()( 220
2 RnRn ∆−= (2.20)
where )/( 0arR = is the normalized radial distance. The local spot size of ω(z)
normalized to the initial radius )0(0a is given by:
[ ][ ] 2/100 )0()()0()0()0()( VzVaaz ωω = (2.21)
It increases linearly with increasing a(z) or decreasing taper ratio. In the case of non adiabatic tapers the spot size is determined by the total field. It results from the superposition of the mode fields over the core cladding cross section, fundamental mode and higher-order cladding modes. In the case of finite clad step profile non-adiabatic taper with linear taper shape, we have:
( )]/1)[0()( 00 Lzaza −= (2.22)
where L is the length of the taper. Consider a single mode fiber whose fundamental mode is excited. Fundamental mode power is coupled to the radiation field by any non-uniformity that alters the cylindrical symmetry. In the case of a finite clad fiber, the power is lost through coupling between the fundamental mode and cladding modes. The coupling length LC is defined in terms of the propagation constants, β1 of the fundamental mode and β2 of the cladding mode:
( )212 ββπ −=CL (2.23)
In the case of taper a length scale L’ is defined in terms of the angle Ω(z) between the tangent to the core cladding interface and fiber axis. If )(za is the local radius, we have:
'/)()(tan Lzaz =Ω (2.24)

Fused Coupler Technology
34
where L’ is the distance along the taper axis from the apex to the cone with half angle Ω(z). If the length scale L’ of the non-uniformity is longer than the wavelength of the electromagnetic field, losses or scattering are observed, because the length scale of the field is small enough to detect the non-uniformity. If nnn ≅≅ 21 (weakly guiding approximation), losses are significant when (λ/n < L’). Significant loss will occur if the length scale of the non-uniformity (taper) is bounded approximately by:
( ) CLLn << 'λ (2.25)
Thus for an adiabatic taper, we have )()(tan zz Ω≅Ω and Equation 2.23 indicates that if L’>LC we have low or equivalent loss if:
πββ 2/)()( 21 −<Ω az (2.26)
The taper angle must be sufficiently small and must satisfy the Equation 2.26 at each position along the taper. For a sufficiently slow taper, the wavefronts remain nearly practically plane. For a gradual taper, which can support multimode propagation at the enlarged portion, the conversion of the fundamental mode into higher order or radiation modes must be negligible.
2.4 Light Propagation in Fused Coupler
Figure 2.3 The basic structure of a fused biconical tapered (FBT) Coupler
In a FBT coupler, which consists of two laterally touching or coalesced tapered fibers as shown in Figure 2.3. The LP01 mode of the input fiber transforms into a cladding mode while traveling along the down-taper transition [24]. In the tapered waist, the

Chapter 2
35
light guidance is provided by the large ∆n between the cladding and air-interface. The original high-index cores play negligible role in the waveguidance. In the up-taper region while exiting the coupler waist, the mode is still guided by the air-cladding interface via the local modes of the multi-mode structure. These modes eventually, overlap with the natural LP01 modes of the output fibers. But since the composite structure has a low taper inclination, i.e the individual tapers being adiabatic [25], only two lowest order super modes (even and odd) are excited in this multimode region. Excitation of higher order cladding modes is negligible. One indicator of this is exemplified by the fact that the excess loss in the FBT couplers is typically less than 0.1 dB [26, 27].
0
10
20
30
40
50
60
70
80
90
100
2 2.25 2.5 2.75 3 3.25 3.5 3.75 4 4.25 4.5 4.75 5Pull Length
Cou
plin
g R
atio
Figure 2.4: Power variation in the coupled port of a coupler with pull length during the fabrication process at a monitoring wavelength of 1550 nm.
The power in each of these supermodes experience a relative phase difference with propagation, the accumulated effect of this leads to the coupling and transfer of power between the fibers. This power-transfer takes place as a consequence of interference between the local modal fields. The light switches back and forth between the two constituent fibers with increase in interaction length as given in Figure 2.4, which shows corresponding experimentally recorded coupled power at 1550 nm, with increase in pull length during the fabrication of a symmetric 1x2 coupler.

Fused Coupler Technology
36
2.5 Fabrication of Fused Coupler
Flame fusion technique has been employed for the fabrication of FBT couplers. This section describes our in-house designed, automated fabrication setup for realizing FBT couplers. The fused coupler station has axially moving mechanical stages that move over precision slides, driven by stepper motors. During the fusion process the power coupling behavior is online monitored by injecting power to the input fiber and monitoring the power at each outputs simultaneously. The process is stopped at that point where we get an equal coupling ratio over the required wavelength range. The electronic control circuitry is interfaced with PC for real time monitoring of status and instantaneous display. For the fabrication of FBT couplers, a small section of an appropriately twisted pair of bare single mode fibers is fused laterally with a suitably designed high-temperature flame as sketched in Figure 2.5 [28]. The fiber-pair is simultaneously pulled at a slow pace along their length to form a uniform, smooth and slow taper, which is referred in the literature as a biconical, tapered structure. The fabrication process is implemented in two steps, fusion and elongation. The optical power of the monitoring signal, exiting from the two output fiber ports, is constantly recorded in real-time, throughout the process of fabrication. The status so provided is used to predict the time to stop and withdraw the flame from underneath the fibers in order to achieve a target coupling ratio. For a given pair of single-mode fibers, some of the important parameters for fusion and tapering are the pulling speed, flame temperature and flame brush width. These parameters dictate the performance of the fabricated couplers in terms of their optical characteristics.
Figure 2.5: Fabrication of fused coupler: the basic fuse-pull-taper method
2.5.1 Automated Fabrication Set-up
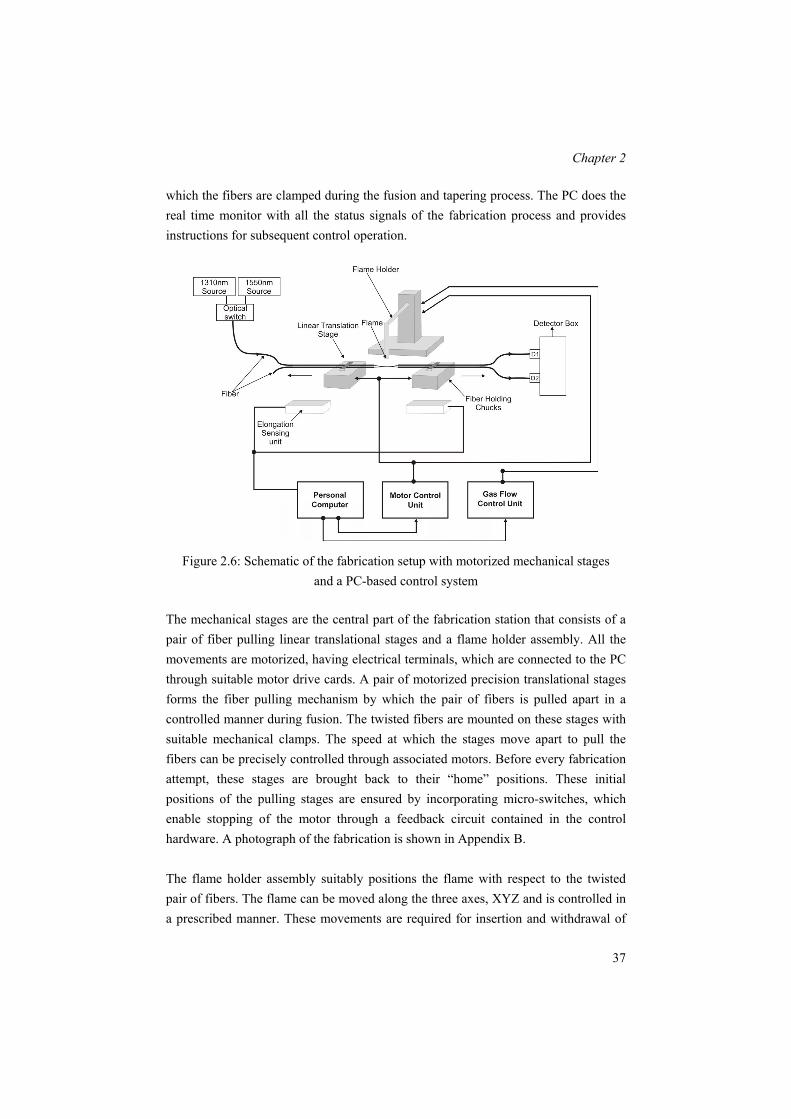
Figure 2.6 shows the schematic of the fabrication station showing the electronic control and the mechanical stages. In the system, the fusion and elongation processes were carried out by computer control of the flame and the motors of the mechanical stages. The motor control cards (MCC) drive the motorized translational stages on
Chapter 2
37
which the fibers are clamped during the fusion and tapering process. The PC does the real time monitor with all the status signals of the fabrication process and provides instructions for subsequent control operation.
Figure 2.6: Schematic of the fabrication setup with motorized mechanical stages and a PC-based control system
The mechanical stages are the central part of the fabrication station that consists of a pair of fiber pulling linear translational stages and a flame holder assembly. All the movements are motorized, having electrical terminals, which are connected to the PC through suitable motor drive cards. A pair of motorized precision translational stages forms the fiber pulling mechanism by which the pair of fibers is pulled apart in a controlled manner during fusion. The twisted fibers are mounted on these stages with suitable mechanical clamps. The speed at which the stages move apart to pull the fibers can be precisely controlled through associated motors. Before every fabrication attempt, these stages are brought back to their “home” positions. These initial positions of the pulling stages are ensured by incorporating micro-switches, which enable stopping of the motor through a feedback circuit contained in the control hardware. A photograph of the fabrication is shown in Appendix B. The flame holder assembly suitably positions the flame with respect to the twisted pair of fibers. The flame can be moved along the three axes, XYZ and is controlled in a prescribed manner. These movements are required for insertion and withdrawal of

Fused Coupler Technology
38
the flame, to adjust the vertical position of the flame, and to provide flame-brush needed for a uniform distribution of heat over a selected length of fibers. The motorized movement employed for the insertion and withdrawal of the flame holder brings the flame underneath the fiber-pair at beginning of fabrication, the movement is also used to withdraw the flame at the end of the fabrication process. The two extreme positions of this movement are also kept fixed by a pair of micro-switches that ensures correct positioning of the flame with regard to the fiber pair. To realize the flame brush, which is required to uniformly heat a selected portion of the fibers, the flame holder is set into oscillation in a direction parallel to the length of the fibers. The flame brush also controls the taper profile [23, 29]. The heat source use either hydrogen or deuterium gas and the gas flow is regulated to the required level using a gas flow control card. The flame has a width of 6mm and is placed approximately 1cm away from the fiber. The temperature and the spatial extend of the flame together determine the shape of the taper in an FBT coupler and the required flame is coarsely identified by its typical fountain-type shape. Control the gas flow rates help to achieve the same flame condition. The automation of the fabrication process has been achieved by an integrated real time monitoring system consisting of data acquisition card (DAC), processing, control and display module. PC acquires information regarding fabrication status with regard to target values from photo detector module and accordingly it controls the mechanical stages through motor drive unit. A pair of identical photodiodes followed by the respective signal amplifiers and DAC captures the power level exiting from the fiber output ports. The input data about the status of fabrication (i.e. coupling ratio and positions of the translational stages) are fed to the PC. The position limiting micro-switches for the various translational movements also generate different trigger signals. PC provides digital signals to activate the motors through respective current boost drive circuits. A set of three motors is activated for the movements of the flame holder in three mutually perpendicular directions for appropriate positioning of the flame with respect to fiber fusion zone. Another motor simultaneously controls the pulling stage for stretching the pair of fibers, with appropriate control of tension, during fusion and elongation. In the fabrication process employing a real-time monitoring system, light is injected into one of the input ports and the light exiting at the two fiber output ports are measured. A loop of about 1 cm radius is introduced in the lay of the input fiber, which eliminates leaky and cladding modes that might have been excited during the

Chapter 2
39
launching of light at the fiber input end. Before starting of the fabrication process, the total power exiting the input fiber appears at the transmitted port and is recorded (say, Pi). Once the fabrication gets over, the optical powers that appear at all the output ports are then recorded (say PT, PC for a 1x2 coupler). With no power fluctuation in the source output, the measured values of these three quantities are used to estimate the splitting ratio and the excess loss of the fabricated component. The coupling ratio is online monitored at two different wavelengths, to make sure that we get a equal coupling ratio over a wavelength range. For online monitoring at multiple wavelengths, light from two different sources (normally at 1310 nm and 1550 nm) at appropriate wavelengths are launched into the fiber through a 2x1 optical switch. By default, the monitoring will be at higher wavelength. After starting the fusion and elongation process, when the coupling ratio reaches at certain value, the optical switch is activated to select between the two wavelengths. The coupling ratio at two wavelengths is estimated in real time. For a wavelength insensitive coupler, the fusion process is stopped when the coupling ratio at both the wavelengths reaches the target value. For on-line measurements the data corresponding to power appearing at all the output ports are recorded as a function of time and pulling length. The pulling length is calibrated in terms of the elapsed time and the speed of the translation motor. The real-time plot of power variation at the output ports versus time and pulling length obtained by this data, called pulling signature, is the most important fabrication parameter of a coupler [30, 19]. The pulling signature is used for analyzing coupling characteristics of the fabricated couplers and it provides the necessary feedback to the technology to tailor/modify the characteristics of a coupler. The PC control program requires several initial inputs for the various target specifications (e.g.: coupling ratio) and process parameters (motor speeds, delay between activation and deactivation among different motors, etc). Once the process of fabrication is set to begin, the PC is updated with instantaneous fabrication status. This provides an excellent continuity of status information to the control program of the PC interface station back with the appropriate instantaneous data for motor controls. The monitor shows a real-time plot of power variations with the calibrated pulling length and displays all the instantaneous details of the status of fabrication process. In the PC-controlled fabrication, when the control system is switched on, which restores the flame-holder assembly and the pulling stages to their respective original positions. Control is achieved by recording the instantaneous coupling ratio
Fused Coupler Technology
40
of the device in a feedback loop to regulate the speed of dc motors. Through an on-line monitoring of output powers from output ports, splitting ratio was computed instantaneously compared with the pre-set value. The difference between the two values is translated into an electrical signal in a feedback loop to control the different motor drives, and the whole fabrication is automated.
2.5.2 Process Flow
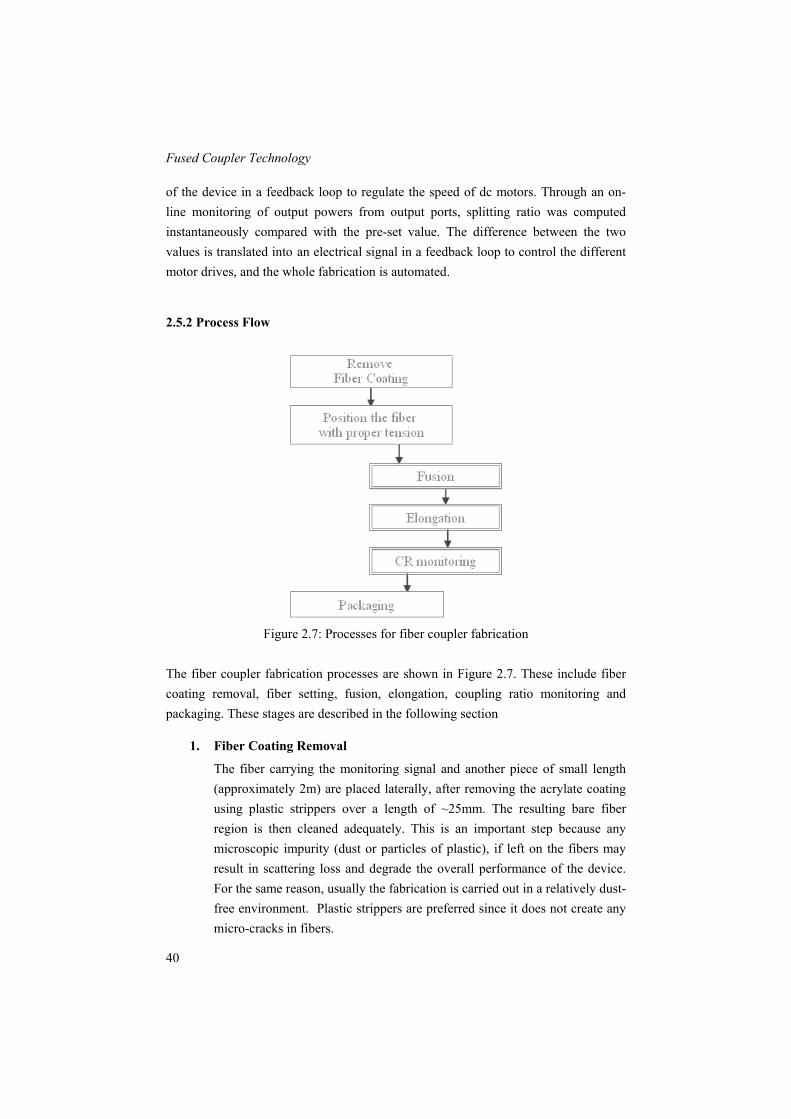
Figure 2.7: Processes for fiber coupler fabrication
The fiber coupler fabrication processes are shown in Figure 2.7. These include fiber coating removal, fiber setting, fusion, elongation, coupling ratio monitoring and packaging. These stages are described in the following section
1. Fiber Coating Removal
The fiber carrying the monitoring signal and another piece of small length (approximately 2m) are placed laterally, after removing the acrylate coating using plastic strippers over a length of ~25mm. The resulting bare fiber region is then cleaned adequately. This is an important step because any microscopic impurity (dust or particles of plastic), if left on the fibers may result in scattering loss and degrade the overall performance of the device. For the same reason, usually the fabrication is carried out in a relatively dust-free environment. Plastic strippers are preferred since it does not create any micro-cracks in fibers.

Chapter 2
41
2. Positioning fiber on the chucks
The pair of fibers are then twisted in order to make a close contact along the longitudinal direction over the bare stripped region and clamped at the two ends on the translational pulling stages with an appropriate tension. The twisting of the fibers should be localized and symmetric about the center of the stripped fiber lengths.
3. Fusion and pulling with online monitoring
Once the fibers are appropriately positioned, the light from the laser diode is switched on and the two fiber output ports are coupled to the photo detector unit. The system then reads the throughput and the coupled power and displays the same on the PC monitor in real-time. At this stage, the level of maximum power to be used as the monitoring signal may be adjusted appropriately. The value is recorded by the system as the total input power, Pi and is used to calculate the excess loss of the fabricated device for on-line measurements. When the suitable level of the power at the through put port is recorded, the fabrication is started by pressing the start button. With this all the motors are sequentially activated – the flame holder is positioned underneath the bare twisted fiber-pair. A small tension is applied to the fibers through slow elongation to avoid any sagging of the softened fiber material due to gravity, which may lead to large loss of the fabricated couplers. Fusion and elongation results in the coupling of power, initially at a slower rate and eventually with a rapid exchange of power between the fibers. This can be easily observed in the status display of the PC monitor, which depicts on-line plots of the measured power at the two-fiber output ports with length of elongation. The coupling begins typically after about 6-7 minutes from the start of fabrication. At this point of time the PC program starts automatically recording of the data corresponding to the power-coupling. The PC-program constantly compares the instantaneous fabrication status with the pre-programmed parameters. When these two sets of data are identical or nearly identical, the control program generates a trigger signal to remove the flame-holder from underneath the fiber-pair, and the pulling motor is also simultaneously switched off. Once the fabrication is over, the device is then suitably packaged. During packaging, the monitor displays the instantaneous
Fused Coupler Technology
42
splitting ratio, excess loss, insertion loss and absolute powers in the throughput and coupled ports.
4. Packaging
Packaging of the fabricated FBT couplers is an important step as the device can get easily damaged. Details of packaging of fused coupler devices have been discussed in detail in Chapter 7. The present method, takes about 10-15 minutes time to yield a completely packaged coupler.
2.5.3 Control Parameters
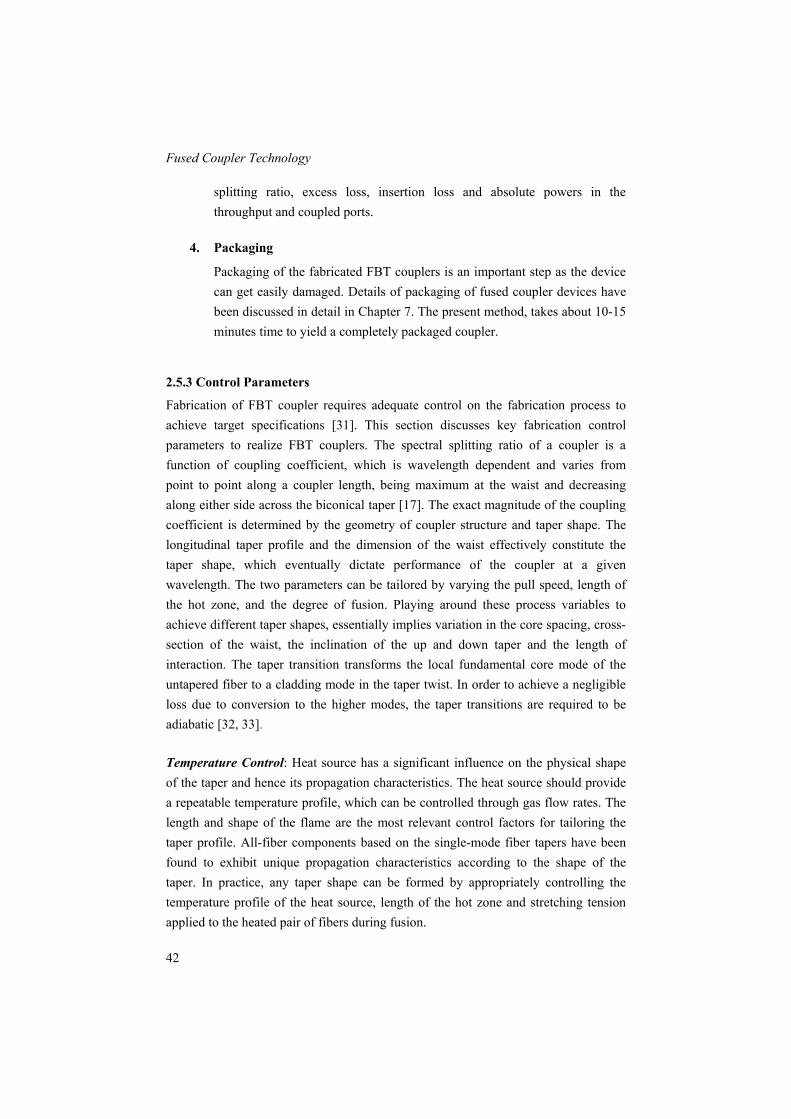
Fabrication of FBT coupler requires adequate control on the fabrication process to achieve target specifications [31]. This section discusses key fabrication control parameters to realize FBT couplers. The spectral splitting ratio of a coupler is a function of coupling coefficient, which is wavelength dependent and varies from point to point along a coupler length, being maximum at the waist and decreasing along either side across the biconical taper [17]. The exact magnitude of the coupling coefficient is determined by the geometry of coupler structure and taper shape. The longitudinal taper profile and the dimension of the waist effectively constitute the taper shape, which eventually dictate performance of the coupler at a given wavelength. The two parameters can be tailored by varying the pull speed, length of the hot zone, and the degree of fusion. Playing around these process variables to achieve different taper shapes, essentially implies variation in the core spacing, cross-section of the waist, the inclination of the up and down taper and the length of interaction. The taper transition transforms the local fundamental core mode of the untapered fiber to a cladding mode in the taper twist. In order to achieve a negligible loss due to conversion to the higher modes, the taper transitions are required to be adiabatic [32, 33]. Temperature Control: Heat source has a significant influence on the physical shape of the taper and hence its propagation characteristics. The heat source should provide a repeatable temperature profile, which can be controlled through gas flow rates. The length and shape of the flame are the most relevant control factors for tailoring the taper profile. All-fiber components based on the single-mode fiber tapers have been found to exhibit unique propagation characteristics according to the shape of the taper. In practice, any taper shape can be formed by appropriately controlling the temperature profile of the heat source, length of the hot zone and stretching tension applied to the heated pair of fibers during fusion.
Chapter 2
43
Flame Brush width: The longitudinal profile of the taper is usually controlled by varying the length of hot zone during the elongation process. The length of the heated portion of the fibers can be varied by changing the oscillation of the flame during the flame brush. In the flame brush, a traversing flame heats a section of the fiber at a given time. The burner is made to travel across a fiber-length with a certain speed in a repeatable to-and-fro fashion. During each cycle of motion, the flame heats infinitesimally small element along the length of the fiber [34]. If the length over which the fiber is heated remains fixed with time, the resulting taper profile assumes an exponential shape. The condition of the fixed length of the hot zone can be achieved either by stationary flame or a traveling burner having constant brush length. Thus as the fibers are elongated, their diameters reduce across the heated section and the material is redistributed in the form of a taper. Since the length of the hot zone is the same, the volume of the softened silica is reduced due to tapering. This leads to an exponential taper of the form [23].
zz
erzr ∆= 0)( (2.27)
where r (z) is the radius of the taper cross-section at any z, ∆z is the flame width and r0 is the radius of the coupler waist. If h is the length of the flame brush, length of the hot zone becomes h+∆z. Thus by varying the length of the flame-brush, it is possible to vary the length of the taper waist.
Pull Speed: The degree of fusion can be controlled by varying the temperature of the flame and the speed of the fiber elongation. The elongation speed, which induces tension in the two fibers, is adjusted by changing the drive power of the motors attached to the translational pulling stages. Minimum tension is required to be introduced during the fusion stage that should be sufficient to avoid any sagging of the softened pair of fibers due to gravity. By manipulating the temperature of the fibers, varying the fiber’s location relative to the flame, the time of fusion phase, and the speed of elongation almost any degree of fusion can be achieved in practice. Degree of fusion together with the length of elongation determines the shape of the cross section. The strength of coupling has a strong functional dependence on the center-to center separation between the constituent fibers and the resulting overall dimension of the coupler’s waist cross section. The degree of fusion, f provides an analytical

Fused Coupler Technology
44
expression, which to a good approximation quantifies these two parameters through a relation [35].
( ) 2212 −−= fbd (2.28)
where 2b is the diameter of the untapered fiber. The degree of fusion, f that satisfies the condition 0 ≤ f ≤1 where f=0 corresponds to the case of “isolated” fiber and f=1 refers to the shape where two fibers have been fully fused to form a circular cross section. For a given degree of fusion and for a given longitudinal profile, any required dimension of coupler cross section at the waist can be achieved by adjusting the pulled length of the coupler. The cross section of the waist, in practice is controlled through manipulation of taper profile by varying the flame brush width during coupler fabrication. For the same pulled length, a long flame brush width yields a relatively wide waist cross-section as compared to a short flame brush width. Narrow waist cross section with smaller length coupler results in a steep taper transition profile and of relatively higher loss usually [17]. In the PC-controlled fabrication system, pulled length is always decided by the preprogrammed splitting ratio. However the pulled length may be different for different degrees of fusion or different lengths of flame-brush, for a given coupler waist size.
2.6 Characterization of FBT Couplers
Passive optical splitters are required to conform to certain international standards set by Telcordia Technologies (formerly Bellcore) to qualify for its application. Also it is important that adequate characterization of the fabricated couplers is critical, for providing the necessary feedback to the fabrication process. The excess loss and spectral distribution of light in coupler are the two major features that decide the quality of a coupler-based device [33].
2.6.1 Performance Parameters of Couplers
The performance of the coupler components is quantified in terms of some important characteristic parameters [11]. The two most important characteristics of any generic coupler –based branching component are the splitting ratio and the excess loss.

Chapter 2
45
Splitting ratio
Splitting ratio or coupling ratio is a measure of the distribution of power at the output ports of a coupler at a given wavelength of operation. Splitting ratio is defined as the ratio of power appearing a given output ports [11, 36]. The coupling ratio at the coupled port is defined as
Coupling ratio (CR in %) = %100×
+ CT
C
PPP (2.28)
Similarly the coupling ratio in the through put port is,
Coupling ratio (CR in %) = %100×
+ CT
T
PPP (2.29)
Splitting ratio describes how the input light to the coupler is split between the two output ports. CR% can vary from 0 to 100%. It is always quoted for a given wavelength. Naturally, it may be different at different wavelengths. It originates from the wavelength dependence of the coupling coefficient, κ.
Excess Loss
The excess loss of a coupler component is a measure of the fraction of the input power, which is not available at the output ports. This is usually expressed in dB. For an input power, Pi and output powers, PC and PT at the coupled and throughput ports respectively, the excess loss is expressed as
Excess Loss (EL) =
+−
I
CT
PPPlog10 (2.30)
For a device with n output ports,
−= ∑
=
n
j i
j
PP
EL1
log10 (2.31)
The important figure of merit used to represent the overall efficiency of a coupler. It accounts for energy lost to the surroundings mainly through scattering [37]. EL in a good quality coupler is typically less than 0.1 dB.

Fused Coupler Technology
46
Insertion Loss
The insertion loss of a device is the total throughput power loss suffered by the input light while propagating through the component along a particular path. Its is defined to be the ratio of the available power at a given output port to the launched power [11, 36]:
−=
I
C
PP
IL log10 (2.32)
IL represents the total loss suffered by light in propagating from any specific input port through the coupler to the output port. It is the sum of the excess loss and the coupling ratio (expressed in dB) along a specific light path. Thus the IL of a 3 dB coupler would be more than 3 dB. IL is the key parameter of importance to a fiber optic system designer and it is expensively used while calculating power budget in link designs.
Directivity
Directivity of a coupler is a measure of the power reflected from the device. It describes how well the coupler transmits light to the output port(s) and quantifies the amount of light reflection inside the device. Expressed in dB, it is defined as the ratio of the power returned to any other input port to the injected input power [11, 36, 38].
−=
I
R
PP
Dir log10 (2.33)
For measurement of directivity, in actual practice, all the output ports are kept immersed in an index matching liquid. This procedure ensures that Fresnels reflections (due to index mismatch between the fiber terminals and air) do not contribute to the measured back reflected power. Directivity is also termed as near-end-isolation in literature.
2.6.2 Measurement of Coupler Characteristics
The measurement is essential to quantify the ultimate assured performance of the fabricated component after it is packaged. This is necessitated by the fact that during packaging, the adhesive (optical cement), which is used for fixing the coupler with the quartz substrate often introduces a small stretching tension during the course of its

Chapter 2
47
curing. This often results in minute alteration of the characteristic optical parameters like splitting ratio and wavelength response. The splitting ratio and the excess loss (as defined above) are measured both during and after fabrication [39]. In addition to measuring EL, CR, IL and Directivity, the characterization includes measurement of the wavelength response of all the components in general, and the wavelength isolation, in particular for WDM components. Figure 2.8 depicts a schematic of the measurement set up for coupling ratio, IL and polarization dependent loss. Light from a stack of sources is connected to an Nx1 optical switch, which in turn is connected to a polarization controller. The multiple wavelengths can be so selected that the wavelengths are evenly spaced in the required spectral range. The output of the polarization controller is spliced to the coupler under test. The output leads of the coupler are connected to the two channel detector using bare fiber adaptors. The InGaAs detectors are in turn connected to a PC through a DAC card.
Figure 2.8: Schematic of the coupler measurement setup with a multiple laser sources. For measuring the wavelength response of a coupler, light from broadband light source is launched to the input fiber and the output is connected to an Optical Spectrum Analyzer (OSA). The broadband white light sources used are either a tungsten halogen lamp or a multiple LED based source. The data from the measurement using multiple laser sources can also used to estimate the spectral response of the device, using curve fitting methods. For measurement of power exiting from the directivity port, which is usually carried out at the end of the

Fused Coupler Technology
48
measurement cycle, the two output ports are immersed in an index matching liquid to avoid contribution to the measured power from Fresnel reflections. The optical return loss, which arises due to the back reflection to the same port, is measured using back reflection meter. In these devices, light is launched to the fiber and taken back to the photodetectors using optical circulators. Temperature Dependent Loss (TDL) is another important parameter, which shows the variation in insertion loss of a coupler, when the temperature of the coupler is varied between the maximum and minimum values of the operating temperature conditions. The temperature of the device is varied with a suitable ramp and the insertion loss is online monitored. The typical value of the temperature dependent loss is 0.2 dB.
2.6.3 Pull Signature
The real-time monitoring system records the instantaneous coupler output power, during the fabrication of couplers, and calculates the splitting ratio and excess loss of the coupler. The recorded data on output power with pull length constitutes the pull signature. Figure 2.9 shows the power variation at the coupled port of a coupler as a function of the pulled length at the monitoring wavelength of 1310 nm and 1550 nm. This clearly indicates that the rate of change of splitting ratio becomes faster with increase in the pull length (i.e., with decrease in size of the coupler waist). Compared with the case of elongation at 1310 nm, rate of change of power variation becomes still faster at higher wavelengths. Here the fiber used in the fabrication of couplers for the operation at 1310 nm and 1550 nm wavelength was SMF-28 from Corning USA (having a cut-off wavelength at 1270 nm). The coupling behavior of a fused single mode coupler is a function of the interaction length and the operating wavelength. This fact has been readily exploited to modify the characteristics of an FBT coupler by tailoring the design parameters for realizing various application specific devices. Such a design process requires a thorough understanding of the wavelength dependence of the splitting ratio and its optimization by controlling the factors that influence it. The rate of change of spectral splitting ratio ie, how fast or slow the power transfer varies with wavelength determines the wavelength period of power-transfer oscillations. This is solely a characteristic property of the coupler structure and can be mapped to targeted requirement by controlling the shape of the taper during fabrication. A knowledge of the pulling signature (ie, coupling characteristics at the monitoring wavelength) for a given set of fabrication variables provides the necessary feedback for controlling the taper shape resulting in the desired wavelength periodicity [40]. The pulling signature obtained

Chapter 2
49
from the real-time measurement leads to an estimate of the pulled length, required to fabricate a component of desired splitting ratio, this also establishes the nature of coupling during the fabrication process. Control and optimization of spectral splitting ratio of a fused coupler can yield a number of in-line components such as beam-splitter, wavelength division mux, wavelength flattened coupler, etc.
0
10
20
30
40
50
60
70
80
90
100
2 2.25 2.5 2.75 3 3.25 3.5 3.75 4 4.25 4.5 4.75 5
Pull Length (mm)
Cou
plin
g R
atio
Coupling Ratio-1550nmCoupling Ratio-1310nm
Figure 2.9: Variation in optical power with pulled length for fused biconical taper couplers at 1310 nm and 1550 nm
2.6.4 Wavelength Response of Couplers
A symmetric coupler is one in which the constituent fibers are identical, so as to achieve a 100% power transfer. A very common device required for a number of different systems is one that splits the light equally between the two output ports, a 3dB splitter. This equal splitting will occur at a point B for a wavelength of 1310 nm. Figure 2.10 shows the wavelength response of a typical 3-dB coupler at 1310 nm, measured using the setup described in section 2.6.2. It is evident that this coupler would function as a 3 dB splitter at the 1310 nm wavelength but the coupling ratio at 1550 nm is around 85%. Thus a device made in this way would make a good splitter at 1310 nm but not at 1550 nm.
A B
C E
D
F

Fused Coupler Technology
50
0
20
40
60
80
100
1200 1250 1300 1350 1400 1450 1500 1550 1600
Wavelength (nm)
Cou
plin
g R
atio
%
Fig 2.10: Wavelength dependence of coupling ratio of a 3 dB coupler at 1310 nm The variation in coupling ratio with wavelength can be reduced, significantly in a single wavelength region, by stopping the pulling process at a point like C in Figure 2.9. The peak coupling ratio can be lowered for asymmetric couplers. Such couplers can be fabricated by forming a fused tapered coupling region between two fibers of slightly different propagation constants. This difference in propagation constant can be realized by using fiber of different diameter or profile, or by tapering one of the two identical fibers, more than the other [41].
2.7 Wavelength Insensitive Coupler
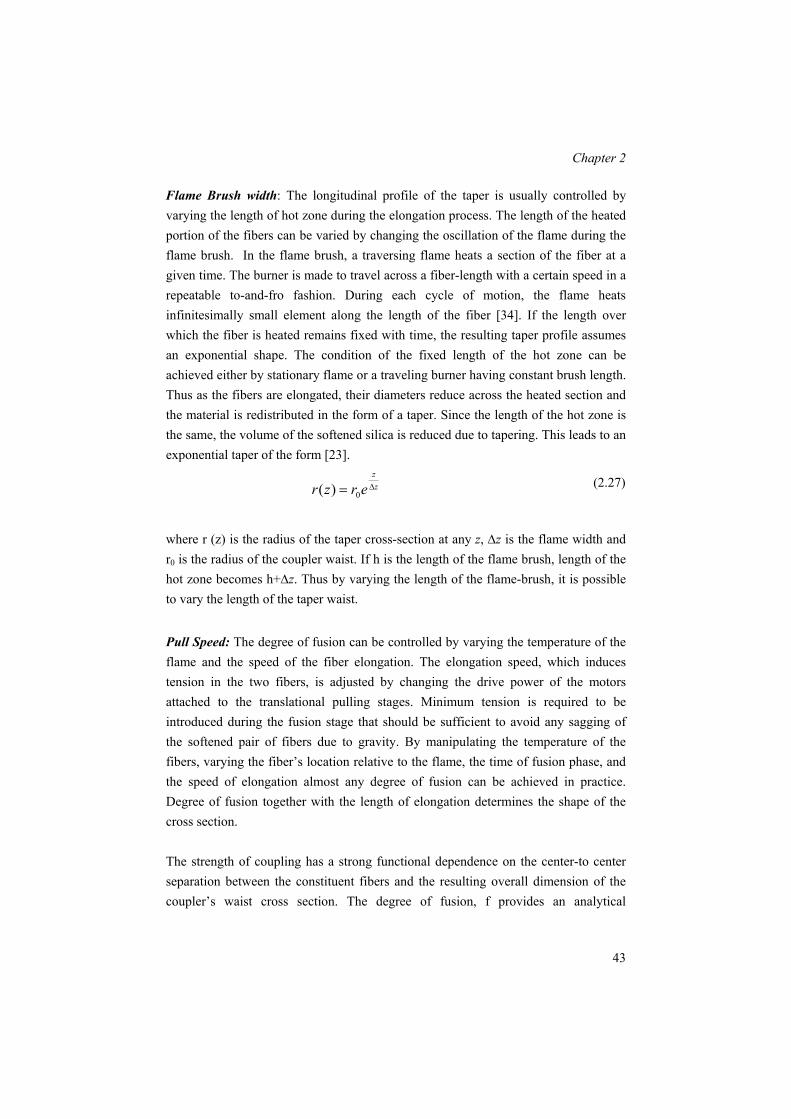
The wavelength dependence of coupling ratio can be reduced over the entire band from 1310 nm to 1550 nm by stopping the process at the point indicated by point D in Figure 2.9., where the two wavelengths have the same coupling ratio. The intersection point can be lowered to 50%, with two non-identical fibers, to realize a wavelength independent 3dB coupler. The devices reported here were made by pre-tapering one fiber. The pre-tapered fiber is twisted with a non-tapered fiber of constant diameter 125 µm, and the pairs heated and pulled in a similar manner of standard fused couplers. The coupling process was monitored throughout the pulling operation by launching 1310 nm and 1550 nm light into the input port and by measuring the power at these wavelengths in both output ports. The pull signature of the device when the pre-tapered fiber has a diameter of 122 µm is shown in Figure 2.11. The fibers were pulled beyond the normal stopping point to demonstrate the coupling behaviour in this region. As expected, the difference in propagation constants leads to incomplete power transfer between the fibers. The crossover point has now shifted to a coupling ratio of 50%.
Chapter 2
51
0
20
40
60
80
100
2 2.3 2.6 2.9 3.2 3.5 3.8 4.1 4.4 4.7 5
Pull Length (mm)
Cou
plin
g R
atio
(%)
Coupling Ratio-1310nmCoupling Ratio-1550nm
Figure 2.11: Pull signature of a wavelength insensitive 3dB coupler
0
1
2
3
4
5
6
7
1230 1280 1330 1380 1430 1480 1530 1580 1630Wavelength (nm)
Inse
rtion
Los
s (d
B)
Output-1Output-2
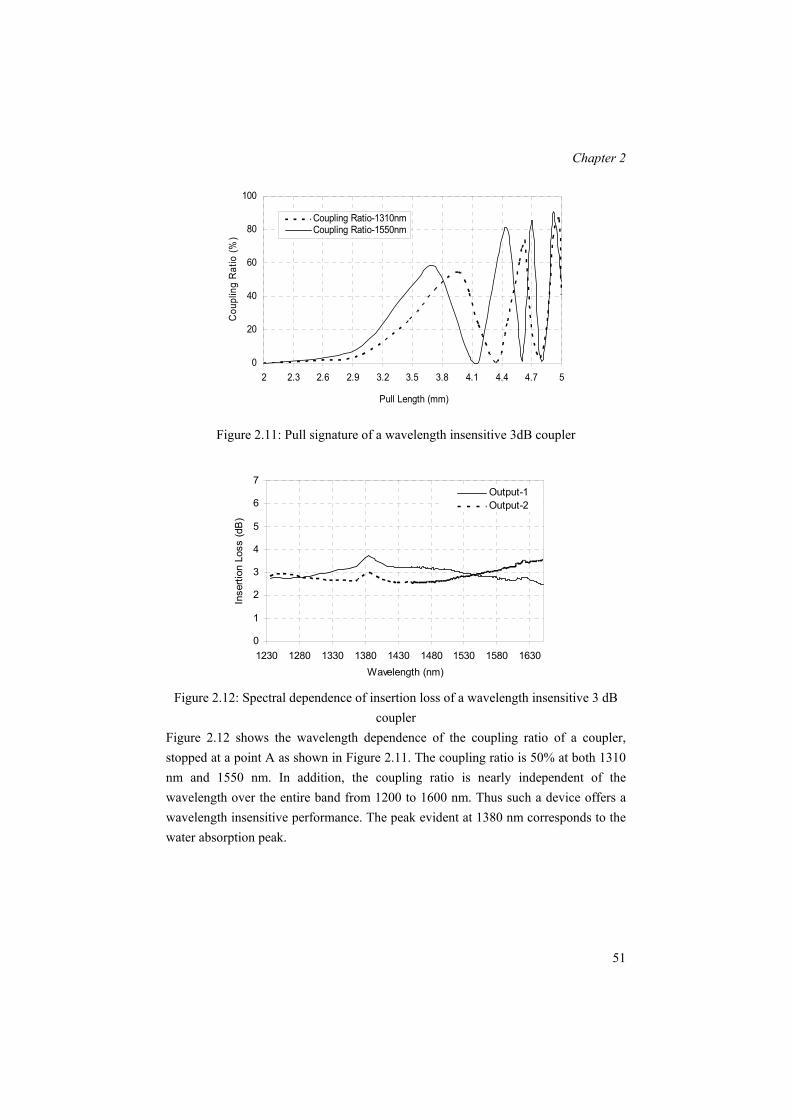
Figure 2.12: Spectral dependence of insertion loss of a wavelength insensitive 3 dB
coupler Figure 2.12 shows the wavelength dependence of the coupling ratio of a coupler, stopped at a point A as shown in Figure 2.11. The coupling ratio is 50% at both 1310 nm and 1550 nm. In addition, the coupling ratio is nearly independent of the wavelength over the entire band from 1200 to 1600 nm. Thus such a device offers a wavelength insensitive performance. The peak evident at 1380 nm corresponds to the water absorption peak.

Fused Coupler Technology
52
2.8 Conclusions
The FBT coupler technology has been employed to realize important all-fiber branching components. The design of these components relies on the control of the process variables in the automated fabrication system. It has been possible to arrive at a set of suitable processes parameters in order to get a desired spectral response and excess loss with reasonable repeatability.
References 1. K. O. Hill, D. C. Johnson and R. G. Lamont, “Optical fiber directional couplers:
Biconical taper technology and device applications”, in Proc. SPIE – Fiber Optic Couplers, Connectors and Splice Technology II (San Diego, CA), Aug. 20-21, Vol. 574, pp.92-99, 1985.
2. C. M. Lawson, P. M. Kopera, T. Y. Hsu and V. J. Tekippe, “In-line single mode wavelength division multiplexer/demultiplexer”, Electron. Letters, Vol. 20, pp.963-964, 1984
3. K. O. Hill, D. C. Johnson, F. Bilodeau and S. Faucher, “Narrow-bandwidth optical waveguide transmission filters: A new design concept and applications to optical fiber communications”, Electron. Letters, Vol. 23, pp 465-466, 1987.
4. A. W. Snyder, “Polarizing beamsplitter from fused fiber couplers”, Electron. Letters, Vol. 21, pp. 623-625, 1985.
5. J. D. Minelly and C. D. Hussey, “Single-mode fiber Y-junction beam splitter”, Electron. Letters, Vol. 27, pp 1087-1088, 1987.
6. A. Ghatak and K. Thyagarajan, Optical Electronics, Cambridge University Press, Appendix.G, pp.609-612, 1991
7. A. Ghatak and K. Thygarajan, Optical Electronics, Cambridge University Press, Ch.14, pp.447, 1991.
8. F. P. Payne, C. D. Hussey and M. S. Yataki, “Modeling fused single-mode fiber couplers”, Electron. Letters, Vol.21, pp.461-463, 1985.
9. S. K. Sheem and T. G. Giallorenzi, “Single-mode fiber optical power divider: encapsulated etching technique, Optics Letters, Vol.4, pp.29-31, 1979.
10. S. K. Sheem, H. F. Taylor, R. P. Moeller and W. K. Burns, “Propagation characteristics of single-mode evanescent field couplers”, Applied Optics, Vol.20, pp.1056-1062, 1981.
11. A. Ghatak and K. Thyagarajan, Introduction to Fiber Optics, Cambridge University Press, Ch.17, pp.369, 1999
Chapter 2
53
12. A. W. Snyder and J. D. Love, Optical Waveguide Theory, Chapman and Hall, Ch.18, pp.387, 1983
13. F. P. Payne, C. D. Hussey and M. S. Yataki, “Polarisation Analysis of strongly fused and weakly fused tapered couplers”, Electron. Letters, Vol.21, pp.561-563, 1985.
14. A. W. Synder and X. H. Zheng, “Fused couplers of arbitrary cross section”, Electron. Letters, Vol.21, pp.1079 -1081, 1985.
15. F. P. Payne, “Fused single mode optical fiber couplers”, Journal for the Institution of Electronics and Telecommunications Engineers (India), Vol. 32, pp.319-324, 1986.
16. M. S. Yataki, “Fused taper single-mode fiber couplers”, Ph. D. Thesis, University of Southampton, Ch. 2, August 1988.
17. J. V. Wright, “Wavelength dependence of fused couplers”, Electron. Letters, Vol.22, pp. 320-321, 1986.
18. H. C. Chang, T. H. Lin, and T. L. Wu, “Accurate coupling coefficients for fiber couplers with weakly fused cross-sections” Applied Optics, Vol.34, p.6168-6172, 1995.
19. F. De Fornel, C. M. Ragdale and R.J. Mears, “Analysis of single-mode fused tapered couplers”, Journal of Optoelectronics, Vol.131, pp.221-227, 1984.
20. B. P. Pal (Ed), “Fundamentals of fiber optics in Telecommunications and Sensor systems”, Wiley Eastern Limited, New Delhi , Ch.25, pp.606, 1992,
21. A. C. Boucouvalas and G. Georgiou, “Tapering single mode optical fibers”, IEE Proceedings Pt. Journal, Vol.133, pp. 385-390, 1986.
22. S. E. Moore, W. F. Gasco and D. W. Stove, “Mass production of fused couples and couples based devices” SPIE proceedings, 574, Fiber Optic Couplers, Connectors and Splice Technology 2, pp.135 - 140, 1985.
23. W. K. Burns, M.Abebe, C. A. Villarruel and R. P. Moeller, “Loss mechanisms in single-mode fiber tapers”, Journal of Lightwave Technology, LT-4, pp.608 -612, 1986.
24. K. Okamoto, “Theoretical investigation of light coupling phenomena in wavelength flattened couplers”, Journal of Lightwave Technology, Vol.8, pp.678-683, 1990.
25. J. D. Love, “Spot size adiabaticity and diffraction in tapered fibers”, Electron. Letters, Vol.23, pp.993-995, 1987.
26. K. Okamoto, “Fundamentals of optical waveguides, Academic Press (San Diego, USA), Ch.8, pp.323, 2000.

Fused Coupler Technology
54
27. I. Yokahama, J. Node and K.Okamoto, “Fiber coupler fabrication with automatic fusion-elongation process for low excess loss and high coupling ratio accuracy”, IEEE Journal of Lightwave Technology, LT-5, pp.910-915, 1987.
28. B. S. Kawasaki, K. O. Hill, and R. G.Lamont, “Biconical-taper single-mode fiber coupler”, Optic Letters, Vol. 6, pp.327 -330, 1981.
29. R. P. Kenny, T. A. Birks, K. P. Oakley, “Control of optical fiber taper shape”, Electronic Letters, Vol. 27, pp. 1654 - 1655, 1991.
30. M. Eiesenmann and E. Weidel, “Single-mode fused biconical couplers for wavelength division multiplexing with channel spacing between 100 and 300 nm”, Journal of Lightwave Technology, Vol. 6, p. 113-115, 1988.
31. P. Roy Chaudhuri, “Technology and modeling of fused single-mode fiber coupler components”, PhD Thesis, Ch. 5, pp. 67-80, 2000.
32. W. J. Stewart and J. D. Love, “Design limitation on tapers and couplers in single mode fibers”, Proceedings of ECOC’ 85 (Venice), pp. 559-562, 1985.
33. J. D. Love and W. M. Henry, “Quantifying loss minimization in single-mode fiber tapers”, Electron. Letters, Vol. 22, pp. 912-914, 1986.
34. F. Bilodeau, K. O. Hill, S. Faucher and D. C. Johnson, “Low-loss highly over coupled fused couplers: fabrication and sensitivity to external pressure”, Journal of Lightwave Technology, Vol. 6, pp. 1476-1480, 1991.
35. S. Larcoix, F. Gonthier, J. Bures, “Modeling of symmetric 2x2 fused-fiber coupler”, Applied Physics, Vol. 33, pp. 8361 - 8364, 1994.
36. B. P. Pal, “Electromagnetics of all-fiber components”, in Electromagnetic fields in unconventional structures and materials by A. Lakhotia, and O. N. Singh (Eds.), John Wiley, New York, 2000.
37. A. K. Ghatak, B. Culshaw, V. Nagarajan and B. D. Khurana, “trends in fiber optics and Optical Communications”, Viva Books Pvt. Ltd. (New Delhi), Ch. 4, pp. 45,1995.
38. F. J. Liao and J. T. Boyd, “Single mode fiber coupler”, Applied Optics, Vol. 20, pp. 2731-2734,1981.
39. F. Bilodeau, K. O. Hill, D. C. Johnson and S. Faucher, “Compact, low-loss, fused biconical taper couplers: over coupled operation and antisymmetric supermode cutoff”, Optic Letters, Vol.12, pp. 634-635, 1987.
40. P. Roy Chaudhuri, B. P. Pal, and M. R. Shenoy, “Modeling fused 2x2 coupler components”, Proceedings of National Symposium of Advances in microwave and Lightwave, New Delhi, pp. 57-63, March 24-28, 2000.
41. D. B. Mortimore, “Wavelength flattened fused couplers”, Electronics Letters, Vol.21, pp. 742-743, 1985