
Chapter 2 Field Ion Microscopy · Chapter 2 Field Ion Microscopy Field ion microscopy, often...
21
Chapter 2 Field Ion Microscopy Field ion microscopy, often referred to as FIM, provides atomic-resolution imaging of the surface of a specimen. A rare gas, called the imaging-gas, is introduced in the vicinity of a positively charged sharp needle. The electric field at the apex of the specimen is of the order of 10 10 Vm –1 . Gas atoms are ionised very close to the tip surface and subsequently accelerated away by the intense electric field. The image that is formed by the impact of these gas ions onto a phosphor screen maps the distribution of the electric field at the surface, which is intrinsically related to the local topography of the tip [1, 2]. The specimen is maintained at an extremely low temperature (5–80 K) to optimise the spatial resolution, which is high enough to provide direct imaging of individual surface atoms. Further increasing the electric field at the surface of the tip induces the ionisation and desorption of atoms from the specimen itself via a process known as field evaporation. Successively removing layers of atoms from the surface of specimen enables the visualisation of the sub-surface structure of the specimen by using FIM. Several comprehensive reviews and textbooks have been compiled on the development and application of FIM in materials and surface sciences [3–8]. The aim of this chapter is to give a brief overview of the physical principles as well as a practical explanation of how it functions. 2.1 Principles FIM relies on the electric-field-induced ionisation of inert gas atoms in the vicinity of a charged surface. When a very sharp metallic needle is subjected to a high voltage of a few kilovolts, an intense electric field is generated at the surface. This electric field is generated by the positive charges present at the surface. Indeed, the application of the high voltage induces the free electrons to be, on average, displaced inwards by a small amount to screen the electric field, leaving partly charged atoms at the very surface. For a non-flat surface, protruding atoms are B. Gault et al., Atom Probe Microscopy, Springer Series in Materials Science 160, DOI 10.1007/978-1-4614-3436-8_2, # Springer Science+Business Media, LLC 2012 9
Transcript of Chapter 2 Field Ion Microscopy · Chapter 2 Field Ion Microscopy Field ion microscopy, often...

Chapter 2
Field Ion Microscopy
Field ion microscopy, often referred to as FIM, provides atomic-resolution imaging
of the surface of a specimen. A rare gas, called the imaging-gas, is introduced in the
vicinity of a positively charged sharp needle. The electric field at the apex of the
specimen is of the order of 1010 V m–1. Gas atoms are ionised very close to the tip
surface and subsequently accelerated away by the intense electric field. The image
that is formed by the impact of these gas ions onto a phosphor screen maps the
distribution of the electric field at the surface, which is intrinsically related to the
local topography of the tip [1, 2]. The specimen is maintained at an extremely low
temperature (5–80 K) to optimise the spatial resolution, which is high enough to
provide direct imaging of individual surface atoms.
Further increasing the electric field at the surface of the tip induces the ionisation
and desorption of atoms from the specimen itself via a process known as field
evaporation. Successively removing layers of atoms from the surface of specimen
enables the visualisation of the sub-surface structure of the specimen by using FIM.
Several comprehensive reviews and textbooks have been compiled on the
development and application of FIM in materials and surface sciences [3–8]. The
aim of this chapter is to give a brief overview of the physical principles as well as a
practical explanation of how it functions.
2.1 Principles
FIM relies on the electric-field-induced ionisation of inert gas atoms in the vicinity
of a charged surface. When a very sharp metallic needle is subjected to a high
voltage of a few kilovolts, an intense electric field is generated at the surface. This
electric field is generated by the positive charges present at the surface. Indeed, the
application of the high voltage induces the free electrons to be, on average,
displaced inwards by a small amount to screen the electric field, leaving partly
charged atoms at the very surface. For a non-flat surface, protruding atoms are
B. Gault et al., Atom Probe Microscopy, Springer Series in Materials Science 160,
DOI 10.1007/978-1-4614-3436-8_2, # Springer Science+Business Media, LLC 2012
9

subject to a greater charge, as shown in Fig. 2.1. Since the electric field at the
surface is directly proportional to the charge density, it is higher around these local
protrusions. In the case of an atomically smooth curved surface, these protrusions
correspond to the edges of atomic terraces. By imaging the distribution of the field
intensity at the surface, the field ion microscope provides an atomically resolved
image of the surface itself. The fundamental aspects of FIM are detailed in the
following sections.
2.1.1 Theory of Field Ionisation
Field ionisation is the field-induced removal of an electron from an atom. Figure 2.2
schematically presents the potential energy level of a gas atom in the vicinity of a
metal surface in the absence or presence of an electric field. The electric field
Fig. 2.1 Schematic view of the surface of a positively charged metal
Fig. 2.2 Potential energy diagram as a function of the distance to the surface (x) of an electron
from a gas atom in the vicinity of a tip (left) in the absence of an electric field, and (right) subject toan applied electric field, F. The energy of the first ionisation is I0, xc is the critical distance of
ionisation, EF is the Fermi energy and Fe is the work function of the surface
10 2 Field Ion Microscopy

polarises the gas atom, deforming the potential curve. When subjected to a very
strong electric field, an electron from the outer shell of the gas atom can tunnel
through the energy barrier towards an empty energy level at the metal surface. The
probability of ionisation depends on the relative transparency of the potential
barrier to the electron tunnelling process. The most widely accepted theoretical
model used to describe this energy barrier was developed by Gomer [9], and
assumes that the barrier can be modelled as an equilateral triangle. The width of
the barrier is then proportional to the electric field, and thus, the ionisation proba-
bility is critically dependent on the amplitude of the electric field. Field ionisation
will occur as close as possible to the surface, where the electric field is most intense.
However, the energy of the electron from the gas atom must coincide with, or be
higher than, the lowest available conduction level in the metal, which is close to the
Fermi level. If this condition is not fulfilled, there are no vacant energy levels in the
metal available for the tunnelling electron [1, 6, 7, 9–14]. As a result, this process
can only take place when the gas atom is beyond a critical distance away from the
surface. To a first approximation, the critical distance can be written as:
xc ¼ I0 � Fe
eF;
where I0 is the energy of first ionisation, Fe is the work function of the surface, and
F is the electric field. In the case of a helium atom (I0 ¼ 24.59 eV) ionised at
50 V nm–1 in the vicinity of a pure tungsten surface, where the work function is
typically ~4.5 eV, this distance corresponds to approximately ~0.4 nm [11]. Hence,
ionisation mostly takes place at this distance from the surface and, as shown by
M€uller and Bahadur [15], within a thin zone of thickness smaller than 0.1xc.
2.1.2 “Seeing” Atoms: Field Ion Microscopy
FIM is a direct and elegant application of field ionisation theory. In FIM, an
imaging-gas is introduced into a vacuum chamber containing a sharp needle-
shaped tip under a high positive electrical potential. The gas atoms or molecules
are polarised by the intense electric field, and subsequently are electrostatically
attracted towards the tip surface [12, 13]. The enhancement of the electric field in
the vicinity of the tip draws in a high concentration of imaging-gas atoms (Fig. 2.3).
The gas atoms strike the tip and bounce back and forth on its surface, losing some of
their kinetic energy with each interaction [16]. This energy is transferred to the
lattice in a process that may be viewed as a thermal accommodation of the gas
atoms prior to their ionisation. In the best-case scenario, the energy of the gas atoms
will be diminished to a level as low as the thermal energy of the tip’s surface. As the
kinetic energy of the gas atoms progressively decreases, there is a corresponding
decrease in their velocity, which in turn increases the time spent by the atoms
in the ionisation zone, around the critical distance above the surface of the tip.
2.1 Principles 11

Hence, the imaging-gas atoms will execute series of hops on and around the tip
surface, with each hop diminishing their energy more than the previous, until
ionisation finally occurs [13]. These new positively charged gas ions now experi-
ence the electric field force from the highly positive potential of the tip. As a result,
they are repelled from the tip surface on a trajectory that is remarkably close to
normal to the tangent of the specimen surface. The gas ions accelerate away from
the tip through the microscope chamber and eventually strike a screen with a
detection system, providing a vastly magnified projection of the specimen sur-
face—a field ion micrograph.
This process is schematically represented in Fig. 2.3. A body-centred cubic (bcc)
crystalline tip is shown side-on in Fig. 2.3a with gas atoms bouncing on and off the
tip surface under the field polarisation force. The gas atoms are eventually
accommodated at crystal ledge and terrace sites before being ionised and field
evaporated off the surface. They are then accelerated towards the screen where an
image is formed. Figure 2.3b, c depicts the physical origins of FIM images. A clear
pattern made of series of concentric rings appears in (b), which is simply a top view
of the model specimen shown side-on in (a). In (c), the most protruding atoms,
being those farthest from the centre of the spherical cap, are highlighted in green.
The resemblance to the micrograph in (a) is striking. It is clear that atomic resolu-
tion is achieved and that the image resembles the stereographic projection of the
crystal. The crystal symmetry is retained and so (e.g.) the two-fold symmetry of the
{110} planes that are oriented normal to the tip axis is also observed in the FIM
image. Example FIM images are provided in Fig. 2.4a–i.
Fig. 2.3 Schematic view of a field ion microscope (not to scale). (a) Only the atoms from the very
last shell (in green) of the tip surface can be imaged, as seen in the example of a pure W field ion
micrograph (right). (b) Equivalent model of stacked spheres arranged on a bcc-lattice. (c) Similar
view, with the most protruding atoms highlighted in green
12 2 Field Ion Microscopy

2.1.2.1 Generation of the electric field
Field ionisation theory requires a high positive voltage in order to induce a high
electric field at the surface of the sample. This is achieved by using a needle-shaped
tip geometry for the specimen, with an end radius smaller than 100 nm. The shape
of the tip is generally modelled as a truncated cone with a hemispherical cap,
Fig. 2.4 Typical field ion micrographs from a variety of materials. (a) Pure W observed along the
{110} direction. (b) Darkly imaging precipitate in a Cu81Fe9Ni10 alloy, the precipitate is coherent
with the matrix as assessed by the continuity of the atomic terraces through the precipitate (redarrows). (c) Nanocrystals of pure Al (red arrows) in amorphous Al92Sm8 alloy, the matrix is
amorphous and hence does not exhibit the typical pole structure. (d) Nitrided Fe3%Cr alloy
containing FeCrN platelets (red arrows) either observed from the top or edge-on. (e) Dislocation
in pure Fe (red arrow). (f) reconstructed lattice in a pure Fe specimen observed by three-
dimensional FIM. (g) Brightly imaging T1 platelets (red arrows) in observed side-on in an
Al–Cu–Li–(Mg)–(Ag) alloy. (h) (Sc,Zr)-rich dispersoids (red arrows) in an Al–Zr–Sc alloy. (h)
Same particles as in (i) observed by three-dimensional FIM: the core–shell structure of the
precipitates is readily apparent (micrographs (a–f) and (h, i) courtesy of Drs Frederic Danoix,
Francois Vurpillot and Williams Lefebvre)
2.1 Principles 13

although slight deviations from sphericity are generally encountered. The half angle
at the apex of the cone is referred to as the shank or taper angle of the tip. The radiusof the hemisphere is considered to be the radius of curvature of the tip. The electricfield, F, generated at the apex of a needle-shaped specimen with a radius of
curvature, R, that is subjected to a high voltage, V, can be estimated based on the
idealised expression for a charged sphere. It does require slight modification to
account for the fact that the tip is not exactly spherical, giving:
F ¼ V
kfR;
where kf is referred to as the field reduction factor or more simply field factor and isa constant that accounts for both the tip shape and its electrostatic environment [9].
Based on experimental studies of the energy distribution of ions created in the
vicinity of a tip, Sakurai and Muller [17, 18] have shown that the field factor can
range from 3 to 8 for tungsten tips. A smaller shank angle will increase the
concentration of the field at the tip apex, resulting in a decrease in kf [19].Larson et al. observed that kf varies almost linearly with the shank angle [19] in
FIM. This is in relatively good agreement with calculations by Gipson et al. [20–22].
The field factor has been shown to be influenced by the value of the radius of curvature
and by the overall shape of the specimen [20, 21, 23, 24]. Furthermore, other
parameters, which are independent of the tip shape itself, impact the value of the
field factor. For example, the presence of a flat substrate underneath the specimen,
positioned too close to the apex, causes a dramatic drop in the field; conversely, the
presence of a counter-electrode close to the tip apex increases the electric field: a
decrease in kf ofmore than a factor of two has been experimentally observed as a result
of changing the distance between the counter-electrode and the specimen [20–22, 25].
The specimen is not only subjected to a high electric field but also cooled down to
cryogenic temperatures, which leads, for multiple reasons, to an improved spatial
resolution. First, at lower temperature, the thermal agitation of the surface atoms is
reduced. Furthermore, diffusion of the atoms from the specimen across its surface is a
thermally activated process, which can be if not completely avoided, at least greatly
minimised at cryogenic temperatures, increasing confidence that the surface atoms
are observed in their original positions and have not been redistributed by the electric
field. Another critical purpose of the cryogenic temperatures is to provide thermalaccommodation of the imaging-gas atoms. Reducing the thermal energy, kBT, of theimaging-gas atoms has the effect of lowering their lateral velocity at the instant of
their evaporation, thereby increasing the spatial resolution as is discussed further
below [7, 26, 27].
2.1.2.2 Projection of the Ions: Formation of the Image
Once ionised, the imaging-gas atoms are affected by the very intense electric field
surrounding the tip. The electric field accelerates the ions as they are repelled from
14 2 Field Ion Microscopy

the tip surface. As the electric field is nearly normal to the surface, the ions fly along
the electric field lines and behave as if they are projected away from the surface.
Several models have been proposed to describe the ion projection [28–32]. The
most widely used, although not necessarily the most accurate model [29, 30, 33], is
a point-projection. By placing a screen at a distance L from the tip, typically a few
centimetres, the magnification,Mproj, of the image formed by the impact of the ions
can be expressed as [34]:
Mproj ¼ L
xR;
where R is the radius of curvature of the tip and x is a constant called the imagecompression factor (ICF). Similarly to the field factor that accounted for a combi-
nation of effects, the ICF accounts for the deflection of the field lines the towards
the specimen main axis linked to the specimen shape and its electrostatic environ-
ment altogether. The ICF can be seen as the ratio between the observed angle yobsbetween two crystallographic directions on the projected image and the theoretical
value ycrys, as defined in Fig. 2.5:
x � ycrysyobs
:
The ICF (x) typically ranges between 1 (radial projection) and 2 (stereographic
projection). In many studies, x has been shown to lie somewhere near the middle of
these two figures [28, 33]. For typical values of L ¼ 90mm, x ¼ 1.5 and R ¼ 50 nm,
a magnification higher than 106 is reached, enabling the resolution of the positions of
the individual atoms.
Upon impact on the phosphor screen, each ion produces a spot of light, as seen in
Fig. 2.3. The overall image is the culmination of light spots from atoms ionised over
Fig. 2.5 Schematic view of the point-projection of the atoms from the surface
2.1 Principles 15

the entire surface of the specimen. Importantly, although the field ion image can seem
to be static, its formation is actually a dynamic process, whereby each bright region of
the image is formed by a continuous flowof ionised imaging-gas originating from the
ionisation zone, just above the protruding atoms. Brighter spots on the image
correspond directly to zones where a higher ion current is produced.
2.1.3 Spatial Resolution of FIM
Despite being crucial to understanding the intrinsic limitations of a technique, the
concept of resolution in microscopy has still not been unambiguously defined,
leaving room for interpretation. Microscopes have limited capabilities to image a
given feature, which translates into a finite resolution. Deformations induced by the
microscope itself (i.e. aberrations) are generally put in the form of a point-spread
function that describes the response of the microscope to an individual point. The
point-spread function can then be exploited to deduce the resolution limit. The latter
is generally deduced from well-established criteria, such as the classic Rayleigh’s
criterion, to provide values of the so-called two-point resolution, which is the
microscope’s ability image two individual points of equal intensity. This is a widely
used approach to assess the resolving capabilities of a microscope.
Definitions in FIM often relate to the size of the smallest image spot on the
screen, which corresponds to the point-spread function. Based on the pioneering
work of Chen and Seidman [26] or de Castilho and Kingham [27], Tsong [7]
proposed a model based on three major factors to describe the origins of the
resolution limit of FIM:
• The size of the ionisation zone. As each spot is formed by the successive impact
of a continuous flow of ions projected onto the detector, its size will correspond
to the lateral size of the ionisation zone directly above the image atom on the tip
surface.
• Lateral velocity. Trajectory aberrations, originating from the lateral velocity of
the ions at the instant of their field ionisation, contribute to the increase in the
spot size.
• Positional uncertainty. The gas atom is confined in a very small volume, and
hence, the quantum nature of the atom must be considered. The Heisenberg’s
uncertainty principle imposes a spread in the lateral velocity component of the
imaging-gas atom. This introduces an uncertainty in its position.
2.1.3.1 Ionisation Zone
The lateral expansion of the ionisation zone above the imaged atom is difficult
to quantify. In the best case, it is of the same order of magnitude as the size of
the imaging-gas atom. However, it is critically dependent on the amplitude and
distribution of the electric field above the atom. If the field is relatively low, the
critical distance xc will be large, and hence, the field distribution in the ionisation
16 2 Field Ion Microscopy

zone may not reflect the structure on the surface with atomic resolution. Con-
versely, if the electric field is too high, the ionisation zone will be closer to the
surface and its lateral extent above a specific surface atom will overlap with the
zones of that atom’s neighbours. Such effects blur the image. Thus, the definition of
the best image field (BIF) is the field for which the volume of the ionisation zone is
minimal and which results in the highest resolution.
2.1.3.2 Lateral Velocity
Ions are formed when the gas atoms are hopping through the ionisation zone near the
surface. Therefore, their velocity has a component parallel to the tip surface that
depends on their kinetic energy. This kinetic energy depends on the tip’s temperature
and can be estimated if the gas is considered to be ideal. After field ionisation, the
imaging-gas ion is projected from the vicinity of the tip onto the screen. If the ions
generated above a single atom exhibit a statistical distribution in their initial lateral or
tangential velocity, they will not all follow the exact same trajectory. Such trajectory
aberrations induce a spread of the ion impact position on the screen. The image of a
single point in the ionisation zone is hence no longer a single point but a spot. The
amplitude of these trajectory aberrations therefore is also linked to the projection
properties of the tip itself (i.e. radius of curvature, image compression factor, etc.).
2.1.3.3 Heisenberg’s Uncertainty
One must also consider the spread in the tangential velocities due to the confine-
ment of the imaging-gas. The Heisenberg uncertainty principle states that the
position and energy of the atom cannot be precisely determined at the same time.
The de Broglie wavelength of a helium atom, due to its thermal agitation at 20 K, is
on the order of 0.2 nm, bigger than the size of the zone in which the atoms are
ionised. The quantum nature of the atom therefore cannot be neglected. This effect
will be much less noticeable in FIM than in field electron emission microscopy, as
ions are much heavier than electrons and their wavelengths are significantly
smaller. This lateral velocity will also contribute to the broadening of the ion
trajectories that exit from above a particular atomic site.
2.1.3.4 Resolution
An equation has previously been derived to describing the resolution d of the
instrument. It contains three terms, related to these different limiting factors, and
can be written as:
d ¼ d02 þ 16
x2kBTRkfeF
� �þ 4
x2�h2R2mkfeF
� �1=2( )1=2
;
2.1 Principles 17

where d0 is the size of the ionisation zone, x is the image compression factor, kB is
the Boltzmann constant, T is the temperature of the imaging-gas atom immediately
before ionisation, R is the tip radius, kf is the field factor, e is the elementary charge,
F is the electric field at the tip apex, �h is the Planck constant andm is the mass of the
imaging-gas atom.
In summary, the resolution, as described by the above equation, is limited by the
size of the ionisation zone (first term), its lateral velocity at the moment of
ionisation (second term), and the Heisenberg uncertainty (third term). Temperature
has a strong effect on the third term, and thus should be kept as low as possible to
ensure the best possible resolution. A higher electric field and smaller tip radius also
improve resolution. By using the proposed definition, the best resolution achievable
in FIM is about 0.2 nm with He at 20 K.
2.2 Instrumentation and Techniques for FIM
2.2.1 FIM Instrumentation
Figure 2.6 shows the key components of instrumentation for FIM. The instrument
consists of an ultra-high vacuum chamber, which is required to operate at a base
pressure below 10–8 Pa (~10–10 Torr). This is achieved through the use of high-
compression-rate turbo-molecular pumps backed by rotary pumps. Low specimen
temperatures must be maintained to achieve high resolution. Early microscope
designs simply used liquid nitrogen, hydrogen or helium to cool the specimen
[35]. Since the 1980s, closed-cycle helium cryostats have generally been used to
reach temperatures below 20 K. A high-voltage DC power supply is connected to
the specimen in order to generate the required electric field. Once the tip is
positioned and thermally stabilised, a very low pressure, in the range of 10–3 to
10–4 Pa (~ 10 DC–5 to 10–6 Torr), of imaging-gas is introduced into the chamber.
The most commonly used gases are He and Ne, although in some cases H2 has also
been used. Multiple gases in combination can also be used to resolve images from
several phases at the same time [13, 36].
The FIM screen is composed of a stack of biased micro-channel plates (MCPs),
which is used an as image intensifier, placed immediately in front of a phosphor
screen. A MCP consists of an array of tiny glass tubes with a diameter of the order
of a few tens of microns, covered by a thin conductive layer [37]. The tubes are
oriented at an angle of approximately 15–5� to normal. Generally, one of the faces
of the MCP is biased at about –1 kV, creating a high surface charge density. The
opposite side is grounded, which induces an electric field between the two faces.
When a particle, ion, electron or photon hits the inside wall of one of the tubes,
secondary electrons are emitted by the surface. By virtue of the electric field, they
are driven towards the back face. Each time one of these electrons collides with the
wall of the tube, another cluster of secondary electrons is ejected, ultimately
18 2 Field Ion Microscopy

producing a cascade of several thousand electrons for each corresponding ion that
impacts the surface. The electrons are consequently focussed onto the phosphor by
an electric field imposed between the MCP and the phosphor screen, which
produces a spot of light on impact of the electrons.
The detection-efficiency of the MCP can be defined as the probability that it will
successfully detect a single ion striking its surface. This detection-efficiency is
theoretically limited by the open area of the MCP, i.e. the fraction of the surface
area of the detector that serves as an opening to the micro-channels. This fraction
has an approximate value of between 50% and 60%. However, in the case of FIM,
high number of imaging-gas ions contributes to form a single spot within the image.
Indeed even if 50% of the ions reaching the MCP are not detected, there will still be
thousands of ions that are successfully detected and will contribute to the formation
of each spot. Hence, the detection-efficiency limitation imposed by the MCPs is not
a significant issue in FIM. Other design issues can also affect the efficiency of the
MCPs. For example, a zone of lower efficiency can still generally be observed due
to the angle between the micro-channels and the surface. An ion flying at exactly
the same orientation as the MCP micro-channels will pass directly to the bottom of
the channel without hitting the wall and therefore will not provoke an electron
cascade. Early designs of field ion microscopes were not equipped with MCPs.
Instead, images were recorded by acquiring the light emitted by the phosphor
screen onto photographic plates over up to several minutes, or used external
image amplification devices.
2.2.2 eFIM or Digital FIM
These methods involve the detection of the imaging-gas ions using delay-line
detectors such as those employed in contemporary atom probe tomography.
These detectors are capable of collecting and treating a very large number of atoms
Fig. 2.6 Experimental setup of a field ion microscope
2.2 Instrumentation and Techniques for FIM 19

and therefore FIM experiments can be digitally recorded at data collection rates of
about 106 ions per second. Corresponding FIM images can then be simulated by
modelling the response of a virtual phosphor screen to each single event detected [38].
Various settings can be tuned, such as the contrast, brightness, gamma, integra-
tion time and the simulated decay of the phosphor response, to improve the image
quality or reveal particular features. Contrast sufficient to observe nearly every
surface atom can be achieved just as in traditional FIM, as shown in Fig. 2.7,
although the quality of the image is generally slightly lower. Using the same
detector enables iterative APT and FIM experiments to be performed more easily
on the same specimen. As the two techniques can reveal different information from
the specimen, coupling these two approaches can be beneficial.
2.2.3 Tomographic FIM Techniques
In FIM, the specimen is most often field evaporated, which, as described in the
Chap. 3, provides a mean to investigate the depth of the specimen. Provided that the
specimen is field evaporated at a constant rate, the in-depth distance between
successive images taken at regular time intervals remains constant. Exploiting
this principle, the 3D FIM [39] or Computed Field Ion Image Tomography [40]
simply involves stacking a sequence of field ion images recorded by a high-
resolution CCD (charge-coupled device) camera. A tomographic image is ulti-
mately produced, as shown in Fig. 2.4f, i. Similar tomographic reconstruction of
the imaged volume could be achieved in eFIM, as the individual impact positions of
Fig. 2.7 e-FIM of a pure
W specimen imaged
at 20 K, 3.5 kV in He
20 2 Field Ion Microscopy
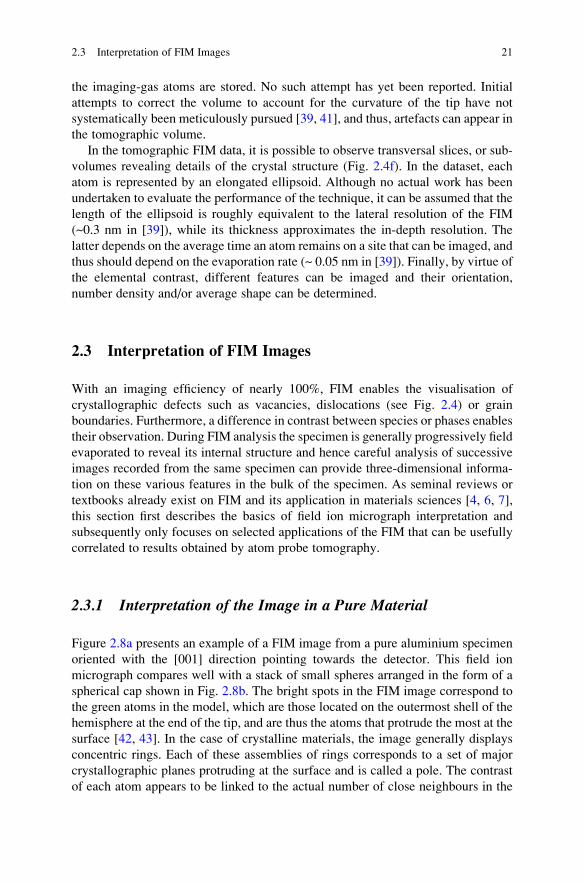
the imaging-gas atoms are stored. No such attempt has yet been reported. Initial
attempts to correct the volume to account for the curvature of the tip have not
systematically been meticulously pursued [39, 41], and thus, artefacts can appear in
the tomographic volume.
In the tomographic FIM data, it is possible to observe transversal slices, or sub-
volumes revealing details of the crystal structure (Fig. 2.4f). In the dataset, each
atom is represented by an elongated ellipsoid. Although no actual work has been
undertaken to evaluate the performance of the technique, it can be assumed that the
length of the ellipsoid is roughly equivalent to the lateral resolution of the FIM
(~0.3 nm in [39]), while its thickness approximates the in-depth resolution. The
latter depends on the average time an atom remains on a site that can be imaged, and
thus should depend on the evaporation rate (~ 0.05 nm in [39]). Finally, by virtue of
the elemental contrast, different features can be imaged and their orientation,
number density and/or average shape can be determined.
2.3 Interpretation of FIM Images
With an imaging efficiency of nearly 100%, FIM enables the visualisation of
crystallographic defects such as vacancies, dislocations (see Fig. 2.4) or grain
boundaries. Furthermore, a difference in contrast between species or phases enables
their observation. During FIM analysis the specimen is generally progressively field
evaporated to reveal its internal structure and hence careful analysis of successive
images recorded from the same specimen can provide three-dimensional informa-
tion on these various features in the bulk of the specimen. As seminal reviews or
textbooks already exist on FIM and its application in materials sciences [4, 6, 7],
this section first describes the basics of field ion micrograph interpretation and
subsequently only focuses on selected applications of the FIM that can be usefully
correlated to results obtained by atom probe tomography.
2.3.1 Interpretation of the Image in a Pure Material
Figure 2.8a presents an example of a FIM image from a pure aluminium specimen
oriented with the [001] direction pointing towards the detector. This field ion
micrograph compares well with a stack of small spheres arranged in the form of a
spherical cap shown in Fig. 2.8b. The bright spots in the FIM image correspond to
the green atoms in the model, which are those located on the outermost shell of the
hemisphere at the end of the tip, and are thus the atoms that protrude the most at the
surface [42, 43]. In the case of crystalline materials, the image generally displays
concentric rings. Each of these assemblies of rings corresponds to a set of major
crystallographic planes protruding at the surface and is called a pole. The contrast
of each atom appears to be linked to the actual number of close neighbours in the
2.3 Interpretation of FIM Images 21

vicinity of each kink-site atom (i.e. each protruding atom at the edge of a plane).
It is clear that FIM images contain broad variations in brightness. For example, in
Fig. 2.8a large bright regions are formed. These linear zones of higher field are
generally called zone lines, and they appear to link poles.
The pattern of poles and zone lines is in fact the result of the accommodation of
the crystal lattice to an equilibrium shape during field evaporation, which, to a first
approximation is often considered as quasi-hemispherical. This leads to a surface
made of a complex combination of facets formed around major poles. The position
and size of these facets are directly dependent on the corresponding crystallo-
graphic direction, as, for example, the work function and vary from direction to
direction, the intensity of the electric field and the temperature. Zone lines form at
the boundary between these facets. Finally, the image has similarities to a stereo-
graphic projection of the corresponding crystal structure [29, 31, 33], such that for
cubic crystals where crystallographic directions are normal to the planes, directions
can be directly identified. The symmetry relative to each specific direction helps
with the process of identifying the poles. Potential uses of identifying these poles
will be discussed later in Sect. 2.3.3.4 and in Chap. 7. The stereographic projections
included in Appendix F can be of great help to identify the different poles.
2.3.2 Interpretation of the Image for Alloys
In the case of alloys, contrast generally exists between different chemical phases
and atoms of different elements. Two main reasons have been proposed to explain
this contrast. The first reason is that atoms of different species present at the surface
of the material have different affinities to the imaging-gas atoms, leading to
Fig. 2.8 (a) He eFIM of pure Al observed on a Cameca LEAP 3000X Si at 24 K under an applied
voltage of 12.5 kV. The specimen is approximately oriented along the [001] direction. (b) Shows a
spherical tip apex modelled as a stack of small spheres (ball model) in a FCC arrangement. The
most protruding atoms are represented in green. The red circle highlights the actual field-of-view
22 2 Field Ion Microscopy

variations in charge transfer. Thus, selective ionisation above certain atoms could
occur, leading to brighter spots on the image where these specific atoms are
positioned [6].
The second reason relates to changes in the local curvature of the tip. During a
FIM experiment, the tip is progressively field evaporated. The electric fields
required for field evaporation are specific to each species. The tip is subjected to
a high-voltage, and to enable the departure of a given type of atom, the local
curvature of the tip has to evolve to reach the evaporation field of this element.
For example, if the evaporation field of the solute or of a precipitate is lower than
that of the matrix, these atoms will generally appear dark on the image, as shown in
Fig. 2.4b, as the local curvature will be smaller and hence the field lower. In
contrast, a solute atom with a higher evaporation field will appear bright. This is
demonstrated in the field ion micrograph shown in Fig. 2.4d, g–h, where Cu-rich or
(Sc,Zr)-rich particles appear much brighter than the surrounding aluminium matrix.
These local variations in curvature are responsible for aberrations in the trajectories
of the imaging-gas ions, as well as for ions field evaporated from the tip, a problem
that is discussed further in Chap. 7, as it similarly impacts atom probe tomography.
2.3.3 Selected Applications of the FIM
2.3.3.1 Orientation
The first generations of three-dimensional atom probes were only able to analyse a
very limited area of the specimen surface. FIM was generally performed prior to
any atom probe analysis in order to clean the tip surface and reveal the crystallo-
graphic orientation of the specimen or the position of a particular feature, such as a
grain boundary, precipitate, or a specific phase, that could subsequently be analysed
by atom probe.
2.3.3.2 Radius of Curvature
In atom probe tomography, when atomic planes can be observed in the tomographic
reconstruction, the interplanar spacing can be used to calibrate the dimensions of
the reconstruction [44]. However, it is first necessary to identify the corresponding
crystallographic direction, which is not always straightforward, especially when
only a limited area of the surface is imaged. In FIM, a wide area over the tip surface
is normally imaged and several poles can usually be observed. Since the
symmetries of the crystal are more apparent, the poles can be much more readily
identified. Although the advent of wide-angle atom probes has made this process
less necessary, other important information can still be obtained.
Indeed, the pattern of concentric rings observed in FIM images relates to the
local geometry of the tip. Exploiting the image can enable the determination of, for
2.3 Interpretation of FIM Images 23
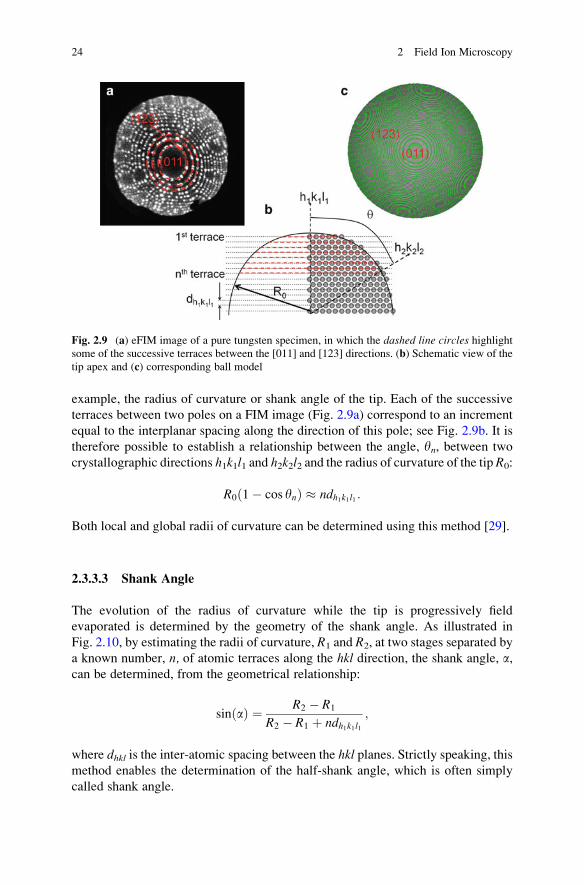
example, the radius of curvature or shank angle of the tip. Each of the successive
terraces between two poles on a FIM image (Fig. 2.9a) correspond to an increment
equal to the interplanar spacing along the direction of this pole; see Fig. 2.9b. It is
therefore possible to establish a relationship between the angle, yn, between two
crystallographic directions h1k1l1 and h2k2l2 and the radius of curvature of the tip R0:
R0 1� cos ynð Þ � ndh1k1l1 :
Both local and global radii of curvature can be determined using this method [29].
2.3.3.3 Shank Angle
The evolution of the radius of curvature while the tip is progressively field
evaporated is determined by the geometry of the shank angle. As illustrated in
Fig. 2.10, by estimating the radii of curvature, R1 and R2, at two stages separated by
a known number, n, of atomic terraces along the hkl direction, the shank angle, a,can be determined, from the geometrical relationship:
sinðaÞ ¼ R2 � R1
R2 � R1 þ ndh1k1l1;
where dhkl is the inter-atomic spacing between the hkl planes. Strictly speaking, thismethod enables the determination of the half-shank angle, which is often simply
called shank angle.
Fig. 2.9 (a) eFIM image of a pure tungsten specimen, in which the dashed line circles highlightsome of the successive terraces between the [011] and [123] directions. (b) Schematic view of the
tip apex and (c) corresponding ball model
24 2 Field Ion Microscopy

2.3.3.4 Image Compression Factor
As introduced in Sect. 2.1.2.2, the magnification of the image is affected by the
modification of the field lines due to the shape of the tip and its electrostatic
environment. The image compression factor can be expressed as the ratio of the
crystallographic to observed angles, x � ycrys=yobs, where yobs is the observed anglebetween two crystallographic directions on the projected image and ycrys the
theoretical value, as shown in Fig. 2.11. The radius of the tip is negligible compared
to the flight path L, so the observed angle can be written as:
yobs ¼ arctanD
L;
where D is the distance between the centres of the two poles on the image. The
theoretical angles between crystallographic directions are defined by the structure
and can be easily calculated by using the formulas provided in Appendix E.
2.3.3.5 Surface-Diffusion Processes
Atoms adsorbed on a surface can undergo a thermally activated process of randomwalk [45, 46] whereby an atom jumps from one location to another across the
specimen surface. The excellent spatial resolution of FIM [26] makes it a unique
tool to investigate such processes, and hence extensively studies have been
undertaken over the years.
Fig. 2.10 Evolution of the
radius of curvature with the
geometry of the tip
2.3 Interpretation of FIM Images 25

Similar to field evaporation, surface diffusion is a thermally assisted process that
can be described by the Arrhenius law:
Ndiff ¼ u0 exp �Qdiff
kBT
� �;
where Ndiff is the number of hops from one site to another per second and n0 thesurface atom vibration frequency. The activation energy of surface diffusion Qdiff
can be estimated by measuring the mean square displacement r2� �
of a surface atom
as a function of the emitter temperature:
r2� �2t0
¼ D0 exp �Qjump
kBT
� �;
where D0 is the surface diffusivity and t0 is the time of observation. Specifically,
FIM has been used to provide measurement of surface diffusion coefficients, using
heat cycles to precisely control the rate of surface migration, or to garner insight
into the formation and displacement mechanisms of atomic clusters on surfaces,
which are relevant to materials fabrication via deposition processes. This research
activity has been the subject of many detailed reviews [7, 45, 47, 48]. Further,
surface migration measurements have been used to probe the temperature reached
by the specimen during pulsed-laser irradiation [49, 50].
Surface diffusion processes are not restricted to adsorbed species. Indeed atoms
belonging to the material can be subject to migration if sufficient thermal energy is
Fig. 2.11 Determination of the image compression factor
26 2 Field Ion Microscopy
available. In the presence of an electric field, atoms on the surface become
polarised. Due to the polarisation energy ðð1=2ÞaPF2Þ, variations in the electric
field influence the relative stability of different sites at the surface. In such a case
migration of atoms subject to surface diffusion can no longer be considered a
random process. Instead, atoms will preferentially migrate towards regions of
higher electric field, a process generally referred to as a directional walk [51–53].As surface diffusion and field evaporation are both facilitated by the electric field
and are both thermally activated, there is a competition between these two pro-
cesses, which has sometimes been considered as limiting the rate of field
evaporated atoms from a surface [54, 55].
2.3.4 Summary
Most of the key parameters used within the tomographic reconstruction generated
by atom probe tomography can be calibrated by using FIM: the radius of curvature
and shank angle of the specimen, along with the image compression factor or field
factor. FIM provides a unique way to estimate these parameters. However, it is
important to keep in mind that what is observed by using FIM is not strictly an
image of the surface itself, but rather an image of the ionisation zone located up to a
few nanometres above the surface. This ionisation zone directly relates to the
surface itself, but this distinction is enough to potentially introduce biases on
measurements and observations. FIM still provides a unique technique to access
these values. It also offers unparalleled spatial resolution for observation of surface
processes and structure of the surface, but also, thanks to its new three-dimensional
capabilities, of the bulk of a specimen, which makes FIM an invaluable tool for
materials research.
References
1. E.W. M€uller, J. Appl. Phys. 27(5), 474–476 (1956)
2. E.W. M€uller, Phys. Rev. 102(3), 618–624 (1956)
3. K.M. Bowkett, D.A. Smith, Field-Ion Microscopy (North-Holland Pub. Co., Amsterdam,
1970)
4. M.K. Miller, A. Cerezo, M.G. Hetherington, G.D.W. Smith, Atom Probe Field Ion Microscopy(Oxford Science Publications - Clarendon Press, Oxford, 1996)
5. M.K. Miller, G.D.W. Smith, Atom Probe Microanalysis: Principles and Applications toMaterials Problems (Materials Research Society, Pittsburg, PA, 1989)
6. E.W. M€uller, T.T. Tsong, Field Ion Microscopy, Principles and Applications (Elsevier, NewYork, NY, 1969)
7. T.T. Tsong, Atom-Probe Field Ion Microscopy: Field Emission, Surfaces and Interfaces atAtomic Resolution (Cambridge University Press, New York, NY, 1990)
8. R. Wagner, Field-Ion Microscopy (Springer-Verlag, Berlin Heidelberg, 1982)
9. R. Gomer, Field Emission and Field Ionisation (Havard University, Cambridge, 1961)
References 27

10. D.G. Brandon, Philos. Mag. 7(78), 1003–1011 (1962)
11. D.G. Brandon, Br. J. Appl. Phys. 14(8), 474 (1963)
12. E.W. M€uller, Acta Crystallogr. 10(12), 823–823 (1957)
13. E.W. M€uller, Science 149(3684), 591–601 (1965)
14. T.T. Tsong, Surf. Sci. 70, 211 (1978)
15. E.W. M€uller, K. Bahadur, Phys. Rev. 102(3), 624–631 (1956)
16. E.W. M€uller, S. Nakamura, O. Nishikawa, S.B. McLane, J. Appl. Phys. 36(8), 2496–2503
(1965)
17. T. Sakurai, E.W. M€uller, Phys. Rev. Lett. 30(12), 532–535 (1973)
18. T. Sakurai, E.W. Muller, J. Appl. Phys. 48(6), 2618–2625 (1977)
19. D.J. Larson, K.F. Russell, M.K. Miller, Microsc. Microanal. 5, 930–931 (1999)
20. G.S. Gipson, J. Appl. Phys. 51(7), 3884–3889 (1980)
21. G.S. Gipson, H.C. Eaton, J. Appl. Phys. 51(10), 5537–5539 (1980)
22. G.S. Gipson, D.W. Yannitell, H.C. Eaton, J. Phys. D: Appl. Phys. 12(7), 987–996 (1979)
23. B. Gault, D. Haley, F. de Geuser, D.J. Larson, E.A. Marquis, B.P. Geiser, Ultramicroscopy 111
(6), 448–457 (2011)
24. B. Gault, A. La Fontaine, M.P. Moody, S.P. Ringer, E.A. Marquis, Ultramicroscopy 110(9),
1215–1222 (2010)
25. M. Huang, A. Cerezo, P.H. Clifton, G.D.W. Smith, Ultramicroscopy 89(1–3), 163–167 (2001)
26. Y.C. Chen, D.N. Seidman, Surf. Sci. 26(1), 61–84 (1971)
27. C.M.C. de Castilho, D.R. Kingham, J. Phys. D: Appl. Phys. 20(1), 116–124 (1987)
28. D.G. Brandon, J. Sci. Instrum. 41(6), 373–375 (1964)
29. T.J. Wilkes, G.D.W. Smith, D.A. Smith, Metallography 7, 403–430 (1974)
30. A. Cerezo, P.J. Warren, G.D.W. Smith, Ultramicroscopy 79(1–4), 251–257 (1999)
31. M.A. Fortes, Surf. Sci. 28(1), 117–131 (1971)
32. H.N. Southworth, J.M. Walls, Surf. Sci. 75(1), 129–140 (1978)
33. R.W. Newman, R.C. Sanwald, J.J. Hren, J. Sci. Instrum. 44, 828–830 (1967)
34. J.M. Walls, H.N. Southworth, J. Phys. D: Appl. Phys. 12(5), 657–667 (1979)
35. R.G. Forbes, J. Microsc. Oxford 96(Aug), 63–75 (1972)
36. A. Menand, T. Alkassab, S. Chambreland, J.M. Sarrau, J. Phys. 49(C-6), 353–358 (1988)
37. J.L. Wiza, Nucl. Instrum. Methods 162(1–3), 587–601 (1979)
38. R.M. Ulfig, D.J. Larson, S.S.A. Gerstl (unpublished, 2008)
39. F. Vurpillot, M. Gilbert, B. Deconihout, Surf. Interface Anal. 39(2–3), 273–277 (2007)
40. C. Wille, T. Al-Kassab, A. Heinrich, R. Kirchheim, presented at the IVNC 2006/IFES 2006
(unpublished, 2006)
41. J. Akre, F. Danoix, H. Leitner, P. Auger, Ultramicroscopy 109, 518–523 (2009)
42. A.J.W. Moore, J. Phys, Chem. Solids 23(Jul), 907–912 (1962)
43. A.J.W. Moore, S. Ranganathan, Philos. Mag. 16(142), 723–737 (1967)
44. J.M. Hyde, A. Cerezo, R.P. Setna, P.J. Warren, G.D.W. Smith, Appl. Surf. Sci. 76/77, 382–391
(1994)
45. G. Ehrlich, K. Stolt, Annu. Rev. Phys. Chem. 31, 603–637 (1980)
46. G. Antczak, G. Ehrlich, Surf. Sci. Rep. 62(2), 39–61 (2007)
47. T.T. Tsong, Prog. Surf. Sci. 67, 235–248 (2000)
48. G.L. Kellogg, T.T. Tsong, P. Cowan, Surf. Sci. 70(1), 485–519 (1978)
49. G.L. Kellogg, J. Appl. Phys. 52, 5320–5328 (1981)
50. F. Vurpillot, J. Houard, A. Vella, B. Deconihout, J. Phys. D: Appl. Phys. 42(12), 125502
(2009)
51. T.T. Tsong, G. Kellogg, Phys. Rev. B 12(4), 1343–1353 (1975)
52. S.C. Wang, T.T. Tsong, Phys. Rev. B 26(12), 6470–6475 (1982)
53. J. Neugebauer, M. Scheffler, Surf. Sci. 287/288, 572–576 (1993)
54. M. Wada, Surf. Sci. 145, 451–465 (1984)
55. C.G. Sanchez, A.Y. Lozovoi, A. Alavi, Mol. Phys. 102(9–10), 1045–1055 (2004)
28 2 Field Ion Microscopy

http://www.springer.com/978-1-4614-3435-1


![Near-Field Optical Microscopy - Indico [Home]indico.ictp.it/event/a04179/session/16/contribution/11/material/0/0.pdf · Optical microscopy Electron microscopy' Near-field optical](https://static.fdocuments.net/doc/165x107/5ed73d31d37f9f58ca6a86bf/near-field-optical-microscopy-indico-home-optical-microscopy-electron-microscopy.jpg)


![FIELD ION MICROSCOPE, IMAGING ATOM PROBE STUDY OF … · Field ion microscopy (FIM) [Z] offers a possibility to view the material in atomic detail and can in principle be a very powerful](https://static.fdocuments.net/doc/165x107/602a5efef3eea32d1e233c11/field-ion-microscope-imaging-atom-probe-study-of-field-ion-microscopy-fim-z.jpg)