Chapter 2 Aggregate Activity: GDP and Employment
29
31 Chapter 2 Aggregate Activity: GDP and Employment *URVV 'RPHVWLF 3URGXFW LQFUHDVHG E\ SHUFHQW LQ FORVH WR WKH SUHYLRXV \HDUカV UDWH DQG WKH SRWHQWLDO UDWH RI *'3 JURZWK 1HW RI H[FHSWLRQDO IDFWRUV JURZWK VORZHG DQG ZDV VOLJKWO\ EHORZ LWV SRWHQWLDO UDWH ,PSURYHG WHUPV RI WUDGH DQG DFFRPPRGDWLYH PDFURHFRQRPLF SROLFLHV VXSSRUWHG JURZWK LQ GRPHVWLF XVHV ZKLOH WKH VORZGRZQ LQ ZRUOG WUDGH LQKLELWHG H[SRUW JURZWK ,PSRUWV FRQWLQXHG WR JURZ PRUH TXLFNO\ WKDQ *'3 PHHWLQJ WKH EULVN GRPHVWLF GHPDQG 7KH ODERU PDUNHW UHPDLQHG LQ D IXOO HPSOR\PHQW HQYLURQPHQW EXW VWRSSHG WLJKWHQLQJ 7KH FXUUHQW DFFRXQW VXUSOXV LQFUHDVHG VXSSRUWHG E\ WKH WHUPV RI WUDGH DQG KLJKWHFK DFWLYLW\ DQG WKH VKHNHOカV DSSUHFLDWLRQ LQ WHUPV RI WKH UHDO H[FKDQJH UDWH UHVXPHG 7KH RQJRLQJ UHDO DSSUHFLDWLRQ FRQWLQXHG WR EXUGHQ WKH PDQXIDFWXULQJ LQGXVWULHV ZKLOH WUDGH DQG VHUYLFHV ZHUH OHVV VHQVLWLYH WR H[FKDQJH UDWH YRODWLOLW\ 7KH H൵HFW RI WKH DSSUHFLDWLRQ LV UHタHFWHG DW D ODJ RI DSSUR[LPDWHO\ RQH\HDU DQG LPSHGHV ERWK PDQXIDFWXULQJ H[SRUWV DQG GRPHVWLF SURGXFWLRQ WKDW LV H[SRVHG WR FRPSHWLQJ LPSRUWV
Transcript of Chapter 2 Aggregate Activity: GDP and Employment
31
Chapter 2
Aggregate Activity: GDP and Employment

BANK OF ISRAEL, ANNUAL REPORT, 2019
a. Main developments
1
1
1995–
20142015 2016 2017 2018 2019
GDP 3.8 2.3 4.0 3.6 3.4 3.5
GDP of OECD countriesa 2.2 2.6 1.8 2.6 2.3 1.7
Per capita GDP in Israel 1.7 0.3 2.0 1.6 1.4 1.6
Per capita GDP in OECD countriesa 1.5 2.0 1.2 2.0 1.7 1.1
Exports excluding diamonds and startups 6.8 -1.1 -0.7 6.2 5.1 5.7
Imports excluding ships, aircraft, diamonds, and defense imports 4.6 1.8 8.8 7.1 5.1 4.5
Domestic uses 3.3 3.4 6.6 4.1 3.5 3.4
Unemployment rate (ages 25–64, level) 8.1 4.5 4.1 3.7 3.5 3.4
Real wage per employee post 0.8 2.9 2.8 2.8 2.7 2.0
Current account surplus (percent of GDP) 0.6 5.2 3.6 2.4 2.6 3.6
Real effective exchange rateb
0.0c -0.1 -1.9 -4.5 2.1 -2.6
c The figure relates to the years 1999–2014.
SOURCE: Based on Central Bureau of Statistics, OECD, and IMF.
Table 2.1
Selected indicators of economic activity, 1995–2019
(annual change, percent)
a Weighted average according to each country's GDP. Data for 2019 are based on estimates.
b Adjusted to the Consumer Price Index. An increase means depreciation.
CHAPTER 3: AGGREGATE ACTIVITY: GDP AND EMPLOYMENT
33
3
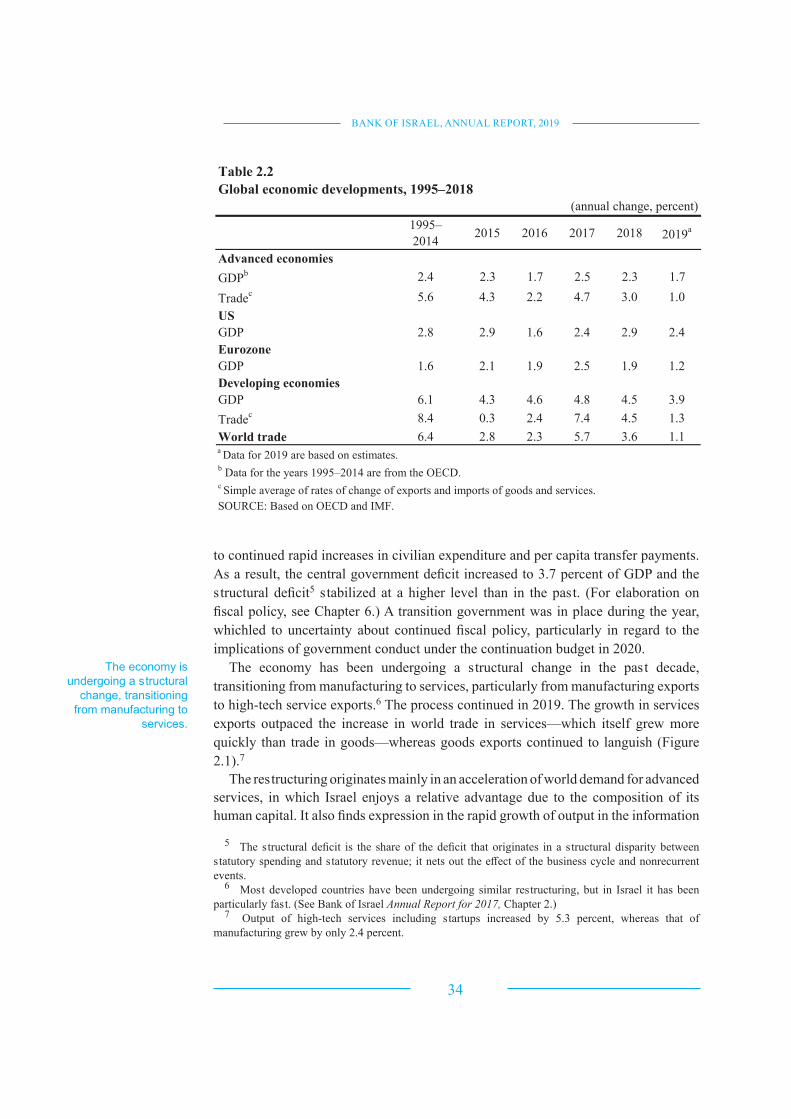
b. Background conditions
3
World trade and growth
slowed in 2019.
BANK OF ISRAEL, ANNUAL REPORT, 2019
Annual Report for 2017,
1995–
20142015 2016 2017 2018 2019
a
Advanced economies
GDPb 2.4 2.3 1.7 2.5 2.3 1.7
Tradec 5.6 4.3 2.2 4.7 3.0 1.0
US
GDP 2.8 2.9 1.6 2.4 2.9 2.4
Eurozone
GDP 1.6 2.1 1.9 2.5 1.9 1.2
Developing economies
GDP 6.1 4.3 4.6 4.8 4.5 3.9
Tradec 8.4 0.3 2.4 7.4 4.5 1.3
World trade 6.4 2.8 2.3 5.7 3.6 1.1aData for 2019 are based on estimates.
b Data for the years 1995–2014 are from the OECD.
cSimple average of rates of change of exports and imports of goods and services.
SOURCE: Based on OECD and IMF.
Table 2.2
Global economic developments, 1995–2018
(annual change, percent)
CHAPTER 3: AGGREGATE ACTIVITY: GDP AND EMPLOYMENT

BANK OF ISRAEL, ANNUAL REPORT, 2019
Box 2.1: The Impact of Anomalous Factors on the 2019 Growth Data
Total Net of anomalous
factors
Net of the following
Gross Domestic Product 3.5 2.6 Intel exports and added value associated with vehicle importsa
Potential GDP 3.6 3.4 Increased stock of capital due to investments in electronic
componentsb and gas and oil infrastructure
Exports excluding diamonds and startups 5.7 3.3 Intel exports
Fixed capital formation (excluding ships and
aircraft)
1.2 3.8 Investment in vehicles, electronic componentsb, and gas and oil
infrastructure
Imports excluding ships, aircraft, diamonds,
and defense imports
4.5 6 Vehicle imports and investment in imported machinery and
equipment in the electronic componentsb, mining and quarrying,
and oil product manufacturing industries
Table 1
Selected Macroeconomic Aggregates, 2019, Total and Net of Anomalous Factors
(Rate of change)
a Intel exports contributed 0.7 percentage points to GDP growth, and added value associated with vehicle imports contributed 0.15 percentage points.
b Intel does not release information about the extent of its investment and imports. We therefore used the total investment of the electronic components industry, which
includes Intel.
CHAPTER 3: AGGREGATE ACTIVITY: GDP AND EMPLOYMENT
1
1

BANK OF ISRAEL, ANNUAL REPORT, 2019
CHAPTER 3: AGGREGATE ACTIVITY: GDP AND EMPLOYMENT
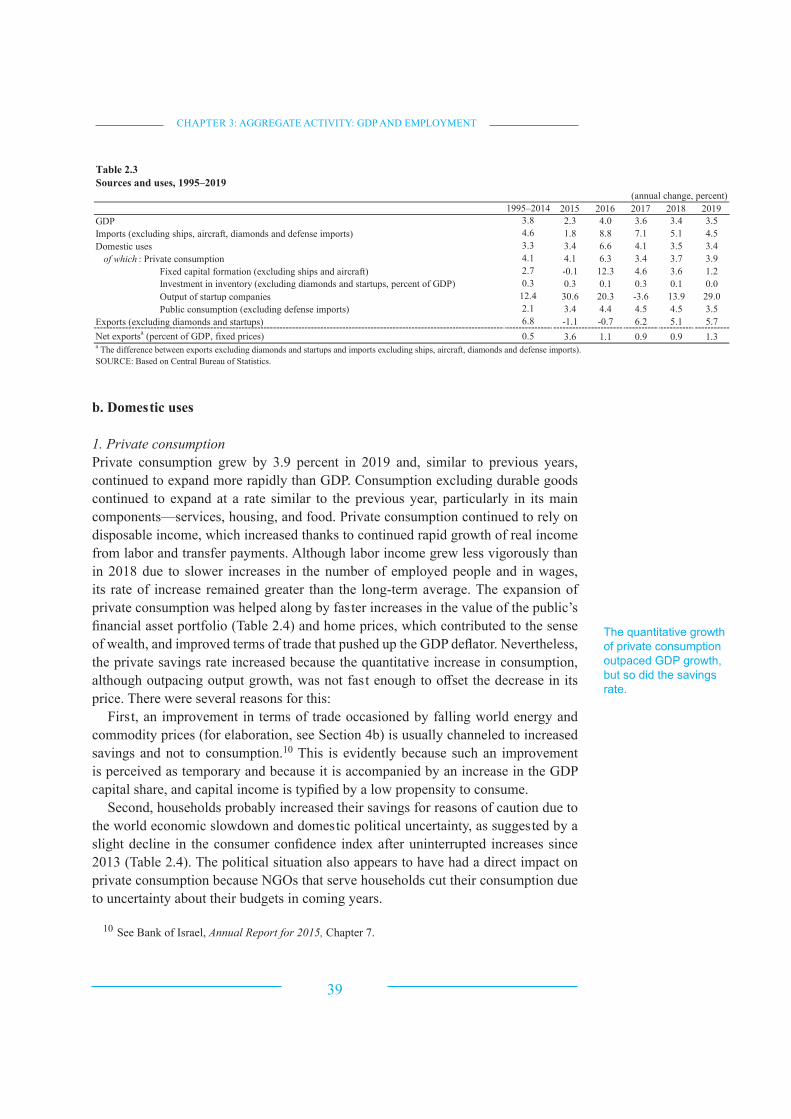
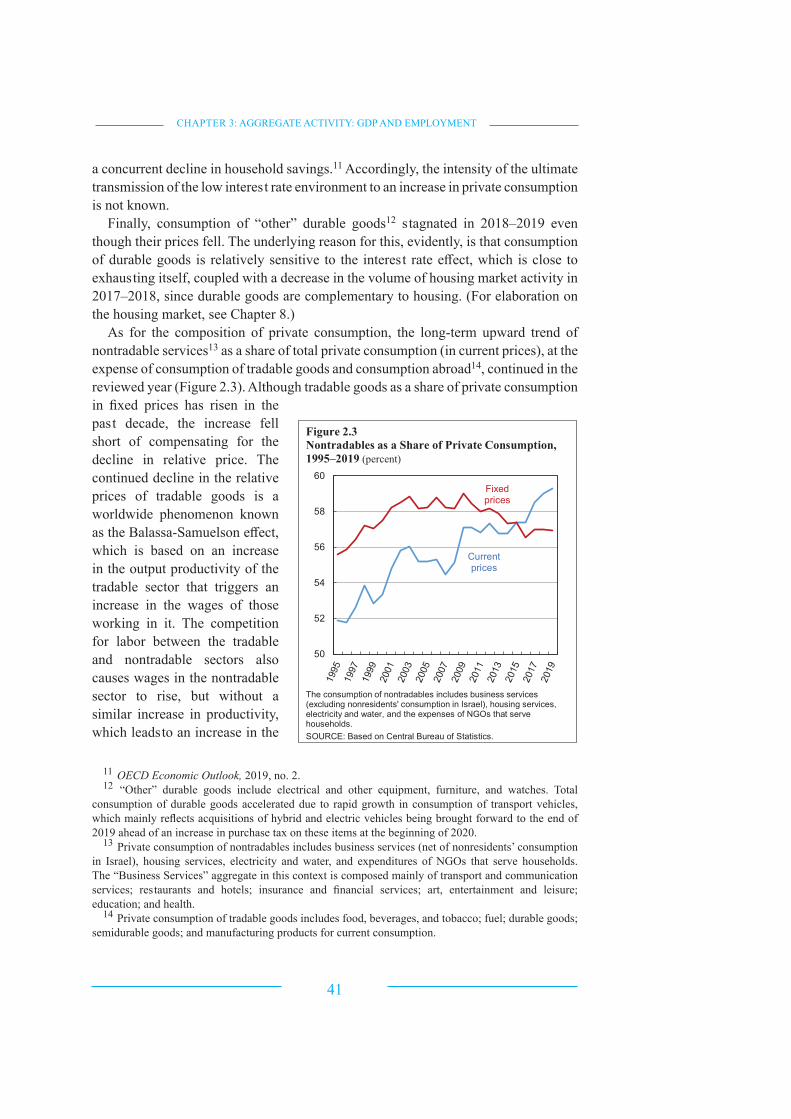
1. Private consumption
Annual Report for 2015,
1995–2014 2015 2016 2017 2018 2019
GDP 3.8 2.3 4.0 3.6 3.4 3.5
Imports (excluding ships, aircraft, diamonds and defense imports) 4.6 1.8 8.8 7.1 5.1 4.5
Domestic uses 3.3 3.4 6.6 4.1 3.5 3.4
of which : Private consumption 4.1 4.1 6.3 3.4 3.7 3.9
Fixed capital formation (excluding ships and aircraft) 2.7 -0.1 12.3 4.6 3.6 1.2
Investment in inventory (excluding diamonds and startups, percent of GDP) 0.3 0.3 0.1 0.3 0.1 0.0
Output of startup companies 12.4 30.6 20.3 -3.6 13.9 29.0
Public consumption (excluding defense imports) 2.1 3.4 4.4 4.5 4.5 3.5
Exports (excluding diamonds and startups) 6.8 -1.1 -0.7 6.2 5.1 5.7
Net exportsa (percent of GDP, fixed prices) 0.5 3.6 1.1 0.9 0.9 1.3
SOURCE: Based on Central Bureau of Statistics.
Table 2.3
Sources and uses, 1995–2019
(annual change, percent)
a The difference between exports excluding diamonds and startups and imports excluding ships, aircraft, diamonds and defense imports).
rate.

BANK OF ISRAEL, ANNUAL REPORT, 2019
1995–2014 2015 2016 2017 2018 2019
Private consumption 4.1 4.1 6.3 3.4 3.7 3.9
of which : Current consumption 3.9 4.4 5.1 4.5 3.5 3.7
Durable goods consumption 5.9 0.3 19.5 -7.5 5.4 6.1
Gross private disposable income from all sources 3.6 4.4 5.9 2.0 7.5 5.1
Credit to households 7.2a
6.5 6.7 5.5 5.1 5.2
of which : Nonhousing credit 3.5a
6.9 6.1 4.8 3.0 2.3
Real 1-year interest rate (government bonds, level) 3.0 -0.5 -0.1 -0.1 -0.8 -0.8
Value of the public's financial assets portfolio 10.5 7.0 1.8 4.4 4.6 5.6
Consumer Confidence Index 3.8b
3.4 1.9 3.7 2.9 -0.4
Fixed capital formation (excluding ships and aircraft) 2.7 -0.1 12.3 4.6 3.6 1.2
Credit to the business sector 4.5a
1.6 3.5 3.8 5.1 4.6
Real 10-year interest rate (government bonds, level) 3.7 0.5 0.4 0.6 0.5 0.0
Purchasing Managers Index (level) 50.5b
50.2 52.3 55.2 53.3 51.3
Change in capital utilization in manufacturing (net balance from the
Bank of Israel Companies' Survey) -2.6 -9.0 -0.1 5.9 5.2 -10.2
Public consumption excluding defense imports 2.1 3.4 4.4 4.5 4.5 3.5
Total taxesc 32.9 31.1 31.0 32.3 30.8 30.3
General government budget deficitc 5.0 1.4 1.9 2.1 4.3 4.5
Change in the structural deficit in the government budgetc -0.9 0.8 1.9 1.2 -0.3
Change in the cyclically adjusted deficitc -1.5 0.6 0.6 2.6 0.9
aThe figure relates to the years 2005–2014.
bThe figure relates to the years 2002–2014.
Table 2.4
Domestic demand: Background conditions and main indicators of its development, 1995–2019
(annual change, percent)
cPercent of GDP.
SOURCE: Based on Central Bureau of Statistics, the "Globes-Smith" Consumer Confidence Survey, the Bank of Israel Companies
Survey, and the Purchasing Managers Indices compiled by Bank Hapoalim and the Purchasing Managers Association.
CHAPTER 3: AGGREGATE ACTIVITY: GDP AND EMPLOYMENT
11
13
11 OECD Economic Outlook,
13

BANK OF ISRAEL, ANNUAL REPORT, 2019
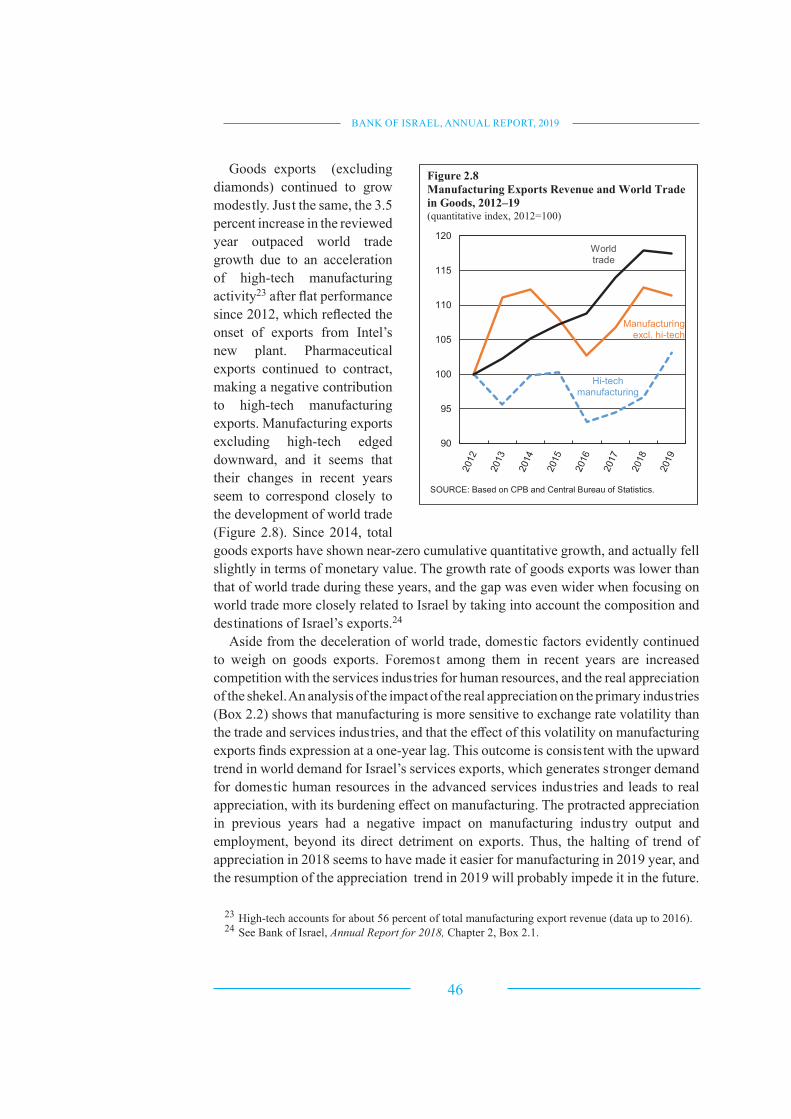
The growth rate of
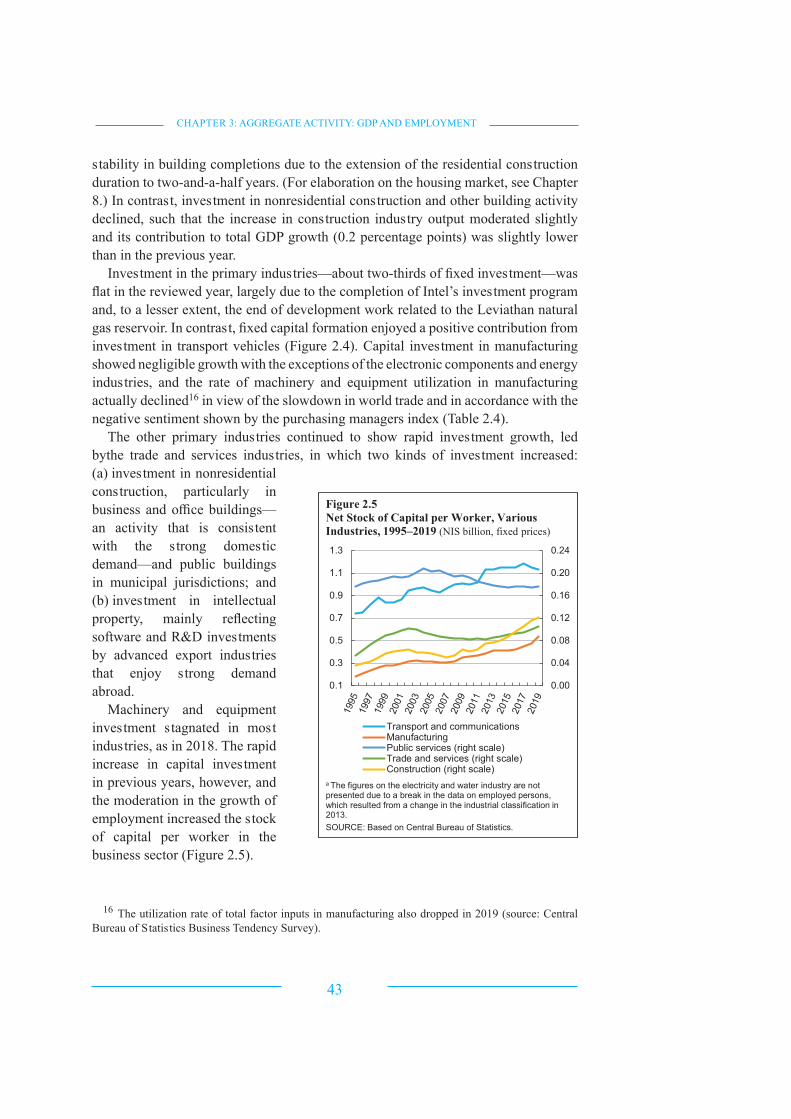
CHAPTER 3: AGGREGATE ACTIVITY: GDP AND EMPLOYMENT
BANK OF ISRAEL, ANNUAL REPORT, 2019
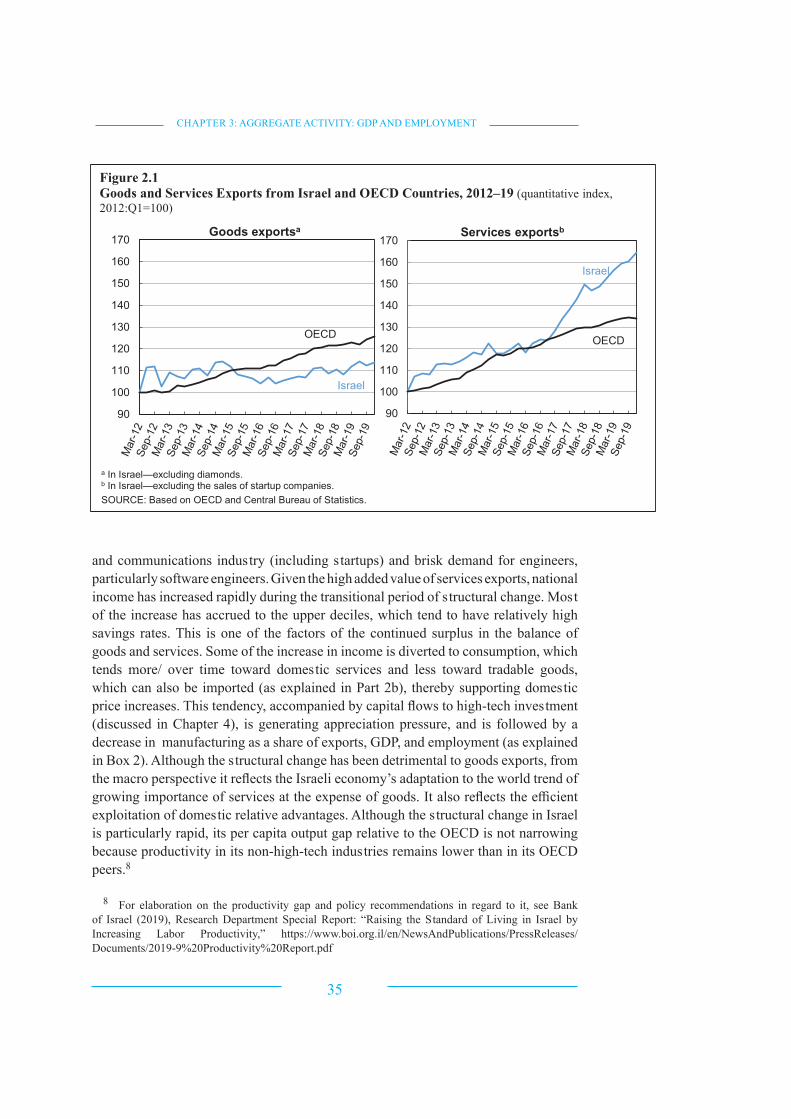
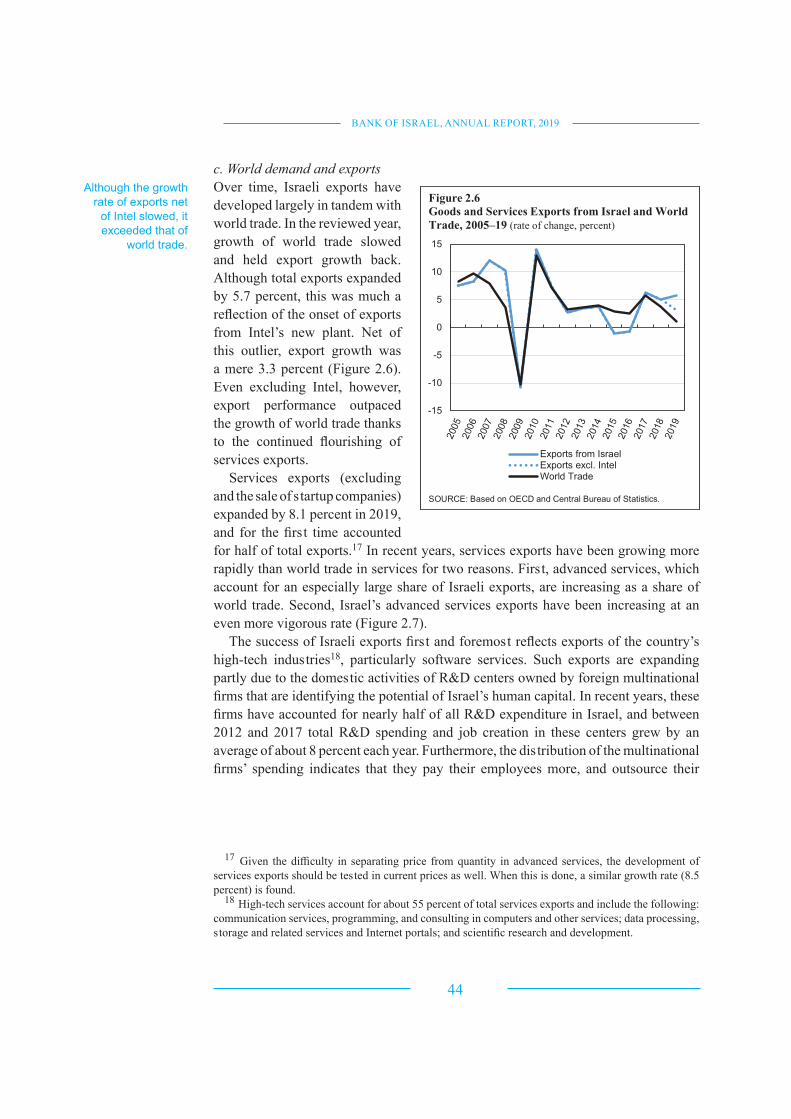
c. World demand and exports
Although the growth
rate of exports net
world trade.

CHAPTER 3: AGGREGATE ACTIVITY: GDP AND EMPLOYMENT
BANK OF ISRAEL, ANNUAL REPORT, 2019
Annual Report for 2018,
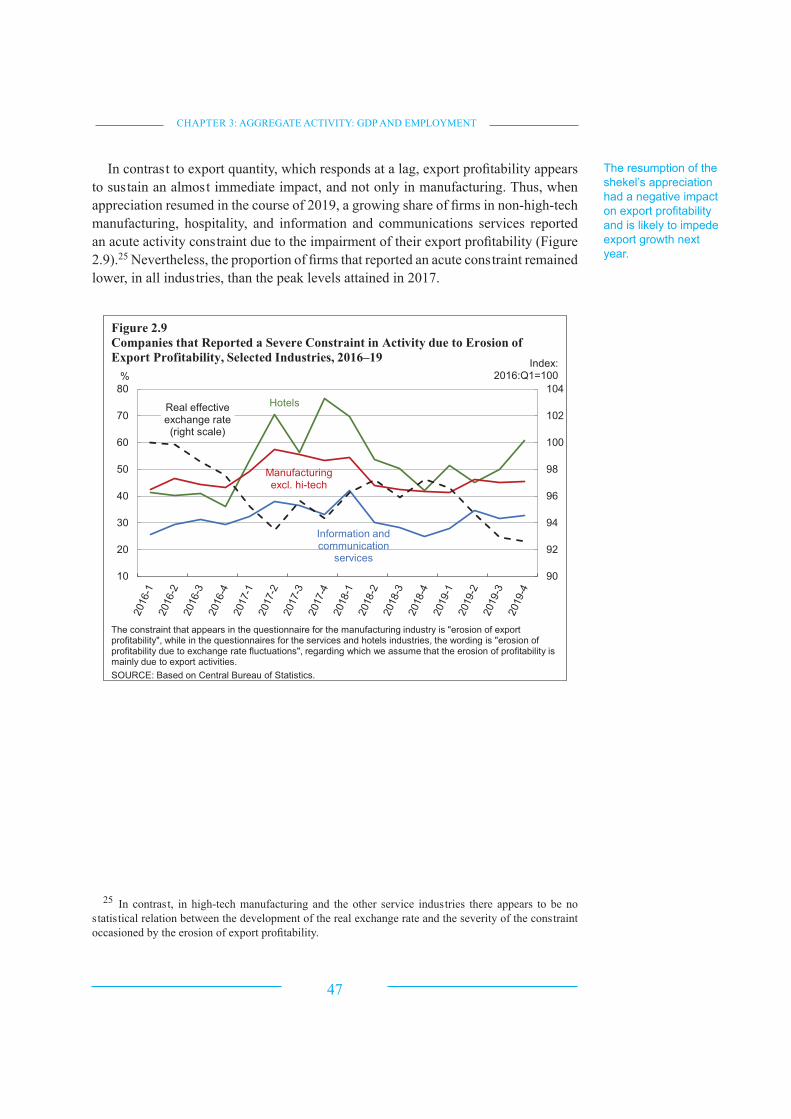
CHAPTER 3: AGGREGATE ACTIVITY: GDP AND EMPLOYMENT
export growth next
year.

BANK OF ISRAEL, ANNUAL REPORT, 2019
1
Annual Report for 2016
3
1
3
CHAPTER 3: AGGREGATE ACTIVITY: GDP AND EMPLOYMENT
Yjt
RERt
WTjt j jt
Yjt
j
t WTjt j
BANK OF ISRAEL, ANNUAL REPORT, 2019
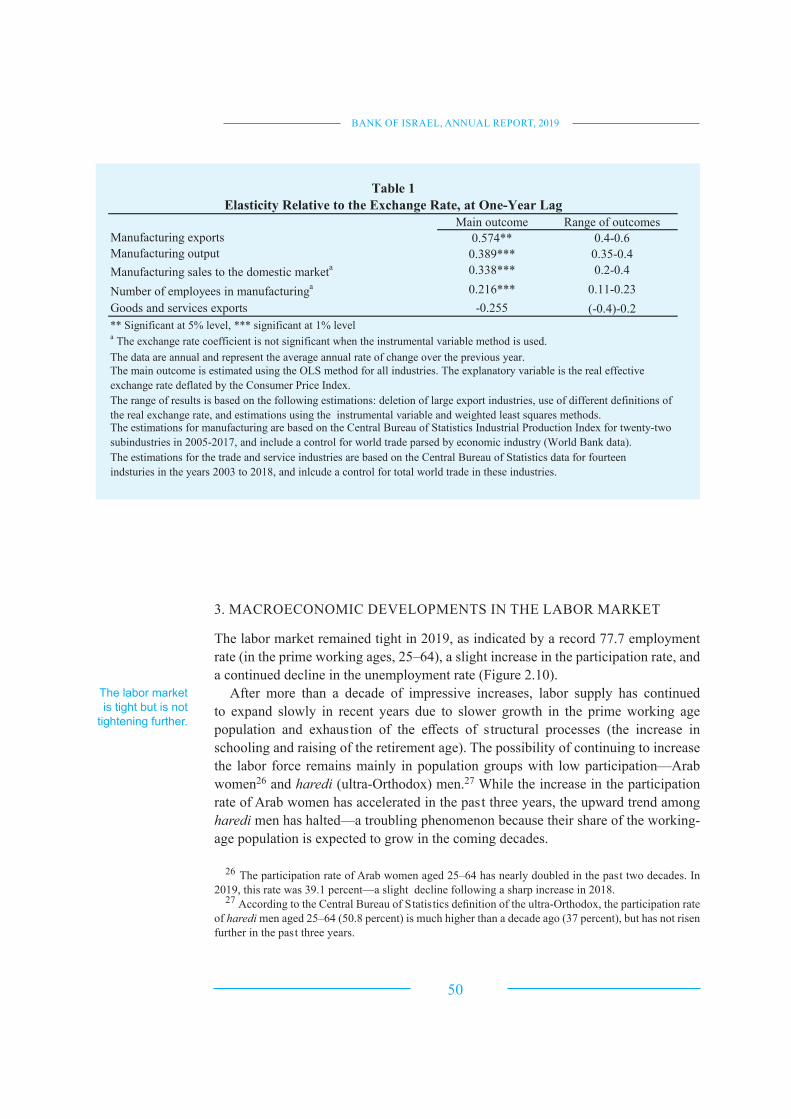
Main outcome Range of outcomes
Manufacturing exports 0.574** 0.4-0.6
Manufacturing output 0.389*** 0.35-0.4
Manufacturing sales to the domestic marketa 0.338*** 0.2-0.4
Number of employees in manufacturinga 0.216*** 0.11-0.23
Goods and services exports -0.255 (-0.4)-0.2
The data are annual and represent the average annual rate of change over the previous year.
** Significant at 5% level, *** significant at 1% levela The exchange rate coefficient is not significant when the instrumental variable method is used.
Table 1
Elasticity Relative to the Exchange Rate, at One-Year Lag
The main outcome is estimated using the OLS method for all industries. The explanatory variable is the real effective
exchange rate deflated by the Consumer Price Index.
The range of results is based on the following estimations: deletion of large export industries, use of different definitions of
the real exchange rate, and estimations using the instrumental variable and weighted least squares methods.The estimations for manufacturing are based on the Central Bureau of Statistics Industrial Production Index for twenty-two
subindustries in 2005-2017, and include a control for world trade parsed by economic industry (World Bank data).
The estimations for the trade and service industries are based on the Central Bureau of Statistics data for fourteen
indsturies in the years 2003 to 2018, and inlcude a control for total world trade in these industries.
haredi
haredi
haredi
is tight but is not
tightening further.
CHAPTER 3: AGGREGATE ACTIVITY: GDP AND EMPLOYMENT
and hours worked per
BANK OF ISRAEL, ANNUAL REPORT, 2019
31
OECD Economic Outlook,31
The growth rate of
wages slowed but
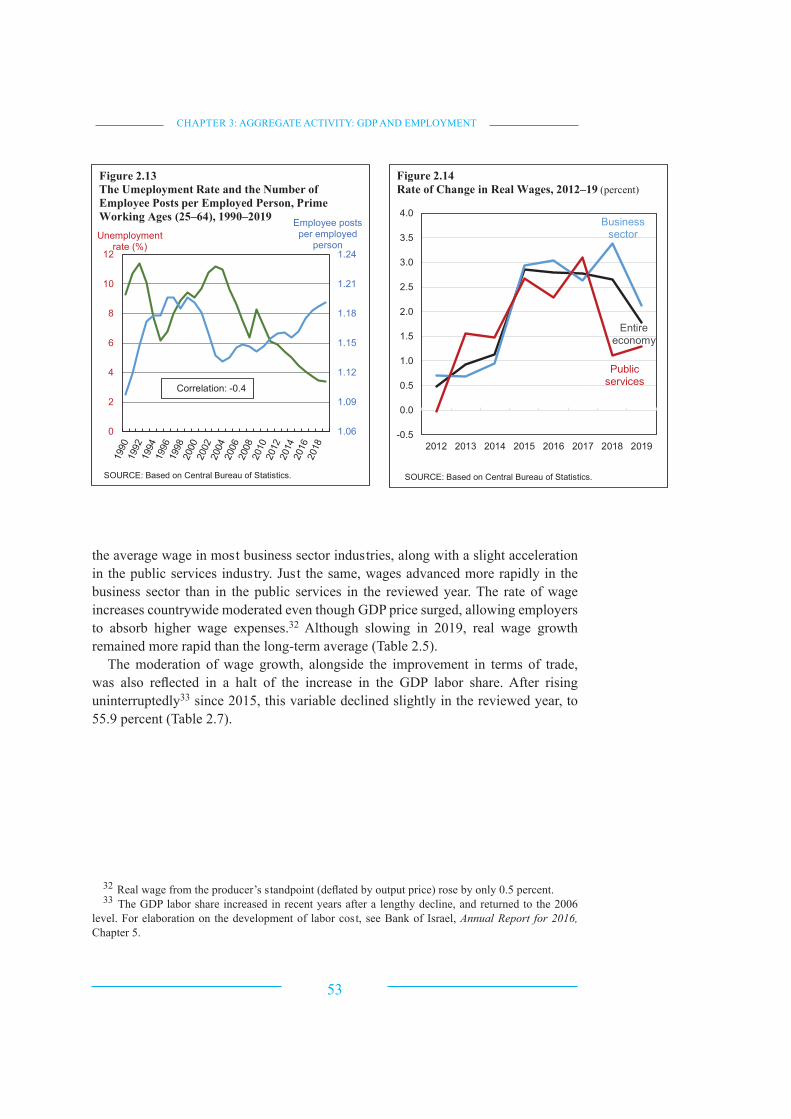
CHAPTER 3: AGGREGATE ACTIVITY: GDP AND EMPLOYMENT
33
33
Annual Report for 2016,

BANK OF ISRAEL, ANNUAL REPORT, 2019
1995–2014 2015 2016 2017 2018 2019
Population in the primary working ages (25–64) 2.3 1.4 1.5 1.5 1.4 1.4
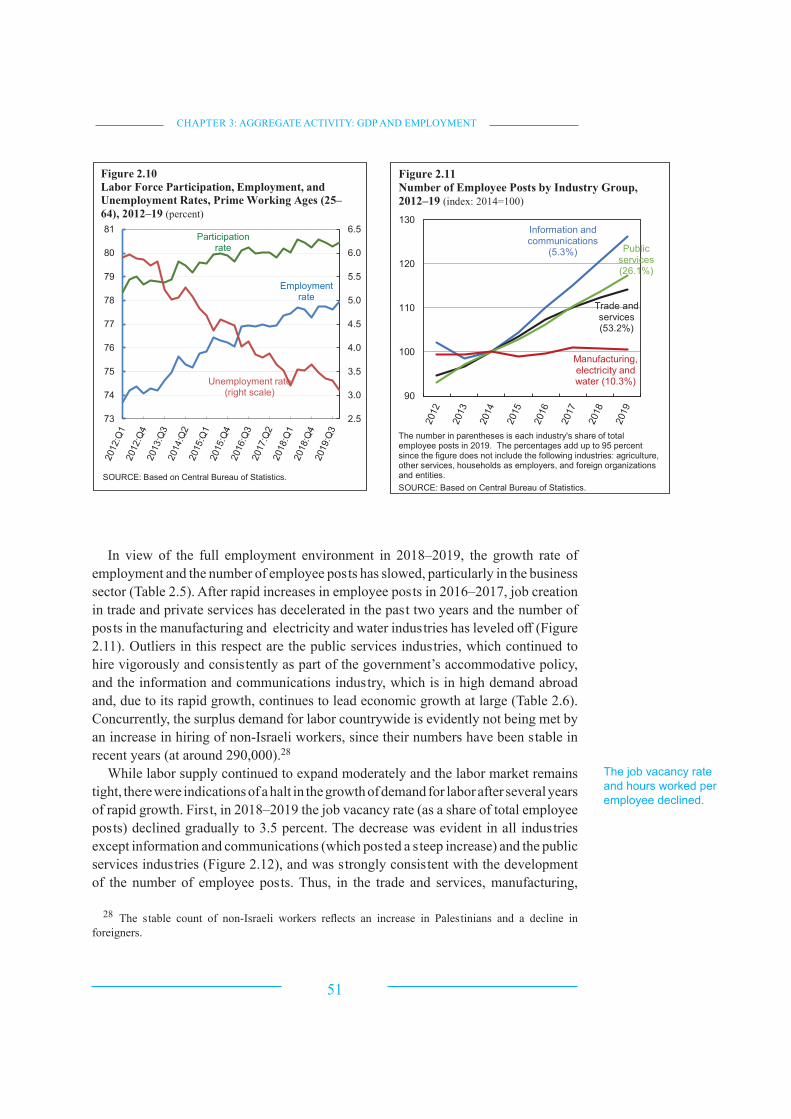
Labor force participation rate in the primary working ages (level) 79.8 79.9 80.0 80.3 80.4
Employment rate in the primary working ages (level) 76.2 76.6 77.1 77.5 77.7
Unemployment rate in the primary working ages (level) 4.5 4.1 3.7 3.5 3.4
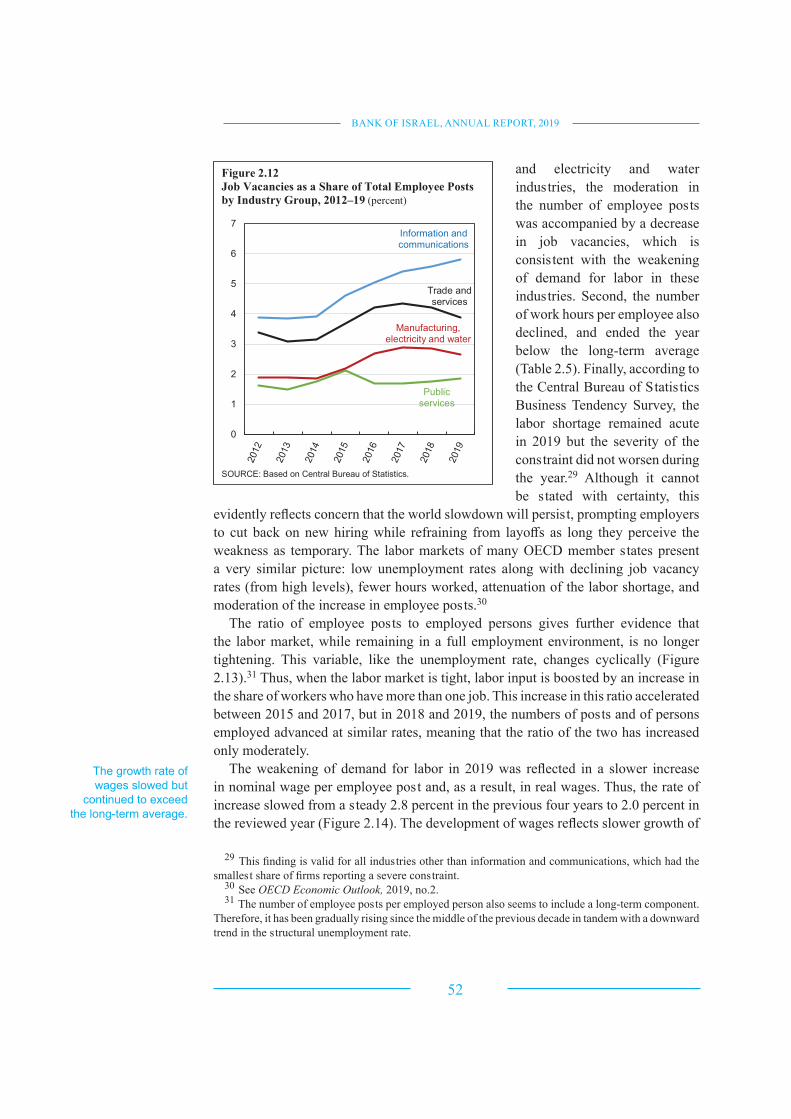
Job vacancy rate (level) 3.2 3.6 3.8 3.7 3.5
Employed persons (Including non-Israelis) 2.7 2.3 2.3 2.4 1.7 1.6
of which : Employed in the business sector 2.6 1.7 2.8 2.2 0.8 1.4
Employed in the public services 2.9 3.5 1.4 2.8 3.5 2.0
Total work hours (including non-Israelis) 2.7 2.3 3.8 2.2 1.5 0.6
of which : Total work hours in the business sector 2.6 2.0 4.2 2.0 1.1 0.7
Total work hours in the public services 3.2 3.2 2.5 2.9 2.9 0.3
Hours per employed person (including non-Israelis) (level) 36.7 36.5 37.0 36.9 36.8 36.4
of which : Hours per employed person in the business sector (level) 42.1 41.9 42.5 42.4 42.5 42.2
Hours per employed person in the public services (level) 24.9 25.4 25.7 25.7 25.6 25.2
Employee posts (including non-Israelis) 2.7 3.0 3.5 3.3 2.5 2.2
of which : Employee posts in the business sector 2.6 2.8 3.6 3.0 2.1 1.6
Employee posts in the public services 3.1 3.2 3.3 3.8 3.4 3.3
Nominal wage per employee posta 4.0 2.2 2.2 3.0 3.5 2.9
Real wage per employee post 0.8 2.9 2.8 2.8 2.7 2.0
SOURCE: Based on Central Bureau of Statistics.
Table 2.5
Principal labor market data, 1995–2019
(annual change, percent)
aBetween 1995 and 1999, the nominal wage was affected by high inflation, and from 2000, the nominal wage has increased at an average annual
rate of 2.5 percent.
Share of
total output
(2019)a
1995–2014 2015 2016 2017 2018 2019
Total 3.9 2.4 3.3 4.1 3.4 3.5
Public services 16.1 2.1 2.4 3.3 2.6 2.6 1.4
Business sector 71.0 4.4 2.4 3.3 4.5 3.6 3.8
Manufacturing, mining and quarrying 12.6 3.3 0.4 -4.8 3.2 1.8 2.4
Trade and hospitality and food services 11.6 6.0 2.4 4.7 5.6 3.2 4.4
Business services 18.0 4.4 2.7 4.6 5.8 3.6 4.7
Construction 6.4 1.7 0.9 6.8 6.7 4.9 3.2
Transport and Storage 3.5 4.9 3.6 5.0 7.0 4.4 2.1
Information and communication 9.7 8.9 8.0 7.7 2.6 6.3 6.9
Agriculture 1.2 2.8 -6.5 5.1 1.5 -2.6 -6.9
Water and Electricity 1.6 3.8 2.0 7.1 -1.5 5.6 0.2
SOURCE: Based on Central Bureau of Statistics.
Table 2.6
Change in output of principal industries, 1995–2019
(annual change, percent)
a In addition to output of public services and business sector product that appear in the table, total output also includes housing services
output.
CHAPTER 3: AGGREGATE ACTIVITY: GDP AND EMPLOYMENT
1995–2014 2015 2016 2017 2018 2019
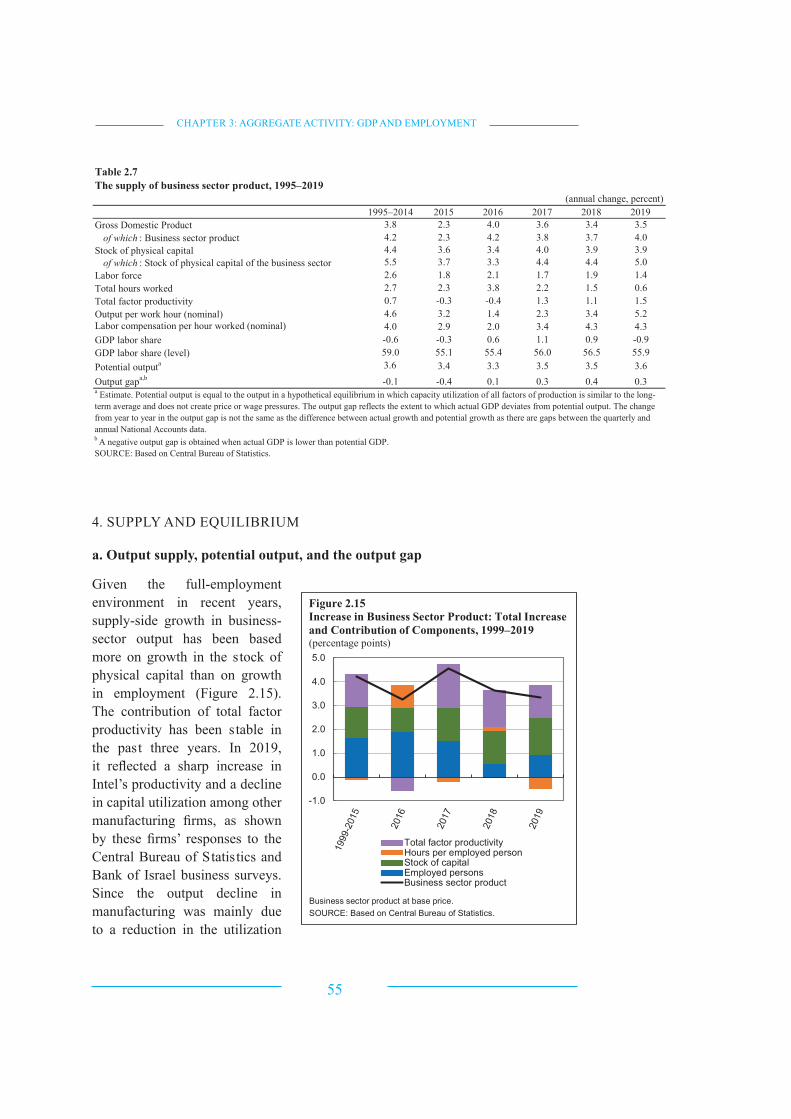
Gross Domestic Product 3.8 2.3 4.0 3.6 3.4 3.5
of which : Business sector product 4.2 2.3 4.2 3.8 3.7 4.0
Stock of physical capital 4.4 3.6 3.4 4.0 3.9 3.9
of which : Stock of physical capital of the business sector 5.5 3.7 3.3 4.4 4.4 5.0
Labor force 2.6 1.8 2.1 1.7 1.9 1.4
Total hours worked 2.7 2.3 3.8 2.2 1.5 0.6
Total factor productivity 0.7 -0.3 -0.4 1.3 1.1 1.5
Output per work hour (nominal) 4.6 3.2 1.4 2.3 3.4 5.2
Labor compensation per hour worked (nominal) 4.0 2.9 2.0 3.4 4.3 4.3
GDP labor share -0.6 -0.3 0.6 1.1 0.9 -0.9
GDP labor share (level) 59.0 55.1 55.4 56.0 56.5 55.9
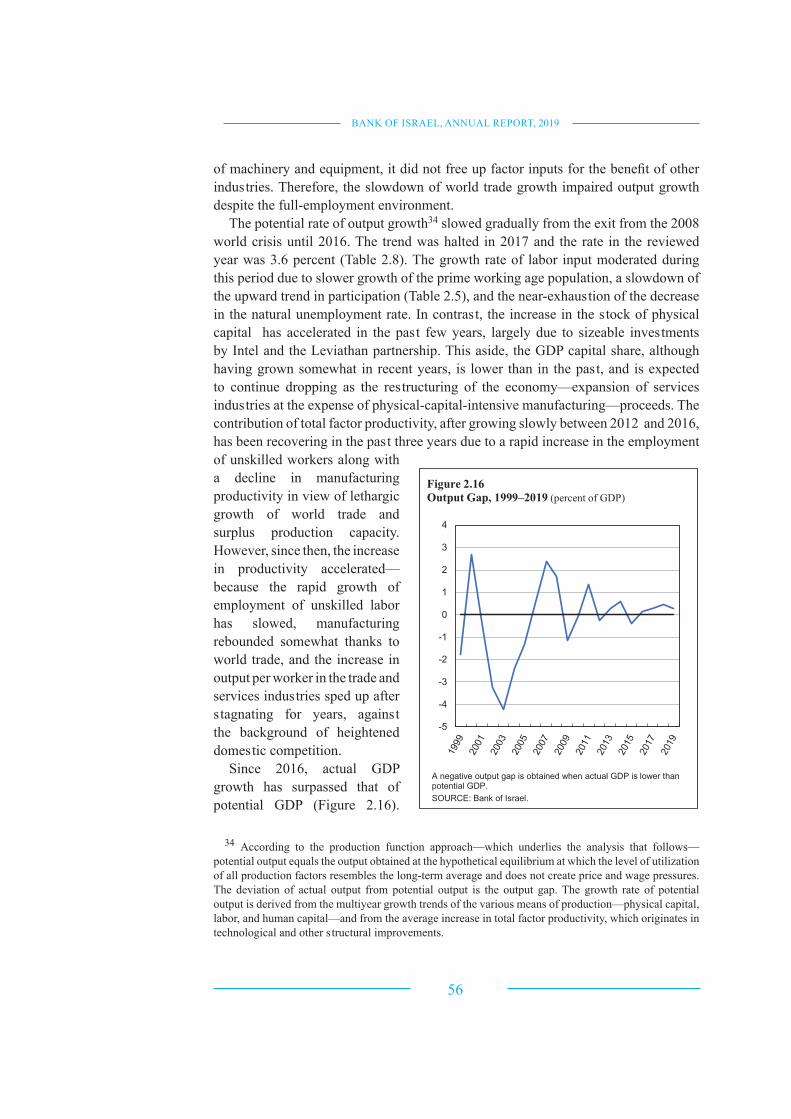
Potential outputa 3.6 3.4 3.3 3.5 3.5 3.6
Output gapa,b
-0.1 -0.4 0.1 0.3 0.4 0.3
SOURCE: Based on Central Bureau of Statistics.
Table 2.7
The supply of business sector product, 1995–2019
(annual change, percent)
a Estimate. Potential output is equal to the output in a hypothetical equilibrium in which capacity utilization of all factors of production is similar to the long-
term average and does not create price or wage pressures. The output gap reflects the extent to which actual GDP deviates from potential output. The change
from year to year in the output gap is not the same as the difference between actual growth and potential growth as there are gaps between the quarterly and
annual National Accounts data.b
A negative output gap is obtained when actual GDP is lower than potential GDP.
BANK OF ISRAEL, ANNUAL REPORT, 2019
CHAPTER 3: AGGREGATE ACTIVITY: GDP AND EMPLOYMENT
b. The current account and the real exchange rate
The output gap has
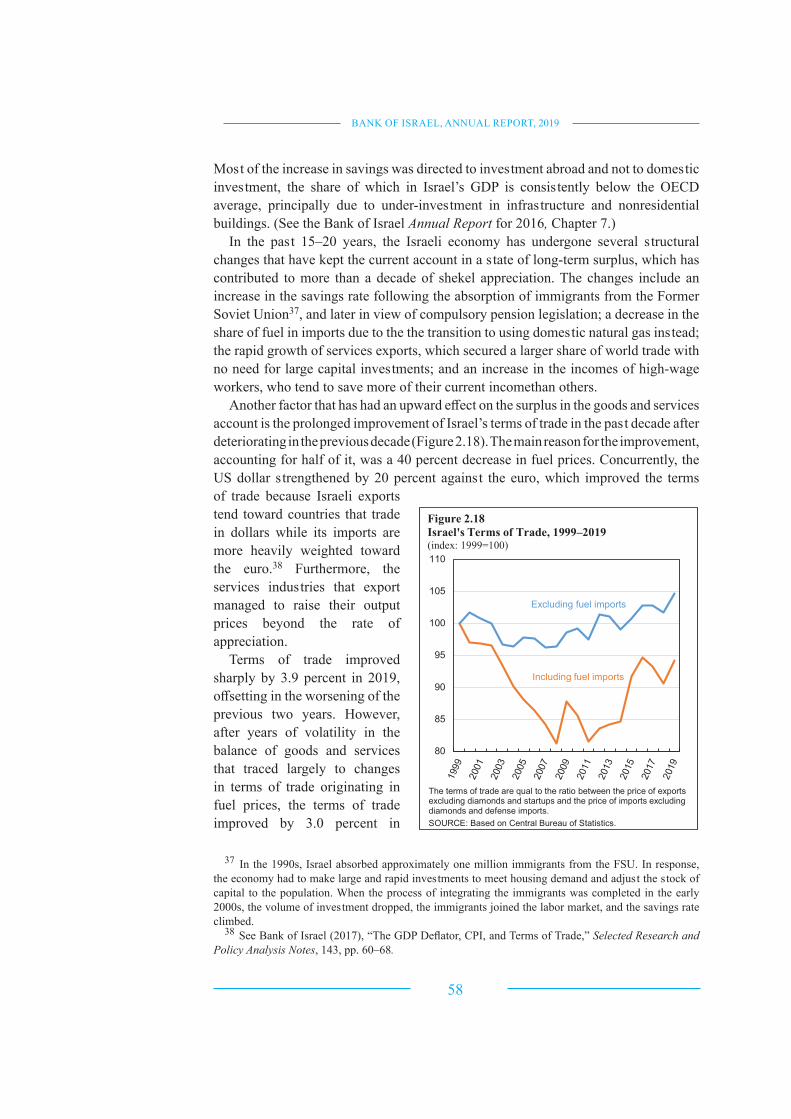
BANK OF ISRAEL, ANNUAL REPORT, 2019
Annual Report ,
Selected Research and
Policy Analysis Notes .
CHAPTER 3: AGGREGATE ACTIVITY: GDP AND EMPLOYMENT
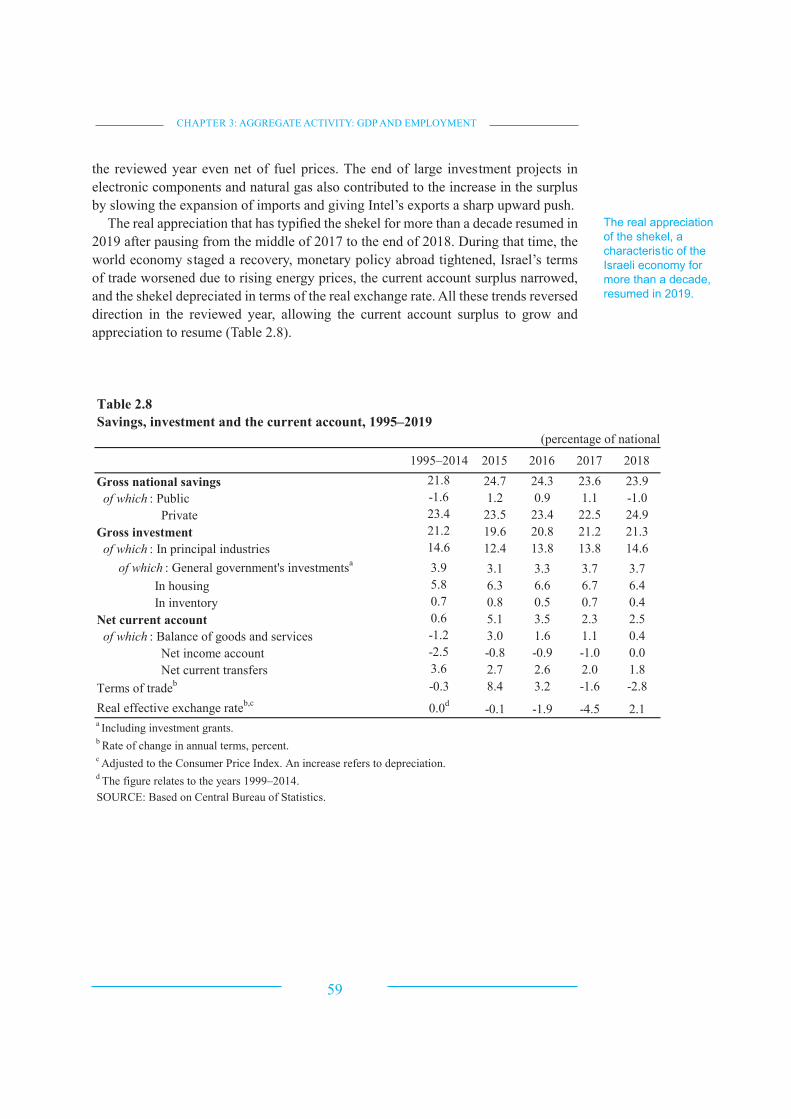
1995–2014 2015 2016 2017 2018
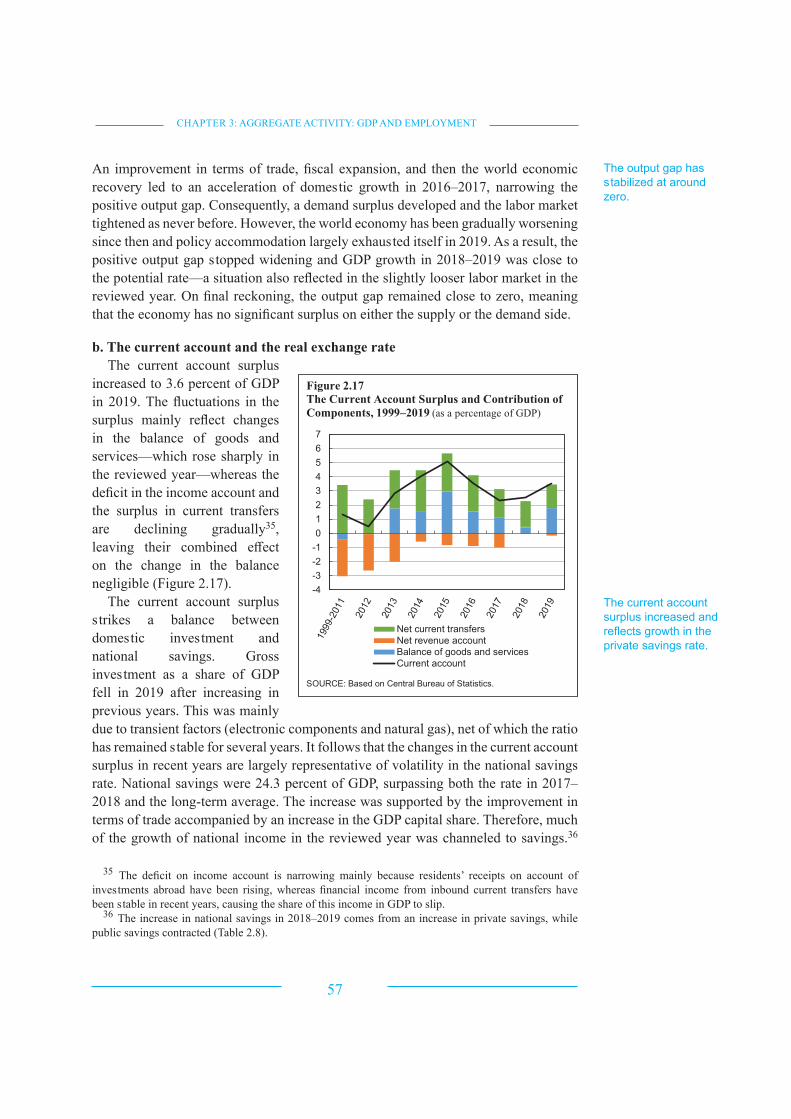
Gross national savings 21.8 24.7 24.3 23.6 23.9
of which : Public -1.6 1.2 0.9 1.1 -1.0
Private 23.4 23.5 23.4 22.5 24.9
Gross investment 21.2 19.6 20.8 21.2 21.3
of which : In principal industries 14.6 12.4 13.8 13.8 14.6
of which : General government's investmentsa
3.9 3.1 3.3 3.7 3.7
In housing 5.8 6.3 6.6 6.7 6.4
In inventory 0.7 0.8 0.5 0.7 0.4
Net current account 0.6 5.1 3.5 2.3 2.5
of which : Balance of goods and services -1.2 3.0 1.6 1.1 0.4
Net income account -2.5 -0.8 -0.9 -1.0 0.0
Net current transfers 3.6 2.7 2.6 2.0 1.8
Terms of tradeb -0.3 8.4 3.2 -1.6 -2.8
Real effective exchange rateb,c
0.0d
-0.1 -1.9 -4.5 2.1aIncluding investment grants.
bRate of change in annual terms, percent.
cAdjusted to the Consumer Price Index. An increase refers to depreciation.
dThe figure relates to the years 1999–2014.
SOURCE: Based on Central Bureau of Statistics.
Table 2.8
Savings, investment and the current account, 1995–2019
(percentage of national income)